
Abstract
Estrogen receptor alpha (ERα) and retinoic acid receptors (RARs) play important and opposite roles in breast cancer growth. While exposure to ERα agonists such as 17β-estradiol (E2) is related to proliferation, RAR agonists such as all-trans retinoic acid (AtRA) induce anti-proliferative effects. Although crosstalk between these pathways has been proposed, the molecular mechanisms underlying this interplay are still not completely unraveled. The aim of this study was to evaluate the effects of AtRA on ERα-mediated signaling in the ERα positive cell lines MCF7/BUS and U2OS-ERα-Luc to investigate some of the possible underlying modes of action. To do so, this study assessed the effects of AtRA on different ERα-related events such as ERα-mediated cell proliferation and gene expression, ERα-coregulator binding and ERα subcellular localization. AtRA-mediated antagonism of E2-induced signaling was observed in the proliferation and gene expression studies. However, AtRA showed no remarkable effects on the E2-driven coregulator binding and subcellular distribution of ERα. Interestingly, in the absence of E2, ERα-mediated gene expression, ERα-coregulator binding and ERα subcellular mobilization were increased upon exposure to micromolar concentrations of AtRA found to inhibit cell proliferation after long-term exposure. Nevertheless, experiments using purified ERα showed that direct binding of AtRA to ERα does not occur. Altogether, our results using MCF7/BUS and U2OS-ERα-Luc cells suggest that AtRA, without being a direct ligand of ERα, can indirectly interfere on basal ERα-coregulator binding and basal ERα subcellular localization in addition to the previously described crosstalk mechanisms such as competition of ERs and RARs for DNA binding sites.
1. Introduction
Nuclear receptors (NRs) are ligand-induced transcription factors that regulate gene expression by binding to specific regions in the genome called hormone responsive elements (HREs) and to coregulators. In the context of breast cancer cell growth, specific NRs such as estrogen receptor alpha (ERα) and retinoic acid receptors alpha, beta and gamma (RARα,β,γ) and their respective ligands play key roles [Citation1]. While estrogens (ERα ligands) such as 17β-estradiol (E2) induce breast cancer cell proliferation, retinoids (RAR ligands) such as all-trans retinoic acid (AtRA) have been demonstrated to often decrease proliferative rates [Citation2]. Previous research showed that the inhibitory effects of retinoids on breast cancer cell growth can vary (different sensitivity) and are driven by multiple molecular mechanisms including the interplay with the ER pathway [Citation3,Citation4]. Thus, crosstalk between ER and RAR pathways has been proposed since the effects of retinoids seem to be highly dependent on the presence of ERs in breast cancer cells [Citation5]. In fact, retinoids have been shown to decrease proliferation of especially ER + breast cancer cells while no remarkable effects are observed for most of the ER- breast cancer cells [Citation5–7]. In addition, inhibition of estradiol-induced ERα activity and the related proliferation induced by RAR agonists has been previously described [Citation8,Citation9]. However, the underlying mechanisms leading to these specific interactive effects between ER and RAR signaling are still not completely understood.
Previous studies showed that ERs and RARs directly interact with each other through their ligand binding domains (LBDs) in a ligand-independent manner [Citation10] and that the AF-2 domain (C-terminus) of the RARα mediates AtRA-driven inhibition of ERα-induced transcription in breast cancer cells [Citation11]. Regarding the classical genomic pathway of ERα in breast cancer cells, Hua et al. suggested a competition for transcriptional activity due to the existence of close/overlapping DNA binding regions for RARs and ERs within the genome [Citation12]. In a later publication, it was shown that under E2-stimulation, RARα appeared within the ERα transcriptional complex, suggesting that RARα acts as a scaffold protein [Citation9]. This study showed thus a double role where unliganded RARα is actually necessary for the expression of different E2-responsive genes while ligand-bound RARα decreases such transcription. In addition, it was found that whereas the presence of both ERα and RARα on the promoter regions of several E2-responsive genes was not affected by retinoid treatment, the recruitment of several coregulators was decreased [Citation9]. Altogether, the capacity of ERα and RARs to form dimers, the proximity of their respective DNA binding regions and the simultaneous presence of both receptors in a transcriptional complex lead to hypothesize that protein–protein interactions between both NRs and other key regulatory elements within the transcription machinery (e.g. coregulators), may play an important role in the observed anti-proliferative effects of retinoids.
The aim of the present study was to assess the effects of retinoids on different ERα-related molecular events to acquire further insights in the possible mechanisms governing the crosstalk between ERα and RARs. Most of the research on the crosstalk between ERα and RARs has been carried out using the ER + MCF7 (wild type) cell line. However, MCF7 is a highly heterogeneous polyclonal cell line and several studies have reported different levels of anti-estrogen sensitivity/resistance depending on the specific MCF7 clone [Citation13,Citation14]. The present study makes use of MCF7/BUS, an MCF7 subline known to be highly E2-responsive [Citation15] in which to our knowledge, interference between retinoid and estrogen signaling has not been investigated so far. To this end, this work thoroughly assessed the effects of the pan-RAR-agonist AtRA on ERα-mediated proliferation and gene expression followed by the measurement of ERα-coregulator binding profiles and ERα subcellular localization, using the MCF7/BUS cell line and U2OS-ERα-Luc (reporter gene) cell line as model systems.
2. Materials and methods
2.1. Chemicals
The ERα agonist 17-β-estradiol (E2) and the pan-RAR-agonist AtRA were obtained from Sigma-Aldrich Chemie B.V. (Zwijndrecht, The Netherlands). Dimethylsulfoxide (DMSO, 99.9%) was purchased from Acros (Geel, Belgium).
2.2. Cell lines and cell culture conditions
The human breast cancer cell line MCF7/BUS (provided by Rikilt Institute, Wageningen, The Netherlands) and the reporter cell line U2OS-ERα-Luc (provided by BDS, Amsterdam, The Netherlands) were used for all cell-based experiments. Cells were maintained in 150 cm2 flasks (Corning, NY) in Dulbecco’s Modified Eagle Medium (DMEM/F12) (Gibco, Bleiswijk, The Netherlands) supplemented with 10% (v/v) fetal bovine serum (PAA, Pasching, Austria), kept in a humidified atmosphere at 37 °C and 5% CO2 and subcultured when they reached 60–80% confluence. For U2OS-ERα-Luc cells, 0.2 mg/ml geneticine (G418) (Gibco, Bleiswijk, The Netherlands) was used as selection agent. In order to deprive the cells from estrogens, all experiments were performed using DMEM/F12 without phenol red (Gibco, Bleiswijk, The Netherlands) supplemented with 5% charcoal-dextran-treated fetal calf serum (Hyclone, Logan, UT) (hereafter exposure medium). For every assay, exposure medium containing retinoids (10−9 to 10−4 M) and/or estradiol (10−13 to 10−6 M) was freshly prepared with a maximum final concentration of 0.2% DMSO (solvent).
2.3. MTT-proliferation studies
MCF7/BUS cells were seeded in flat-transparent 96-well plates (Corning, NY) at a cell density of 2 × 10³ cells per well. Twenty four hours later, cells were exposed to the respective test compounds. After 72 h, exposure medium containing the compounds was renewed. The number of viable cells after six days exposure to the solvent control and the respective chemicals was determined by performing the MTT proliferation assay. To this end, cells were incubated for the last three hours with the tetrazolium dye MTT (3-(4,5-dimethylthiazol-2-yl)-2,5-diphenyltetrazolium bromide) (Sigma-Aldrich Chemie B.V., Zwijndrecht, The Netherlands). Next, medium was removed and 150 µl of DMSO was added to each well. After 15 min, absorbance of the dissolved formazan product was measured at the wavelength of 562 nm with a Microplate Reader SpectraMax M2 (Molecular Devices, Sunnyvale, CA).
2.4. ERα-reporter gene studies
U2OS-ERα-Luc cells were seeded in 96-well white opaque plates (PerkinElmer, Groningen, The Netherlands) at a cell density of 1 × 10⁴ cells/well. On the next day, medium was refreshed. Forty eight hours after seeding, exposure was carried out by adding the test compounds. After 24 h of exposure, cells were washed with half-diluted (water) phosphate-buffered saline (PBS) (Gibco, Bleiswijk, The Netherlands) and lysed with 30 µl of hypotonic low-salt buffer (pH 7.8) containing 10 mM Tris (Sigma-Aldrich, Zwijndrecht, The Netherlands), 2 mM dithiothreitol (DTT, Sigma-Aldrich, St. Louis, MO) and 2 mM 1,2-diaminocyclohexanetetraacetic acid (Sigma-Aldrich, St. Louis, MO). Plates were cooled down and later kept at −80 °C until analysis. In order to determine luciferase activity, plates were thawed and light emission was measured by using a luminometer (Luminoscan Ascent, Thermo Scientific, Waltham, MA) after addition of 100 µl of flashmix (pH 7.8) composed of 20 mM tricine (Sigma-Aldrich, St. Louis, MO), 1.07 mM (MgCO3) 4 Mg(OH)2·5H2O (Aldrich, Milwaukee, WI), 2.6 mM magnesium sulfate (MgSO4, Sigma-Aldrich, St. Louis, MO), 0.1 mM ethylenediaminetetraacetic acid (EDTA_2H2O, Merck, Darmstadt, Germany), 2 mM DTT (Sigma, Zwijndrecht, The Netherlands, #43819), 0.47 mM d-luciferin (Duchefa Biochemie, Haarlem, The Netherlands) and 5 mM adenosine triphosphate (ATP, Duchefa Biochemie, Haarlem, The Netherlands).
2.5. Gene expression (RT-qPCR) studies
MCF7/BUS cells were hormone-deprived for three days prior to exposure. Cells were seeded in six-well plates (Corning, NY) at a cell density of 6 × 10⁵ cells/well. Twenty four hours after seeding, exposure was carried out by adding the test compounds. Next, after 6 h of exposure, cell lysis with RLT Lysis buffer and isolation of RNA by using QIAshredder and RNeasy kits (Qiagen, Venlo, The Netherlands) was carried out according to the manufacturer’s instructions. Quality of RNA was assessed spectrophotometrically by using a Nanodrop (ND-1000 Thermoscientific, Wilmington, DE). Synthesis of cDNA was performed using the QuantiTect Reverse Transcription Kit (Qiagen, Venlo, The Netherlands). Expression of the genes trefoil factor-1 (TFF1), cAMP-dependent protein kinase inhibitor-β (PKIB), ERα and glyceraldehyde 3-phosphate dehydrogenase (GAPDH) (housekeeping gene) was assessed by real-time PCR using Rotor-Gene SYBR® Green Kit (Qiagen, Venlo, The Netherlands) and the Rotor-Gene 6000 cycler (Qiagen, Venlo, The Netherlands) according to the manufacturer’s guidelines. To this end, QuantiTect Primer Assay Hs_TFF1_1_SG, Hs_PKIB_1_SG, Hs_ESR1_1_SG and Hs_GAPDH_1_SG (Qiagen, Venlo, The Netherlands) were utilized.
2.6. Coregulator binding assays
The Microarray Assay for Real-time Coregulator-Nuclear Receptor Interaction (MARCoNI) was used in order to evaluate possible effects of the test compounds on ERα-coregulator binding profiles. Thus, using MARCoNI, the ligand-modulated binding of ERα to 154 binding motifs belonging to more than 60 coregulators was assessed. These assays were performed using purified GST-tagged ERα-LBD (Invitrogen, Carlsbad, CA) or full length ERα obtained from lysates of the cell line MCF7/BUS. In all cases, ligand concentrations with a maximum final solvent concentrations of 2% DMSO in the reaction buffer were applied. Samples containing identical percentage of DMSO without ligand were included as the solvent controls.
For the experiments with recombinant proteins, assay samples were prepared in time-resolved fluorescence resonance energy transfer (TR-FRET) reaction buffer E (Life Technologies, Ltd, Paisley, UK, #PV4420) supplemented with 5 mM DTT and kept on ice before starting the assay. Mixtures containing 7 nM glutathione S-transferase (GST)-tagged human ERα-LBD, 25 nM Alexa 488-conjugated anti-GST (Molecular Probes, Life Technologies, Ltd, Paisley, UK) and the different ligands were used. For the experiments with lysates, post-lysis treatment assays were carried out. In short, cells were hormone-deprived in 150 cm2 flasks for three days and trypsinized. Next, a cell suspension with assay medium was prepared in order to neutralize the remaining trypsin. Cells were washed with PBS by centrifugation and removal of supernatant. Cell pellets were snap-frozen in liquid nitrogen and stored at –80 °C. Next, lysis was performed in TNRL01 lysis buffer using a dismembrator as previously described [Citation16] and samples were stored at –80 °C. Before the initiation of the coregulator binding assay, lysate mixtures were prepared in 2 × NR buffer containing 10 nM rat anti-ERα IgG2a (D547) (Santa Cruz Biotechnology, Santa Cruz, CA), 8 nM goat anti-Rat IgG2a (FITC) (Axxora, San Diego, CA), 2 µM DTT and the test compounds.
For both recombinant protein and cell lysate, experiments were performed by using PamChip® platforms (PamGene International B.V.,’s-Hertogenbosch, The Netherlands) containing four peptide microarrays. Every microarray consists of a three-dimensional porous metal oxide carrier containing 154 spots with different immobilized NR-binding motifs derived from 65 different coregulators. The automated platform PamStation® (PamGene International B.V.,’s-Hertogenbosch, The Netherlands) and EvolveHT software (PamGene International B.V.,’s-Hertogenbosch, The Netherlands) were used applying two (up-down) pumping cycles per minute at 20 °C. Before adding the samples to the Pamchip® arrays, incubation for 20 cycles with 25 µl blocking buffer composed of Tris Buffered saline (Bio-Rad, Veenendaal, The Netherlands, #170–6435) supplemented with 1% BSA (Calbiochem, Merck, Darmstadt, Germany, #126609), 0.01% Tween-20 (Bio-Rad, Veenendaal, The Netherlands, #170-6531) and 0.3% ELK (milk) blocking solution was carried out in order to avoid unspecific binding to the arrays. After removal of blocking buffer, samples were added to the Pamchip® arrays and incubated for 80 pumping cycles. For the cell lysate samples, an additional incubation for 40 cycles was carried out. Finally, unbound receptor was washed away with 25 µl Tris buffered saline and TIFF images were obtained by a charge coupled device (CCD) camera installed in the PamStation®. Image analysis was performed using Bionavigator 6.1 (PamGene International B.V.,’s-Hertogenbosch, The Netherlands). Fluorescence binding arbitrary units (AU) of every spot (coregulator motif) were quantified by subtracting the background signal from the median fluorescent signal.
2.7. Determination of cytoplasmic and nuclear ERα levels
MCF7/BUS cells were hormone deprived for three days prior to exposure to the test compounds for 1 h in 150 cm2 flasks. After exposure, cells were washed with PBS and trypsinized. Next, remaining trypsine was neutralized and removed by adding assay medium, spinning down the cells and discarding the supernatant. The same procedure was carried out for washing cells using PBS. Next, separation of the cell pellet into a nuclear and cytoplasmic fraction was performed by using NE-PER Nuclear and cytoplasmic extraction reagents (ThermoFisher Scientific, Rockford, IL) according to the manufacturer’s instructions. Total protein of the respective fractions was quantified by the Pierce bicinchoninic acid (BCA) protein assay (ThermoFisher Scientific, Rockford, IL) and samples containing 20–35 µg of protein were prepared in laemmli buffer (Bio-Rad, Veenendaal, The Netherlands) supplemented with DTT (50 mM). After denaturation at 90 °C for 5 min, samples were loaded on 10% Mini-PROTEAN TGXTM Precast Protein Gels (Bio-Rad, Veenendaal, The Netherlands). Electrophoresis was run at 200 V for 40 min in Tris/glycine/SDS buffer (Bio-Rad, Veenendaal, The Netherlands). Proteins were transferred to a nitrocellulose membrane (Bio-Rad, Veenendaal, The Netherlands) in Tris/glycine Buffer containing 20% methanol (Biosolve, Valkenwaard, The Netherlands). A reversible Ponceau staining (Sigma, Zwijndrecht, The Netherlands) of the membrane was carried out to assess correct blotting. Subsequently, the membrane was blocked for 1 h with Tris buffered saline (Bio-Rad, Veenendaal, The Netherlands) supplemented with Tween 20 (0.1%) (Bio-Rad, Veenendaal, The Netherlands) and Blotting Grade Blocker (50 g/l) (Bio-Rad, Veenendaal, The Netherlands) to avoid unspecific binding. Next, the membrane was probed with the respective antibodies which were diluted in Tris buffered saline supplemented with Tween 20 (0.1%) and blotting grade blocker (50 g/l) according to the manufacturer’s instructions. First, membranes were incubated with the primary antibodies against ERα (sc-543), cofilin (sc-33779) and Lamin A/C (sc-20681) from Santa Cruz Biotechnologies (Santa Cruz Biotechnology, Santa Cruz, CA); or against H3 Histone (ab176842) and GAPDH (ab128915) from Abcam (Abcam, Cambridge, UK). Membranes were washed with Tris buffered saline supplemented with Tween 20 (0.1%) and subsequently incubated with the secondary goat-anti-rabbit IgG-HRP (sc-2004) antibody (Santa Cruz Biotechnology, Santa Cruz, CA). After final washing, Clarity Western ECL Substrate (Bio-Rad, Veenendaal, The Netherlands) was used for chemiluminescent detection. Semi-quantitative determination of ERα levels was performed by using the softwares Image Studio Lite (LI-COR) and ImageJ (National Institutes of Health, Bethesda, MD) by correcting for the housekeeping proteins Cofilin (cytoplasmic fraction) and H3 Histone (nuclear fraction). Assessment of the purity of the respective pooled fractions (cytoplasmic or nuclear samples) was carried out by using several cytoplasmic (Cofilin and GAPDH) and nuclear (Histone H3 and Lamin A/C) specific markers.
2.8. Data analysis and statistics
Concentration–response curves and their respective EC50s (half maximal effective concentrations of the respective treatments) were obtained by non-linear regression fitting using the software GraphPad Prism 5 (San Diego, CA). For all the experiments, a minimum of three independent experiments (unless otherwise stated) were carried out. For comparison, statistical significances between the different groups (treated/untreated) were evaluated by one-way ANOVA with Dunnet’s or Bonferroni’s tests or by a Student’s t-test. All along this work, data are expressed as percentage/fold induction of the solvent control DMSO (Avg ± SEM) or as modulation indexes (MIs) (for the MARCoNI assay) which represent the log10 transformed ratio of the binding in the presence of the ligand over the binding in the solvent control (DMSO).
3. Results
3.1. Effects of exposure to AtRA on basal and E2-induced MCF7/BUS cell proliferation
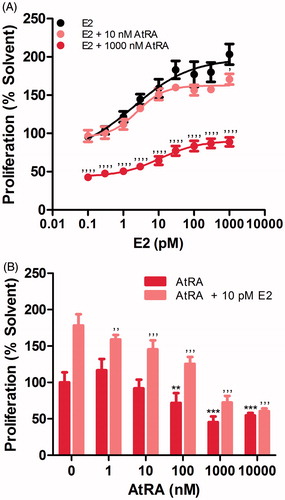
The effects of the pan-agonist AtRA on MCF7/BUS cell proliferation were tested in the presence or absence of E2 (). First, pro-proliferative effects of E2 at concentrations ranging between 0.1 pM and 1000 pM were evaluated. As shown in , proliferation of MCF7/BUS cells increased as the concentration of E2 augmented with an EC50 of 2 pM. Next, effects of different concentrations of AtRA on E2-induced proliferation were assessed. While co-exposure to 10 nM AtRA only decreased the maximum E2-induced response to a limited extent, co-incubation with 1000 nM AtRA remarkably decreased both minimum and maximum responses induced by E2. Further, effects of different concentrations of AtRA in the absence or presence of a fixed concentration of E2 (10 pM) were additionally evaluated. As shown in , exposure to AtRA significantly decreased both basal and E2-induced proliferation in a concentration-dependent manner, the latter already in the nanomolar range. Thus, our proliferation assays show that an AtRA-mediated decrease in proliferation of MCF7/BUS occurs in both the absence and presence of E2.
Figure 1. Effects of AtRA on the E2-induced (A,B) and basal (B) cell proliferation of MCF7/BUS cells. Cell proliferation is expressed relative to the solvent control (0.2% DMSO) set at 100%. Results represent the average ± SEM of at least three independent experiments. For statistical analysis, ANOVA with Bonferroni’s (A) and Dunnett’s (B) multiple comparison tests were performed. ’’’’p < .0001; ’’’p < .001; ’’p < .01 compared to the E2-treated equivalent control. ***p < .001; **p < .01 compared to the solvent control.
3.2. AtRA-mediated effects on ERα activity in the U2OS-ERα-Luc reporter gene cell line
In order to assess whether the AtRA-driven inhibition of MCF7/BUS proliferation could be (partially) attributed to the disruption of ERα-activity, a reporter gene study using the U2OS-ERα-Luc cell line was carried out (). First, effects of E2 (0.3–1000 pM) on ERα-mediated luciferase expression were assessed. As expected, ERα-driven gene expression increased in an E2 concentration-dependent manner () with an EC50 of 16 pM. Upon co-incubation with 10 nM AtRA, the E2-induced maximum response was remarkably reduced (). Effects of a higher concentration of AtRA (1000 nM) generated a decrease in the E2-induced maximum response in the same order of magnitude as 10 nM AtRA (results not shown). Next, the effects on ERα-mediated luciferase expression of different concentrations of AtRA alone and in the presence of a fixed concentration of E2 (10 pM) were tested. As shown in , AtRA clearly decreased the E2-induced ERα-mediated luciferase expression in a concentration-dependent manner. However, in the absence of E2, the effects of AtRA differed when comparing low and high concentrations of the retinoid. In the low nanomolar range, AtRA inhibited ERα-mediated expression of luciferase. However, as the concentrations reached the low micromolar range (1–10 µM), AtRA caused an increase in ERα-mediated luciferase expression. In order to reject the possibility of possible cytotoxic effects as underlying cause, viability of U2OS-ERα-Luc after 24 h-exposure to the highest concentrations of AtRA both in absence/presence of E2 was also tested showing no repercussions in terms of toxicity (results not shown). In summary, our results show that AtRA decreased E2-driven ERα-mediated reporter gene expression at all concentrations tested while it exerted different concentration-related effects under E2-free conditions. Compared to the solvent control, AtRA decreased basal ERα-mediated expression of luciferase at nanomolar concentrations while causing an increase at micromolar (10 µM) concentrations. These results show that in the presence of E2, AtRA counteracts the E2-induced ERα mediated gene expression, a mode of action that can underlie the AtRA-driven reduction of E2-induced cell proliferation. In the absence of E2, different modes of action influencing the ERα-mediated gene expression in opposite ways may be relevant. Whether these AtRA-induced effects are observed for other genes in more relevant cell models than the U2OS cells, and whether they are due to a direct binding to the ERα LBD or induced by more indirect modes of action was subsequently investigated.
Figure 2. Effects of retinoids on E2-induced (A and B) and basal (B) ERα-mediated expression of the ERE-luciferase gene in U2OS-ERα-Luc cells. ERα activity after 24 h-exposure is expressed relative to the solvent control (0.2% DMSO) set at 100%. Results represent the average ± SEM of at least three independent experiments. For statistical analysis, ANOVA with Bonferroni’s (A) and Dunnett’s (B) multiple comparison tests were performed. ’’’’p < .0001; ’’’p < .001 compared to the E2-treated equivalent control. ***p < .001; **p < .01; *p < .05 compared to the solvent control.

3.3. Assessment of the AtRA-driven modulation of the expression of ERα-related genes in MCF7/BUS cells
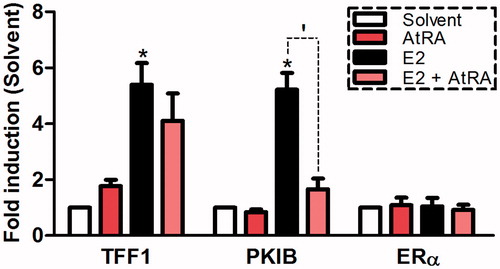
In order to further investigate whether AtRA at micromolar concentrations can also affect expression of ERα-related genes in our biologically relevant cell model (MCF/BUS cells), RT-qPCR studies were carried out. first shows the effects of 10 μM AtRA on the expression of two estrogen-responsive genes known to play important roles in cell proliferation, namely TFF1 and PKIB, both in the presence and absence of E2. As expected, exposure to E2 potently induced the transcription of these genes in MCF7/BUS cells. In addition, co-exposure with the pan-RAR agonist AtRA led to a decrease in the E2-induced expression of both genes which was significant for PKIB. Interestingly, incubation with AtRA alone elicited an increase of the expression of TFF1. On the contrary, in the absence of E2, the PKIB gene was slightly down-regulated upon exposure to AtRA. In addition, analysis of the expression levels of the ERα gene upon exposure to the respective test compounds was carried out in order to assess whether the AtRA-mediated effects on basal and E2-induced ERα activity may be caused by mere up-/down-regulation of the receptor itself. However, our results showed that neither E2 nor AtRA alone or in combination, exerted any remarkable effect on the expression of the ERα gene. In summary, our results clearly show that AtRA at micromolar concentrations is capable of modulating ERα-mediated transcription in a gene-specific manner, however, these effects are probably not mediated via up-regulation or down-regulation of ERα expression levels in MCF7/BUS breast cancer cells.
Figure 3. Effects of AtRA (10 μM) and E2 (10 nM) on the transcription of TFF1, PKIB and ERα in the breast cancer cell line MCF7/BUS. Gene expression after 6 h-exposure is expressed relative (fold-induction) to the solvent control (0.2% DMSO) set at 1. Results represent the average ± SEM (n = 3) of three independent experiments. For statistical analysis, Student’s t-tests were carried out. *p < .05 compared to the solvent control. ‘p < .05 compared to the E2-treated sample.
3.4. Evaluation of the effects of AtRA on ERα coregulator binding profiles
An as yet highly unexplored mode of action for the observed AtRA-driven effects on ERα-mediated gene expression could be at the level of coregulator recruitment. In order to assess whether ERα-coregulator binding in MCF7/BUS cells may be affected by AtRA treatment, we performed the MARCoNI assay using lysates from this cell line. To this end, lysates of MCF7/BUS cells were incubated on the arrays with E2 (10–6 M) and/or AtRA (10−4 M) (post-lysis treatment). (binding signature) and (heat map) display the effects of the tested compounds as MIs, i.e. the compound-induced log-fold change of ERα binding to each individual coregulator-derived peptide. Positive or negative MIs (log-scale) represent increase or decrease in coregulator motif binding in relation to the solvent control DMSO (MI = 0), respectively. As expected, E2 mostly enhanced ERα-coactivator binding. Generally, co-incubation with the general RAR agonist AtRA did not markedly alter the E2-induced response. Strikingly, upon incubation with AtRA alone, ERα-coregulator binding was significantly increased, similarly to E2 although to a lower extent ().
Figure 4. Effects of AtRA on basal and E2-modulated ERα-coregulator binding. Experiments were performed using either MCF7/BUS lysates containing full length ERα (A,B) (three arrays) or purified ERα-LBD-GST (C) (two arrays). Results for all coregulator motifs are expressed as modulation index. For the heat map, hierarchical clustering was carried out. For statistical analysis, Student’s t-tests were carried out. ***p < .001; **p < .01; *p < .05 compared to the solvent control.
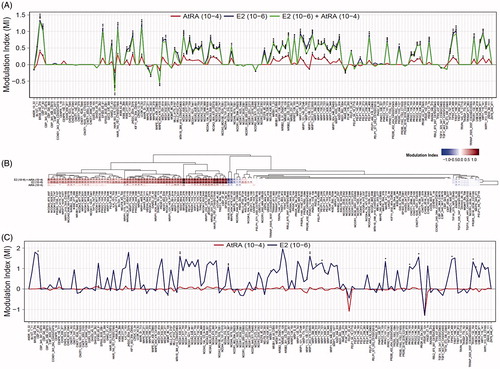
In order to further test whether AtRA may elicit ERα-coregulator interactions by direct binding to this receptor, we performed the experiments using purified recombinant ERα-LBD (). To this end, the ERα-LBD was incubated with AtRA (10−4 M) and the respective coregulator binding profiles were compared to those generated by the solvent and positive control E2 (10−6 M). As expected, incubation of the recombinant ERα-LBD with E2 generated a clear increase in coactivator binding. However, the results upon exposure to AtRA showed no significant changes on the ERα coregulator binding signatures suggesting no direct (ligand–receptor) modulation.
In summary, the results using MCF7/BUS lysates generally showed that incubation with AtRA has no remarkable effect on the E2-induced ERα binding to the coregulator peptides tested. In addition, basal ERα-coregulator binding was shown to be increased upon incubation of the lysate samples with AtRA. However, as shown by the experiments using the purified recombinant ERα-LBD, this modulation does not seem to be driven by direct binding (ligand–receptor) to the truncated ERα. Altogether, the results suggest the possibility of transcriptional complexes containing ERα which can be activated by AtRA via a mode of action different form ligand binding at the ERα-LBD.
3.5. Determination of cytoplasmic and nuclear ERα levels
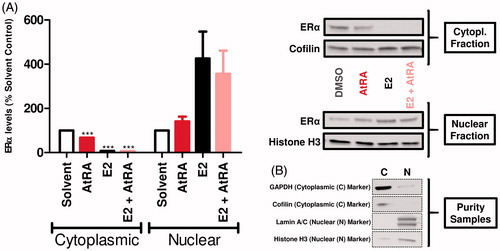
The present study additionally evaluated possible rapid effects of AtRA on the subcellular localization of ERα, both in the absence or in the presence of E2, as a possible mode of action underlying the effects of AtRA on ERα-related cellular events. depicts nuclear and cytoplasmic levels of ERα upon exposure for a 1-h period to the test compounds. Incubation with 100 nM E2 considerably decreased ERα levels in the cytoplasmic fraction while simultaneously increasing the ERα levels in the nuclear compartment. Co-treatment with 10 µM AtRA did not exert any remarkable effect on the E2-driven cytoplasmic decrease of ERα levels (8% and 7%, respectively). On the contrary, nuclear levels were slightly decreased when comparing incubation with E2 alone (426%) to those with E2 in combination with AtRA (356%) although not significantly. Interestingly, in the absence of any estrogenic stimulation, AtRA was also capable of decreasing cytoplasmic ERα levels while increasing their presence in the nucleus although to a lower extent than E2. Thus, the results show that under basal conditions (E2-free conditions), AtRA can affect the subcellular localization of ERα.
Figure 5. Effects of AtRA (1-h exposure) on the MCF7/BUS subcellular localization of ERα in the absence and presence of E2. After fractionation, cytoplasmic and nuclear ERα was determined by western blot. Semi-quantitative determination of ERα levels was carried out correcting by the housekeeping proteins Cofilin (cytoplasmic fraction) and Histone H3 (nuclear fraction). Results are shown as percentage of the solvent control (Avg ± SEM) set at 100 and are representative of at least five independent experiments (A). In addition, the assessment of the purity of the respective fractions was carried out in singular by using Cofilin/GAPDH (cytoplasmic) and Histone H3/Lamin A/C (nuclear) as fractionation controls (B). For statistical analysis, Student’s t-tests were carried out. ***p < .001 compared to the solvent control.
4. Discussion
ERα-mediated gene expression and the consequent proliferation of breast cancer cells have been reported to be affected upon exposure to RAR agonists [Citation5,Citation8,Citation9,Citation17]. However, the underlying molecular mechanisms of this interplay between ER and RAR signaling are not completely understood. The objective of the present study was to investigate the possible effects of the pan-agonist AtRA on ERα signaling by using two cell models that have not been used before for this purpose, being a highly E2-responsive breast cancer MCF7 subline (MCF7/BUS) and the reporter gene cell line U2OS-ERα-Luc. To do so, a battery of assays testing several endpoints related to the ERα pathway such as cell proliferation, gene expression, coregulator binding and sub-cellular localization were carried out. Using these techniques, this study investigated possible modes of action of AtRA on the pro-proliferative ERα signaling, including (a) action as a direct ligand, (b) effects on gene expression, (c) effects on coregulator interactions and (d) effects on ERα subcellular localization.
In accordance with previous studies using different ER + breast cancer cell lines, our work showed that while E2 remarkably increased cell proliferation, AtRA provoked a decrease of both E2-induced and basal MCF7/BUS proliferation after long-term exposure [Citation2,Citation5,Citation9]. These retinoid-mediated inhibitory effects were readily observed at therapeutic doses within the low micromolar range. In order to determine whether the retinoid-mediated effects observed in our proliferation assays may partially occur due to the modulation of ERα-mediated transcription, gene expression studies using both a reporter gene cell line (U2OS-ERα-Luc) and the breast cancer cell line model (MCF7/BUS) were performed. At the molecular level, inhibition of E2-induced ERα activity by RAR agonists such as AtRA has been previously described for other reporter gene cell lines [Citation8], and the effects found are in line with the results observed with U2OS-ERα-Luc cells. Interestingly, under basal conditions (E2-free medium), our study revealed a bimodal effect depending on the concentration tested. While nanomolar concentrations of AtRA were capable of significantly decreasing ERα-mediated gene expression, concentrations in the low micromolar range were capable of stimulating ERα-mediated expression of luciferase. Previous studies have shown that RARs can bind to estrogen responsive elements (EREs) in a way that depends on both the nature of the ERE and the concentrations of receptor and ligand [Citation18]. Thus, the increased ERα-mediated luciferase expression mediated by high concentrations of AtRA might be explained by direct binding of liganded RARs to EREs. In order to acquire further insights in this topic, we performed gene expression studies on MCF7/BUS cells where we assessed the effects of E2 and AtRA on two estrogen responsive genes namely TFF1 and PKIB. These specific genes are known to promote cell proliferation and their expression has been described to be ERα-mediated [Citation19,Citation20]. In addition, previous studies evaluating ERα and RAR binding throughout the genome of MCF7 cells, reported that while TFF1 can present both ERα and RARs in its promotor region, PKIB harbors only ERα. In the present study, we found that AtRA can counteract E2-induced expression of both genes, especially for PKIB. Interestingly, previous studies reported that E2-induced expression of PKIB was not affected by treatment with AtRA [Citation12]. This contradiction may be explained by differences in the concentrations tested (our work used therapeutic concentrations which are in the order of 100× higher) and/or the specific cell model/subline used. PKIB expression is modulated by ERα in cooperation with AP-1 [Citation19]. Since retinoids have been shown to affect AP-1 signaling [Citation21], possible effects on this specific pathway (ERα-AP-1 signaling) cannot be excluded. Next, our results showed that in the absence of E2, AtRA can increase the expression of TFF1, whereas slight down-regulation of the basal PKIB expression was found. Previous studies have shown that retinoids are able to affect ERα-mediated expression of genes sharing binding regions with RARs in the genome [Citation9]. In this study, however, we show that these effects can also be seen on other types of ERα target genes that do not have a binding region for RARs (i.e. PKIB) leading to speculate that mechanisms other than the mere competition for binding to the promotor regions can be involved. One of the alternative modes of action by which AtRA may modulate ERα-related signaling may have been via up-/down-regulation of the receptor itself. However, the present study showed that exposure to both E2 and AtRA has no appreciable effects on the expression levels of ERα. Considering other possibilities, AtRA-mediated effects on ERα signaling may also be caused by other molecular events such as direct (ant)agonistic activity of AtRA on ERα, effects on ERα-coregulator binding, changes on ERα subcellular localization or processes indirectly related to ERα (e.g. modulation of AP-1 or kinase pathways).
In order to investigate some of these other possible mechanisms that might help to explain the retinoid-mediated effects on E2-induced cell proliferation, the present study tested whether the retinoid-driven antagonism of E2-induced ERα-mediated gene expression may be additionally explained by direct ERα (ant-)agonism and/or by a possible disruption of ERα coregulator binding driven by liganded RARs present in the ERα transcriptional complex. To this end, coregulator binding to ERα in either the presence or absence of E2 was tested with a microarray method to assess a wide set of coregulator-NR interactions, using lysates from the MCF7/BUS cell line or isolated recombinant ERα-LBDs. This microarray technology has previously shown to be able to characterize the binding of motifs belonging to more than 60 different coregulators to both ERs and RARs [Citation16,Citation22–24]. In a previous study, ChIP experiments showed that the E2-induced recruitment of certain coregulators such as EP300 or MED1 in the promoter regions of several estrogen responsive genes was hampered by AtRA [Citation9]. The results of the present study using the coregulator binding assay with MCF7/BUS cell lysates indicate however that in general terms, AtRA exerted no remarkable effects on the E2-induced coregulator binding patterns of ERα. The present study did however clearly show that incubation with AtRA alone led to a significant increase on the binding of a subset of coregulator motifs that were also modulated by E2, although the effect of E2 was more pronounced. In a previous study, it was shown that the apo-ERα-mediated gene expression and the consequent pro-proliferative activity could be enhanced by apo-RARα activity [Citation25], however similar effects upon AtRA incubation as seen in the present study, have not been described so far. To test whether the effects of retinoids may be due to mere activation of ERα by an agonist-like ligand–receptor binding, we also assessed ERα-coregulator binding of the purified recombinant ERα LBD and we showed that AtRA is not able to activate ERα by direct interaction with the receptor LBD. Thus, one might speculate that, in a cellular context (lysate), dimers/complexes between apo-ERα and retinoid-related proteins such as RARs or the cellular retinoic acid-binding protein 2 (CRABPII) which also can bind other transcriptional cofactors in a ligand-dependent manner [Citation26,Citation27]) may contribute to the observed AtRA-induced increase in the coregulator binding of ERα. However, the relatively high resemblance (although at different intensities) between the coregulator binding signatures generated by E2 and AtRA may also support a hypothetical E2-independent transactivation of ERα and remains to be studied further in more detail.
Once we found that AtRA can affect ERα-related endpoints such as proliferation, gene expression and ERα coregulator binding profiles, we assessed whether these retinoids can also affect subcellular localization of ERα in the MCF7/BUS cell line. The results of our study showed no effects of AtRA on the E2-induced decrease of cytoplasmic levels of ERα, and only a slight decrease of the E2-induced nuclear ERα localization was observed. Interestingly, AtRA alone was also capable of decreasing ERα cytoplasmic levels while increasing its nuclear localization although these effects appeared at a lower extent than for E2. Previous studies have shown that ERα shows a nucleocytoplasmic shuttle and that exposure to E2 can rapidly decrease and increase cytoplasmic and nuclear ERα levels, respectively [Citation28,Citation29]. However, to the best of our knowledge, this phenomenon has not yet been described upon exposure to retinoids. Although a possible role of cytoplasmic ERα degradation cannot be ruled out, the observed dynamic change (decrease and increase) of ERα levels in cytoplasmic and nuclear compartments might point to induced translocation to or retention in the nucleus as likely underlying causes. Although RARs have been shown to mainly possess nuclear localization [Citation4], cytoplasmic/membrane RAR pools have been described [Citation30,Citation31]. Thus, ERα-RAR interactions may potentially explain the migration to or retention in the nuclear compartment of ERα. Since AtRA is well-known to activate all RAR subtypes and other pathways in breast cancer cells [Citation4], future studies using subtype-selective agonists for RARα, RARβ or RARγ may bring additional insights in determining the participation of the specific RARs in such effects. As potential non-RAR-mediated events leading to the AtRA-induced nucleocytoplasmic shuttle of ERα, a possible transport to the nucleus mediated by the cytoplasmic CRABPII could be also considered. Finally, effects of retinoids on other elements or molecular pathways known to play a role in the subcellular localization of ERα may also explain the observed response. For example, possible retinoid-mediated effects on ERα nucleocytoplasmic transport proteins such as Crm1 [Citation32] or kinase pathways leading to phosphorylation and the consequent nuclear accumulation of ERα [Citation33,Citation34], among others, should be further investigated.
The previously suggested genomic antagonism between ER and RARs [Citation12] via competition for DNA binding regions supports our observed effects on the expression of ERα-related genes. Thus, the formation of a less efficient transcriptional complex on ERE regions would explain both the weak agonistic and strong antagonistic effects on estrogen responsive gene expression upon exposure to AtRA alone or in combination with E2, respectively. The present study additionally showed that exposure to AtRA alone can affect ERα signaling by modulating different molecular events such as ERα-coregulator binding or ERα subcellular distributions. However, its relationship with the observed anti-proliferative effects still remains to be completely elucidated. On the one hand, the consistent depletion of cytoplasmic levels of ERα provoked by AtRA may partially hamper its non-genomic pro-proliferative activities. On the other hand, our results using coregulator binding microarrays point at the simultaneous presence of ERα in transcriptional complexes activated by AtRA. Thus, apart from a possible weak E2-independent activation of ERα, our results lead to additionally hypothesize that a fraction of apo-ERα may be re-directed to specific RAREs leading to both up-regulation of the specific anti-proliferative retinoid responsive genes and the down-regulation of the pro-proliferative estrogen responsive genes. Since previous studies showed that in the presence of E2, apo-RARα is a crucial element (scaffold) within the ERα-ERE transcriptional complex [Citation9], the opposed possibility of apo-ERα acting in a similar way on AtRA-activated RAR-RARE transcriptional complexes must be tested by ChIP studies in the future.
In summary, the present work showed in the cell lines MCF7/BUS and U2OS-ERα-Luc, which have so far not been used to study RAR-ERα crosstalk, that parameters such as cell proliferation, ERα-mediated gene expression, ERα-coregulator binding and ERα subcellular localization can be in one way or another affected upon exposure to AtRA. However, the AtRA-driven antagonism of E2-induced signaling observed in our proliferation and gene expression studies cannot be directly explained via competition (AtRA-E2) for binding to ERα (direct antagonism), effects on E2-mediated ERα-coregulator binding or changes in the subcellular localization of ERα. Strikingly, in the absence of E2, the basal activity of ERα in terms of gene expression, coregulator binding and in relation with its subcellular distribution, was found to be affected when reaching micromolar (pharmacological) concentrations of AtRA. However, as previously mentioned, our results did not point at AtRA as a cognate ligand (agonist/antagonist) for ERα or as inducer/inhibitor of the expression of the ERα gene confirming that other mechanisms are involved in these processes. Future studies should acquire further insights in this indirect modulation of ERα activity which may play a main role in the interplay between estrogen and retinoid signaling and the final effectiveness of retinoids as anticancer agents.
| Abbreviations | ||
| AtRA | = | all-trans retinoic acid |
| E2 | = | 17β-estradiol |
| NR | = | nuclear receptor |
| RAR | = | retinoic acid receptor |
| ER | = | estrogen receptor |
| TFF1 | = | trefoil factor-1 |
| PKIB | = | cAMP-dependent protein kinase inhibitor-β |
| MARCoNI | = | microarray assay for real-time coregulator-nuclear receptor interaction |
Acknowledgements
BioDetection Systems BV (BDS) and Rikilt Institute (Wageningen, The Netherlands) are gratefully acknowledged for supporting the present research by providing the U2OS-ERα-Luc cells and the MCF7/BUS cells, respectively.
Disclosure statement
The authors report no conflicts of interest.
References
- Conzen SD. Minireview: nuclear receptors and breast cancer. Mol Endocrinol. 2008;22:2215–2228.
- Fitzgerald P, Teng M, Chandraratna RA, et al. Retinoic acid receptor alpha expression correlates with retinoid-induced growth inhibition of human breast cancer cells regardless of estrogen receptor status. Cancer Res. 1997;57:2642–2650.
- Garattini E, Bolis M, Garattini SK, et al. Retinoids and breast cancer: from basic studies to the clinic and back again. Cancer Treat Rev. 2014;40:739–749.
- di Masi A, Leboffe L, De Marinis E, et al. Retinoic acid receptors: from molecular mechanisms to cancer therapy. Mol Aspects Med. 2015;41:1–115.
- Liu Y, Lee MO, Wang HG, et al. Retinoic acid receptor beta mediates the growth-inhibitory effect of retinoic acid by promoting apoptosis in human breast cancer cells. Mol Cell Biol. 1996;16:1138–1149.
- Centritto F, Paroni G, Bolis M, et al. Cellular and molecular determinants of all-trans retinoic acid sensitivity in breast cancer: luminal phenotype and RARα expression. EMBO Mol Med. 2015;7:950–972.
- Bolis M, Garattini E, Paroni G, et al. Network-guided modeling allows tumor-type independent prediction of sensitivity to all-trans-retinoic acid. Ann Oncol. 2017;28:611–621.
- Gottardis MM, Lamph WW, Shalinsky DR, et al. The efficacy of 9-cis retinoic acid in experimental models of cancer. Breast Cancer Res Treatment. 1996;38:85–96.
- Ross-Innes CS, Stark R, Holmes K. a, et al. Cooperative interaction between retinoic acid receptor-alpha and estrogen receptor in breast cancer. Genes Dev. 2010;24:171–182.
- Lee SK, Choi HS, Song MR, et al. Estrogen receptor, a common interaction partner for a subset of nuclear receptors. Mol Endocrinol. 1998;12:1184–1192.
- Pratt MAC, Deonarine D, Teixeira C, et al. The AF-2 region of the retinoic acid receptor α mediates retinoic acid inhibition of estrogen receptor function in breast cancer cells. J Biol Chem. 1996;271:20346–20352.
- Hua S, Kittler R, White KP. A genomic mechanism for antagonism between retinoic acid and estrogen signaling in breast cancer. Cell. 2009;137:1259–1271.
- Butler WB, Fontana JA. Responses to retinoic acid of tamoxifen-sensitive and -resistant sublines of human breast cancer cell line MCF-7. Cancer Res. 1992;52:6164LP–6167.
- Coser KR, Wittner BS, Rosenthal NF, et al. Antiestrogen-resistant subclones of MCF-7 human breast cancer cells are derived from a common monoclonal drug-resistant progenitor. Proc Natl Acad Sci USA. 2009;106:14536–14541.
- Rasmussen TH, Nielsen JB. Critical parameters in the MCF-7 cell proliferation bioassay (E-Screen). Biomarkers. 2002;7:322–336.
- Houtman R, de Leeuw R, Rondaij M, et al. Serine-305 phosphorylation modulates estrogen receptor alpha binding to a coregulator peptide array, with potential application in predicting responses to tamoxifen. Mol Cancer Ther. 2012;11:805–816.
- Demirpence E, Demirpence E, Balaguer P, et al. Antiestrogenic effects of all-trans-retinoic acid and 1,25-dihydroxyvitamin D 3 in breast cancer cells occur at the estrogen response element level but through different molecular mechanisms. Cancer Res. 1994;54:1458–1464.
- Klinge CM, Bodenner DL, Desai D, et al. Binding of type II nuclear receptors and estrogen receptor to full and half-site estrogen response elements in vitro. Nucleic Acids Res. 1997;25:1903–1912.
- Dahlman-Wright K, Qiao Y, Jonsson P, et al. Interplay between AP-1 and estrogen receptor α in regulating gene expression and proliferation networks in breast cancer cells. Carcinogenesis. 2012;33:1684–1691.
- Amiry N, Kong X, Muniraj N, et al. Trefoil factor-1 (TFF1) enhances oncogenicity of mammary carcinoma cells. Endocrinology. 2009;150:4473–4483.
- Dedieu S, Lefebvre P. Retinoids interfere with the AP1 signalling pathway in human breast cancer cells. Cell Signal. 2006;18:889–898.
- Wang S, Houtman R, Melchers D, et al. A 155-plex high-throughput in vitro coregulator binding assay for (anti-)estrogenicity testing evaluated with 23 reference compounds. ALTEX. 2013;30:145–157.
- Aarts JMMJG, Wang S, Houtman R, et al. Robust array-based coregulator binding assay predicting ERα-agonist potency and generating binding profiles reflecting ligand structure. Chem Res Toxicol. 2013;26:336–346.
- Miro Estruch I, Melchers D, Houtman R, et al. Characterization of the differential coregulator binding signatures of the retinoic acid receptor subtypes upon (ant)agonist action. Biochim Biophys Acta – Proteins Proteomics. 2017;1865:1195–1206.
- Salazar MD, Ratnam M, Patki M, et al. During hormone depletion or tamoxifen treatment of breast cancer cells the estrogen receptor apoprotein supports cell cycling through the retinoic acid receptor α1 apoprotein. Breast Cancer Res. 2011;13:R18.
- De Barros Rossetto D, Nishimura Kiyomoto E, Brantis de Carvalho CE, et al. New ligands of the cellular retinoic acid-binding protein 2 (CRABP2) suggest a role for this protein in chromatin remodeling. Rev Ciênc Farm Básica Apl. 2014;35:371–377.
- Germain P, Gaudon C, Pogenberg V, et al. Differential action on coregulator interaction defines inverse retinoid agonists and neutral antagonists. Chem Biol. 2009;16:479–489.
- Olsen CM, Meussen-Elholm ETM, Samuelsen M, et al. Effects of the environmental oestrogens bisphenol A, tetrachlorobisphenol A, tetrabromobisphenol A, 4-hydroxybiphenyl and 4,4′-dihydroxybiphenyl on oestrogen receptor binding, cell proliferation and regulation of oestrogen sensitive proteins in the human. Pharmacol Toxicol. 2003;92:180–188.
- Raam S, Richardson GS, Bradley F, et al. Translocation of cytoplasmic estrogen receptors to the nucleus: immunohistochemical demonstration utilizing rabbit antibodies to estrogen receptors of mammary carcinomas. Breast Cancer Res Treat. 1983;3:179–199.
- Han Y-H, Zhou H, Kim J-H, et al. A unique cytoplasmic localization of retinoic acid receptor-gamma and its regulations. J Biol Chem. 2009;284:18503–18514.
- Piskunov A, Rochette-Egly C. A retinoic acid receptor RAR[alpha] pool present in membrane lipid rafts forms complexes with G protein [alpha]Q to activate p38MAPK. Oncogene. 2012;31:3333–3345.
- Nonclercq D, Journé F, Laïos I, et al. Effect of nuclear export inhibition on estrogen receptor regulation in breast cancer cells. J Mol Endocrinol. 2007;39:105–118.
- Marino M, Galluzzo P, Ascenzi P. Estrogen signaling multiple pathways to impact gene transcription. CG. 2006;7:497–508.
- Lu Q, Ebling H, Mittler J, et al. MAP kinase mediates growth factor-induced nuclear translocation of estrogen receptor α. FEBS Lett. 2002;516:1–8.