
Abstract
Hyperuricemia always develops into hyperuricemic nephropathy (HN). The role of microRNA (miR) in HN is less studied. We aimed to discuss the role of miR-199a in HN. The expression of miR-199a and PPARγ in renal tissues of HN rats was detected. The targeting relation between miR-199a and PPARγ was verified. The contents of SCr, UA, BUN, and mALB, renal injury-relevant biomarkers were detected, and the pathological changes of renal tissue and renal interstitial fibrosis were observed by histological staining. After miR-199a and PPARγ knockdown, the contents of SCr, BUN, and mALB and renal interstitial fibrosis were estimated. Collectively, overexpression of miR-199a aggravated the renal injury in HN rats. By contrast, inhibition of miR-199a weakened renal injury, as evidenced by decreased contents of SCr, UA, BUN, and mALB, and mitigated renal interstitial fibrosis. miR-199a targeted PPARγ. Silencing of PPARγ upregulated the levels of downstream genes of β-catenin and the contents of SCr, UA, BUN, and mALB and deteriorated renal interstitial fibrosis. Moreover, the silencing of PPARγ blocked the alleviative effects of miR-199a inhibitor on the renal injury. Overall, miR-199a targets PPARγ and activates the β-catenin pathway, thus aggravating HN, which might provide a future target for the treatment of HN.
Introduction
Uric acid (UA) is the final product of purine metabolism, and two-thirds of UA is excreted through the kidneys, and increased serum UA often contributes to the deterioration of kidney diseases [Citation1,Citation2]. Excessive and less excretion of UA is two predominant causes for the development of hyperuricemia [Citation3]. Recent clinical studies have documented that moderate asymptomatic hyperuricemia (defined as serum UA level ≥356 μmol/L) is a risk factor for cardiovascular diseases and diabetic complications [Citation4]. Moreover, chronic UA injury to the kidney can trigger renal damage and interstitial fibrosis, resulting in hyperuricemic nephrology (HN) [Citation5], which is featured by glomerular hypertension, arteriolosclerosis, and tubulointerstitial fibrosis [Citation6]. Hyperuricemia has become an important public health issue [Citation7]. However, there is no effective method for the treatment of HN, which deserves more attention and investigation. microRNAs (miRs) are naturally transcribed small non-coding RNAs, and accumulating evidence has highlighted a tight connection between kidney diseases and renal fibrosis with miRs [Citation8,Citation9]. Meanwhile, abnormal expression of miRs is also found in hyperuricemia [Citation10], and the concentration of UA is identified to be related to alternation of miR expression [Citation11]. In hyperuricemia, the expression of a variety of miRs and proteins is altered, suggesting a pivotal role of miR in regulating hyperuricemia-related proteins [Citation12,Citation13]. Microarray analysis has identified multiple differentially expressed miRs in a rat model of hepatic fibrosis, including miR-199a-3p [Citation14]. miR-199a-5p was previously reported to involve in fibrotic and inflammatory processes and renal ischemia-reperfusion injury [Citation15,Citation16]. But the expression pattern and role of miR-199a in HN is largely unknown.
Peroxisome proliferator-activated receptor γ (PPARγ), a ligand-dependent transcription factor of nuclear hormone receptor superfamily, is widely expressed in renal tissues and actively monitors endothelial function and inflammation [Citation17,Citation18]. PPARγ activation also has anti-inflammatory and anti-fibrotic effects on a variety of intestinal inflammation-associated diseases [Citation19,Citation20]. Importantly, PPARγ activation improves renal function, alleviates renal damage and fibrosis, and inhibits macrophage infiltration in HN rats [Citation21]. However, it remains unclear how activation of PPARγ is capable of halting or slowing down the progression of HN.
The collaboration between miRNAs and PPARγ has been revealed in atherosclerotic plaque and diabetes mellitus [Citation22,Citation23], but little concern has been paid to the HN pathogenesis. Therefore, this study aimed to expound on the mechanism underlying the interaction between miR-199a and PPARγ in HN. We performed a series of histological and molecular experiments to identify the role and mechanism of miR-199a and PPARγ in HN, with the purpose to provide some novel therapies against HN.
Materials and methods
Ethics statement
This study was ratified by the Clinical Ethical Committee of Tianjin 4th Center Hospital (approval number: TMUaMEC 2017034). All experimental procedures were implemented on the ethical guidelines for the study of experimental pain in conscious animals. Adequate measures were taken to minimize the number of rats used and to ensure minimal pain or discomfort.
Bioinformatics tools
TargetScan (http://www.targetscan.org/vert_72/) was used to query the binding relation between miR-199a and PPARγ with species selected for rats.
HN model establishment
Forty-five male Sprague-Dawley rats (specific-pathogen-free, weighing 200–220 g) purchased from Hunan SJA Laboratory Animal Co., Ltd. (Changsha, Hunan, China) were placed in a temperature- and humidity-controlled environment in 12 h light/dark cycle, with unrestricted movement and free access to water and food. The rats were arbitrarily assigned into the sham group (n = 5) and HN group (n = 40). The rats in the sham group were fed with a normal diet, and the HN rats were fed with adenine (0.1 g/kg) and potassium oxonate (1.5 g/kg) based on a normal diet for 3 weeks.
The rats were fasted for over 10 h. Orbital blood samples were collected, and the rats were euthanized to collect tissues. After disinfection with 75% alcohol, the abdomen of rats was opened layer by layer along the ventral white line using the surgical scissors and forceps which had been disinfected in advance until the abdominal organs were exposed. The abdominal cavity was gently cleaned with normal saline, and the kidney was carefully removed from the abdominal cavity. Some tissues were fixed using paraformaldehyde, some were frozen to make sections, and the other tissues were frozen at −80 °C for further use.
Animal grouping
According to the instructions of Lipofectamine, the ratio of plasmids was (g/L) 1:0.5, and the dosage of plasmids was 200 μg/kg according to the rat body weight. The plasmid DNA was dissolved in phosphate buffer solution and then mixed with the corresponding volume of liposomes, followed by a 30-min standing and the addition with isotonic phosphate buffer solution to a total amount of 500 μL. After the modeling, 40 HN rats were divided into the blank (injected with 500 µL saline), NC inhibitor (injected with miR-199a inhibitor control plasmid), NC mimic (injected with miR-199a mimic control plasmid), si-NC (injected with PPARγ silencing control plasmid), si-PPARγ (injected with PPARγ silencing plasmid), miR-199a inhibitor (injected with miR-199a inhibitor plasmid), miR-199a mimic (injected with miR-199a mimic plasmid), and miR-199a inhibitor + si-PPARγ groups (injected with both miR-199a inhibitor plasmid and PPARγ silencing plasmid). The rats were injected with the above-mixed plasmid-Lipo mixture through the renal artery for a total of four injections (once a week). Seven days after the completion of the injections, the rats were euthanized. The sequence information of the plasmid is shown in .
Table 1. Sequence information of the plasmid.
Dual-luciferase reporter gene assay
HEK-293T cells were plated into 24-well plates and cultured for 24 h. A dual-luciferase reporter gene vector (pGL3) was constructed. The wild-type (wt) and mutant (mut) fragments of PPARγ were inserted into the vector to construct the recombinant plasmids. PPARγ-wt or PPARγ-mut and miR-199 mimic or mimic NC were co-transfected into HEK-293T cells. After 48 h of transfection, the medium was aspirated, and the cells were washed twice with PBS and lysed. The luciferase activity was detected by a dual-luciferase reporter assay system (E1910, Promega, Madison, WI, USA). Each 10 μL cell sample was added with a 50 μL firefly luciferase working solution to detect firefly luciferase activity, and then a 50 μL Renilla luciferase working solution was added to detect the activity of Renilla luciferase. The ratio of firefly luciferase activity to Renilla luciferase activity was taken as the relative luciferase activity.
Reverse transcription-quantitative polymerase chain reaction (RT-qPCR)
Total RNA was extracted from rat kidney cortical and medullary tissues and cells by TRIzol one-step method as the TRIzol kits (15596-026, Invitrogen, Gaithersburg, MD, USA) instructed. A nucleic acid-protein analyzer (biophotometer d30, Eppendorf, Hamburg, Germany) was utilized to measure the optical density (OD) ratio at 260 and 280 nm and RNA concentration. The OD260 nm/OD280 nm ratio was between 1.8 and 2.0, indicating that RNA purity was high. According to a reverse transcription kit (K1621, Fermentas, Maryland, NY, USA), RNA was reversely transcribed into cDNA, and the cDNA was temporarily stored in a −20 °C refrigerator. The primers () were designed and synthesized by GenePharma (Shanghai, China). Real-time PCR (ABI 7500, ABI, Foster City, CA, USA) was used to examine the mRNA expression. The relative expression was calculated by 2−ΔΔCT method with GAPDH/U6 as an internal reference.
Table 2. Primer sequences of RT-qPCR.
Western blot analysis
Total protein of cells was extracted using radioimmunoprecipitation assay buffer (R0010, Solarbio, Beijing, China), and the concentration was tested by a bicinchoninic acid assay kit (20201ES76, YEASEN Biotechnology Co., Ltd., Shanghai, China). The extracted protein was subjected to electrophoresis separation and loaded onto polyvinylidene fluoride membranes. Afterward, the membranes were blocked with 5% bovine serum albumin for 2 h and incubated overnight with primary antibodies against PPARγ (1:100, ab45036, Abcam, Cambridge, UK), active β-catenin (05-665; EMD Millipore, Billerica, MA, USA), snail1 (1:100, ab21637, Abcam), alpha-smooth muscle actin (α-SMA, 1:100, ab5694, Abcam), and β-actin (1:200, ab6276, Abcam) at 4 °C. Following three washes with tris-buffered saline-tween, the membranes underwent a 2-h incubation with secondary HRP-labeled goat anti-rabbit antibody to IgG (1:3000, Abcam). The membranes were developed using chemiluminescence reagent, and ImageJ software (NIH, Bethesda, MD, USA) was utilized for protein quantification. The ratio of the gray value of each protein to the gray value of GAPDH was adopted for quantitative analysis.
Hematoxylin and eosin (HE) staining
Renal tissues (30 g) from HN rats after different plasmid delivery were fixed in 4% paraformaldehyde for 24 h, dehydrated by 80, 90, 100% ethanol and n-butanol, and then immersed in a wax box at 60 °C, embedded, and sliced. The serial sections (5 μm) were heated at 60 °C for 1 h and dewaxed with xylene. After hydration and HE staining (Solarbio), the sections were dehydrated by gradient alcohol, cleared in xylene, and sealed with neutral gum. The pathological changes of the renal tissue were analyzed under an optical microscope (XP-330, Shanghai Bingyu Optical Instrument Co., Ltd., Shanghai, China).
Masson’s staining
The paraffin-embedded sections were dewaxed, washed with tap water, and distilled water in turn. The nuclei were stained with Regaud hematoxylin or Weigert hematoxylin for 5–10 min. Next, the sections were stained with Masson Ponceau acid fuchsin solution for 5–10 min and soaked in 2% glacial acetic acid solution for a while. After that, the sections were treated with 1% molybdophosphoric acid solution for 3–5 min, stained with aniline blue or light green solution for 5 min, and soaked in 0.2% glacial acetic acid solution. Finally, the sections were cleared in 95% alcohol, anhydrous alcohol, and xylene, and sealed using neutral gum.
The collagen positive area was quantified using the ImageJ software. The color threshold (the Hue was set to ‘125–220’; the saturation was ‘0–255’ and the brightness was ‘150–225’) was set up to evaluate the area of collagen fibers stained with blue. The total area was measured under the threshold mode ‘0–205’. Five non-overlapping fields of view were obtained from each pathological section. The blue positive area was divided by the total area for each field, and the average value was calculated for each section.
Biochemical index detection
On the third day (72 h after the injection of 1% streptozotocin) and 4, 8, and 12 weeks after the success of modeling, the tail blood or urine of the rat was collected. When the proteinuria was more than 30 mg/24 h, it showed that the rat model of hyperuricemia was successfully established. Then random blood glucose (RBG) was detected by Roche's blood glucose meter and supporting test strip. Meanwhile, 24-h urine was collected by metabolic cage, and 24-h urinary microalbumin (mALB) was detected by DadeBehring BM II automatic analyzer. The rats were euthanized at the 12th week, and 2 ml of blood was collected from the abdominal aorta for measurement of blood urea nitrogen (BUN), serum creatinine (SCr), and mALB. The UA level in the serum was determined by the UA kit according to the manufacturer’s instructions as previously reported [Citation24].
Statistical analysis
SPSS21.0 (IBM Corp. Armonk, NY, USA) was applied for data analysis. All the data were expressed as mean ± standard deviation (SD). The t-test was applied for comparison between two groups and one-way or two-way analysis of variance (ANOVA), followed by Tukey’s post-hoc test, was used for comparison among multiple groups. p < 0.05 indicated that the difference was statistically significant.
Results
miR-199a is upregulated in HN rats and induces renal injury
HE staining showed that the sham-operated rats had regular glomerular structure, clear morphology, and thickening of capillary dilation and basement membrane. The glomerular size and morphology of HN rats were not significantly different from that of sham-operated rats, but HN rats showed more obvious tubular dilatation, protein tubular type, edema and degeneration, and increased inflammatory cell infiltration; and gouty node crystals were also found in renal tubulointerstitium (). Moreover, we found that the UA level in the serum of rats was significantly increased (), and the above results indicated that HN rats were successfully established.
Figure 1. miR-199a is upregulated in hyperuricemia and induces renal injury. (A) HE staining (×400, scale bar = 50 um). (B) Biochemical analysis of UA in rat serum. (C) miR-199a expression tested by RT-qPCR. (D–F) SCr and UA (D), BUN (E), and mALB (F) contents were determined by biochemical analysis. (G) The degree of renal fibrosis was examined using Masson's staining (200×). NS means not significant. N = 5. *p < 0.05 vs. NC inhibitor group; #p < 0.05 vs. NC mimic group; Results of each group were measured data expressed as mean ± SD. One-way AVONA was used for comparison among groups.
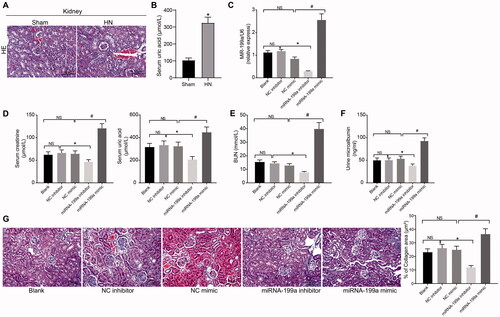
Different plasmids were injected into the HN rats through the renal artery. First of all, we detected the miR-199a expression in the renal tissues by RT-qPCR. miR-199a expression was clearly decreased by miR-199a inhibitor but increased by miR-199a mimic administration (). To detect the effect of miR-199a on renal injury, we detected the contents of SCr, BUN, UA, and mALB. Compared with NC inhibitor treatment, the contents of SCr, UA, BUN, and mALB were reduced by miR-199a inhibitor treatment; these contents following miR-199a mimic delivery were evidently elevated relative to NC mimic (). Masson staining results elicited that renal interstitial fibrosis was notably intensified after miR-199a mimic but relieved following miR-199a inhibitor (). These results suggested that miR-199a inhibitor significantly reduced the levels of serum markers of renal injury, including SCr, UA, BUN, and mALB, and significantly alleviated fibrosis in the kidney.
miR-199a targets PPARγ
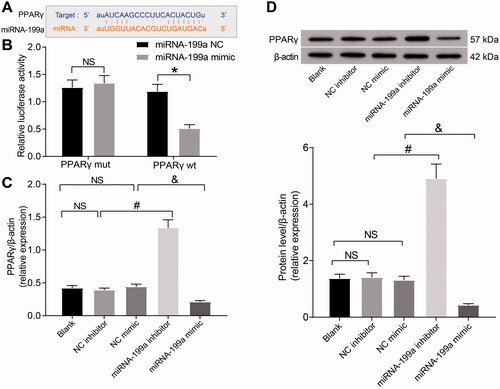
To further explore the regulatory mechanism of miR-199a in the kidney of rats with hyperuricemia, we conducted bioinformatics screening. Through TargetScan, we found a binding site between miR-199a and PPARγ (). We further observed that the target binding site of miR-199a to PPARγ was highly conserved in homo sapiens (). Dual-luciferase analysis indicated that miR-199a mimic reduced PPARγ-wt luciferase activity (). RT-qPCR and Western blot elicited that the PPARγ expression was elevated by miR-199a inhibitor relative to NC inhibitor, and PPARγ expression was lowered in miR-199a mimic-treated rats relative to NC mimic-treated rats (). Briefly, miR-199a targets PPARγ.
Figure 2. miR-199a targets PPARγ. (A) The binding sites between miR-199a and PPARγ were predicted using bioinformatics analysis. (B) The targeting relation between miR-199a and PPARγ was examined using a dual-luciferase assay. (C,D) PPARγ expression was examined by RT-qPCR (C) and Western blot (D). *p < 0.05 vs. miR-199a NC group; #p < 0.05 vs. NC inhibitor group; &p < 0.05 vs. NC mimic group. NS means not significant. Results of each group were measured data expressed as mean ± SD. One-way or two-way AVONA was used for comparison among groups. N = 5.
Knockdown of PPARγ accentuates HN by mediating the β-catenin pathway
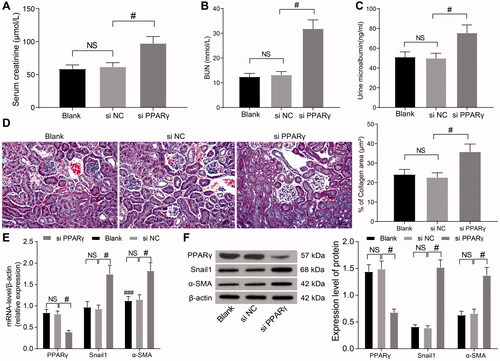
To explore the regulatory mechanism of miR-199a and PPARγ in the renal tissues of HN rats, we delivered si-NC and si-PPARγ into the abdominal cavity of HN rats, and the renal tissues were taken for subsequent detection. The contents of SCr, BUN, and mALB were determined by biochemical analysis. The contents of SCr, BUN, and mALB were clearly elevated following PPARγ knockdown (), suggesting that knockdown of PPARγ increased renal injury in HN. There was obvious renal interstitial fibrosis in the renal tissues of HN rats, while the degree of renal interstitial fibrosis in si-PPARγ-delivered HN rats was obviously aggravated (). Furthermore, PPARγ levels were decreased, while snail1 and α-SMA (relevant gene in the β-catenin signaling) levels were increased notably following si-PPARγ treatment (). In sum, PPARγ-mediated inhibition of β-catenin signaling alleviated renal injury induced by hyperuricemia in rats.
Figure 3. PPARγ-mediated inhibition of β-catenin signaling alleviates HN. (A–C) SCr (A), BUN (B), and mALB (C) contents were determined by biochemical analysis. (D) Images and quantification of Masson's staining. (E,F) Levels of PPARγ and β-catenin target genes were examined by RT-qPCR (E) and WB (F). #p < 0.05 vs. si-NC group. NS means not significant. Results of each group were measured data expressed as mean ± SD. One-way or two-way AVONA was used for comparison among groups. N = 5.
miR-199a induces HN by inhibiting PPARγ and inducing activation of β-catenin signaling
To identify the mechanism of miR-199a and PPARγ-mediated β-catenin signaling in HN, the rats were injected with NC inhibitor + si-NC, miR-199a inhibitor + si-NC, NC inhibitor + si-PPARγ, and miR-199a inhibitor + si-PPARγ groups (n = 5). We detected the expression of active β-catenin and β-catenin downstream genes (snail1 and α-SMA). The levels of active β-catenin, snail1, and α-SMA in the + si-NC group were lowered, while the expression of PPARγ was enhanced after the miR-199a inhibitor. However, the levels of active β-catenin, snail1, and α-SMA were increased, where the expression of PPARγ was downregulated after si-PPARγ in comparison with NC inhibitor + si-NC treatment. The β-catenin signaling was activated, while the expression of PPARγ was impaired after miR-199a inhibitor + si-PPARγ relative to miR-199a inhibitor + si-NC ().
Figure 4. miR-199a can target the PPARγ/β-catenin pathway and promote HN. (A,B) Levels of PPARγ, active β-catenin, and β-catenin target genes were examined by RT-qPCR (A) and Western blot (B). (C–E) SCr and UC (C), BUN (D), and mALB (E) contents were determined by biochemical analysis. (F) Images and quantification of Masson's staining. *p < 0.05 vs. NC inhibitor + si-NC group; #p < 0.05 vs. miR-199a inhibitor + si-NC group. Results of each group were measured data expressed as mean ± SD. One-way or two-way AVONA was used for comparison among groups. N = 5.
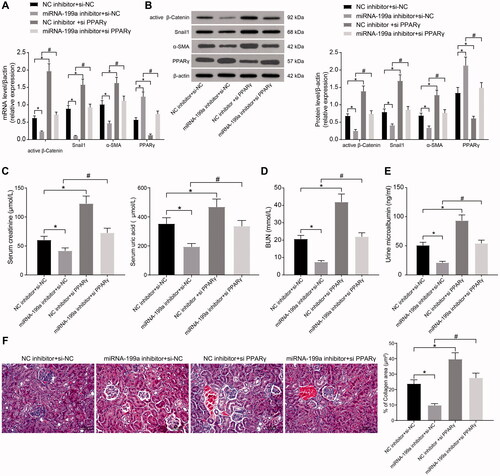
Compared with the NC inhibitor + si-NC group, the contents of SCr, UA, BUN, and mALB were decreased by miR-199a inhibitor, and renal interstitial fibrosis was significantly alleviated. By contrast, si-PPARγ led to the opposite results. Compared with miR-199a inhibitor + si-NC treatment, the contents of SCr, UA, BUN, and mALB were increased in the serum of rats who received miR-199a inhibitor + si-PPARγ treatment, and the renal interstitial fibrosis was significantly aggravated (). In conclusion, miR-199a can target the PPARγ/β-catenin pathway and promote HN.
Discussion
A meta-analysis involving 13 observational studies and 190,718 patients has highlighted that hyperuricemia is strongly associated with kidney diseases and gout [Citation25]. The detrimental effects of hyperuricemia and its complications are so severe, which calls for more attention and studies in the understanding of mechanisms of action and clinical management. This study elucidated the mechanism of miR-199a and PPARγ in HN through a series of histological and molecular experiments and concluded that miR-199a downregulation alleviated renal dysfunction and interstitial fibrosis in HN rats via the PPARγ/β-catenin pathway.
Various miRs are differentially expressed in hyperuricemia, indicating an important implication of miR in hyperuricemia [Citation10,Citation12]. In this study, we found miR-199a upregulation in hyperuricemic rats. A former microarray analysis discovers miR-199a-3p is differentially expressed in a rat model of hepatic fibrosis [Citation14]. miR-199a-5p is previously reported to be involved in fibrotic and inflammatory processes and renal injury [Citation15,Citation16]. But the expression pattern and role of miR-199a in HN is largely unknown. Renal insufficiency is confirmed by elevated serum SCr, BUN, urinary total protein, and mALB levels [Citation26]. In this study, to detect the effect of miR-199a on kidneys, different plasmids of miR-199a were injected into the HN rats to examine the contents of SCr, UA, BUN, and mALB using biochemical analysis. It was found that miR-199a inhibitor decreased the contents of SCr, UA, BUN, and mALB in serum of rats, while miR-199a mimic evidently elevated the levels of these factors relative to their counterparts. Moreover, renal fibrosis is a predominant manifestation of hyperuricemia-induced renal injury [Citation27]. Additionally, our Masson’s staining results elicited that renal interstitial fibrosis was notably intensified by miR-199a mimic, but relieved by miR-199a inhibitor in HN rats. These results suggested that miR-199a induced renal injury in HN rats.
To further explore the regulatory mechanism of miR-199a in the kidney of rats with hyperuricemia, we conducted bioinformatics screening. miR-199a was found to target PPARγ. Consistently, PPARγ expression is reduced in HK-2 cells under the stimulation of UA [Citation28]. To identify the regulatory mechanism of miR-199a and PPARγ in HN, si-NC or si-PPARγ was delivered into HN rats through the renal artery. As our results unveiled, the contents of SCr, BUN, and mALB were clearly elevated after silencing of PPARγ. In line with this finding, when PPARγ is inhibited, serum levels of SCr and BUN are elevated, and renal function is damaged in rats with chronic nephropathy [Citation29]. In the present study, there was obvious renal interstitial fibrosis in the renal tissue of HN rats, while the degree of renal interstitial fibrosis was clearly aggravated by silencing of PPARγ. PPARγ activation inhibits hepatic fibrosis along with suppressed α-SMA content [Citation30]. Furthermore, the levels of snail1 and α-SMA were increased notably following the silencing of PPARγ. In renal interstitium, α-SMA is associated with renal dysfunction and HN progression under pathological conditions [Citation31]. The upregulation of snail1 and α-SMA reveals the renal fibrosis of HN kidneys [Citation3]. It has been proposed that PPARγ activation lowers α-SMA expression by reducing hepatic stellate cell proliferation during hepatic fibrogenesis [Citation32]. Similarly, treatment with PPARγ agonist RGTZ improves renal function, decreases urine mALB levels, and inhibits interstitial fibrosis in kidney tissue of HN rats [Citation21]. In sum, PPARγ alleviated renal injury induced by hyperuricemia in rats.
PPARγ activation has been suggested to promote β-catenin degradation and directly interact with β-catenin [Citation33]. β-catenin is found to be enhanced after hyperuricemic injury [Citation34], and the activated Wnt/β-catenin pathway precedes renal dysfunction [Citation35]. The decrease of β-catenin expression in the renal interstitium of diabetic nephropathy rats is related to the delay of renal interstitial fibrosis [Citation36]. Notably, in high-glucose conditions, siRNA-mediated PPARγ activates β-catenin and its target genes snail1 and α-SMA in podocytes [Citation37]. Upregulated PPAR-γ markedly blocks the Wnt/β-catenin pathway, leading to significant decreases in BUN and SCr levels, thus abating nephrotoxicity in rats [Citation38]. In conclusion, miR-199a can target the PPARγ/β-catenin pathway and promote HN.
In conclusion, our results supported that miR-199a can target PPARγ and activate the β-catenin pathway, thus aggravating the renal injury in hyperuricemia. The pathological mechanism is complex, which is not only correlated to the SCr, UA, BUN, and mALB contents and renal fibrosis, but also correlated with inflammation and oxidative stress. More studies should be carried out to validate our results and investigate the role of miR-199a/PPARγ in other related mechanisms of HN. In addition, the increase in mALB level is mainly due to glomerular injury, therefore, the effect of miR-199a-PPARγ on the glomerular injury will be elaborated in a future study.
Supplemental Material
Download PDF (317.2 KB)Disclosure statement
The authors declare that they have no competing interests.
Data availability statement
All the data generated or analyzed during this study are included in this published article.
References
- Ichida K, Matsuo H, Takada T, et al. Decreased extra-renal urate excretion is a common cause of hyperuricemia. Nat Commun. 2012;3:764.
- Johnson RJ, Bakris GL, Borghi C, et al. Hyperuricemia, acute and chronic kidney disease, hypertension, and cardiovascular disease: report of a scientific workshop organized by the national kidney foundation. Am J Kidney Dis. 2018;71(6):851–865.
- Li X, Yan Z, Carlstrom M, et al. Mangiferin ameliorates hyperuricemic nephropathy which is associated with downregulation of AQP2 and increased urinary uric acid excretion. Front Pharmacol. 2020;11:49.
- Thounaojam MC, Montemari A, Powell FL, et al. Monosodium urate contributes to retinal inflammation and progression of diabetic retinopathy. Diabetes. 2019;68(5):1014–1025.
- Shi Y, Tao M, Ma X, et al. Delayed treatment with an autophagy inhibitor 3-MA alleviates the progression of hyperuricemic nephropathy. Cell Death Dis. 2020;11(6):467.
- Shi M, Guo F, Liao D, et al. Pharmacological inhibition of fatty acid-binding protein 4 alleviated kidney inflammation and fibrosis in hyperuricemic nephropathy. Eur J Pharmacol. 2020;887:173570.
- Lu J, Dalbeth N, Yin H, et al. Mouse models for human hyperuricaemia: a critical review. Nat Rev Rheumatol. 2019;15(7):413–426.
- Li X, Pan X, Fu X, et al. MicroRNA-26a: an emerging regulator of renal biology and disease. Kidney Blood Press Res. 2019;44(3):287–297.
- Lv W, Fan F, Wang Y, et al. Therapeutic potential of microRNAs for the treatment of renal fibrosis and CKD. Physiol Genomics. 2018;50(1):20–34.
- Sun WF, Zhang XX, Sun FY, et al. MicroRNA expression patterns of the kidney in hyperuricemia mice treated with Xiezhuo Chubi decoction. Chin J Integr Med. 2011;17(1):35–42.
- Yu S, Hong Q, Wang Y, et al. High concentrations of uric acid inhibit angiogenesis via regulation of the Krüppel-like factor 2-vascular endothelial growth factor-A axis by miR-92a. Circ J. 2015;79(11):2487–2498.
- Estevez-Garcia IO, Gallegos-Nava S, Vera PE, et al. Levels of cytokines and microRNAs in individuals with asymptomatic hyperuricemia and ultrasonographic findings of gout: a bench-to-bedside approach. Arthritis Care Res. 2018;70(12):1814–1821.
- Zhong X, Chen Y, Yao C, et al. MicroRNA-30b participates in the pathological process of hyperuricemia by regulating interleukin-6 receptor. Nucleosides Nucleotides Nucleic Acids. 2020;39(8):1162–1178.
- Yan G, Li B, Xin X, et al. MicroRNA-34a promotes hepatic stellate cell activation via targeting ACSL1. Med Sci Monit. 2015;21:3008–3015.
- Vandenbussche C, Van der Hauwaert C, Dewaeles E, et al. Tacrolimus-induced nephrotoxicity in mice is associated with microRNA deregulation. Arch Toxicol. 2018;92(4):1539–1550.
- Wang C, Zhu G, He W, et al. BMSCs protect against renal ischemia-reperfusion injury by secreting exosomes loaded with miR-199a-5p that target BIP to inhibit endoplasmic reticulum stress at the very early reperfusion stages. FASEB J. 2019;33(4):5440–5456.
- Lefterova MI, Haakonsson AK, Lazar MA, et al. PPARγ and the global map of adipogenesis and beyond. Trends Endocrinol Metab. 2014;25(6):293–302.
- Wang S, Dougherty EJ, Danner RL. PPARγ signaling and emerging opportunities for improved therapeutics. Pharmacol Res. 2016;111:76–85.
- Gutting T, Weber CA, Weidner P, et al. PPARγ-activation increases intestinal M1 macrophages and mitigates formation of serrated adenomas in mutant KRAS mice. Oncoimmunology. 2018;7(5):e1423168.
- Kadam L, Gomez-Lopez N, Mial TN, et al. Rosiglitazone regulates TLR4 and rescues HO-1 and NRF2 expression in myometrial and decidual macrophages in inflammation-induced preterm birth. Reprod Sci. 2017;24(12):1590–1599.
- Wang X, Deng J, Xiong C, et al. Treatment with a PPAR-γ agonist protects against hyperuricemic nephropathy in a rat model. Drug Des Devel Ther. 2020;14:2221–2233.
- Bruen R, Fitzsimons S, Belton O. miR-155 in the resolution of atherosclerosis. Front Pharmacol. 2019;10:463.
- Chhabra M, Sharma S. Potential role of peroxisome proliferator activated receptor gamma analogues in regulation of endothelial progenitor cells in diabetes mellitus: an overview. Diabetes Metab Syndr. 2019;13(2):1123–1129.
- Chen RJ, Chen MH, Chen YL, et al. Evaluating the urate-lowering effects of different microbial fermented extracts in hyperuricemic models accompanied with a safety study. J Food Drug Anal. 2017;25(3):597–606.
- Li L, Yang C, Zhao Y, et al. Is hyperuricemia an independent risk factor for new-onset chronic kidney disease? A systematic review and meta-analysis based on observational cohort studies. BMC Nephrol. 2014;15:122.
- Zhang M, Cheng J, Sun Z, et al. Protective effects of carbon dots derived from phellodendri chinensis cortex carbonisata against deinagkistrodon acutus venom-induced acute kidney injury. Nanoscale Res Lett. 2019;14(1):377.
- Cui D, Liu S, Tang M, et al. Phloretin ameliorates hyperuricemia-induced chronic renal dysfunction through inhibiting NLRP3 inflammasome and uric acid reabsorption. Phytomedicine. 2020;66:153111.
- Wang G, Zuo T, Li R. The mechanism of arhalofenate in alleviating hyperuricemia-activating PPARγ thereby reducing caspase-1 activity. Drug Dev Res. 2020;81(7):859–866.
- Liu B, Tan P. PPAR γ/TLR4/TGF-β1 axis mediates the protection effect of erythropoietin on cyclosporin A-induced chronic nephropathy in rat. Ren Fail. 2020;42(1):216–224.
- Choi JH, Jin SW, Choi CY, et al. Capsaicin inhibits dimethylnitrosamine-induced hepatic fibrosis by inhibiting the TGF-beta1/SMAD pathway via peroxisome proliferator-activated receptor gamma activation. J Agric Food Chem. 2017;65(2):317–326.
- Pan J, Shi M, Li L, et al. Pterostilbene, a bioactive component of blueberries, alleviates renal fibrosis in a severe mouse model of hyperuricemic nephropathy. Biomed Pharmacother. 2019;109:1802–1808.
- Wang CY, Liu Q, Huang QX, et al. Activation of PPARgamma is required for hydroxysafflor yellow A of carthamus tinctorius to attenuate hepatic fibrosis induced by oxidative stress. Phytomedicine. 2013;20(7):592–599.
- Vallee A, Lecarpentier Y, Guillevin R, et al. Opposite interplay between the canonical WNT/β-catenin pathway and PPAR gamma: a potential therapeutic target in gliomas. Neurosci Bull. 2018;34(3):573–588.
- Tao M, Shi Y, Tang L, et al. Blockade of ERK1/2 by U0126 alleviates uric acid-induced EMT and tubular cell injury in rats with hyperuricemic nephropathy. Am J Physiol Renal Physiol. 2019;316(4):F660–F673.
- Senouthai S, Wang J, Fu D, et al. Fractalkine is involved in lipopolysaccharide-induced podocyte injury through the Wnt/β-catenin pathway in an acute kidney injury mouse model. Inflammation. 2019;42(4):1287–1300.
- Hao S, He W, Li Y, et al. Targeted inhibition of β-catenin/CBP signaling ameliorates renal interstitial fibrosis. J Am Soc Nephrol. 2011;22(9):1642–1653.
- Zhou Z, Wan J, Hou X, et al. MicroRNA-27a promotes podocyte injury via PPARgamma-mediated beta-catenin activation in diabetic nephropathy. Cell Death Dis. 2017;8(3):e2658.
- Badawy AM, El-Naga RN, Gad AM, et al. Wogonin pre-treatment attenuates cisplatin-induced nephrotoxicity in rats: impact on PPAR-γ, inflammation, apoptosis and Wnt/β-catenin pathway. Chem Biol Interact. 2019;308:137–146.