
Abstract
The main objective of this study was to investigate the relationships between the use of smart technology (mobile phones) and the implicit (tacit) and explicit safety knowledge of employees and their propensity to follow safe practices at work. A survey was performed with seven constructs: (a) use of mobile technology; (b) tacit safety knowledge; (c) explicit safety knowledge of unsafe behaviors; (d) attitudes toward safety: emotional aspects; (e) safety culture: behavioral and psychological aspects of work; (f) safety culture: aspects of work; (g) safety culture: regulations at work. Workers from three manufacturing companies located in southeastern Poland completed a paper-based survey. The results revealed that using mobile technology positively influenced the explicit safety knowledge of employees, as well as their assessed safety culture, in terms of behavioral aspects and their attitudes toward safety expressed through the psychological aspects of safety culture.
1. Introduction
The use of mobile personal communication devices such as smartphones and tablets is currently widespread in both daily activities as well as in a variety of working environments, including formal and informal training and learning [Citation1–3]. For example, Pimmer and Pachler [Citation4] discussed the value of mobile learning for work-based education and pointed out that, similar to other technological innovations, mobile devices have the potential to enhance existing educational practices and can be widely used for learning in informal contexts. The authors also concluded that the affordances of mobile devices at work enable cross-contextual learning by sharing content such as multimedia material, learning at work through competence development, engaging in social mobile networking and education in informal settings, which can lead to a significant increase in workers’ active participation in the learning process. Mobile devices have also been increasingly used for safety training and education in a variety of occupational settings, including road safety [Citation5], healthcare [Citation6–8] and construction sites [Citation8–10], to increase workers’ ability to identify safety risks and improve real-time communication between employees and managers.
As recently discussed by Srivastava [Citation11], in light of the rapid expansion of mobile technology, it is important to consider the effect of such technology on society, in general, and to explore the extent to which mobile phones affect our daily lives, and, in particular, how they affect our social behaviors. For example, the excessive use of mobile technology by individuals at large has been linked to antisocial behavior [Citation12]. Furthermore, Bianchi and Phillips [Citation13] suggested that people who are attached to their mobile phones also tend to take risks more often. People with significant mobile phone usage are also more likely to use the phones inappropriately despite recognized safety concerns, formal and informal bans against their use at the risk of fines and penalties, and a knowledge of the potential dangers to self and others due to such use. Notably, Yang et al. [Citation14] provided evidence that behavioral beliefs, social influences and personal traits are salient factors for the adoption and use of mobile technology.
Smartphones are pervasive and rapidly developing communication tools currently used in everyday life; however, very little is known about their effect on work environments from the social and cultural points of view [Citation11]. Therefore, this study focused on exploring the potential association between the use of mobile devices in general and the propensity of workers to follow safety rules, regulations and policies in the workplace. The main purpose of this research was to investigate the relationships between the general tendency to use smart mobile technology, employee safety knowledge and safe practices at work while considering the safety culture and employees’ attitudes toward safety.
2. Background
2.1. Safety culture
Three interrelated concepts of safety culture include behavioral, psychological and situational aspects [Citation15]. The behavioral (organizational) aspect focuses on the behaviors of employees, activities and actions related to safety within the organization, i.e., what ‘people do’ in an organization regarding safety. The organizational context of safety culture can be measured using a set of indicators, including engagement, managerial commitment and employees’ empowerment, awards and a reporting system [Citation16]. The psychological aspect considers ‘what people feel’ about safety and its management at all levels of the organization. Worker attitudes and perceptions are important aspects of corporate safety culture [Citation17]. The situational (or corporate) aspect relates to a corporation’s policies, instructions, procedures, management system and communication flow, and explains ‘what an organization obtains’ [Citation18].
2.2. Safety knowledge management
According to Vecchio-Sudus and Griffiths [Citation19], promoting strong safety practices can positively affect safety culture in an organization. Management support of safety training includes informing workers about safety, in general, and adherence to safety procedures, in particular [Citation20]. Safety training that focuses on safety accountability increases employee safety knowledge and compliance, influences worker behaviors and attitudes regarding occupational and safety rules [Citation21–23], and is considered one of the most effective aspects of a safety program [Citation24,Citation25].
Employee training should lead to a comprehensive level of safety-relevant knowledge [Citation26,Citation27]. Such knowledge includes both the explicit (structural) safety knowledge that is codified into safety documents, including national and international and national safety standards, regulations, rules or instructions, as well as workers’ tacit (hidden) knowledge regarding safety based on her/his individual experience and prior safety performance [Citation27]. As discussed by Nonaka et al. [Citation28,Citation29], while explicit knowledge is a codified knowledge that is formal, objective and easy to transmit, process and share, tacit knowledge is personal and context specific and is therefore very difficult to communicate, formalize or codify. In other words, tacit knowledge is typically transferred through anecdotes in personal communications that take place in face-to-face interactions between individuals, in meetings or through electronic tools, such as email and online chats. It should be noted that new knowledge is also created during interactions between individuals based on their understanding of different content and possessing different types of explicit and tacit knowledge [Citation29]. Furthermore, effective organizational knowledge creation involves continuous and dynamic processes of conversion from tacit knowledge to explicit knowledge [Citation30]. Unfortunately, many organizations today focus their training efforts exclusively on the transfer of formal or explicit knowledge that includes governmental and corporate policies [Citation31,Citation32]. However, such an approach does not account for the great variability of the mostly dynamic nature of hazards and unsafe conditions at work. Therefore, comprehensive safety management systems should utilize both explicit and tacit (hidden) safety knowledge. Tacit employee safety knowledge is strongly tied to the work context, and although tacit knowledge is difficult to formalize and verbalize, nonetheless it can be acted upon and utilized during work processes and is critical to ensuring the use of safety practices [Citation30].
3. Methods and procedures
3.1. Study variables
The primary focus of the present study was on the relationships between the tendency to use smart mobile technology, employee safety knowledge and safe work practices at work while considering the safety culture and employees’ attitudes toward safety. As a first step, the main constructs of the proposed model were designed based on the previously reported literature discussed earlier. Principal component analysis (PCA) of the data extracted 38 items that represent the safety knowledge dimensions. As a result, the remaining 38 items were used for further analyses. A final set of variables (a total of 38 items) used in model development were categorized and named as follows:
Use of mobile technology (smartphones) (TECH) (six items).
Tacit knowledge (TK) (eight items).
Explicit safety knowledge of unsafe behaviors (EKUB) (three items).
Attitudes toward safety emotional aspects (ASEA) (five items).
Safety culture: behavioral and psychological aspects of work (SCBPA) (four items).
Safety culture: aspects of work (SCAW) (seven items).
Safety culture: regulations at work (SCW) (five items).
The survey statements for each of the study variables are presented in .
Table 1. Model constructs with corresponding item measures and descriptions after principal component analysis.
3.2. Survey questionnaire
All questionnaire statements were measured on a 5-point response Likert scale: 1 = strongly disagree; 2 = disagree; 3 = neither agree nor disagree; 4 = agree; 5 = strongly agree. To minimize the potential impact of respondent inertia, several items were presented on a reversed scale. Furthermore, the order of all statements in the questionnaire was randomized.
3.3. Participants
Empirical data collection was carried out in three large industrial enterprises in southeastern Poland. A total of 436 respondents (78.1% male workers and 21.9% female workers) provided valid survey responses (a response rate of 54%). The study participants performed a large variety of manufacturing and fabrication jobs with a mix of physical (60%) and cognitive (40%) task components. A standardized interview method was implemented using a paper self-administered questionnaire.
3.4. Study hypotheses
The proposed study hypotheses are depicted in and represented in . In total, six hypotheses were developed to examine the plausible relationships between the use of smart mobile technology, employee safety knowledge, tacit and explicit knowledge, safety regulations and safe practices at work with due consideration given to safety culture and employees’ attitudes toward safety.
Figure 1. The hypothesized study model.
Note: For postulated hypotheses H1–H6, see Table 2. ASEA = attitudes toward safety: emotional aspects; EKUB = explicit knowledge of unsafe behaviors; SCAW = safety culture: aspects of work; SCBPA = safety culture: behavioral and psychological aspects; SCW = safety culture regulations at work; TECH = use of mobile technology; TK = tacit knowledge.
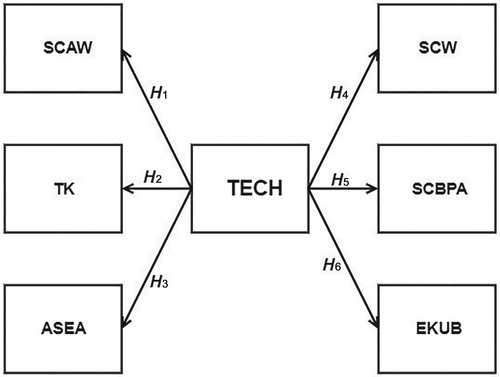
Table 2. Study hypotheses.
4. Model development and analysis
4.1. Overview of statistical analyses
The statistical analyses were performed using SPSS version 25 for Windows and AMOS version 24 [Citation33]. These analyses consisted of PCA, unidimensionality analysis, reliability analysis and structural equation modeling (SEM) to analyze the relationships among the model factors.
4.2. Principal component analysis
Prior to performing the factor extraction through PCA, the commonalities involved were extracted. Commonalities are very useful in representing the total amount that an original variable shares with all other variables included in the analysis [Citation34]. According to Field [Citation34], this is critical in deciding which variables to finally extract into the various items. In general, in commonality values, the extraction of values that are greater than 0.5 at the initial iteration indicates that the variable is significant and should be included in the data for further analysis, or otherwise should be removed [Citation34]. From our data, we have extracted seven items with values less than 0.5 (items 11, 27, 31, 32, 36, 42 and 45) prior to conducting the factor extraction through PCA.
In this study, a principal component together with varimax rotation, an eigenvalue greater than 1 and a cut-off factor loading of 0.4 were used for factor analysis. Data are deemed appropriate for analysis based on the Kaiser–Meyer–Olkin sampling adequacy value of 0.917. Bartlett’s test of sphericity is significant (χ2 = 9025.605, p < 0.001), which indicates that correlations exist among certain response categories. After the first run of the principal component factor analysis, several factors remained unchanged, whereas other questions had to be redistributed between the factors, in comparison to the structure of the original questionnaire. We named these factors in an appropriate way. presents the results of the PCA, grouping the 38 items into seven key factors, accounting for 63.8% of total variance.
Table 3. Seven key components were extracted from the principal component analysis.
4.3. Unidimensionality and reliability analysis
While performing a statistical analysis, unidimensionality should always be considered first, prior to conducting reliability and validity analysis [Citation35]. This is thought to reduce the possibility of misspecifications [Citation36], because the analysis of reliability and validity is based on the assumption of unidimensionality [Citation37]. A comparative fit index (CFI) of 0.9 or greater for the model indicates strong evidence of unidimensionality [Citation33,Citation38]. To test for the unidimensionality of the instrument used in the current study, a CFI was conducted on measurements for each of the seven items. In relation to this study, the CFI values were found to be greater than the 0.9 level, as presented in , which indicates strong evidence of unidimensionality for all of the scales.
Table 4. Results of confirmatory factor analysis: unidimensionality and reliability coefficients.
Reliability is known as the consistency of the measurement [Citation39]. The reliability expressed by Cronbach’s α was greater than the cut-off criterion of 0.7, which indicates the achievement of internal consistency among the latent variables [Citation40]. In this study, the results presented in show that the internal consistency of all factors was good to excellent (Cronbach’s α from 0.71 to 0.87).
4.4. Structural equation modeling
The SEM approach was used to determine the degree to which the hypothesized model in this study was supported by the empirical data. SEM as a statistical method determines the relationships and directional influence, either direct or indirect, between the model’s latent variables, each of which has a set of observed variables in the conceptualized study model [Citation33]. SEM has been commonly and successfully employed in most survey research in the behavioral and social sciences because of its ability to improve and validate the latent constructs or unobserved variables in measurement models [Citation41]. The SEM methodology mainly consists of two parts: the measurement model and the structural model. The structural model associates latent variables to measure the relationships between them, such as the direct and indirect effects, as well as the explained and unexplained variances accounted for in each latent variable [Citation42].
4.5. Model fit indices
The goodness of fit for each measurement was assessed using five indices: the relative χ2 ratio over the df, the CFI, the Tucker–Lewis index (TLI), the goodness-of fit index (GFI) and the root mean square error of approximation (RMSEA) index. A lower χ2 index value is preferable because such a value indicates better model fitness for the data. A ratio of 5 or less is an acceptable fit between a hypothetical model and the sample data. The CFI and TLI indices, also called relative or comparative fit indices, express the relative improvement in fit of the hypothetical model compared with the sample data. The GFI indicates the proportion of variance accounted for by the predicted population covariance [Citation43]. CFI, GFI and TLI values greater than 0.90 are generally considered acceptable model fits. Finally, the RMSEA relates a model’s residual and is considered one of the most informative criteria in covariance structure modeling. Values of RMSEA range from 0 to 1. A smaller RMSEA value, particularly a value less than 0.06, is an indication of a good fit [Citation44]. According to Hooper et al. [Citation45], validating each construct or latent factor individually is the most reliable way to assess any possible weaknesses in model fit. Successful fit values were reached after checking the factor loading of the observed variables and the critical ratios.
5. Results and discussion
5.1. Confirmatory factor analysis
After validating each construct as already shown, the hypothesized study model was validated using confirmatory factor analysis (CFA). CFA was applied to the model shown in . All fit values after model revisions were within an acceptable range of values (see ). CFA was applied to validate the measurement model for each construct in the model as well as to validate the hypothesized study model. Fit indices were examined to analyze the data fit values, and the model fit was reached after several alterations and modifications to reach the best acceptable fitting values for the fit indices.
5.2. Development of the final structural equation model
SEM was used to extract the structured model and to test the relationships among the study variables. The last step was to validate the measurement model for each construct as well as with respect to the whole hypothesized study model. Path analysis [Citation36] was employed using each latent indicator to test the connections between each latent variable as well as the postulated hypotheses of the study. Comparison of fit indices for the initial and final model parameters are presented in .
Table 5. Summary of fit indices: comparison for the initial and final models.
For the initial model, only one fit index met the acceptability criteria, with GFI = 0.709, CFI = 0.725, TLI = 0.707, RMSEA = 0.084 and χ2/df = 4.309. After eliminating the insignificant regression paths, the final structural model satisfied all fit criteria with the following values: GFI = 0.902, CFI = 0.907, TLI = 0.915, RMSEA = 0.056 and χ2/df = 2.332.
5.3. Hypothesis testing
The results of hypothesis testing, as presented in , were used to draw the following conclusions. Tendency to use mobile technology affected all variables, with the p values for all relationships being less than 0.05; thus, all postulated hypotheses (H1, H2, H3, H4, H5 and H6) were supported by the survey results.
Table 6. Results of the final model relationships.
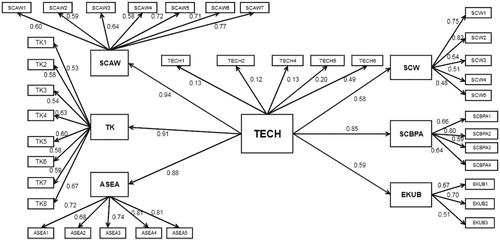
All relationships in the structural model shown in were significant at the level of p = 0.05. These analyses provided the following results:
Using mobile technology (TECH) had a significant positive effect on safety culture: aspects of work (SCAW) (standardized weight = 0.94; p < 0.05), which supports H1.
A positive effect of using mobile technology (TECH) on tacit knowledge (TK) was identified in Polish industrial enterprises (standardized weight = 0.91; p < 0.05), which supports H2.
Using mobile technology (TECH) positively influenced personnel attitudes toward safety emotional aspects (ASEA) in Polish industrial enterprises (standardized weight = 0.88; p < 0.05), which supports H3.
The effect of using mobile technology (TECH) on safety culture regulations at work (SCW) in Polish industrial enterprises was statistically significant (standardized weight = 0.58; p < 0.05), which supports H4.
Using mobile technology (TECH) had a significant positive effect on safety culture: behavioral and psychological aspects of work (SCBPA) (standardized weight = 0.85; p < 0.05), which supports H5.
A positive effect of using mobile technology (TECH) on explicit safety knowledge of unsafe behaviors was identified in Polish industrial enterprises (standardized weight = 0.59; p < 0.05), which supports H6. The significance of all direct effects shown in the model was confirmed at p < 0.05 through bootstrapping analysis [Citation45].
Figure 2. A final structural model with standardized path coefficients.
Note: ASEA = attitudes toward safety: emotional aspects; EKUB = explicit knowledge of unsafe behaviors; SCAW = safety culture: aspects of work; SCBPA = safety culture: behavioral and psychological aspects; SCW = safety culture regulations at work; TECH = use of mobile technology; TK = tacit knowledge.
6. Conclusions
This study examined the relationships between the use of smart mobile technology, employee safety knowledge and safe practices at work with due consideration given to safety culture and employees’ attitudes toward safety. The tendency to use smartphones outside work, in general, and in the workplace, in particular, was associated with a greater propensity to follow safety regulations and safe practices at work. The results also indicate that using mobile technology positively influenced the explicit safety knowledge of employees, as well as their assessed safety culture in terms of behavioral aspects and their attitudes toward safety expressed through the psychological aspects of safety culture. Similarly, a positive effect of using mobile technology on participants’ explicit safety knowledge of unsafe behaviors was identified in Polish industrial enterprises. Furthermore, the use of mobile technology positively influenced personnel attitudes toward safety emotional aspects, safety culture: aspects of work and safety culture regulations at work. These results could be used in future to develop a safety knowledge management system that optimizes employees’ tacit and explicit knowledge to improve overall safety performance. Further studies are also needed to better understand the intricacies of safety knowledge management for employees with differing education backgrounds and to examine the effects of age, gender and relevant job experience.
Recently, Pimmer and Pachler [Citation4] pointed out that even though the use of mobile phones is gaining increased attention in the fields of professional learning and work-based education, there is relatively little research regarding how mobile devices can be used effectively for learning and competence development in real work contexts. As discussed by Attewell [Citation1], mobile learning is unique in that it allows truly anywhere, anytime, personalized learning and can provide the following important benefits: (a) help learners improve their literacy and numeracy skills and recognize their existing abilities; (b) encourage both independent and collaborative learning experiences; (c) help learners identify areas where they need assistance and support; (d) help combat resistance to the use of information and communications technology (ICT) and help bridge the gap between mobile phone literacy and ICT literacy; (e) help remove some of the formality from the learning experience and engage reluctant learners; (f) help learners remain more focused for longer periods; (g) help increase self-esteem and self-confidence. It seems plausible that these benefits would be equally applicable to the current state-of-the-art in mobile-based learning of safety in the workplace and for the quest to improve the effectiveness of safety training. Indeed, more research in this area in the near future is very much needed.
Disclosure statement
No potential conflict of interest was reported by the authors.
Additional information
Funding
Related Research Data
References
- Attewell J. Mobile technologies and learning. London: Learning and Skills Development Agency; 2005.
- Ally M, editor. Mobile learning: transforming the delivery of education and training. Athabasca (AB): Athabasca University Press; 2009.
- Peng H, Su YJ, Chou C, et al. Ubiquitous knowledge construction: mobile learning re-defined and a conceptual framework. Innov Educ Teach Int. 2009;46(2):171–183. doi: 10.1080/14703290902843828
- Pimmer C, Pachler N. Mobile learning in the workplace: unlocking the value of mobile technology for work-based education. In: Ally M, Tsinakos A, editors. Increasing access through mobile learning. Vancouver (BC): Commonwealth of Learning and Athabasca University; 2014. p. 193–203.
- Reychav I, Wu D. Exploring mobile tablet training for road safety: a uses and gratifications perspective. Comput Educ. 2014;71:43–55. doi: 10.1016/j.compedu.2013.09.005
- Chatterjee S, Chakraborty S, Sarker S, et al. Examining the success factors for mobile work in healthcare: a deductive study. Decis Support Syst. 2009;46(3):620–633. doi: 10.1016/j.dss.2008.11.003
- Jen WY, Chao CC. Measuring mobile patient safety information system success: an empirical study. Int J Med Informat. 2008;77(10):689–697. doi: 10.1016/j.ijmedinf.2008.03.003
- Prgomet M, Georgiou A, Westbrook JI. The impact of mobile handheld technology on hospital physicians’ work practices and patient care: a systematic review. J Am Med Informat Assoc. 2009;16(6):792–801. doi: 10.1197/jamia.M3215
- Izkara JL, Pérez J, Basogain X, Borro D. Mobile augmented reality, an advanced tool for the construction sector. In: Proceedings of the 24th W78 conference; 2007 Jun 27–29; Maribor; 2007 [cited at 2018 Oct 1]; p. 190–202. Available from: https://www.semanticscholar.org/paper/Mobile-augmented-reality%2C-an-advanced-tool-for-the-Izkara-P%C3%A9rez/b2d5e8c2aa74787ac99467b2b9df77761138a141
- Le QT, Pedro AK, Lim CR, et al. A framework for using mobile based virtual reality and augmented reality for experiential construction safety education. Int J Eng Educ. 2015;31(3):713–725.
- Srivastava L. Mobile phones and the evolution of social behaviour. Behav Inf Technol. 2005;24(2):111–129. doi: 10.1080/01449290512331321910
- Phillips JG, Butt S, Blaszczynski A. Personality and self-reported use of mobile phones for games. CyberPsychol Behav. 2006;9(6):753–758. doi: 10.1089/cpb.2006.9.753
- Bianchi A, Phillips JG. Psychological predictors of problem mobile phone use. CyberPsychol Behav. 2005;8(1):39–51. doi: 10.1089/cpb.2005.8.39
- Yang S, Lu Y, Gupta S, et al. Mobile payment services adoption across time: an empirical study of the effects of behavioral beliefs, social influences, and personal traits. Comput Human Behav. 2012;28(1):129–142. doi: 10.1016/j.chb.2011.08.019
- Cooper D. Towards a model of safety culture. Saf Sci. 2000;36(2):111–136. doi: 10.1016/S0925-7535(00)00035-7
- Guldenmund FW. The nature of safety culture: a review of theory and research. Saf Sci. 2000;34(1):215–257. doi: 10.1016/S0925-7535(00)00014-X
- Michael JH, Evans DD, Jansen KJ, et al. Management commitment to safety as organizational support: relationships with non-safety outcomes in wood manufacturing employees. J Saf Res. 2005;36(2):171–179. doi: 10.1016/j.jsr.2005.03.002
- Wiegmann DA, Zhang H, Von Thaden TL, et al. Safety culture: an integrative review. Int J Aviat Psychol. 2004;14(2):117–134. doi: 10.1207/s15327108ijap1402_1
- Vecchio-Sadus AM, Griffiths S. Marketing strategies for enhancing safety culture. Saf Sci. 2004;42(7):601–619. doi: 10.1016/j.ssci.2003.11.001
- Choudhry RM, Fang D, Mohamed S. The nature of safety culture: a survey of the state-of-the-art. Saf Sci. 2007;45(10):993–1012. doi: 10.1016/j.ssci.2006.09.003
- Ho CL, Dzeng RJ. Construction safety training via e-learning: learning effectiveness and user satisfaction. Comput Educ. 2010;55(2):858–867. doi: 10.1016/j.compedu.2010.03.017
- Vinodkumar M, Bhasi M. Safety management practices and safety behaviour: assessing the mediating role of safety knowledge and motivation. Accid Anal Prev. 2010;42(6):2082–2093. doi: 10.1016/j.aap.2010.06.021
- Floyde A, Lawson G, Shalloe S, et al. The design and implementation of knowledge management systems and e-learning for improved occupational health and safety in small to medium sized enterprises. Saf Sci. 2013;60:69–76. doi: 10.1016/j.ssci.2013.06.012
- Wu X, Liu Q, Zhang L, et al. Prospective safety performance evaluation on construction sites. Accid Anal Prev. 2015;78:58–72. doi: 10.1016/j.aap.2015.02.003
- Al-Refaie A. Factors affect companies’ safety performance in Jordan using structural equation modeling. Saf Sci. 2013;57:169–178. doi: 10.1016/j.ssci.2013.02.010
- Arezes PM, Miguel AS. Risk perception and safety behaviour: a study in an occupational environment. Saf Sci. 2008;46(6):900–907. doi: 10.1016/j.ssci.2007.11.008
- Sherehiy B, Karwowski W. Knowledge management for occupational safety, health, and ergonomics. Hum Factor Ergon Man Serv Ind. 2006;16(3):309–319. doi: 10.1002/hfm.20054
- Nonaka I, Takeuchi H. The knowledge-creating company: how Japanese companies create the dynamics of innovation. New York (NY): Oxford University Press; 1995.
- Nonaka I, Umemoto K, Senoo D. From information processing to knowledge creation: a paradigm shift in business management. Technol Sci. 1996;18:203–218. doi: 10.1016/0160-791X(96)00001-2
- Nonaka L, Takeuchi H, Umemoto K. A theory of organizational knowledge creation. Int J Technol Manag. 1996;11(7–8):833–845. doi: 10.4324/9780203699416-2
- Thomas JC, Kellogg WA, Erickson T. The knowledge management puzzle: human and social factors in knowledge management. IBM Syst J. 2001;40(4):863–884. doi: 10.1147/sj.404.0863
- Domingues JP, Sampaio P, Arezes PM. Analysis of integrated management systems from various perspectives. Total Qual Manag Bus. 2015;26(11–12):1311–1334. doi: 10.1080/14783363.2014.931064
- Byrne BM. Structural equation modeling with Mplus: basic concepts, applications, and programming. London: Routledge; 2013.
- Field A. Discovering statistics using SPSS for windows. London: SAGE; 2005.
- Hair J, Anderson R, Tatham R, et al. Multivariate data analysis with readings. Englewood Cliffs (NJ): Prentice-Hall International; 1995.
- Gerbing DW, Anderson JC. An updated paradigm for scale development incorporating unidimensionality and its assessment. J Marketing Res. 1988;25(2):186–192. doi: 10.1177/002224378802500207
- Nunnally J, Bernstein I. Psychometric theory. New York (NY): McGraw-Hill; 1994.
- Issac G, Rajendran C, Anantharaman RN. An instrument for the measurement of customer perceptions of quality management in the software industry: an empirical study in India. Software Qual J. 2006;14(4):291–308. doi: 10.1007/s11219-006-0037-2
- Hair J, Black W, Babin B, et al. Multivariate data analysis. Saddle River (NJ): Prentice Hall; 2010.
- Cortina JM. What is coefficient alpha? An examination of theory and applications. J Appl Psychol. 1993;78(1):98–104. doi: 10.1037/0021-9010.78.1.98
- Lomax RG, Schumacker RE. A beginner’s guide to structural equation modeling. New York (NY): Psychology Press; 2004.
- Molenaar KR, Park JI, Washington S. Framework for measuring corporate safety culture and its impact on construction safety performance. J Constr Eng Manag. 2009; 135(6):488–496. doi: 10.1061/(ASCE)0733-9364(2009)135:6(488)
- Tabachnick BG, Fidell LS, Ullman JB. Using multivariate statistics. Vol. 5. Boston (MA): Pearson; 2007.
- Hu LT, Bentler PM. Cutoff criteria for fit indexes in covariance structure analysis: conventional criteria versus new alternatives. Struct Equ Model. 1999;6(1):1–55. doi: 10.1080/10705519909540118
- Hooper D, Coughlan J, Mullen M. Structural equation modelling: guidelines for determining model fit. Electr J Bus Res Method. 2008;6(1):53–60.