
Abstract
Factors related to the working environment (e.g. inadequate lighting, excessive noise, poor condition of premises) contribute to neglect in the work of medical personnel, while also causing health effects in their body. This article presents the results of the assessment of working conditions in workplaces at selected medical facilities in Poland. This assessment was based on survey results. The survey was conducted by means of a questionnaire among more than 300 physicians, nurses and diagnostic laboratory staff. The average grading of noise annoyance in workplaces on a scale from 0 to 10 was 2.77, and therefore noise was assessed as a slight inconvenience.
1. Introduction
In the working environment, noise is defined as any undesirable sound which can be annoying or harmful to health, or which can increase the risk of an accident at work [Citation1–3]. In addition to damaging the hearing organ, noise as a stressor can contribute to the development of a variety of diseases (e.g., hypertension, peptic ulcer disease, neurosis), cause distraction, hinder work and reduce staff performance [Citation4,Citation5]. According to the ISO/TS 15666:2003 definition [Citation6], annoyance resulting from noise exposure is an individual’s adverse reaction that causes dissatisfaction, anxiety, irritation or disturbance. The World Health Organization (WHO) associates noise annoyance with an adverse effect on health, and defines it as experiencing many different reactions including anger, disappointment, dissatisfaction, withdrawal, helplessness, depression, anxiety, distraction or exhaustion [Citation7].
According to the recommendations of the WHO, the A-weighted equivalent sound pressure level in hospital buildings should not exceed 30 dB(A) and the maximum A-weighted sound pressure level should not exceed 40 dB(A) [Citation7]. In hospital buildings and healthcare facilities, there are many noise-emitted sounds – the activity of employees and patients (conversations, movement, etc.), alarm sounds, ventilation and air conditioning systems, medical equipment, etc. According to the WHO, noise levels in these buildings have increased systematically since the 1960s [Citation8].
Literature data indicate that the A-weighted equivalent sound pressure levels in operating rooms reach 66 dB(A) in the majority of cases of non-orthopedic operations [Citation9,Citation10] and 72 dB(A) in the case of orthopedic operations [Citation11,Citation12]. In intensive care units of Australian hospitals, the A-weighted sound level of the background noise exceeds 50 dB(A) [Citation13]. Studies conducted by Tijunelis et al. [Citation14] demonstrated the mean A-weighted equivalent sound pressure levels in rescue wards to be 52.9 dB(A), whereas the highest recorded level lay within the range of 94–117 dB(A). On the other hand, the results of Lawson et al.’s [Citation15] studies in intensive care units showed that the A-weighted equivalent sound pressure levels at night are 50 dB(A), and the highest observed C-weighted peak sound pressure levels are within the range of 80–86 dB(C). Similar results for various parts of the operating rooms during the day were obtained by Luzzi et al. [Citation10] and Pai [Citation16], who recorded C-weighted peak sound pressure levels ranging from 80 to 90 dB(C). The results of studies carried out in Polish hospitals [Citation17–19] showed that the highest A-weighted sound pressure levels occurred at a water treatment station (78 dB (A)) and in an endoscopic procedures room (70 dB(A)). The highest C-weighted peak sound pressure levels were observed in an operating room (110 dB(C)) and in a cleaning room (in the endoscopic examination unit) (102 dB(C)).
There are few studies in the literature concerning the impact of noise on healthcare professionals. Laboratory testing of persons who are not healthcare professionals has shown that noise often does not adversely affect the tasks performed when there is a need to increase the effort or to maintain a high level of the task performed. The results of laboratory studies suggest that adequate working efficiency during noise exposure is maintained by an increase in effort, as demonstrated inter alia by increased cardiovascular response [Citation20]. These results suggest that medical personnel may be able to maintain the required productivity in certain noisy situations, but at the expense of increased effort and fatigue. Several works analyzed the performance of anesthesiologists and surgeons under various acoustic conditions (e.g., silence compared to simulated loud conditions) and concluded that the noise did not significantly worsen the performance [Citation21,Citation22]. Nevertheless, in one of the works [Citation23] the test results showed that the short-term memory and mental efficiency deteriorated among anesthesiologists working under typical noise conditions in an operating room (A-weighted sound pressure level above 77 dB(A)).
Healthcare professionals form a specific group of people who – on the one hand – take care of one’s health in a broad and diverse sense of the term and who, on the other, cannot forget that during those activities they are exposed, e.g., to harmful and bothersome factors. Lack of comprehensibility of speech due to an improper acoustic climate can be a factor influencing medical errors. This in turn causes financial losses related, inter alia, to hospital compensation adjudged by courts to patients (in cases where the incomprehensibility of verbal information due to inadequate acoustic climatic conditions has contributed to error or negligence) or employees (in the event of loss of health in the performance of their duties resulting from the employment relationship) [Citation24].
As has been the case so far in Poland, no studies have been carried out in the scope of assessment of acoustic conditions present in medical facilities, in particular in terms of assessment of those conditions by employees. Consequently, the purpose of this study was to carry out a subjective assessment of working conditions in medical facilities in view of the present noise.
2. Method
2.1. Research methodology
In order to carry out a subjective assessment of the acoustic conditions in medical facilities, a survey form has been developed. The survey includes a total of 30 questions in three parts, where two parts (13 questions) were related to noise and assessment of acoustic conditions.
The study was conducted by the pen and paper personal interview (PAPI) method using the aforementioned survey.
2.2. Statistical analysis
The data obtained during the performance of the tests were subject to multi-stage analysis, both quantitative and qualitative. The results of the study were analyzed in terms of overall trends and averages in the entire survey population as well as in terms of the type of work performed. In the case of variables, the comparison and analysis included the results obtained in subgroups of subjects with the largest and smallest intensity of a given independent variable, as well as the trends decreasing or increasing in the internal response structure. The subgroups of the study subjects with the largest and smallest percentage of answers to a given question were also described. The choice of such independent variables is very important in terms of their correlation with the overall results expressed by the entire tested population.
2.3. Tested medical facilities
The survey was conducted in five provinces in Poland: Mazovia, Greater Poland, Silesia, West Pomerania and Lesser Poland. The respondents were employed in private and state medical outpatient clinics and hospitals.
2.4. Characteristics of the study subjects
The tests were carried out on a group of 301 respondents employed in medical facilities during the period of July–August 2019. This group included physicians (n = 151), nurses (n = 120) and diagnostic laboratory employees – laboratory diagnosticians (n = 30). Women represented 65.4% of the tested persons, whereas men represented 34.6% of the test subjects. Taking into account the professional division of respondents, men represented 56.3% of physicians, whereas in the case of nurses and diagnostic laboratory employees, women were predominant with the share of 99.2 and 60.0%, respectively. The study subjects represented all age categories, i.e., from below 25 to over 65 years old ().
Table 1. Number of respondents (expressed in percent and absolute figures) representing individual age categories of test subjects.
There is a statistically significant relationship between the profession and gender (p = 0.000). Almost all nurses are women. There is a strong relation between gender and professional group (χ2 = 94.49; p < 0.001, Cramér’s V = 0.560).
Taking into account the type of the provided work suggests that the tested physicians were the relatively oldest age group. The youngest group of test subjects was made up of personnel from diagnostic laboratories (laboratory diagnosticians). There is a strong relationship between age and the professional group (χ2 = 30.619; p = 0.001, Cramér’s V = 0.225).
3. Test results
The study participants made a general subjective assessment of the working conditions. The vast majority of the participants (83.4% in total) assessed the conditions under which they provide their work as very good (38.2%) or good (45.2%). The working conditions were evaluated as average by 16.3% of respondents. Only 0.3% of the respondents evaluated the operating conditions as poor. None of the participants of the study assessed the working conditions as very poor.
The working conditions were assessed highest by the tested physicians – as much as 55.0% of the responses (very good). The working conditions were also highly evaluated by laboratory diagnosticians. The relatively worst working conditions were identified by the surveyed nurses. Statistical tests confirm significant differences in the distribution of responses as confirmed by χ2 test (χ2 = 49.514). There is a significant statistically related relationship between the assessment of working conditions and the profession (p = 0.001).
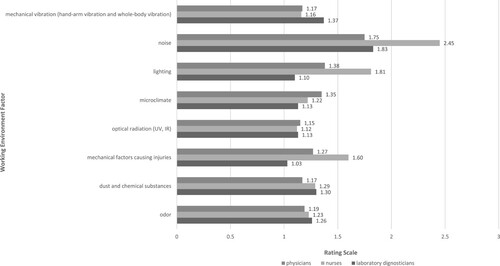
As a result of the conducted study, it was found that noise is perceived as the most burdensome factor in the working environment in medical facilities. The average rating (according to a scale from 1 to 5, where 1 = no nuisance and 5 = highest nuisance) of noise as a nuisance factor is 2.3. Other factors of the working environment which constitute sources of nuisance have obtained a significantly lower rating (). It was found (see ) that noise is the largest source of nuisance for nurses (rating of 2.45), smaller for personnel of diagnostic laboratories (1.83) and the smallest source of nuisance for physicians (1.75). There is a relationship between the professional group and noise nuisance (χ2(2) = 54.203; p < 0.001). A non-parametric analysis of variance (ANOVA) test for Kruskal–Wallis rank sums demonstrated that there is a difference in the assessment performed by individual professional groups for noise nuisance (χ2(2) = 52.62; p < 0.001). The pairwise comparison was carried out using Dunn’s post hoc test for professional groups. Significant differences were found between physicians and nurses (p < 0.001) and between diagnosticians and nurses (p = 0.001).
Figure 1. Average rating (on a scale from 1 to 5) of the working environment factors which are the source of nuisance. Note: IR = infrared; UV = ultraviolet.
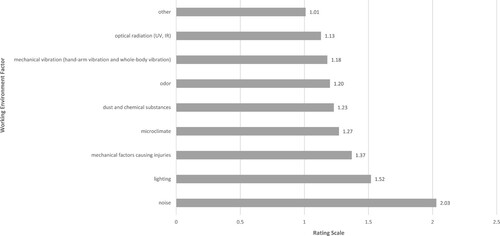
Figure 2. Average rating (on a scale from 1 to 5) of the working environment factors which are the source of nuisance according to physicians, nurses and diagnostic laboratory employees. Note: IR = infrared; UV = ultraviolet.
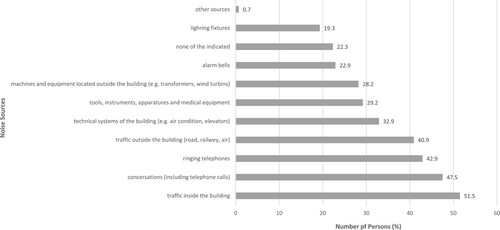
Respondents employed in medical facilities were asked to identify the main noise sources causing the highest nuisance during their work. The persons taking the survey were presented with a list of noise sources, where each of the tested people could provide several answers; therefore, the sum of indications is greater than 100% (). According to the evaluated personnel, the source of noise causing the greatest nuisance is traffic inside the building – 51.5% of the indications. A very large percentage of survey participants also pointed to noise sources such as conversations (including telephone calls) (47.5%), ringing telephones (42.9%) and traffic outside the building (road, railway, air) (40.9% of indications). Further factors such as technical systems of the building (e.g., air conditioning, elevators) and tools, instruments, apparatuses and medical equipment were indicated by 32.9 and 29.2% of those examined, respectively. Other noise sources constituting a certain type of nuisance are machines and equipment located outside the building (e.g., transformers, wind turbines) (28.2%), alarm bells (22.9%) and lighting (19.3% of indications).
Figure 3. List of major noise sources causing nuisance and the number of persons (expressed in percent) who demonstrated these sources (several sources could be identified).
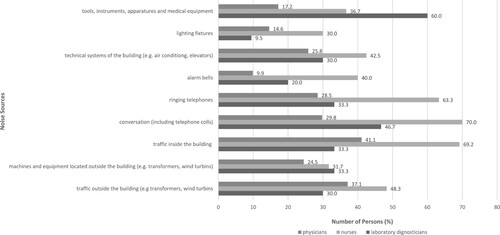
The responses of the laboratory survey subjects differ depending on the type of work provided (). It turns out that for laboratory diagnosticians such noise sources as tools, instruments, apparatuses and medical equipment as well as machines and equipment located outside the building (e.g., transformers, wind turbines) are more burdensome than for other professional groups. For nurses, such noise sources as lighting fixtures, technical systems of the building (e.g., air conditioning, elevators), alarm bells, ringing telephones, conversations (including telephone calls), traffic inside the building and traffic outside the building (road, railway and air) are much more burdensome than for other professional groups.
Figure 4. List of major noise sources causing nuisance and the number of physicians, nurses and staff of diagnostic laboratories (expressed in percent) who demonstrated those sources (each person could identify several sources).
There is a relationship between the professional group and the nuisance of noise emitted by tools, instruments, apparatuses and medical equipment (χ2(2) = 27.467; p < 0.001). The relation is medium – Cramér’s V = 0.302. A non- parametric ANOVA test for Kruskal–Wallis rank sums demonstrated that there is a difference in the assessment performed by the individual professional groups for nuisance of noise emitted by tools, instruments, apparatuses and medical equipment (χ2(2) = 22.25; p < 0.001). The pairwise comparison was carried out using Dunn’s post hoc test for professional groups. Significant differences were found between physicians and nurses (p < 0.001), between physicians and laboratory diagnosticians (p = 0.001) and between laboratory diagnosticians and nurses (p = 0.036). The noise emitted by tools, instruments, apparatuses and medical equipment is the largest source of nuisance for laboratory diagnosticians: average rank Ravr = 194.25 (the scale is designed in such a way that the higher the result, the higher the nuisance). Tools, instruments, apparatuses and medical equipment are a smaller source of nuisance for nurses (Ravr = 160.52). For physicians, the noise caused by tools, instruments, apparatuses and medical equipment is least burdensome (Ravr = 134.84).
There is a relationship between the professional group and the assessment of nuisance of noise emitted by illuminance in the workplace (χ2(2) = 18.187; p < 0.001). The relation is weak – Cramér’s V = 0.246. A non-parametric ANOVA test for Kruskal–Wallis rank sums demonstrated that there is a difference in the assessment performed by individual professional groups for nuisance of noise emitted by lighting (χ2(2) = 15.34; p < 0.001). The pairwise comparison was carried out using Dunn’s post hoc test for professional groups. Significant differences were found between physicians and nurses (p = 0.004) and between laboratory diagnosticians and nurses (p = 0.001). The noise emitted by lighting is the biggest source of nuisance for nurses, with Ravr = 165.30. Illuminance is a smaller source of nuisance for physicians (Ravr = 145.89). For the diagnosticians, the noise caused by lighting is least onerous (Ravr = 119.50).
There is a relationship between the professional group and the assessment of nuisance of noise emitted by the technical systems of the building (e.g., air conditioning, lifts) in the workplace (χ2(2) = 8.546; p = 0.014). The relation is weak – Cramér’s V = 0.169. A non-parametric ANOVA test for Kruskal–Wallis rank sums demonstrated that there is a difference in the assessment performed by individual professional groups for nuisance of noise emitted by technical systems of the building (χ2(2) = 14.75; p = 0.001). The pairwise comparison was carried out using Dunn’s post hoc test for professional groups. Significant differences were found between physicians and nurses (p = 0.011). The noise emitted by technical systems of the building is the largest source of nuisance for nurses, with Ravr = 171.09. The technical systems of the building are a lower source of nuisance for physicians and laboratory diagnosticians – the average ranks were Ravr = 137.75 and Ravr = 137.30, respectively.
There is a relationship between the professional group and the assessment of nuisance of noise emitted by alarm bells in the workplace (χ2(2) = 34.370; p < 0.001). The relation is medium – Cramér’s V = 0.338. A non-parametric ANOVA test for Kruskal–Wallis rank sums demonstrated that there is a difference in the assessment performed by the individual professional groups for nuisance of noise emitted by alarm bells (χ2(2) = 33.44; p < 0.001). The pairwise comparison was carried out using Dunn’s post hoc test for professional groups. Significant differences were found between physicians and nurses (p < 0.001) and between laboratory diagnosticians and nurses (p = 0.006). The noise emitted by alarm bells is the biggest source of nuisance for nurses (Ravr = 178.30). Alarm bells are a smaller source of nuisance for the diagnosticians and physicians – the average ranks were Ravr = 139.10 and Ravr = 131.67, respectively.
There is a relationship between the professional group and the assessment of nuisance of noise emitted by ringing phones in the workplace (χ2(2) = 34.406; p < 0.001). The relation is medium – Cramér’s V = 0.338. A non-parametric ANOVA test for Kruskal–Wallis rank sums demonstrated that there is a difference in the assessment performed by the individual professional groups for nuisance of noise emitted by ringing telephones (χ2(2) = 36.40; p < 0.001). The pairwise comparison was carried out using Dunn’s post hoc test for professional groups. Significant differences were found between physicians and nurses (p < 0.001) and between laboratory diagnosticians and nurses (p = 0.009). The noise emitted by ringing telephones is the biggest source of nuisance for nurses, with Ravr = 184.40. Ringing telephones are the less significant source of nuisance for laboratory diagnosticians (Ravr = 138.35), and the smallest source for physicians (Ravr = 126.97).
There is a relationship between the professional group and the assessment of the nuisance of noise caused by conversations, including telephone calls in the workplace (χ2(2) = 43.336; p < 0.001). The relation is medium – Cramér’s V = 0.379. A non-parametric ANOVA test for Kruskal–Wallis rank sums demonstrated that there is a difference in the assessment performed by individual professional groups for nuisance of noise caused by conversations (χ2(2) = 46.32; p < 0.001). The pairwise comparison was carried out using Dunn’s post hoc test for professional groups. Significant differences were found between physicians and nurses (p < 0.001) and between laboratory diagnosticians and nurses (p = 0.067). Noise caused by conversations is the biggest source of nuisance for nurses, with Ravr = 188.85. Conversations are the less significant source of nuisance for laboratory diagnosticians (Ravr = 144.85), and the smallest source for physicians (Ravr = 122.15).
A relationship between the professional group and the assessment of nuisance of noise emitted by traffic inside the building occupied by respondents was observed, where χ2(2) = 25.548; p < 0.001. The relation is weak – Cramér’s V = 0.291. A non-parametric ANOVA test for Kruskal–Wallis rank sums demonstrated that there is a difference in the assessment performed by individual professional groups for nuisance of noise emitted by internal traffic inside the building (χ2(2) = 20.11; p < 0.001). The pairwise comparison was carried out using Dunn’s post hoc test for professional groups. Significant differences were found between physicians and nurses (p = 0.001) and between laboratory diagnosticians and nurses (p = 0.001). The noise emitted by traffic inside the building is the biggest source of nuisance for nurses (Ravr = 175.00). Internal traffic inside the building is a less significant source of nuisance for physicians (Ravr = 138.51), and the smallest source for laboratory diagnosticians (Ravr = 117.83).
Each of the test subjects also indicated the frequency of perception of noise from sources which may emit it. The subjects were asked how often during the day the noise from the previously analyzed sources is a nuisance. The frequency of noise perception was evaluated by respondents according to a four-step graduation from 1 = very rarely or never to 4 = very often or always. According to the data presented, the tested personnel of medical facilities are rarely affected by noise from the analyzed sources (none of the analyzed noise-emitting sources obtained an average rating above 2.00). On a daily basis, the most frequent nuisance for persons at work are noise sources such as conversations (including telephone calls), average rating of 1.73; internal traffic, average rating of 1.66; ringing telephones, average rating of 1.63; and external traffic (road, railway, air), average rating of 1.57. Other noise sources are burdensome for the test subjects even less frequently.
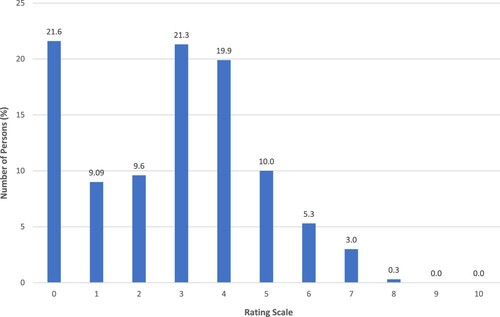
A key question was that concerning the indication of the degree of nuisance of noise in the workplace. Each respondent made a subjective assessment of noise according to a scale from 0 to 10, where lower values indicate non-burdensome or insignificantly burdensome noise, and higher values indicate very burdensome noise. The vast majority of survey participants assess noise nuisance as inconsiderable (). In total, 61.5% of the subjects indicated grading from 0 to 3, including 21.6% indicating the rating of 0, 21.3% the rating of 3, 9.6% the rating of 2, while 9.0% provided the rating of 1. Ratings confirming the average nuisance of noise in the workplace included ratings from 4 to 6 indicated by a total 35.2% of the respondents, including 19.9% indicating the rating of 4, 10.0% the rating of 5 and 5.3% the rating of 6. High nuisance of noise in the workplace was assessed by a total of 3.3% of respondents, including 3.0% of the respondents indicating the rating of 7, while 0.3% of the respondents indicated the rating of 8. The average assessment of noise nuisance in the workplace on the scale from 0 to 10 amounted to 2.77, and therefore a small nuisance of noise.
Figure 5. Results of noise nuisance assessment (assessment on a scale from 0 to 10) and number of persons (expressed in percent) which granted individual rantings.
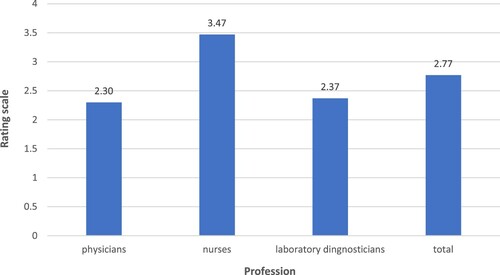
Nurses assess noise in the workplace as the highest nuisance. The average rating for nurses was 3.47, for laboratory diagnosticians was 2.37, whereas among physicians it was 2.30 ().
Figure 6. Average assessment of noise nuisance (on a scale from 0 to 10) according to physicians, nurses and personnel of diagnostic laboratories.
On the basis of the data, it should be concluded that there is a relationship between the professional group and noise nuisance in the workplace (χ2(2) = 106.839; p < 0.001). The relation is weak – η coefficient = 0.284. The non-parametric ANOVA test for the Kruskal–Wallis rank sums demonstrated that there is a difference in the assessment of noise nuisance in the workplace in relation to individual professional groups of χ2(2) = 27.77; p < 0.001. The pairwise comparison was carried out using Dunn’s post hoc test for professional groups. Significant differences were found between physicians and nurses (p < 0.001) and between laboratory diagnosticians and nurses (p = 0.012). The nuisance of noise in the workplace is the most perceptible by nurses, with Ravr = 182.95. The nuisance of noise in the workplace is less onerous for the diagnosticians (Ravr = 132.57) and for physicians (Ravr = 129.27).
A continuation of the question concerning the assessment of the scale of noise nuisance in the workplace was a question concerning the working time under the evaluated conditions. More than half of the study subjects (54.2%) work continuously under such conditions. Half of the working time in the evaluated conditions is performed by 15.0% of respondents. The same percentage of subjects (14.6%) performs work under such conditions for one-quarter of the working time and three-quarters of the working time. Under the evaluated conditions, 1.7% of the respondents work for a period shorter than one-quarter of the working time. Physicians are the group to work most frequently under the evaluated conditions. Based on the data, it should be noted that there is a relationship between the professional group and the working time under evaluated conditions (χ2(2) = 21.586; p = 0.006). The relation is weak – η coefficient = 0.097.
The vast majority of medical personnel tested (72.8%) do not need to raise their voice during work. More than every fourth of the respondents (27.2%) raise their voice during work. In total, 47.5% of nurses, 23.3% of laboratory diagnosticians and 11.9% of physicians are required to speak louder at work. There is a relationship between the professional group and the need to raise the voice during work (χ2(2) = 42.960; p < 0.001). The relation is medium – η coefficient = 0.378. More than half of those who raise their voice at work (56.1%) do it occasionally. Every third of the study subjects (32.9%) uses a raised voice for one-quarter of the working time. In total, 4.9% of the respondents raise their voice during work for approx imately three-quarters of the working time and 4.9% of for approximately one-half of the working time. Only 1.2% of the study subjects use a raised voice for the entire duration of their work.
4. Conclusions
The described studies were aimed at performing a subjective assessment of working conditions in medical facilities in Poland due to the present noise. The results of the conducted tests were confirmed by literature reports [Citation25–28] indicating that noise is a nuisance factor in the working environment in hospital buildings and medical care facilities. This noise is generated by numerous sources with different characteristics.
The results of the surveys showed, among others, that the noise during work was experienced by a vast majority of nurses (98.3%) and laboratory diagnosticians (90%). For physicians, this percentage is 68.9%. However, in the case of nurses, the sources of this noise are technical systems/equipment, noise penetrating from adjacent rooms and corridors and from the outside as well as conversations of the personnel and patients. The main sources indicated by laboratory diagnosticians were the driving units of tools and medical equipment and apparatuses. Physicians, on the other hand, have selected the medical tools used to perform medical activities as the main noise sources.
The results confirm that the sound environment in the premises of medical facilities is significantly influenced, among others, by the following:
background noise level, taking into account also the noise transmitted outside the rooms;
noise emission level from instruments and tools used in medical processes.
A reduction in the value of each of these variables results in an improvement in the quality of the sound environment in the rooms concerned. In general, this can be achieved using sound-absorbing materials (both on ceilings and on walls), increasing acoustic isolation of walls, windows and doors, and using tools and medical instruments characterized by a low level of emitted noise.
Acknowledgements
This publication has been based on the results of the fourth stage of the program ‘Safety and working conditions improvement’, co-founding in the years 2017–2019 within the capacity of the governmental services by the Ministry of Family, Labour and Social Policy. The main coordinator: Central Institute for Labour Protection – National Research Institute.
Disclosure statement
No potential conflict of interest was reported by the authors.
References
- Koradecka D, editor. Handbook of occupational safety and health. Boca Raton (FL): CRC Press Taylor & Francis Group; 2010.
- Mikulski W, Pleban D. Noise, infrasonic noise and ultrasonic noise [Hałas, hałas infradźwiękowy i hałas ultradźwiękowy]. In: Pośniak M, Skowroń J, editors. Harmful factors in the working environment. Limit values. 2020 [Czynniki szkodliwe w środowisku pracy. Wartości dopuszczalne. 2020]. Warsaw: CIOP-PIB; 2020. p. 177–198. Polish.
- Pleban D, editor. Occupational noise and workplace acoustics. Advances in measurement and assessment techniques. Boca Raton (FL): CRC Press Taylor & Francis Group; 2021.
- Fields JM. Effect of personal and situational variables on noise annoyance in residential areas. J Acoust Soc Am. 1993;93(5):2753–2763. Doi:https://doi.org/10.1121/1.405851
- Lercher P, Hörtnagl J, Kofler W. Work noise annoyance and blood pressure: combined effects with stressful working conditions. Int Arch Occ Env Hea. 1993;65(1):23–28. doi:https://doi.org/10.1007/BF00586054
- International Organization for Standardization. ISO/TS 15666:2003 acoustics – assessment of noise annoyance by means of social and socio-acoustic surveys; Geneva, Switzerland, International Organization for Standardization; 2003.
- World Health Organization. Guidelines for community noise; Geneva, Switzerland, World Health Organization; 1999.
- Berglund B, Lindvall T, Schwela DH, editors. Guidelines for community noise. Geneva: World Health Organization; 1999.
- Shankar N, Malhotra KL, Ahuja S, et al. Noise pollution: a study of noise levels in the operation theatres of a general hospital during various surgical procedures. J Indian Med Assoc. 2001;99(5):244, 246–247.
- Luzzi S, Falchi S, Becchi C, et al. Sound analysis of noise pollution in operating rooms. In: Proceedings of the Euronoise 2003: 5th European Conference on Noise Control; Naples, 19–21 May 2003. Available from https://www.academia.edu/29877372/Sound_Analysis_of_Noise_Pollution_in_Operating_Rooms; 2003.
- Tsiou C, Efthymiatos G, Katostaras T. Noise in the operating rooms of Greek hospitals. J Acoust Soc Am. 2008;123:757–765. doi:https://doi.org/10.1121/1.2821972
- Holzer LA, Leihner A, Kazanschütz M, et al. Noise measurement in total knee arthroplasty. Noise Health. 2014;16:205–207. doi:https://doi.org/10.4103/1463-1741.137040
- Elliot RM, McKinley SM, Eager D. A pilot study of sound levers in an Australian adult general intensive care unit. Noise Health. 2010;12(46):26–36. doi:https://doi.org/10.4103/1463-1741.59997
- Tijunelis MA, Fitzsullivan E, Henderson SO. Noise in the ED. Am J Emerg Med. 2005;23:332–335. doi:https://doi.org/10.1016/j.ajem.2005.02.037
- Lawson N, Thompson K, Saunders G, et al. Sound intensity and noise evaluation in a critical care unit. Am J Crit Care. 2010;19(6):e88–e98. doi:https://doi.org/10.4037/ajcc2010180
- Pai JY. A study in hospital noise – a case from Taiwan. Int J Occ Saf Ergo. 2007;13(1):83–90. doi:https://doi.org/10.1080/10803548.2007.11076711
- Smagowska B, Pleban D, Sobolewski A, et al. Working conditions in selected hospital rooms – results of a pilot study on noise, illumination and microclimate [Warunki pracy w wybranych pomieszczeniach szpitala – wyniki badań pilotażowych hałasu, oświetlenia i mikroklimatu]. Bezpieczeństwo Pracy – Nauka i Praktyka. 2018;12/2018:17–21. Polish.
- Smagowka B, Radosz J, Pleban D. Noise exposure at workstations in hospitals. In: ICSV26 Local Committee in Montreal, editors. Proceedings of the 26th International Congress on Sound and Vibration; Montreal, 7-11 July 2019; Canadian Acoustical Association; 2019.
- Pleban D, Smagowska B, Radosz J. Acoustic climate in medical facilities – recommendations [Kształtowanie klimatu akustycznego w pomieszczeniach placówek medycznych – zalecenia]. Bezpieczeństwo Pracy – Nauka i Praktyka. 2020;6/2020:17–21. Polish.
- Parsons R, Hartig T. Environmental psychophysiology. In: Cacioppo JT, Tassinary LG, Berntson GG, editors. Handbook of psychophysiology. New York (NY): Cambridge University Press; 2000. p. 815–846.
- Hawksworth C, Sivalingam P, Asbury A. The effect of music on anaesthetists’ psychomotor performance. Anaesthesia. 1998;53(2):195–197. doi:https://doi.org/10.1046/j.1365-2044.1998.00274.x
- Moorthy K, Munz Y, Undre S, et al. Objective evaluation of the effect of noise on the performance of a complex laparoscopic task. Surgery. 2004;136(1):25–30. doi:https://doi.org/10.1016/j.surg.2003.12.011
- Murthy VSSN, Malhotra SK, Bala I, et al. Detrimental effects of noise on anaesthetists. Can J Anaesth. 1995;42:608–611. doi:https://doi.org/10.1007/BF03011878
- Ciesielska K. Noise in hospitals and the resulting costs [Hałas w szpitalach i jego koszty] [Internet]; n.d. [cited 2021 May 27]. Polish. Available from: https://www.academia.edu/12061826
- Nassiri P, Heidari HR, Khadem M, et al. Assessment of noise annoyance and its effects on healthcare staff based on sound pressure level and annoyance scale. Int J Occup Hyg. 2014;6(1):23–30.
- Beldam MB. The importance of several room acoustics descriptors of operation rooms. In: Ochmann M, Vorländer M, Fels J, editors. Proceedings of the 23rd International Congress on Acoustics: integrating 4th EAA Euroregio 2019; Aachen, 9–13 September 2019; Berlin, Germany, Deutsche Gesellschaft für Akustik; 2019. p. 4646–4653.
- Quinn M. Staff experience of sound environment in operating rooms built with non-absorbing modules. In: Ochmann M, Vorländer M, Fels J, editors. Proceedings of the 23rd International Congress on Acoustics: integrating 4th EAA Euroregio 2019; Aachen, 9–13 September 2019; Berlin, Germany, Deutsche Gesellschaft für Akustik; Aachen; 2019. p. 7833–7839.
- Larsen TM, Jeong CH, Beldam MB, et al. An investigation of room functions and acoustic demands in selected departments in three Danish hospitals. In: Ochmann M, Vorländer M, Fels J, editors. Proceedings of the 23rd International Congress on Acoustics: integrating 4th EAA Euroregio 2019; Aachen, 9–13 September 2019; Berlin, Germany, Deutsche Gesellschaft für Akustik; 2019. p. 7803–7810.