
Abstract
A validated physiological manikin method was used to qualify environmentally dependent correlations between firefighter turnout total heat loss (THL) and intrinsic evaporative resistance (Ref) heat strain indexes and core temperature rise in stressful work conducted in mild (25 °C, 65% relative humidity [RH]) and hot (35 °C, 40% RH; 40 °C, 28% RH) conditions. Five turnout suit constructions representing a wide range of breathability were selected. The observed correlations between measured material heat loss and core temperature showed that the THL heat strain index accurately forecast thermal burden in mild environments (<25 °C); while the Ref index provided accurate prediction in hot environments (>35 °C). They showed that the THL index did not predict heat strain in hot work environments. The findings of this study support incorporating both the Ref and THL heat strain indexes as dual metrics for characterizing the heat strain performance of turnout clothing fabrics.
1. Introduction
Firefighting is one of the most strenuous occupations. Combined with the requirement to wear protective turnout clothing, stressful work and environmental conditions can place substantial physiological demand on firefighters, leading to heat stress [Citation1]. In addition, heat stress can exacerbate the cardiovascular strain experienced by firefighters. Heat strain is one of the leading factors of sudden cardiac events [Citation2]. A recent extensive survey has confirmed that firefighters believe that turnout gear is a significant contributor to heat stress [Citation3].
The National Fire Protection Association (NFPA) 1971 standard for structural firefighter personal protective equipment (PPE) [Citation4] establishes a minimum heat strain requirement for turnout suit materials based on a measured total heat loss (THL) value. THL measured at 25 °C, 65% relative humidity (RH) with a sweating guarded hotplate appeared in the NFPA 1971 standard in 2000. At that time, the standard established a minimum level of 130 W/m2 for heat loss through firefighter composites as the performance requirement. In 2007, the standard raised the THL requirement to 205 W/m2. However, because the THL requirement is strictly valid only for predicting turnout suit-related heat strain in mild environmental conditions (25 °C, 65% RH), there was interest in examining additional performance metrics valid for other environmental conditions [Citation5]. This led to consideration of an intrinsic evaporative resistance (Ref) index, measured at 35 °C, 40% RH, as an alternative or companion index to THL as a basis for qualifying the contribution of turnout suit materials to firefighter heat strain. Ref is the evaporative resistance of the fabric excluding the surface air layer, and the subscript ‘f’ refers to the fabric being tested [Citation6].
Previous studies have analyzed the correlation between THL and heat stress in firefighter turnouts [Citation7–10]. Studies conducted by Barker and colleagues [Citation9,Citation10] contributed to setting the performance limit of firefighter composites as THL of 130 W/m2 in 2000, and the study by Stull and Duffy [Citation8] helped set the minimum requirement at 205 W/m2 in 2007. In a recent study, DenHartog et al. [Citation11] characterized the physiological response of firefighters working in a hot environment (40 °C, 20% RH) wearing three different turnout suits having similar THL but different evaporative resistance values. This study showed that, in hot conditions, turnout systems made with materials that have different evaporative resistance ratings produced significantly different heat strain in wearers.
Therefore, the aim of this study was to provide needed qualification of the relationship between THL and Ref ratings of firefighter turnout materials and physiological indicators of heat stress in mild and hot environmental conditions.
2. Methodology
2.1. Physiological manikin
This study used a physiological manikin to predict the physiological response of males wearing turnout gear with a wide range of THL and Ref ratings in three different environmental conditions (25 °C, 65% RH; 35 °C, 40% RH; and 40 °C, 28% RH). Different humidity levels were selected to obtain a similar vapor pressure in the environment. The physiological manikin system is a 34-zone Newton manikin (Thermetrics, USA) coupled with the TAITherm human comfort model (TAITherm version12.1.1). The manikin is articulated, capable of flexible movement of arms and legs to simulate a walking motion when connected to an external walking stand. The human physiological model is based on the Fiala thermoregulation model described by Burke et al. [Citation12] and Deaton et al. [Citation13]. The data acquisition system collects environmental data and measures the temperature of the manikin surface every 0.9 s. Values of metabolic work rates were manually entered to estimate physiological responses including the core and skin temperatures, sweating rate and cardiac output for an average male weighing 80 kg. Burke et al. [Citation12] provide a detailed explanation of the thermal model control system.
The physiological sweating manikin methodology was utilized to evaluate turnout-level heat strain because of the advantages this approach provides in minimizing variability associated with garment fit, and the variability in physiological response inherent in human subject wear trials. In addition, the physiological manikin was found to be a valid alternative to human studies for evaluating the heat strain associated with firefighter turnout gear [Citation12,Citation13]. Studies have established that a physiological controlled sweating manikin produced an accurate simulation of human physiological response to wearing turnout gear in different conditions [Citation14].
2.2. Materials
Five different turnout constructions were selected, employing the same outer shell but different moisture barriers and thermal liners (Table ). Some systems (A, B, D and E) incorporate bi-component expanded-polytetrafluoroethylene (e-PTFE) moisture barriers, featuring a thin solid hydrophilic film coated onto an e-PTFE microporous membrane. A previous study has shown that the evaporative resistance of a bi-component moisture barrier depends on the moisture absorbed by the membrane in different environmental conditions [Citation5]. Composites A and D are NFPA 1971-compliant commercially available products. Composite B has a single-layer thermal liner, essentially a thinner version of composite A. Turnout composite C features an uncoated microporous e-PTFE moisture barrier layered between two thermal liners. Constructions B and C are special designs, not certified to the NFPA performance standard. Composite E contains a specially designed bi-component membrane incorporating a proprietary hydrophilic coating. Moisture barriers E and C were specially produced for this study.
Table 1. Description of turnout materials.
2.3. Procedures
All of the turnout suits studied are of identical design and sized to fit the sweating manikin. Controlled chamber studies in three different environmental conditions were conducted, including simulation of a mild work environment (25 °C, 65% RH) and two hot conditions (35 °C, 40% RH; 40 °C, 28% RH) representing thermally stressful environments encountered by firefighters. A wind speed of 1 m/s was used in all tests. The mild chamber condition is equivalent to the testing conditions used in the standard THL test method (25 °C, 65% RH) [Citation6]. One of the hot environment conditions is equivalent to the conditions used in the Ref test procedure (35 °C, 40% RH) [Citation6]. The climate-controlled chamber was able to maintain a stable condition, with fluctuations in temperature and relative humidity less than 0.3 °C and 4% RH.
Table presents the work–rest protocol used to evaluate turnout-related heat strain at different ambient environmental conditions. The protocols were designed to produce heat strain sufficient to cause core temperature to rise to between 38 and 39 °C. The work rate needed to produce this level of heat strain depended on the environmental conditions. The protocols included environmental conditions, work rates and work–rest cycles that were similar to previous firefighter wear trial studies [Citation9–11,Citation15]. The protocol in this study was not designed to simulate a specific firefighting activity, because firefighters need to respond to both fire and non-fire emergencies, such as vehicle accidents, medical calls, search and rescue, etc. [Citation16]. It is impossible to simulate these activities using a single protocol. However, during all firefighting activities, firefighters usually work and rest intermittently to reduce fatigue and heat stress [Citation3].
Table 2. Testing protocol.
Each turnout suit was tested in triplicate in environmental conditions maintained in a climate-controlled chamber. To maximize heat loss, the turnout suits were tested on the sweating manikin wearing only a t-shirt (large size, 100% cotton), a boxer brief (medium size, 100% cotton) and socks (100% cotton) (Figure a). Otherwise, the manikin wore the basic elements of a structural firefighter ensemble including a turnout suit, helmet and gloves. In addition, firefighter boots were replaced with tennis shoes for ease of dressing, and the pant-leg interface was taped to limit air exchange, as is common practice in wear trial protocols [Citation9–11]. The manikin did not don a self-contained breathing apparatus (SCBA) or face piece (Figure b).
Figure 1. Physiological manikin photograph: (a) manikin dressed in t-shirt undergarment and turnout pant; (b) manikin fully dressed and in static test simulating resting phase; (c) manikin walking.
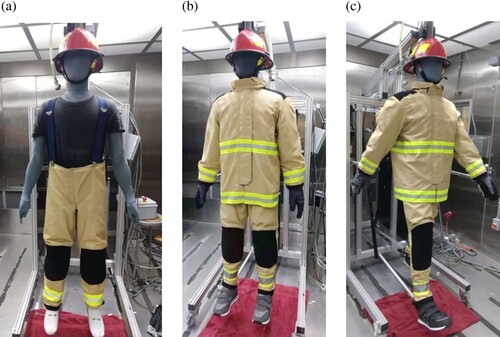
The sweating manikin was operated in a dynamic testing mode during the work-simulating phase of the wear trial protocol. This provided a simulation of the effects of walking on air circulation in the microclimate between the manikin form and the turnout suit (Figure c).
2.4. Statistical analysis
All tests were conducted three times and average values were used. The measurement uncertainty was given as mean ± standard deviation × 2.58, where 2.58 is the coverage factor for a confidence level of 99%. The statistical analysis used JMP Pro version 15.1.0. The predicted physiological responses of different garments in the end of protocol were compared using one-way analysis of variance (ANOVA). The Shapiro–Wilk test was used to check data normality and Bartlett’s test was used to check homogeneity of variance. The ANOVA test was followed by Tukey’s honestly significant difference (HSD). p < 0.01 indicates a significant difference.
3. Results and discussion
Table presents the THL and Ref ratings of the study turnout materials. These data show how separate reliance on either the THL or the Ref heat strain indexes can result in fundamentally different assessments of the comparative heat strain performance of different turnout systems. For example, composite C has the lowest THL rating, while also having the lowest (best breathability) Ref index among the study materials. Composite E also demonstrates the fundamental differences between heat strain indexes: it meets the minimum THL requirements of the NFPA 1971 standard while having the highest measured intrinsic evaporative resistance (70 Pa·m2/W). Because of a thinner thermal liner, composite B has a higher THL compared to composite A. Although it has extremely low Ref (24 Pa·m2/W), composite C’s THL rating is well below the minimum THL requirement of 205 W/m2 called for by the NFPA 1971.
Table 3. Heat strain indexes of study firefighter turnouts.
3.1. Predicted physiological responses
The primary objective of this research was to study the correlations between THL or Ref and predicted human physiological responses that indicate human heat strain in different environmental conditions, including body core temperature, skin temperature, cardiac output and sweating rate.
3.1.1. Relationships between THL and Ref heat strain indexes and body core temperature
The human body maintains a core temperature around 37 °C by balancing heat produced in the body through metabolic processes with heat exchange with the environment [Citation17]. Core temperature directly indicates heat strain experienced by the wearers [Citation15].
Figure shows that, in mild climate conditions, a noticeable increase in core temperature requires alternating periods of hard work. Turnout-related differences, amounting to an approximately 0.14 °C difference in core temperature across all turnout systems, are apparent after 80–90 min in the wear regimen, or near the end of a 2-h wear protocol (Figure ). Most significantly, the THL index accurately foreshadows the observed effects on physiological heat strain of turnout systems worn in mild conditions. For example, it predicts that the low THL turnout system C will produce the highest heat stress, as indicated by increased core temperature. This is a confirming result because it accurately reflects the higher thermal insulation expected for the thicker, double thermal liner construction C. At the same time, system C has a Ref index of 24 Pa·m2/W, indicating its capability to transmit evaporative heat.
Figure 2. Predicted core temperature rise in a mild environment (25 °C, 65% RH). Note: Met = metabolic equivalent; RH = relative humidity.
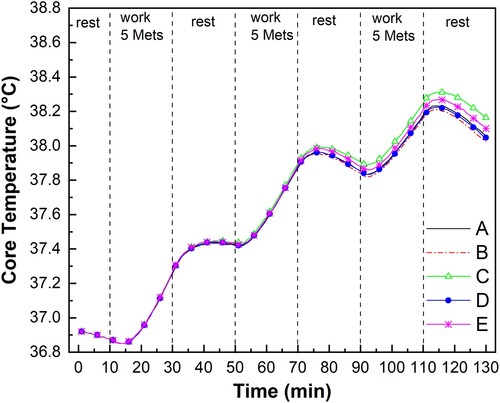
Figure a and b shows that, as expected, core temperature rise occurs more rapidly in wearing turnout systems in hot environments. The work needed to produce stressful conditions in the hot climates is less intense than that required in the mild-climate protocol (Table ). Observed differences in core temperature between turnout systems made with less breathable constructions (systems D and E) emerge after about 1 h in hot climate conditions (Figure b). These data show that differences in turnout systems made with composites that have different Ref indexes are greater than those observed in the mild-climate conditions. System-related differences in core temperatures at the end of the wear protocol are 0.18 °C in the 35 °C, 40% RH environment (Figure a) and 0.37 °C in the 40 °C, 28% RH environment (Figure b), compared to a 0.14 °C difference in core temperature in the mild condition (25 °C, 65% RH). A physiological firefighter heat strain wear trial showed a difference of 0.13 °C in core temperature between firefighters wearing two different turnout gears after 1 h of exercise simulating extrication activities in a mild environment. Differences in subjective comfort rating, skin temperature and clothing weight gain were also observed [Citation8]. Thus, the observed maximum core temperature difference in this study ranging from 0.14 to 0.37 °C may make a difference on the human body. Most significantly, these data demonstrate that the Ref heat strain index accurately ranks the heat strain performance in hot working environments. They further show that THL is not a useful predictive index of turnout heat strain in hot ambient conditions. For example, systems D and E have high Ref ratings indicative of poorer heat strain performance in hot environments. They nevertheless pass the 205 W/m2 THL heat strain requirement in the current edition of the NFPA 1971 standard. It is important to point out that the worst performing system, as rated by its THL index, is turnout system C. With a THL of only 175 W/m2, this system does not pass the THL requirement in the current edition of the NFPA 1971 standard. Nevertheless, with a low Ref rating, it predicts producing less heat strain when worn in hot working conditions (35 and 40 °C).
Figure 3. Predicted core temperature in hot conditions: (a) 35 °C, 40% RH; (b) 40 °C, 28% RH environment. Note: Met = metabolic equivalent; RH = relative humidity.
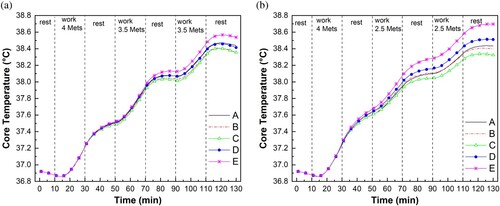
Figure shows the comparative effects of different turnout systems on predicted core temperature at the end of wear sessions conducted in mild (Figure a) and hot (Figure b and c) environmental conditions. Statistically significant differences in core temperature rise were observed depending on the THL and Ref ratings of the composite systems used in the construction of otherwise identical turnout suits. The differences observed depend on the temperature and humidity of the test environment. Composites with bi-component moisture barriers exhibit lower evaporative resistance in mild conditions because of water uptake in the moisture barrier component in the system [Citation5]. At 25 °C, 65% RH, all study turnout garments, with the exception of system C, produce a similar effect on core temperature rise (p < 0.01), as shown in Figure a. In mild conditions, therefore, moisture absorption in the moisture barrier layer contributes to apparent heat loss, offsetting the evaporative resistance difference in bi-component moisture barrier (A, B, D and E) systems. This phenomenon makes these systems perform similarly with regard to heat loss and heat strain.
Figure 4. Predicted core body temperature rise at the end of the protocol: (a) 25 °C, 65% RH environment; (b) 35 °C, 40% RH environment; (c) 40 °C, 28% RH environment. *p < 0.01 (significant); **p < 0.001 (extremely significant). Note: error bar = 99% confidence interval of the mean; RH = relative humidity.
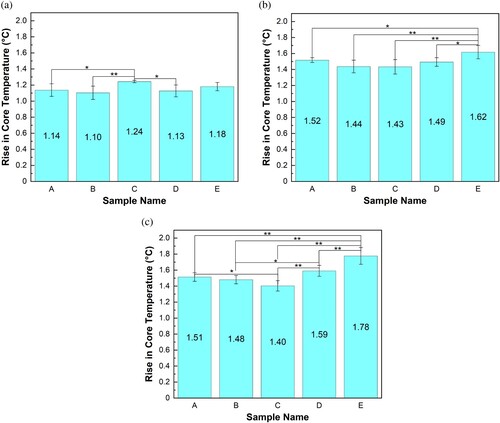
Figure 5. (a) Predicted skin temperature and (b) rise of predicted skin temperature at the end of the protocol in 25 °C, 65% RH environment. *p < 0.01 (significant). Note: error bar = 99% confidence interval of the mean; Met = metabolic equivalent; RH = relative humidity.
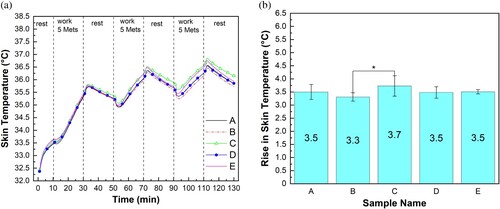
Figure 6. (a) Predicted skin temperature and (b) rise of predicted skin temperature at the end of the protocol in 35 °C, 40% RH environment; Note: error bar = 99% confidence interval of the mean; Met = metabolic equivalent; RH = relative humidity.
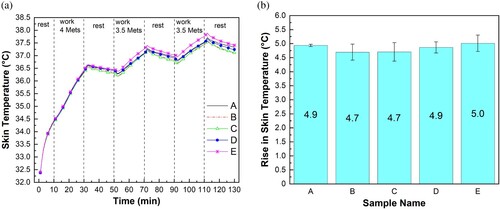
Figure 7. (a) Predicted skin temperature and (b) rise of predicted skin temperature at the end of the protocol in 40 °C, 28% RH environment. **p < 0.001 (extremely significant). Note: error bar = 99% confidence interval of the mean; Met = metabolic equivalent; RH = relative humidity.
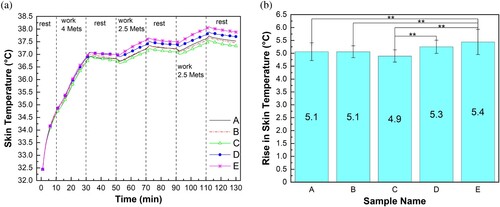
Figure 8. (a) Predicted cardiac output and (b) rise of predicted cardiac output at the end of the protocol in 25 °C, 65% RH environment. *p < 0.01 (significant); **p < 0.001 (extremely significant). Note: error bar = 99% confidence interval of the mean; Met = metabolic equivalent; RH = relative humidity.
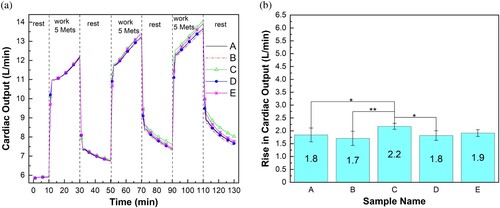
Figure 9. (a) Predicted cardiac output and (b) rise of predicted cardiac output at the end of the protocol in 35 °C, 40% RH environment. **p < 0.001 (extremely significant). Note: error bar = 99% confidence interval of the mean; Met = metabolic equivalent; RH = relative humidity.
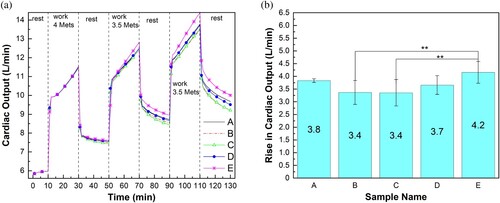
Figure 10. (a) Predicted cardiac output and (b) rise of predicted cardiac output at the end of the protocol in 40 °C, 28% RH environment. *p < 0.01 (significant); **p < 0.001 (extremely significant). Note: error bar = 99% confidence interval of the mean; Met = metabolic equivalent; RH = relative humidity.
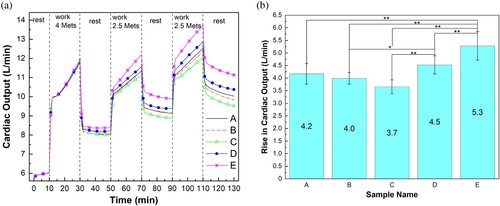
Figure b shows that at 35 °C, 40% RH, only turnout system E shows a significantly different core temperature compared with other turnout garments (p < 0.01). However, significant differences were observed in predicted core body temperature between most of the turnout systems at 40 °C, 28% RH (p < 0.01) (Figure c). This is because the hottest temperature drives moisture from the bi-component moisture barrier systems (A, B, D, and E), thereby affecting their evaporative resistance and observed effect on core temperature.
3.1.2. Relationships between THL and Ref heat strain indexes and skin temperature
Figures a–a show the skin temperature rise predicted when wearing the study turnout systems in the three different environmental conditions. Figure b shows that only turnout system C, the composite with the lowest measured THL index (177 W/m2), causes a significant difference in skin temperature rise by the end of the wear trial regimen at 25 °C, 65% RH (p < 0.01). The end-protocol skin temperature of system C is 0.4 °C higher than that of system B (Figure a). At 35 °C, 40% RH, system E shows the highest predicted skin temperature (Figure a), but no statistically significant difference in skin temperature is apparent (p < 0.01), as shown in Figure b. At the hottest condition (40 °C, 28% RH), systems E and C produced the highest and the lowest skin temperature (Figure a), a statistically significant difference of 0.6 °C by the end of the protocol (p < 0.01) (Figure b). Significant differences also exist among systems A and E, B and E, and C and D (p < 0.01) (Figure b). It was reported that a 0.44 °C higher skin temperature at the end of a 100-min firefighter heat strain wear trial was associated with a lower physiological strain index [Citation15]. Thus, the differences in skin temperature observed in this study could be significant to human heat stress. Compared to core temperature effects, a less significant difference in skin temperature was observed among turnout systems in all environmental conditions. This is due to the higher fluctuations in skin temperature [Citation15]. Skin is more exposed to the environment and has much less mass compared to the whole human body. Thus, the skin temperature can be very sensitive to changes in human activities and environmental conditions, resulting in larger fluctuations than core body temperature.
3.1.3. Relationships between THL and Ref heat strain indexes and cardiac output
Figures a–a show the predicted effects that study turnout systems have on cardiac output in different environmental conditions. The cardiac output prediction was provided by our manikin physiological model. The cardiac output was predicted according to metabolic rate, skin temperature, hypothalamus temperature, vasodilatation, vasoconstriction, etc. More details can be found in Fiala et al. [Citation18,Citation19]. Cardiac output is the product of heart rate and stroke volume. Stroke volume can increase in heat stressful conditions; increased heart rate is the primary driving force behind increased cardiac output [Citation20]. An increase in cardiac output is a physiological response to human heat stress [Citation21].
Figure a and b shows that in mild working conditions (25 °C, 65% RH), system C produces the highest cardiac output, 0.47 L/min higher than system B by the end of work protocol (p < 0.01). A difference of 0.80 L/min was found between the garments with the highest and lowest cardiac output (system E vs system C) in a hot environment (35 °C, 40% RH) (p < 0.01), as shown in Figure a and b. In even hotter conditions (40 °C, 28% RH), it can be observed from Figure a that system E has the highest cardiac output, followed by systems D, A, B and C. The cardiac output of system E is 1.62 L/min higher than that of system C (p < 0.01) (Figure b), indicating higher physiological burden on the cardiac system. It was reported that the cardiac output was increased by 0.36 and 1.57 L/min when resting in the environment of 46.1 °C, 42% RH and 51.7 °C, 42% RH, respectively, compared to the cardiac output when in a comfortable condition (24.4 °C, 42% RH) [Citation22]. Thus, the maximum differences of 0.47, 0.80, and 1.62 L/min between the studied garments at the end of the protocol could be significant.
3.1.4. Relationships between THL and Ref heat strain indexes and sweating rate
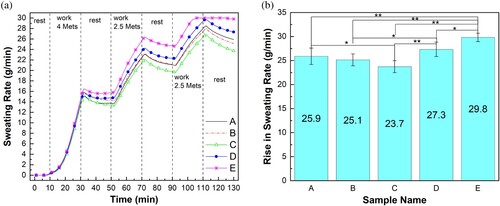
The human body sweats in order to release heat by evaporation. Our physiological model assumes a maximum sweating rate of 30 g/min (1.8 L/h). Figure a and b shows that the turnout system with the lowest measured THL (system C) produces the highest sweating rate in mild climate conditions (p < 0.01). A difference of 3.7 g/min in swearing rate was observed between systems C and B at the end of the protocol (p < 0.01) (Figure b). However, in hot environments, the turnout system with high Ref (system E) elicits the most sweating (Figures a and a). At 35 °C, 40% RH, system E produces a maximum sweating rate around 107 min after the start of the protocol (Figure a). At the end of protocol, system E shows a 3.6 g/min higher sweating rate than systems B and C (p < 0.01) (Figure b). At the hottest climate condition (40 °C, 28% RH), system E reaches a maximum at around 103 min, and the maximum sweating period prolongs, even in the resting stage of the protocol (Figure a). This indicates the intensive heat stress predicted wearing a turnout system with high resistance to evaporative heat loss. Figure b shows that at the end of protocol a significant difference exists between most garments, and a maximum difference of 6.1 g/min was found between systems E and C (p < 0.01). A sweating rate of 33 g/min was reported when doing high-intensity activities in an environment of 35 °C, 50% RH in full protective clothing and 27 g/min when in partial protective clothing [Citation23]. The difference of 6 g/min was associated with a significant increase in heart rate and a reduction in work tolerance time [Citation23]. Thus, the differences in sweating rates found in this research could be significant.
Figure 11. (a) Predicted sweating rate and (b) rise of sweating rate at the end of the protocol in 25 °C, 65% RH environment. *p < 0.01 (significant); **p < 0.001 (extremely significant). Note: error bar = 99% confidence interval of the mean; Met = metabolic equivalent; RH = relative humidity.
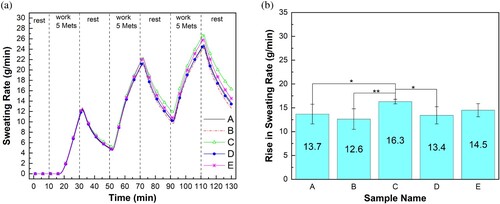
Figure 12. (a) Predicted sweating rate and (b) rise of sweating rate at the end of the protocol in 35 °C, 40% RH environment. *p < 0.01 (significant); **p < 0.001 (extremely significant). Note: error bar = 99% confidence interval of the mean; Met = metabolic equivalent; RH = relative humidity.
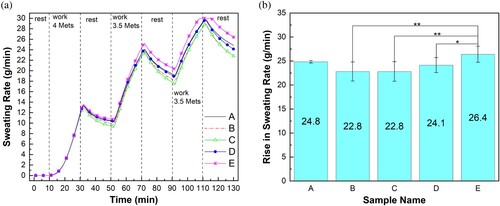
Figure 13. (a) Predicted sweating rate and (b) rise of sweating rate at the end of the protocol in 40 °C, 28% RH environment. *p < 0.01 (significant); **p < 0.001 (extremely significant). Note: error bar = 99% confidence interval of the mean; Met = metabolic equivalent; RH = relative humidity.
The study on the relationships between material properties and predicted manikin physiological responses confirms that the insulation and evaporative resistance of the materials used in the construction of turnout suits significantly influence indicators of firefighter physiological heat stress response. Specific effects depend on the temperature and humidity of the working environment [Citation24]. Environmental effects are so influential that they can completely reverse comparisons of expected heat strain among turnout suit constructions. For example, system C, the turnout incorporating a low THL liner system, while performing the worst in mild conditions, has the least detrimental effect on physiological indicators of heat stress in hot climatic conditions. These data confirm the overwhelming effect of the working environment, showing that even less intense work in hot conditions produces much greater effect on core temperature than work in milder environments. This is the simple explanation of why heat stress is more likely to occur in hot conditions. It is consistent with our recently conducted survey to identify conditions that firefighters associate with heat strain in structural firefighting operations [Citation3]. The Occupational Safety and Health Administration (OSHA) also reported that the majority of heat-related illness among outdoor workers happened in hot conditions [Citation25].
3.2. Correlation between THL/Ref and predicted core temperature
Since the core body temperature is a direct indicator of heat stress, the relationship between predicted core body temperature and measured material properties (THL, Ref) was investigated. Figure a–f shows the correlations observed between THL and Ref heat strain indexes and core temperature rise predicted at the end of protocol when wearing study turnouts in mild (25 °C, 65% RH) and hot (35 °C, 40% RH; 40 °C, 28% RH) working conditions. Pearson correlation analysis confirmed a strong negative correlation (r = –0.99) between THL and predicted core body temperature at 25 °C, 65% RH (Figure a). It shows a strong positive relationship (r = 0.92 and r = 0.96) between Ref and predicted core body temperature at 35 °C, 40% RH and 40 °C, 28% RH (Figure e and f).
Figure 14. THL correlations with core temperature at the end of the protocol: (a) 25 °C, 65% RH; (b) 35 °C, 40% RH; (c) 40 °C, 28% RH. Ref correlations with core temperature at the end of the protocol: (d) 25 °C, 65% RH; (e) 35 °C, 40% RH; (f) 40 °C, 28% RH. Note: Ref = intrinsic evaporative resistance; RH = relative humidity; THL = total heat loss.
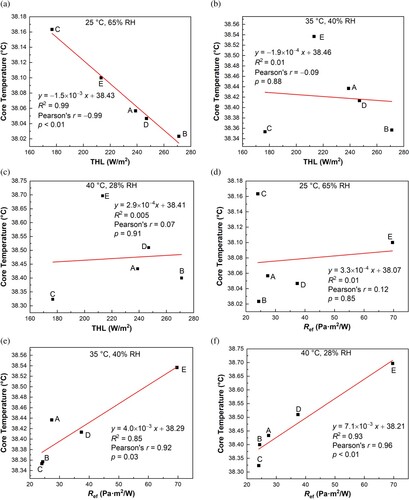
These data show that the THL index correlates almost perfectly with predicted core temperature rise in mild conditions (Figure a); however, it has no value for predicting heat strain in hot conditions (Figure b and c). Conversely, the Ref index correlates with the core temperature increase in hot environments (Figure e and f), but has no apparent correlation in the mild condition (Figure d).
Figure e and f reveals that turnout system E with a Ref value of 70 Pa·m2/W shows a significantly higher predicted core body temperature than the other systems (A, B, C, D) when used in hot conditions. These graphs indicate that, within the limits of the simulation study, the Ref value of turnout clothing fabric should be less than about 45 Pa·m2/W. This criterion could eliminate the use of high Ref systems, such as system E, and reduce potential heat stress issues in hot conditions.
4. Conclusions
In summary, little difference was found in predicted physiological heat strain caused by turnout systems that incorporate breathable moisture barriers when worn in mild environmental conditions, even when high work rates produced metabolic heat sufficient to forecast heat stress in those conditions. Additionally, our studies showed that the THL index had no value for predicting heat strain in hot environments. Measured in non-isothermal test conditions, THL provided an inflated comparison of the ability of many turnout systems to dissipate evaporative heat in hotter working conditions. This is because moisture absorbed in hydrophilic bi-component moisture barriers in mild environments contributes to maximal evaporative heat loss. The evaporative heat loss advantage found in mild environments decreases in hot environments where conditions promoting moisture absorption in systems containing semipermeable barrier materials are minimal. Exclusive reliance on THL as a performance criterion has allowed systems with high Ref values to be certified. It may also preclude consideration of high-thermal protective performance (TPP) systems that fail the current NFPA 1971 THL performance criteria of 205 W/m2 yet perform well in hotter environments.
The comparative value of the THL and Ref indexes for predicting turnout-related heat strain on firefighters depends on the thermal stress level of the intended working environment. THL accurately forecast thermal burden in mild environments (<25 °C); Ref provided accurate prediction in hot environments (>35 °C). Because heat strain is most likely to occur in hot environments, of the two indexes the Ref index is more useful for evaluating turnout heat strain. The findings of this project support inclusion of a performance criterion in the NFPA 1971 standard based on limiting the Ref of turnout materials to no more than 45 Pa·m2/W with a minimum THL rating of 205 W/m2.
Disclosure statement
No potential conflict of interest was reported by the authors.
Additional information
Funding
References
- Cheung SS, Petersen SR, McLellan TM. Physiological strain and countermeasures with firefighting: physiology of firefighting. Scand J Med Sci Sports. 2010;20:103–116.
- Smith DL, Barr DA, Kales SN. Extreme sacrifice: sudden cardiac death in the US fire service. Extrem Physiol Med. 2013;2(1):1–9.
- Barker R, Fang X, Deaton AS, et al. Identifying factors that contribute to structural firefighter heat strain in North America. Int J Occup Saf Ergon. 2021. doi:10.1080/10803548.2021.1987024
- National Fire Protection Association (NFPA). 2018. Standard on protective ensembles for structural fire fighting and proximity fire fighting. Quincy (MA): NFPA. Standard No. NFPA 1971:2018.
- Gao H, Deaton AS, Fang X, et al. Effects of environmental temperature and humidity on evaporative heat loss through firefighter suit materials made with semi-permeable and microporous moisture barriers. Text Res J. 2022;92(1-2):219–231.
- American Society for Testing and Materials (ASTM). 2017.Standard test method for thermal and evaporative resistance of clothing materials using a sweating hot plate. West Conshohocken (PA): ASTM. Standard No. ASTM F1868:2017.
- Barker RL. A review of gaps and limitations in test methods for first responder protective clothing and equipment: a final report presented to National Personal Protection Technology Laboratory, National Institute for Occupational Safety and Health (NIOSH). Pittsburgh (PA): National Personal Protection Technology Laboratory; 2005.
- Stull J, Duffy R. Field evaluation of protective clothing effects on fire fighter physiology: predictive capability of total heat loss test. In: Nelson C, Henry N, editors. Performance of protective clothing: issues and priorities for the 21st century. West Conshohocken (PA): ASTM International; 2000. p. 481-503.
- Myhre L, Barker R, Scruggs B, et al. Effect of measured heat loss through turnout materials on firefighter comfort and heat stress. Part II: performance in a warm environment. In: Nelson C, Henry N, editors. Performance of protective clothing: issues and priorities for the 21st century. West Conshohocken (PA): ASTM International; 2000. p. 535-545.
- Barker R, Myhre L, Scruggs B, et al. Effect of measured heat loss through turnout materials on firefighter comfort and heat stress. Part I: performance in a mild environment. In: Nelson C, Henry N, editors. Performance of protective clothing: issues and priorities for the 21st century. West Conshohocken (PA): ASTM International; 2000. p. 519-534.
- DenHartog E, Fang X, Deaton A. Effects of total heat loss versus evaporative resistance of firefighter garments in a physiological heat strain trial. In: Lehtonen K, Shiels B, Ormond R, editors. Performance of protective clothing and equipment: 11th volume, innovative solutions to evolving challenges. West Conshohocken (PA): ASTM International; 2020. p. 204–221.
- Burke R, Blood K, Deaton AS, et al. Application of model-controlled manikin to predict human physiological response in firefighter turnout gear. In: Burke R, Heiss D, Misius J, et al., editors. Proceedings of the 8th International Meeting for Thermal Manikin and Modeling (8I3M). Victoria, BC, Canada : 2010 Aug 22–26. p. 1–5.
- Deaton AS, Watson K, DenHartog E, et al. Effectiveness of using a thermal sweating manikin coupled with a thermoregulation model to predict human physiological response to different firefighter turnout suits. In: Lehtonen K, Shiels B, Ormond R, editors. Performance of protective clothing and equipment: 11th volume, innovative solutions to evolving challenges. West Conshohocken (PA): ASTM International; 2020. p. 222–236.
- Wang F. Physiological model controlled sweating thermal manikin: can it replace human subjects. J Ergon. 2011;1(1):e103.
- McQuerry M, Barker R, DenHartog E. Relationship between novel design modifications and heat stress relief in structural firefighters’ protective clothing. Appl Ergon. 2018;70:260–268.
- Smith DL, DeBlois JP, Kales SN, et al. Cardiovascular strain of firefighting and the risk of sudden cardiac events. Exerc Sport Sci Rev. 2016;44(3):90–97.
- Parsons KC. Human thermal comfort. Boca Raton (FL): CRC Press; 2019.
- Fiala D, Lomas KJ, Stohrer M. A computer model of human thermoregulation for a wide range of environmental conditions: the passive system. J Appl Physiol. 1999;87(5):1957–1972.
- Fiala D, Lomas KJ, Stohrer M. Computer prediction of human thermoregulatory and temperature responses to a wide range of environmental conditions. Int J Biometeorol. 2001;45(3):143–159.
- Wilson TE, Crandall CG. Effect of thermal stress on cardiac function. Exerc Sport Sci Rev. 2011;39(1):12–17.
- Crandall CG, Wilson TE. Human cardiovascular responses to passive heat stress. Compr Physiol. 2015;5(1):17–43.
- Damato AN, Lau SH, Stein E, et al. Cardiovascular response to acute thermal stress (hot dry environment) in unacclimatized normal subjects. Am Heart J. 1968;76(6):769–774.
- Montain SJ, Sawka MN, Cadarette BS, et al. Physiological tolerance to uncompensable heat stress: effects of exercise intensity, protective clothing, and climate. J Appl Physiol. 1994;77(1):216–222.
- Gao H, Deaton AS, Fang X, et al. Effects of outer shell fabric color, smoke contamination, and washing on heat loss through turnout suit systems. Text Res J. 2022. doi:10.1177/00405175211073353
- Morris CE, Gonzales RG, Hodgson MJ, et al. Actual and simulated weather data to evaluate wet bulb globe temperature and heat index as alerts for occupational heat-related illness. J Occup Environ Hyg. 2019;16(1):54-65.