
Abstract
Objectives. The purpose of this study is to present a model – the safety performance map – that specifies the key factors influencing organizations’ safety performance and suggests the relationships between the identified factors. There is a need for an exhaustive illustration of the path leading to occupational health and safety (OHS) supporting measuring, managing and developing OHS proactively. Methods. A qualitative multiple-case study consisted of three stages: design, iteration and testing of the created model. An interview study was conducted in four companies from different industries, and later the model was tested in three complementary companies. The companies involved represented the metal, food, forest and chemical industries; industrial services; and infrastructure and house construction. Results. The study identified a total of 42 individual factors that fall under the following seven main perspectives on OHS: OHS management, OHS leadership, structure, processes, culture, individual behavior and performance. Conclusions. The study suggests the safety performance map to illustrate the path leading to OHS and indicative causal relationships between the factors affecting it. The same factors affecting OHS recur in all of the included industrial contexts. The study answers the call for proactive performance measurement and more balanced measurement systems for safety.
1. Introduction
Management effectiveness is typically measured by the extent to which organizational performance (e.g., productivity, efficiency or quality) is enhanced and the related goals are attained [Citation1]. Occupational health and safety (OHS) management (or safety management) is known to have a positive effect not only on employees’ health and safety (H&S) but also on overall organizational performance and market competitiveness [Citation2,Citation3]. For example, when an organization has a high frequency of accidents, maximal productivity and quality are unlikely [Citation4]. Hence, more attention should be paid to OHS issues when striving to achieve organizational goals and performance [Citation2,Citation5,Citation6]. Moreover, Veltri et al. [Citation5] suggested that operational excellence should be pursued simultaneously with safety excellence.
Safety performance refers to the effectiveness of the prevention of injury and ill health at work and the provision of safe and healthy workplaces [Citation7]. It can be measured by organizational indicators such as safety climate, absenteeism, ill health and the injury rate [Citation8]. Safety performance may therefore be considered a subsystem of organizational performance [Citation6].
Although the benefits of successful safety management have been identified, organizations face challenges in exploiting the full potential of performance measurement [Citation9], which requires an in-depth knowledge of measurement objects. A descriptive model also helps organizations in proactive safety management.
Successful performance measurement builds upon knowledge on the factors that contribute to the formation of safety and an understanding of what these factors include. In the performance measurement literature, maps have been found to be particularly useful tools for visualizing the logic behind performance measurement [Citation10,Citation11]. The strategy map presented by Kaplan and Norton [Citation12] is a model that can be used to describe the interrelationships between an organization’s strategic goal and related success factors. In their model, factors and objectives are examined from the financial, customer, internal and growth perspectives that correspond to the four perspectives of the balanced scorecard. In terms of measurement, the map helps to outline the set of measurement objects and to identify whether an indicator measuring any critical factor is missing from the measurement system. To our knowledge, the strategy map has not been clearly presented in the research and practice of safety management.
In previous research, several general paths to improve safety performance have been identified, and they often focus on, e.g., safety leadership and safety climate [Citation6,Citation13–16]. Aksorn and Hadikusomo [Citation17] state in their research that management support is the factor having the greatest influence on safety performance. Some studies [Citation18–20] have aimed to connect indicators to different OHS perspectives, actions, components or factors. While the existing literature has identified factors contributing to safety, the emphasis has generally been on individual components rather than describing a more all-encompassing picture of the factors affecting safety performance. Thus, there is a need to specify more detailed key factors affecting safety performance and to identify the relationships between the factors.
In addition, the challenge of previous studies has often been the inability to generalize the findings of the research. In particular, a comprehensive description of the factors contributing to safety performance has been found difficult to form as different factors often appear in studies only as individual cases specific to a certain company, and thus a generalizable description cannot be created [Citation3,Citation6]. In addition, factors have often been studied in a single industry, which can vary from, e.g., the automotive industry [Citation3] and the construction sector [Citation17,Citation21,Citation22] to safety-critical industries, such as the oil industry [Citation23], and rarely has the issue been studied simultaneously in several complementary industries.
The purpose of this article is to provide a comprehensive overview of the factors that affect safety performance and an elaboration of individual factors. Further, the aim of the study was also to create an externally valid safety performance model suitable for different industrial sectors.
2. Literature review
2.1. Safety management and safety leadership
Safety management is performed at the top, middle and frontline management levels [Citation24]. Management tasks vary according to the organizational level of the manager, but some examples of common managerial tasks include setting objectives, ensuring resources, monitoring performance and rewarding [Citation8,Citation24,Citation25,p.74–75]. In the literature, management and leadership are conventionally differentiated because of their dissimilar processes or roles, but both roles are necessary [Citation1,p.25]. In particular, leadership is said to play a significant role in safety management in organizations [Citation25,p.74]. According to Yukl [Citation1,p.26], leadership can be defined as a process of influencing others to understand and agree on what needs to be done and how it will be done. Yukl [Citation1,p.26] further states that leadership includes a process that facilitates individual and collective efforts to achieve common goals.
Leadership can be divided into transactional and transformational leadership styles. Examples of factors associated with transactional leadership include setting objectives, monitoring employee performance and rewarding or giving corrective feedback on performance [Citation15]. A transformational leader shows interest in employees and encourages employees to commit to goals [Citation15,Citation26]. Thus, transformational leadership can be seen to include factors such as managers acting as a safety role model [Citation27] and a constructive dialog between management and employees, the latter being found to play a key role in successful safety interventions and safety improvement [Citation8]. The opportunity to engage in dialog contributes to the formation of an open atmosphere in the company [Citation28,p.96].
In part, the same management and leadership practices related to transactional and transformational leadership styles, such as communication, management commitment, rewarding and employee involvement, have been associated with safety performance in a number of studies, e.g., some studies [Citation8,Citation29–32] state that the commitment of both employees and management to OHS and the size of the company are the main factors influencing safety performance.
2.2. Structure, processes and culture create a climate for behavior
Many researchers seem to agree that leadership greatly influences employee behavior, which in turn has an impact on performance [Citation1,p.31,Citation33–35]. Although research generally emphasizes employees’ safe behavior, it should be noted that safe behavior is not confined to the employee level alone but that there are certain desirable behaviors at each level of the hierarchy that help promote safety [Citation24,Citation36,Citation37,p.22]. Yukl [Citation1] suggests that managerial leadership skills influence managerial behavior, which in turn has an effect on employee behavior as well as the attitudes through which the organizational performance is influenced. For these reasons, the term individual behavior, which encompasses the behavior of all members of the community, could be used instead.
According to Guldenmund [Citation38], behavior takes place in a context that three different perspectives – structure, processes and culture – together create. Guldenmund [Citation38] sees these three components interacting to achieve the desired level of safety. Structure refers to formalized prescriptions on how the members of an organization relate to each other and perform their work [Citation39], and they are specific to each location [Citation38]. Processes refer to core business processes and support processes common to the entire organization [Citation38]. Management processes and systems are examples of primary-level organizational processes, but the processes may also relate to communication, social relationships and information exchange between individuals in the organization [Citation40]. Processes and structure have received less attention in research, perhaps because of their straightforward and understandable nature. However, their content is still not self-evident and requires clarification. Instead, culture has been one of the major interests in safety management research.
Excellent safety culture is often seen as leading to improved OHS and organizational performance, and culture, in turn, is greatly influenced by management [Citation8]. Safety culture is defined as a combination of attitudes, beliefs, motivations and choices about safety among both management and employees [Citation8]. The aim of safety culture is to develop a norm in which employees are aware of the safety risks prevailing in the workplace and are able to take them into account in their activities [Citation41]. Culture is often examined by looking at factors under themes such as communication, management engagement, employee participation, training and reporting [Citation42,Citation43], which, however, may equally be seen as components of, e.g., processes or management. This only underscores the complicated interrelationships between different safety-related activities and measures.
The concepts of safety culture and safety climate are close to each other. Flin et al. [Citation44] describe climate as a description of culture at some point in time – a ‘snapshot’ of sorts. Safety climate is often described as comprising a general perception of current safety-related situations, such as management commitment to safety, safety training, working conditions or procedures, while safety culture is more related to safety values, assumptions and norms [Citation45]. Guldenmund [Citation46] states that safety climate is part of culture and is therefore also influenced by processes and structure. One might thus think that a change in structure or processes affects what kind of situational ‘snapshot’ of culture one gets. Based on these aspects, in this study climate is seen as an umbrella concept for the whole of structure, processes and culture.
2.3. Organizational performance
As already noted, safety management and, in particular, safety leadership and safety culture (or climate) have a major impact on safety performance. Wu et al. [Citation6] explain this relationship by stating that there are two paths through which leadership influences safety performance. Leadership can affect safety performance either directly or by having safety management first affect safety climate, which then affects performance.
The chain describing the relationships does not terminate in safety performance, but safety performance continues to contribute to other parts of the overall performance of an organization, such as by reducing accident costs and improving productivity (output/input ratio) [Citation47]. In fact, safety performance is part of organizational performance along with competitiveness performance and economic-financial performance, both of which eventually translate into economic impacts [Citation2].
One way to classify an organization’s positive safety impacts is to distinguish between indirect and direct impacts. Direct impacts refer to observable and easily quantifiable effects, such as production downtime and H&S personnel time [Citation48]. The indirect effects of safety are formed in such a way that safety first impacts direct factors, such as production downtime, which in turn can have indirect effects [Citation2]. Potential indirect safety impacts include increased productivity and better product quality [Citation3,Citation5,Citation48,Citation49], improved customer satisfaction [Citation5,Citation50], innovation [Citation2,Citation49] and reputation [Citation2,Citation50]. Fernández-Muñiz et al. [Citation2] describe such effects as part of the competitiveness performance dimension as they are considered to be determinants of competitive advantage.
2.4. Synthesis: framework for OHS management and organizational performance
A theoretical framework was constructed based on the literature presented in this chapter. The framework conjoins the perspectives of the organizational triangle [Citation38]; the framework of leadership’s impact on organizational performance [Citation34]; the framework of leaders’ characteristics and behavior and employees’ job attitudes and behavior [Citation1]; and the framework of the relationship between safety leadership, safety climate and safety performance [Citation6]. The constructed framework is shown in Figure .
Figure 1 Interaction between OHS management and leadership and the organization’s structure, culture and processes to generate the desired level of OHS and organizational performance. Note: Modified from [Citation1,Citation6,Citation34,Citation38]. OHS = occupational health and safety.
![Figure 1 Interaction between OHS management and leadership and the organization’s structure, culture and processes to generate the desired level of OHS and organizational performance. Note: Modified from [Citation1,Citation6,Citation34,Citation38]. OHS = occupational health and safety.](/cms/asset/74957b2f-0bce-4812-9a6e-cbb7bd40931d/tose_a_2061759_f0001_ob.jpg)
The framework is a description of a chain that begins with OHS management and leadership and leads to OHS performance, which is ultimately reflected in organizational performance. OHS performance and organizational performance on the right side of the model denote the end result of the work done for safety. On the left are the things that can be influenced to ensure that OHS performance and organizational performance are successful. In conclusion, the framework suggests that OHS management and leadership are premises for achieving excellence in OHS performance. Both management and leadership [Citation34] and the trinity of culture, processes and structure [Citation38] affect individuals’ behavior. In this model, culture, processes and structure are seen together to form safety climate. All of these perspectives affect both the OHS performance as well as the organization’s overall performance [Citation6,Citation34,Citation49]. Table presents the previous literature concerning the perspectives of the framework and the possible factors or components linked to each of them.
Table 1 Main perspectives affecting safety performance identified in the literature.
3. Methodology
The study was conducted as a qualitative multiple-case study. The study consisted of three different stages: design, iteration and testing of the safety performance map. The purpose of the first stage was to identify the factors that affect the fulfillment of safety performance and use the information to create a visualization of this. The theoretical framework served as the first version of a safety performance map describing the key factors of safety performance. The model was then supplemented with empirically identified individual factors. The purpose of the iteration stage was to examine the validity of the assumptions made on the basis of the interview material of the design phase and, thus, the first version of the map. The testing was made for the iterated version of the map. The aim at the testing stage was to test the presented relationships between the factors, to assess the relevance of the factors and to identify any missing elements. The study involved the same four companies in the design and iteration stages, and an additional three companies in the testing of the safety performance map. The company details are presented in Table .
Table 2 Background information about the case organizations involved in the design and iteration stages of the study and the companies involved in the validation of the safety performance map.
Empirical data were gathered mainly through group interviews. Group interviews were chosen instead of individual interviews to obtain safety experts’ perceptions in dynamic group interactions. The group interviews enabled the group to form a shared view representing the company’s and the industry’s practices. In a successful group interview, the group dynamics stimulate interviewees to produce rich information about the phenomenon of interest [Citation58,p.162], which was needed to gain qualitative information on the contents of various factors. Group interviews were held with different group compositions at different stages of the map creation (design, iteration and testing).
The design of the safety performance map was conducted in four large Finnish organizations operating globally in manufacturing; food processing; infrastructure; and environmental, facility and industrial support services. The design of the safety performance map was based on the qualitative data from the group interviews organized separately in each of the four case companies. The group interviews were attended by expert groups consisting of safety and quality experts of the companies. The group interviews were attended by two to seven interviewees from each company, and the events were facilitated by two or three university researchers. There are differences in the number of the interview representatives, as the size of the safety organizations varied in different companies. The interviewees were appointed by health, safety and environment (HSE) directors of the companies in alignment with the purpose and objective provided by the researchers, i.e., the employees best knowledgeable of the issues under investigation were selected. The numbers of participants in the group interviews and the distributions of the work descriptions are presented in Table .
Table 3. Interviewee profile of the design stage of the map.
At this point, two group interview events were held in each company. In the first interview event, the factors that fell under the umbrella of each perspective were identified, and the second event delved into possible causal relationships between the factors. The summary of the design stage is presented in Table .
Table 4 Summary of the design stage.
The group interviews were not recorded in order to preserve a transparent and natural atmosphere. One researcher was dedicated to carefully documenting the discussions via written notes. The analysis of the group interview material was conducted through qualitative content analysis in Microsoft Excel for Microsoft 365 MSO (16,0) by coding the discussion data from the interviews conducted in the four case companies. The purpose of this was to identify factors recurring in different discussions to create an interpretation of the presented content and to summarize the data. The case organizations were kept separate when analyzing the results. As a generalizable result was sought for the map, it was not desired to highlight any individual observations. For this reason, a factor was included in the map only if it had been repeated in the interview responses from at least two companies.
As a result of the first group interviews, a more specific model – the safety performance map – was designed. The first version of the safety performance map complemented the theoretical framework presenting the main perspectives of safety with a more detailed description of the factors affecting safety performance.
In the iteration stage, the first version of the safety performance map was evaluated in joint group interviews in two different groups – a group of industry representatives and a group of external safety experts (see Table ). One or two researchers attended each group. Both of the groups were posed a list of questions relevant to their roles. The group interviews were attended by the same interviewees from the companies as at the design stage, but this time there were fewer participants from the companies. This was because the interviews of the first stage (the design) and the second stage (the iteration) had different logic that affected the size of the interview group. The first step was to reach a larger group in order to gain the widest and most comprehensive view of the company’s safety performance experiences. In the iteration stage, it was no longer necessary to obtain the widest possible range of participants from the companies, as the purpose of the stage was only to examine whether the assumptions made on the basis of the design stage interview material were valid. The group interview was also attended by two external safety experts representing public authorities and a research organization familiar with safety research. The experts have a societal role, and they represent the public authorities responsible for supporting the ability of companies to operate safely. In this research, the task of the experts was to comment on the map especially from an academic point of view, and thus to compare the ideas presented with what is commonly known based on the existing safety management literature. The result of this stage was the iterated version of the safety performance map to which the modifications were made based on the interview answers.
Table 5 Summary of the iteration stage.
Finally, the map was tested in three new companies using a semi-structured, qualitative group interview method (see Table ). The companies that participated in the testing were from the fields of forestry, chemicals and construction. Again, the interviewees represented the safety and quality experts of the organizations. An OHS or health, safety, environment and quality (HSEQ) manager from each company was contacted and invited to join an interview organized via a video conference platform. The managers were given the opportunity to invite to their interviews other representatives of their company that they deemed appropriate. Two representatives from two companies participated in the interviews, but only the HSEQ manager was present from the third company. However, as in the iteration stage, the maximum number of interviewees in the testing stage was not essential, as the main purpose was to verify the correctness of the assumptions made. Each company had a separate personal interview. The interviewees were asked to evaluate each factor of the safety performance map individually.
Table 6 Summary of the testing stage.
At the end of the testing stage, the last and the final version of the map was created. The testing stage also provided information on the factors’ industry-specific nature and the more detailed content and sub-factors of each factor.
4. Results
The safety performance map was constructed from perspectives identified in the literature, which in turn consist of different numbers of empirically identified factors explaining them. Each factor has been elaborated and explained in more detail, and the description can contain several different items, i.e., even more detailed sub-factors. In the following sections, the results of each study stage are examined in detail.
4.1. Identifying the factors of the safety performance map
Several factors affecting safety performance were identified from the group interview material, but only some of the factors were mentioned by more than one company. Table presents all of the identified factors, including the omitted factors that occurred only once and were thus not included in the map.
Table 7. Codes used for group interview data classification.
The map was constructed mainly according to the factors presented in Table . However, some changes were made by the researchers, e.g., some factors were repositioned under different perspectives. These changes mainly concerned the factors mentioned in the interviews as being part of the OHS performance perspective. From the perspective of OHS performance, a number of different factors were mentioned in the interviews, but later in a meeting of project researchers it was stated that OHS performance is ultimately about the realized level of safety and its measurement by using leading and lagging indicators. Consequently, the OHS performance perspective was simplified to contain only two factors – leading indicators and lagging indicators. The other factors in relation to OHS performance – the development of a measurement system, positivity and performance transparent at all levels – were repositioned on the map to be part of processes. All of the mentioned factors were found to be related to development, which can be thought of as a process.
When asking the interviewees to prioritize the named factors of safety, especially the factors of induction, communication, clear responsibilities and safety as part of everyday work were emphasized. However, the prioritization did not produce significant results, as each factor mentioned in the prioritization was included in the map in any case, at least in such a way that the factor could be considered to be included under some broader concept. The interviewees also did not find very significant causal relationships at this point of the process. Some causal relationships between the different factors were found, but the number of relationships found remained quite small, and the relationships identified were not considered to be particularly strong or uncomplicated. The subject also did not provoke much discussion in the interviews. For these reasons, the research illustrated the first version of possible causal relations based on the interviews, the literature and general knowledge. The correctness and credibility of the proposed connections were validated later in the iteration and testing stages.
4.2. Iteration of the safety performance map
The iteration of the safety performance map was done based on an evaluation with the representatives of the participating companies involved in the creation of the map and external safety experts. The commenting was mainly positive although some modifications were made to the map on the basis of the issues raised in the discussions (see Table ).
Table 8. Summary of the discussion.
In addition to the discussion on missing factors, some other suggestions for improvement were made in the group interview. The use of the terms ‘employee’ and ‘attitude’ in the title of the ‘Employees’ attitudes and behavior’ perspective was questioned. Both group interview groups were critical toward the word ‘attitude’. Some of the business representatives stated that their organization tries to avoid using the term attitude due to its complicated nature. According to the experts, the problematic nature of the term stems from the fact that workplace structures dictate what an individual is able to do. In addition, the experts criticized the word choice of ‘employee’ and suggested instead using the term ‘individual’. The choice of words would then also cover supervisors and emphasize the commitment to safety of each member of the organization.
Two-part factors, such as ‘Safety awareness and understanding safety reasoning’, were seen as challenging as the two terms were perceived to have altogether different meanings. Therefore, the factors were divided into the following distinct factors, which more accurately represent only one single theme: safety awareness; understanding safety reasoning; commitment; and safety in thinking. These new differentiated factors were placed in locations where they were seen to fit better. Safety awareness was placed as the first factor in the list under the perspective of individual behavior, and understanding safety reasoning was placed to follow compliance under the same perspective. Further, commitment remained in the same place under the cultural perspective, but the factor of safety in thinking was considered to be the last factor under the perspective as keeping safety in mind at all times reflects a mature level of safety and can be seen as a result of the successful development of a safety culture.
4.3. Validation of the safety performance map
The final testing and validation of the safety performance map was conducted through semi-structured, qualitative group interviews in house construction, forestry and chemical industry companies.
4.3.1. Relevancy of chosen factors and possibly missing elements
The relevance of the selected indicators was tested by asking the interviewees to spontaneously name the five most important safety factors in their company and then to mention five safety-related issues that they think will increase in importance in the future (see Table ). The factors that were not included in the previous version of the map are highlighted.
Table 9 Factors mentioned in the testing stage.
Factors that were not in the previous version of the safety performance included empowerment, management commitment, harmonization (common operating models for key issues, such as unified roles, responsibilities and guidelines at the corporate level), the deployment and testing of new technologies, risk assessment, consideration of process and machine safety, and forward-looking behavior and increasing the number of safety actions. Of these, driving forward and increasing the number of safety actions was added to the map as a form of ‘participation’. This was interpreted to be related to the behavior of individuals and to mean personnel’s active participation in safety activities and safety promotion. Participation was considered as a counterweight to empowerment associated with OHS leadership, which also received confirmation and thus was permanently placed on the map. Moreover, risk assessment, which was identified to be an essential process, was added to the map.
In addition to the factors mentioned earlier, ‘performance discussion’ was added as a new factor under the perspective of OHS management, and ‘fairness’ was added under the heading of culture. In several participating companies, rewards and sanctions were seen as somewhat problematic and the direct transition from monitoring to these as controversial. It was felt that, especially before moving to sanctions, there should be a stage to discuss the causes of the injury or accident. A testing stage interviewee then suggested adding a performance discussion, the method used in their company, to the map. Fairness referring to positivity and justice was mentioned for the first time in an interview in the design stage of the safety performance map, but at that time the matter had not yet been further confirmed in other companies.
The research team decided to replace the factor ‘standards and regulations’ with the factor ‘internal rules’. According to the researchers, standards and regulations mainly cover only the guidelines prescribed by law, but in practice many companies’ own safety guidelines and practices are more important and stricter than those required by law. The term ‘supplier contract management’ under the perspective of ‘processes’ was also modified as it was considered to be too narrow in its description. The term ‘contract’ was omitted, and the factor thus became supplier control, covering a broader description.
In one of the testing stage interviews, sustainability was believed to be a common value for all modern companies. Interviewees suggested that sustainability would have an impact on the company’s reputation. The research team felt that the comment was valid but that perhaps one aspect of sustainability – social sustainability – should be emphasized, especially with regard to occupational safety. Therefore, social sustainability, which refers to the promotion of well-being, was added to the new perspective of performance. At the same time, the term ‘cost reduction’ was changed to a broader concept of cost management, and ‘customer satisfaction’ was fine-tuned to cover a wider range of stakeholders.
4.3.2. Relationships between the factors
The relationships between the factors were tested with the same two questions as for relevancy, i.e., by asking interviewees to name five basic safety requirements and then five safety-related issues that will increase in importance in the future. The idea was that the answers would inform about safety maturity and thus the order between the factors. The assumption was that the five factors named for the first question could describe a lower level of maturity, and the latter five factors correspondingly a higher, more advanced level of maturity. However, since many of the same factors were repeated in the answers to both questions, no such direct conclusion could be drawn. Instead, it seems that the same factors remain important, but according to the level of maturity they are specified with some defining.
The interrelated order of the factors involved in the individual behavior perspective aroused much comment and wonder. The description of the factors was further clarified, and their order was re-examined. In the test stage interviews, compliance was perceived as the ‘most negative’ of the factors and was thus found to be first in order. Alternatively, safety awareness was considered to mean the same as understanding safety reasoning. For this reason, safety awareness was defined more precisely as meaning the necessary awareness of workplace hazards and awareness of the existence of safety procedures, which justifies its position as the first of the behavioral factors. The factors of compliance and self-management were also more appropriately placed on the map.
4.3.3. Industry-specific features
A characteristic feature of the construction industry is its project nature, which was also evidenced in the interview with the house construction company during the testing stage and the infrastructure company previously involved in the safety map preparation. The interviews with the two companies revealed that it is typical in a project’s organization that work environments are not permanent and that the business is geographically dispersed to distant locations. It was assumed that the project nature of the construction industry would be reflected on the map as certain industry-specific features. For example, the requirement for flexible OHS structures was assumed to be related, in particular, to project-based activities and thus to the construction industry. However, this does not seem to be the case. The house construction company did not recognize flexibility as a fundamental requirement for its occupational safety-related structures although flexibility is otherwise an important part of their business. Instead, the company aimed to harmonize practices and OHS structures at the group level.
But then again, the infrastructure company noted that the organizational structure differentiates in all of their business units. Also, the manufacturing company, which operates globally in several locations, noted that due to differences in local legislation and regulations it perhaps is not possible to expect that the policies, roles and responsibilities will be the same in all units of the company. Thus, the need for flexibility can perhaps be better explained by the large number of units, the large size of the company or several different business areas of the company than by project-based operations.
According to the interviewees from the house construction company, the project manager has great influence on the site culture. Some managers may follow safety guidelines more strictly than others in another project, which may lead to the emergence of subcultures and confusion among employees. The representatives of the infrastructure company also found it challenging to ensure that cultural change progressed throughout the organization. This can be challenging in a context where a company has units around the country or even around the world. The units have different professional groups, each with their own culture, working together. Even though the existence of subcultures did not arise for companies representing the manufacturing industry, it may still be that the explanation is related to business fragmentation in the same way as in the case of OHS structure rather than the industrial sector itself.
In conclusion, it can be presumed that different views or emphases of companies on the factors influencing safety performance may not be explained by differences among industrial sectors but that, e.g., the size of the firm, geographical fragmentation and the stage in the firm’s life cycle may explain subtle differences in factors. In general, it can be said that it is challenging to draw more general conclusions about how context influences outcomes. This can be interpreted to mean that the resulting safety performance map with this given accuracy would be quite generally applicable.
4.4. The final version of the safety performance map
In total, 42 individual factors were identified in the study. The factors are divided under the perspectives of the initial framework. The final version of the safety performance map incorporates the OHS performance perspective into organizational performance, as Fernández-Muñiz et al. [Citation2] suggest. Causal relationships have been found between some factors, and the interrelationships of the factors in some chains can be seen, in part, as describing the maturity stages of OHS performance. The safety performance map is illustrated in Figure .
Figure 2 Safety performance map. Note: H&S = health and safety; OHS = occupational health and safety.
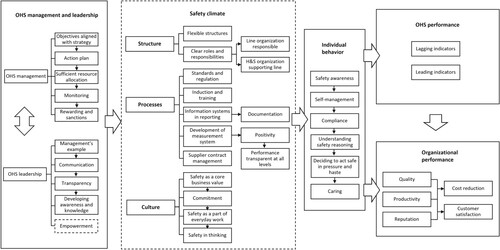
The identified factors are described in Appendix 1. The perspectives of OHS management and leadership were combined in the initial general framework, but were separated out for the final version of the safety performance map as some of the interviewees naturally spoke on the topics separately, and the division has long been recognized in the literature. In line with the division, matters related to the management of things were placed under the heading of management, and issues related to leading people were placed under the leadership perspective. However, management and leadership can be identified as having a two-way relationship as they affect each other, and neither is realized without the other.
According to the interviews conducted in the study, the best starting point for successful OHS performance is in the business strategy, which in turn is influenced by the company’s vision. Safety itself may be prominently embedded in a company’s strategy, but even if it is not, safety still supports the realization of other aspects of the strategy, such as profitability. Management should ensure that sufficient resources are available to carry out the required safety actions, such as inspections and development work. The interviews revealed that the designation of responsibilities and persons relevant to safety is critical. Resources were found to be related to the strategy. According to a comment from an interview with the service company, even if safety was included in the strategy, the results would not be achieved without the allocation of additional resources to the implementation of safety-related activities. On the contrary, however, results are obtained even if safety requirements are not recorded in the strategy as long as management is committed to safety and directs resources to safety activities.
Clear roles and responsibilities refer to the matter of organizational structure, in which every member of the company understands their own role and responsibilities in regard to safety. The line organization is responsible for the implementation of safety. Correspondingly, the role of the H&S organization is to act in a role that supports the line organization in their safety activities. The tasks of the safety organization include the development and planning of safety actions. According to the interviews, safety is, above all, a part of other management processes, although several processes unambiguously specific to OHS management can also be named. Of the individual processes, training and induction were mentioned most often, with three out of four companies mentioning them. Processes are traditionally considered as continual, and therefore they are not organized in a specific order, and there are no causal relationships between the identified factors.
Regarding organizational culture, safety as a core value refers to manifesting safety to be a value for the entire organization. In some companies, this may even be written in the value statement. Other factors mentioned in the interviews, such as fairness and commitment, should be common to all members of the organization and thus part of the culture.
Under the perspective of individual behavior, a clear order was found between the identified factors. The order was also seen to reflect the safety maturity levels of an organization from the individual’s safety awareness, compliance and self-management to participating in improving safety and caring for the safety of oneself and others.
The last perspective on the map, performance, describes which areas of a company’s performance can be influenced through the perspectives and factors described. The most obvious part of a company’s performance that is attempted to be influenced through OHS management is, of course, safety – in this case, the absence of incidents and accidents. However, other indirect performance effects can also be achieved through safety-enhancing work. The study found that safety affects quality, productivity and social sustainability. Safety, directly or through the aforementioned factors, can continue to have an impact on the satisfaction experienced by different stakeholders, cost management and company reputation.
While in visualization, the chain ends with organizational performance, in reality the process is iterative. The state of the factors on the map can be examined at a certain point in time. Comparing the status of the factors allows an examination of, e.g., how a change in one factor affects other factors and the outcome, i.e., performance.
5. Discussion
The aim of this study was to determine the various factors influencing the level of safety in companies and to provide an indicative proposal of possible causal relationships between the factors. The results are presented visually as the safety performance map, a strategy map of sorts that is believed to be a new approach in the practice of safety management. The presented map supports, in the first and important step, designing measures and measurement methods for safety, i.e., the definition of relevant measurement objects [Citation59]. While safety performance has traditionally been measured by organizational indicators such as safety culture or safety climate, absenteeism, ill health and injury rate (e.g., [Citation8,Citation60]), the proposed framework focuses on identifying in detail the factors and causal chain affecting safety performance. Safety climate or culture are typically measured, e.g., by audits, questionnaires and maturity models [Citation61–64], and the map supports further developing their validity
The framework is founded on the safety management literature, and the model is supplemented with empirical data from group interviews conducted in companies in different industries. On the basis of the existing literature, the chain contributing safety activities to generate the desired level of safety and other organizational performance impacts was thought to consist of the following perspectives: OHS management and leadership, culture, processes, structure, safety climate, individual behavior and organizational performance. The created framework thus combines the perceptions of the organizational triangle [Citation38] and the frameworks of leadership’s effect on organizational performance [Citation34]; the impact of leaders’ characteristics and behavior on employees’ job attitudes and behavior [Citation1]; and the relationship between safety leadership, safety climate and safety performance [Citation6]. This study advanced the current knowledge and the presented frameworks by uniting the models to describe the whole chain of different perspectives affecting safety and identifying the individual key factors defining each of the perspectives.
Each perspective consists of a different number of factors identified empirically. Many of the identified factors, especially under the perspectives of OHS management and leadership and performance, are widely supported in the extant literature. Similar to the results of this study, previous studies have identified productivity, quality, stakeholder satisfaction, costs and reputation as areas of performance affected by safety and safety promotion [Citation2,Citation3,Citation5,Citation48,Citation50], while social sustainability seems to emerge as a rather new factor compared to the previous academic literature [Citation65].
Several factors from the OHS management and leadership perspectives, such as communication, role modeling, resource allocation, rewarding and empowerment, have been linked to OHS performance in several studies [Citation2,Citation8,Citation29–31,Citation48,Citation66]. However, e.g., accountability (i.e., whether what has been agreed is being done), which has been emphasized to be a significant factor in the OHS management process [Citation51], is lacking from the description created in this research. However, it can be questioned as to whether the content of the accountability factor would already be included in some other factor mentioned in the map. Then again, the study identified new factors compared to previous studies, such as transparency.
Also noteworthy in this study is that management commitment was not highlighted as an individual factor but was seen to be reflected in other management factors from the OHS management and leadership perspectives. While management commitment has been emphasized in studies as one of the most significant factors affecting safety [Citation32], some studies also suggest that it is reflected in, e.g., the allocation of resources [Citation2] and behaving as an example [Citation26,Citation66]. Further, in this research, commitment has been seen as part of an organization’s culture rather than leadership. This, together with the fact that the safety performance map speaks of individual behavior instead of employee behavior, underscores the commitment of all members of the community to safety, not just managers.
The study involved companies from several industrial and construction sectors. The wide range of participating companies provided an opportunity to examine industry-specific features and, alternatively, to confirm the generalizability of the results. Based on the findings, the safety performance map described with the presented accuracy can be considered applicable in different industries. However, although the perspectives and factors affecting safety performance are mainly the same in different industrial sectors, the relative importance of these factors may vary according to the context, i.e., the industry, the size of the company, the geographical location, the specific features of the organizational structure and the stage of the company’s life cycle. In addition, it is possible that the factors described at this rather general level will be specified according to some topical and relevant issues.
This study also has limitations that should be acknowledged. It should be noted that the number of informants varied between the industry contexts included, and therefore context-specific findings should be interpreted with caution. Moreover, the qualitative data collected from workshops and interviews were large and complex, and the thematic analysis and interpretation were somewhat subjective. Interpretations had to be made about which factors to include in the map and whether some factor belongs to a certain category or not. To improve the reliability of the data analysis and reduce subjectivity, the analysis results were reviewed with the workshop participants.
The safety performance map should not be regarded as an exhaustive description of the factors affecting OHS performance but as a useful tool for identifying the factors that are relevant. The causal relationships proposed in the map are to be considered as indicative proposals, and further research is required to test them. For further research, this study provides a basis for designing surveys and implementing survey studies on the factors affecting safety or on the relationships between various antecedents of safety. Additionally, based on the study, it seems that emphasizing different factors may not be very industry-related and that explanatory factors may be more subtle. For example, firm size, geographical dispersion and life cycle stage may explain the differences, but this requires further research. Therefore, in the future, further qualitative studies on how the presented factors occur in different contexts could be conducted in more specific contexts with regard to what the specific characteristics of the presented perspectives and factors are.
6. Conclusions
This study provided an illustration – the safety performance map – of the path leading to good OHS and indicative causal relationships between the factors affecting it, providing a scientific contribution as follows:
The study elaborates the contents of the various factors essential in improving and analyzing safety. The safety performance map can be considered applicable in different industries since the same factors affecting OHS seem to recur in all of the included industrial contexts.
The study answers the call for proactive performance measurement, which essentially builds upon knowledge on the path toward safety performance.
The safety performance map adds value by outlining the relationship between the factors and the safety maturity of the company even though the relationships were not exhaustively verified.
Moreover, the study proposes a safety performance map visualization as a prospective for several managerial purposes as follows:
The map is proposed to be used as a basis for analyzing the status of performance measurement (i.e., which aspects of the map are measured) and designing a more balanced measurement system for safety.
The map is proposed to be used as a basis for analyzing the status of safety management and identifying means for developing safety (e.g., which factors explain the changes of lagging indicators representing the perspectives on the right-hand side of the map).
The map can also be used in the implementation of safety strategies and in the allocation of H&S budgets by emphasizing the linkage between safety investments and performance impacts.
The map can be useful in forming the hierarchy in information systems and reports, and as a means of OHS communication at the levels of companies, industries and society.
Acknowledgements
The authors acknowledge the research funding provided by the Finnish Work Environment Fund, participating companies and Tampere University.
Disclosure statement
No potential conflict of interest was reported by the authors.
Additional information
Funding
References
- Yukl G. Leadership in organizations. 7th ed. Upper Saddle River (NJ): Pearson Prentice Hall; 2010.
- Fernández-Muñiz B, Montes-Peón JM, Vázquez-Ordás CJ. Relation between occupational safety management and firm performance. Saf Sci. 2009;47(7):980–991.
- Köper B, Möller K, Zwetsloot G. The occupational safety and health scorecard – a business case example for strategic management. Scand J Work Environ Health. 2009;35(6):413–420.
- Carder B, Ragan PW. A survey-based system for safety measurement and mprovement. J Safety Res. 2003;34:157–165.
- Veltri A, Pagell M, Behm M, et al. A data-based evaluation of the relationship between occupational safety and operating performance. J Saf Health Environ Res. 2007;4(1):1–22.
- Wu TC, Chen CH, Li CC. A correlation among safety leadership, safety climate and safety performance. J Loss Prev Process Ind. 2008;21(3):307–318.
- International Organization for Standardization (ISO). Occupational health and safety management systems – requirements with guidance for use. Geneva: ISO; 2018. Standard No. ISO 45001:2018.
- Hale A, Guldenmund F, van Loenhout P, et al. Evaluating safety management and culture interventions to improve safety: effective intervention strategies. Saf Sci. 2010;48(8):1026–1035.
- Bititci US, Ackermann F, Ates A, et al. Managerial processes: business process that sustain performance. Int J Oper Prod Manag. 2011;31(8):851–891.
- Banker R, Chang H, Pizzini M. The balanced scorecard: judgemental effects of performance measures linked to strategy. Account Rev. 2004;79(1):1–23.
- Jääskeläinen A, Roitto JM. Visualization techniques supporting performance measurement system development. Meas Bus Excell. 2016;20(2):13–25.
- Kaplan RS, Norton DP. The strategy map: guide to aligning intangible assets. Strategy Leadersh. 2004;32(5):10–17.
- Fernández-Muñiz B, Montes-Peón JM, Vázquez-Ordás CH. The role of safety leadership and working conditions in safety performance in process industries. J Loss Prev Process Ind. 2017;50(Part B):403–415.
- Kapp EA. The influence of supervisor leadership practices and perceived group safety climate on employee safety performance. Saf Sci. 2012;50(4):1119–1124.
- Tappura S, Nenonen N. Categorization of effective safety leadership facets. In: Arezes P, Carvalho P, editors. Ergonomics and human factors in safety management. Boca Raton (FL): CRC Press; 2016. p. 367–383.
- Williams JH. Improving safety leadership: using industrial/organizational psychology to enhance safety performance. Prof Saf. 2002;47(4):43–47.
- Aksorn T, Hadikusomo BH. Critical success factors influencing safety program performance in Thai construction projects. Saf Sci. 2008;46(4):709–727.
- Podgórski D. Measuring operational performance of OSH management system – a demonstration of AHP-based selection of leading key performance indicators. Saf Sci. 2015;73:146–166.
- Mohammadfam I, Kamalinia M, Momeni M, et al. Evaluation of the quality of occupational health and safety management systems based on key performance indicators in certified organizations. Saf Health Work. 2017;8(2):156–161.
- Janackovic G, Stojiljkovic E, Grozdanovic M. Selection of key indicators for the improvement of occupational safety system in electricity distribution companies. Saf Sci. 2020;125:103654:1-7.
- Sawacha E, Naoum S, Fong D. Factors affecting safety performance on construction sites. Int J Proj Manag. 1999;17(5):309–315.
- Hinze J, Thurman S, Wehle A. Leading indicators of construction safety performance. Saf Sci. 2013;51(1):23–28.
- Tang DK, Leiliabadi F, Olugu EU, et al. Factors affecting safety of processes in the Malaysian oil and gas industry. Saf Sci. 2017;92:44–52.
- Tappura S, Teperi AM, Kivistö-Rahnasto J, et al. Safety management tasks at different management levels. In: Kantola JI, Barath T, Nazir S, editors. Advances in human factors, business management, training and education. Proceedings of the AHFE 2016 International Conference on Human Factors, Business Management and Society, July 27-31, 2016, Florida; [place unknown]: Springer; 2016. p. 1147–1157.
- Lutchman C, Maharaj R, Ghanem W. Safety management: a comprehensive approach to developing a sustainable system. Boca Raton (FL): CRC Press; 2016.
- Zohar D. The effects of leadership dimensions,: safety climate, and assigned priorities on minor injuries in work groups. J Organ Behav. 2002;23:75–92.
- Lu CS, Yang CS. Safety leadership and safety behavior in container terminal operations. Saf Sci. 2010;48(2):123–134.
- Tappura S. The management of occupational health and safety. Managers’ perceptions of the challenges, necessary support and organisational measures to support managers [dissertation]. Tampere (FL): Tampere University of Technology; 2017.
- Vredenburgh AG. Organizational safety: which management practices are most effective in reducing employee injury rates? J Safety Res. 2002;33(2):259–276.
- Mearns K, Whitaker SM, Flin R. Safety climate, safety management practice and safety performance in offshore environments. Saf Sci. 2003;41(8):641–680.
- Grabowski M, Ayyalasomayajula P, Merrick J, et al. Accident precursors and safety nets: leading indicators of tanker operations safety. Marit Policy Manag. 2007;34(5):405–425.
- Lin J, Mills A. Measuring the occupational health and safety performance of construction companies in Australia. Facilities. 2001;19(3/4):131–139.
- Fernández-Muñiz P, Montes-Peón JM, Vázquez-Ordás CJ. Safety culture: analysis of the causal relationships between its key dimensions. J Safety Res. 2007;38:627–641.
- Tappura S, Hyytinen T, Kivistö-Rahnasto J, et al. Turvallisuuden johtajat – Esimiesten johtajuus, osaaminen ja sitoutuminen [Management of occupational health and safety – leadership, competence and commitment of the managers]. Tampere (FL): Tampere University of Technology; 2015. Finnish.
- Tsao M, Hsieh C, Chen L. The role of management commitment and employee involvement in safety management. Int J Organ Innov. 2017;10(2):52–74.
- Tappura S, Nenonen N, Kivistö-Rahnasto J. Managers’ viewpoint on factors influencing their commitment to safety: an empirical investigation in five Finnish industrial organisations. Saf Sci. 2017;95:52–61.
- Taylor J. Safety culture assessing and changing the behavior of organisations. Farnham: Gower; 2010.
- Guldenmund FW. (Mis)Understanding safety culture and its relationship to safety management. Risk Anal. 2010;30(10):1466–1480.
- Neubert MJ, Hunter EM, Tolentino RC. A servant leader and their stakeholders: when does organizational structure enhance a leader's influence? The Leadersh Q. 2016;27:896–910.
- European Agency for Safety and Health at Work. Occupational health and safety culture assessment – a review of main approaches and selected tools. Luxembourg: Publications Office of the European Union; 2011.
- Ostrom C, Wilhelmsen OC, Kaplan B. Assessing safety culture. Nucl Saf. 1993;65:163–172.
- Gordon R, Kirwan B, Perrin E. Measuring safety culture in a research and development centre: a comparison of two methods in the air traffic management domain. Saf Sci. 2007;45(6):669–695.
- Tappin D, Bentley T, Ashby L. An implementation evaluation of a qualitative culture assessment tool. Appl Ergon. 2015;47:84–92.
- Flin R, Mearns K, O'Connor P, et al. Measuring safety climate: identifying the common features. Saf. Sci. 2000;34(1–3):177–192.
- Reiman T, Rollenhagen C. Does the concept of safety culture help or hinder systems thinking in safety? Accid Anal Prev. 2014;68:5–15.
- Guldenmund FW. The use of questionnaires in safety culture research – an evaluation. Saf Sci. 2007;45(6):723–743.
- Tappura S, Sievänen M, Heikkilä J, et al. A management accounting perspective on safety. Saf Sci. 2015;71:151–159.
- Linhard JB. Understanding the return on health, safety and environmental investments. J Safety Res. 2005;36(3):257–260.
- Mossink J, De Greef M. Inventory of socioeconomic costs of work accidents. Luxembourg: European Agency for Safety and Health at Work; 2002.
- Gavious A, Mizrahi S, Shani Y, et al. The costs of industrial accidents for the organization: developing methods and tools for evaluation and cost–benefit analysis of investment in safety. J Loss Prev Process Ind. 2009;22(4):434–438.
- Sheehan C, Donohue R, Shea T, et al. Leading and lagging indicators of occupational health and safety: the moderating role of safety leadership. Accid Anal Prev. 2016;92:130–138.
- Sileyew KJ. Systematic industrial OSH advancement factors identification for manufacturing industries: a case of Ethiopia. Saf Sci. 2020;132:104989.
- Pryor P, Hale A, Hudson D. Development of a global framework for OHS professional practice. Saf Sci. 2019;117:404–416.
- Kaynak T T, Elci M AT, et al. Effects of occupational health and safety practices on organizational commitment, work alienation, and job performance: using the PLS-SEM approach. Int J Bus Manag. 2019;11(5):146–166.
- Parker D, Lawrie M, Hudson P. A framework for understanding the development of organisational safety culture. Saf Sci. 2006;44(6):551–562.
- Zin SM, Ismail F. Employers‘ behavioural safety compliance factors toward occupational, safety and health improvement in the construction industry. Procedia Soc Behav Sci. 2012;36:742–751.
- Brown KA, Willis PG, Prussia GE. Predicting safe employee behavior in the steel industry: development and test of a sociotechnical model. J Oper Manag. 2000;18(4):445–465.
- Bell J. Doing your research project. A guide for first-time researchers in education, health and social science. 4th ed. Berkshire (UK): Open University Press; 2006.
- Bourne M, Mills J, Wilcox M, et al. Designing, implementing and updating performance measurement systems. Int J Oper Prod Manag. 2000;20(7):754–771.
- Singh V, Verma A. A review, simple meta-analysis and future directions of safety climate research in manufacturing organizations. Int J Occup Saf Ergon. 2020;26(4):678–704.
- Grote G, Künzler C. Diagnosis of safety culture in safety management audits. Saf Sci. 2000;34:131–150.
- Hoffmeister K, Gibbons AM, Johnson SK, et al. The differential effects of transformational leadership facets on employee safety. Saf Sci. 2014;62:68–78.
- Vinodkumar MN, Bhasi M. Safety climate factors and its relationship with accidents and personal attributes in the chemical industry. Saf Sci. 2009;47(5):659–667.
- Filho AP G, Waterson P. Maturity models and safety culture: a critical review. Saf Sci. 2018;105:192–211.
- Zanko M, Dawson P. Occupational health and safety management in organizations: a review. Int J Manage Rev. 2012;14(3):328–344.
- Lingard H, Wakefield R, Cashin P. The development and testing of a hierarchical measure of project OHS performance. Eng Constr Archit Manag. 2011;18(1):30–49.