
 ?Mathematical formulae have been encoded as MathML and are displayed in this HTML version using MathJax in order to improve their display. Uncheck the box to turn MathJax off. This feature requires Javascript. Click on a formula to zoom.
ABSTRACT
Objective. To quantify the exposure–response relationship between hand–arm vibration exposure and the risk of musculoskeletal disorders of the upper extremities (UMSDs), a case–control study was carried out among workers in the construction, mining, metal and woodworking industries. Methods. In total, 209 male cases and 614 controls were recruited. Cases were newly reported patients with UMSDs. Controls were a random sample of persons with compensable occupational injuries. Standardized personal interviews were performed among cases and controls by well-trained safety engineers. In addition to leisure activities and comorbidities, work histories of all participants were collected in detail. To quantify hand–arm vibration exposures, a database of vibration measurements of over 700 power tools was used. This database allows the detailed quantification of vibration exposures over time. A dose–response relationship between hand–arm vibration exposure and UMSDs was quantified by conditional logistic regression analyses. Results and conclusions. After adjusting for relevant confounders, statistically significant exposure–response relationships between cumulative hand–arm vibration exposure and UMSDs were established. A cumulative hand–arm vibration exposure of Dhv (vibration total value in three measuring directions) = 142,300 (95% confidence interval [CI] [90,600–333,200]) m2/s4·day or Dhw (vibration value in the direction along the forearm) = 38,700 (95% CI [25,400–80,900]) m2/s4·day is associated with a doubled risk of UMSDs.
1. Introduction
Mechanical vibration arises from a wide variety of occupational activities in mining, construction, metalworking, woodworking and forestry.
Hand–arm vibrations occur when using hand-held power tools and are the cause of significant health impairments, such as painful and disabling conditions of the upper extremities [Citation1–3]. Currently, about 1.5–2 million employees in Germany are exposed to hand–arm vibration that could endanger their health [Citation4]. Health-related effects of hand–arm vibration exposure have three main clinical components: vascular, neurological and musculoskeletal disorders (MSDs) [Citation2].
Vascular and neurological disorders often overlap in occurrence and are the most extensively studied forms of hand–arm vibration syndrome [Citation2]. An exposure–response relationship between hand–arm vibration exposure and the risk of vibration-induced white fingers has been well established based on comprehensive epidemiological studies [Citation5,Citation6]. The occurrence of vibration-induced white finger can even be predicted based on cumulative vibration exposure doses according to the International Standard No. ISO 5349-1: 2001 [Citation6,Citation7].
In contrast, vibration-induced musculoskeletal disorders of the upper extremities (UMSDs) are less extensively studied, despite being one of the oldest legal occupational diseases in Germany from the year 1929 [Citation8].
Early studies and reviews indicate an elevated risk of musculoskeletal symptoms (upper limb pain, stiffness and muscle tendon syndrome) and osteoarthritis (OA) of the upper limb among vibration-exposed workers in comparison to non-exposed workers [Citation1,Citation3,Citation6,Citation8–11]. However, an exposure–response relationship between hand–arm vibration exposure and MSDs has yet to be well established in published studies, especially when objective diagnoses are considered as the relevant outcome instead of clinical symptoms [Citation6].
To quantitatively evaluate the exposure–response relationship between hand–arm vibration and the risk of MSDs that can be used in guiding the prevention and compensation of vibration-induced MSDs of the upper extremities, an epidemiological case–control study was carried out among workers in the construction, mining, metal and woodworking industries in Germany.
2. Methods
2.1. Design and study population
This is a multicentre industry-based case–control study among male workers in the construction, mining, metal and woodworking industries in Germany. The baseline population are insured members of the German Social Accident Insurance institutions. According to German legislation, nearly all employed workers in Germany are compulsorily insured by the German Social Accident Insurance institutions.
In this study, cases were defined as suspected cases of legal occupational disease with the number 2103 (German: BK No. 2103). Occupational disease No. 2103 is a group of MSDs defined as including one of the following six clinical diagnoses:
hand OA;
elbow OA;
shoulder OA;
Kienböck’s disease;
scaphoid fracture and scaphoid pseudoarthrosis;
elbow osteochondrosis.
During the period from January 1, 2010 until November 30, 2021, 347 patients were sent by local physicians to the German Social Accident Insurance institutions. These patients were suspected of having jobs or workplaces that were related to hand–arm vibration exposure.
In a personal interview, 228 patients agreed to join this study while 119 refused. A total of 125 patients also agreed to participate in a validation study to verify their given diagnosis. The validation study was performed by experienced occupational medical specialists based on radiographic findings. In this validation study, diagnoses of 19 patients did not meet the clinical criterion of occupational disease No. 2103. These patients were therefore excluded from this study. Finally, 209 cases joined this study (see Figure ).
Figure 1. Sampling of cases and controls.
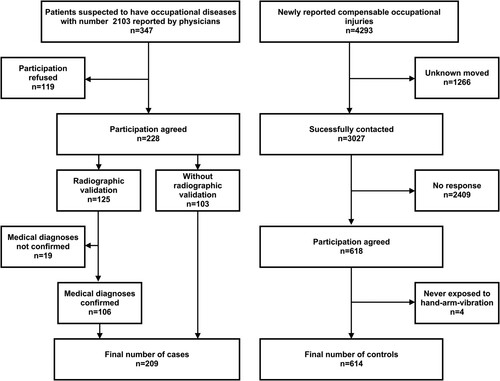
The controls were selected as a random sample of all types of newly reported compensable occupational injuries. They were matched to the cases for gender, birth year, industrial sectors and reporting years. The case–control ratio was about 1:3. In total, 3027 persons with compensable occupational injuries were contacted by the German Social Accident Insurance institutions to be recruited as controls. A total of 2409 persons did not respond to the contact letters, and only 618 (20.4%) persons agreed to join this study. All cases had jobs related to hand–arm vibration, and only the controls that had also been exposed to hand–arm vibration in the past were recruited. Since four potential controls had never used hand-held technical power tools at workplaces in their work history, these persons were excluded from this study. Finally, we had a total of 614 controls recruited in this study (see Figure ).
2.2. Equipment exposure matrix for quantifying hand–arm vibration exposure
An exposure matrix of power tool vibrations for quantifying hand–arm vibration exposure has been established and continually extended by the German Social Accident Insurance institutions since the mid-1980s. The database currently consists of more than 700 hand-held power tools. Their vibration values were measured based on standardized industrial hygiene measurement protocols under real operating conditions. Besides the vibration values, information about the working process and working materials was also documented. This information is essential in quantifying work-related vibration exposures, since vibration exposures differ tremendously when technical power tools are used on different working materials and for different purposes.
In addition, product information for the technical power tools (i.e., manufacturer [https://www.linguee.de/englisch-deutsch/uebersetzung/manufacturers.html], year, weight, drive type, rated power, rotational speed, etc.) was also added to the database, providing this information was available.
2.3. Exposure assessment methods
Standardized personal interviews were carried out among cases and controls by specially trained safety engineers from the German Social Accident Insurance institutions. The majority of them have more than 10 years of working experience and have comprehensive knowledge about the work organization, working process, technical power tools and materials used at workplaces in the related industrial sectors.
Besides demographic characteristics, leisure activities, sports and musculoskeletal comorbidities, the individual work history of all participants was assessed in detail. Exposure assessment focused on technical power tools and working materials used at the workplaces, including daily working hours and the frequency and duration of use of various technical power tools. Combining this information with the afore-described equipment exposure matrix made it possible to estimate and calculate detailed exposure values for the complete time span of each study participant’s working life.
2.4. Determining hand–arm vibration exposure values
Vibration generated by the technical power tools was measured in three orthogonal directions (x, y and z) according to International Standard No. ISO 5349-1: 2001 [Citation7]. Vibration values are expressed as accelerations ahwx, ahwy, and ahwz in the three measuring directions. The vibration total value (ahv) is determined as the root sum of squares of the three component values (ahwx, ahwy and ahwz):
(1)
(1) In addition to the vibration total value (ahv), acceleration (ahw) in the direction along the forearm (direction z) is also considered in the exposure–response analyses of this study.
The daily vibration exposures from using various technical power tools at different time periods of a day are quantified according to International Standard No. ISO 5349-1: 2001 [Citation7] and expressed in terms of the 8-h energy-equivalent root sum of squares of the related acceleration magnitude:
(2)
(2)
(3)
(3) where ahv(8) = daily vibration exposure in three measuring directions; T0 = reference duration of 8 h (conventional daily working time); n = total number of technical tools used in a day; ahvi = frequency weighted acceleration in three measuring directions of technical tool i; Ti = daily working hours of using technical tool i; ahw(8) = daily vibration exposure in the direction along the forearm; ahwi = frequency weighted acceleration in the direction along the forearm of technical tool i.
The cumulative doses of hand–arm vibration exposure are expressed as the sum of squares of daily vibration exposure over the course of an entire working life:
(4)
(4)
(5)
(5) where Dhv = cumulative vibration doses in three measuring directions; ahvi(8) = daily vibration exposure of three measuring directions at day i; di = number of working days with a daily exposure of ahvi(8) (ahwi(8)); Dhw = cumulative vibration doses in the direction along the forearm; ahwi(8) = daily vibration exposure in the direction along the forearm at day i.
For a better understanding of these mathematical equations, the following is an example of how daily and long-term cumulative vibration exposure has been quantified. Assume that three power tools (A, B, C) are used during a working day. The acceleration value (ahv) of the three power tools is 20, 15 and 10 m/s2, respectively. The regular daily working time of a worker is 8 h. Approximately 5% of the working time was spent with power tools A and B, and 10% with power tool C. The daily vibration exposure ahv(8) is then calculated as follows:
We further assume that a worker has a working life of 20 years. He used these three power tools 3 days a week for 30 weeks a year. The long-term cumulative dose of hand–arm vibration exposure can then be calculated as:
Alternatively, Dhv can also be calculated as:
The alternative equation for Dhv is useful if the different power tools were used for different lengths of working time (e.g., days/week, weeks/year or total working years).
2.5. Statistical analysis
All statistical analyses were performed with SAS version 9.4.
We quantified the basic characteristics of the cases and controls by using descriptive statistics. Continuous variables were described with mean, standard deviation, median and range, and categorical variables with frequencies. χ2 tests were used to examine the crude differences of categorical variables. Bivariable and multivariable conditional logistic regression analyses (with SAS syntax PROC PHREG) were applied to quantify the exposure–response relationship between cumulative hand–arm vibration exposure doses and the risk of MSDs according to occupational disease No. 2103. Cumulative vibration exposure was used in the statistical model as a continuous variable or in the quintile category. Body mass index (BMI), gout, arm fracture, rheumatism, generalized OA, injury and inflammatory disorders of hand, elbow or shoulder joints were considered as potential confounders in the exposure–response analyses. To evaluate the relevance of a confounder in exposure–response estimation, stepwise backwards analyses were calculated. If a potential confounder did not change the effect estimates (odds ratio [OR]) of vibration exposure by at least 10%, this confounder was not considered in the final model of the analyses. The threshold for statistical significance was set to p < 0.05. As all analyses are explorative, no adjustment for multiple testing has been made.
3. Results
In total, 823 male participants were recruited for this study. Among the 209 cases, 106 persons had radiographic confirmation, while 103 persons did not join the validation study because of their diagnostic certainties (Figure ). According to the findings of the validation study, 15.2% misdiagnoses were expected (Figure ). Since 103 cases did not join the validation study, the overall misdiagnoses of all cases (n = 209) were expected to be about 7.7%.
The average age of the study participants was about 52 years (range 22–84 years). No difference between cases and controls regarding the BMI could be shown (p = 0.941). However, joint injuries and musculoskeletal comorbidities (such as gout, inflammatory disorders of the upper extremities, knee OA, hip OA, spinal OA and generalized OA) were significantly more common among the cases than those among the controls (Table ).
Table 1. Description of study population (n = 823).
The individual work history of the study sample contains a total of 5115 exposure sections over an exposure period of about 50 years. A total of 423 technical power tools were identified which induce hand–arm vibration. The vibration values of these technical power tools were quantified based on the afore-described power tool exposure matrix. Table presents the quality of the exposure data given for the 5115 exposure sections: 97.2% of the vibration values were based on direct industrial hygiene measurements, 2.7% were based on vibration values of comparable devices and less than 0.01% were based on vibration values of similar devices. There was no systematic difference between the cases and the controls regarding the quality of the exposure data.
Table 2. Quality of the historical exposure data.
The study participants had an average employment duration of around 24 years. There was no difference between cases and controls regarding the employment duration (Table ) and the initial vibration values (ahv, ahw) of the technical power tools used (Figure ). However, the cases had an average of about 48% more cumulative working hours with hand-held technical power tools than the controls (Table ). This led to relevantly higher daily vibration exposure values and cumulative vibration exposure doses among the cases than among the controls (Table and Figure ). Vibration exposures along the forearm (Dhw) had a strong correlation (Spearman’s rank test r = 0.89, p < 0.0001) with the vibration total exposures of all three orthogonal directions (Dhv). This finding suggests that vibration exposure along the forearm is a good indicator for the vibration total exposure.
Figure 2. Comparability of vibration values of technical power tools used among cases and controls in a total of 5115 exposure sections: (a) ahv and (b) ahw. Note: ahv = vibration exposure in a total of three measuring directions; ahw = vibration exposure in the direction along the forearm.
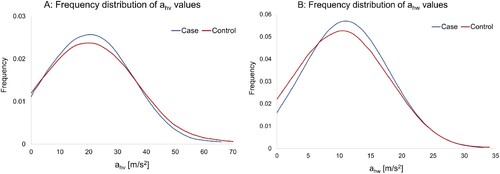
Figure 3. Distribution of cumulative vibration exposures among cases and controls (n = 823): (a) Dhv and (b) Dh. Note: Dhv = cumulative vibration doses in three measuring directions; Dhw = cumulative vibration doses in the direction along the forearm.
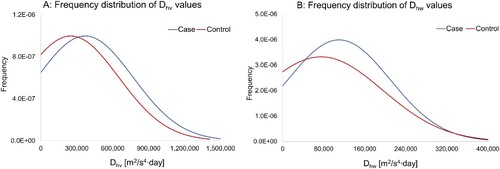
Table 3. Hand–arm vibration exposure among cases and controls.
The unadjusted and adjusted exposure–response relationships between cumulative vibration doses (Dhv and Dhw) and the risk of MSDs according to occupational disease No. 2103 are presented in Tables and for Dhv and Dhw values, respectively. In the initial statistical models, study centres, BMI, gout, arm fracture, rheumatism, generalized OA, injury and inflammatory disorders of hand, elbow or shoulder joints were considered as potential confounders in the analyses. Since BMI, gout, arm fracture and rheumatism have no influence on the effect estimates of vibration exposures (see Supplemental Tables S1 and S2), they were not included in the final model of the analyses. In the final models, only the study centre, generalized OA, injury and inflammatory disorders of hand, elbow or shoulder joints were considered as potential confounders in the exposure–response estimations.
Table 4. Exposure–response relationship between cumulative vibration exposure (Dhv) and musculoskeletal disorders in the sense of occupational disease No. 2103.
Table 5. Exposure–response relationship between cumulative vibration exposure (Dhw) and musculoskeletal disorders in the sense of occupational disease No. 2103.
The final statistical models demonstrate consistent and significant exposure–response relationships between cumulative hand–arm vibration exposure and the risk of MSDs according to BK No. 2103 (Tables and ). Due to the strong correlation of the Dhv and Dhw values, there are similar effect sizes in exposure–response relationships for the Dhv and Dhw values. Based on the effect estimates presented in Tables and , smooth lines of exposure–response curves were quantified with log-linear exposure–response assumptions (Figure ). According to the estimated smooth lines of the dose–response curves, a 10%, 30% and doubled increased risk of MSDs can be expected, as presented in Table .
Figure 4. Estimated exposure–response curves for (a) Dhv and (b) Dhw values. Note: CI = confidence interval; Dhv = cumulative vibration doses in three measuring directions; Dhw = cumulative vibration doses in the direction along the forearm.
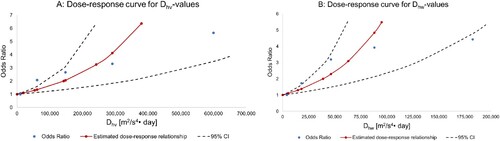
Table 6. Expected excess risk of musculoskeletal disorders in the sense of occupational disease No. 2103 by cumulative hand–arm vibration exposure.
4. Discussion
To our knowledge, this is the first study in which exposure–response relationships between hand–arm vibration exposure and the risk of UMSDs (with clearly defined diagnoses) were quantitatively assessed. The study’s findings demonstrate strong exposure–response relationships between cumulative vibration exposure doses and the risk of MSDs of the upper limbs.
Vibration-induced MSDs have a long and gradual course of development and are less cause specific. Their diagnoses usually need radiographic confirmation. This makes a longitudinal epidemiologic study (such as a cohort study) extremely time-consuming and expensive. An industry-based case–control study therefore provides a good alternative to the conventional cohort study. Since only newly reported cases (within 1 year) were included in this study, it should be considered an incidence study. In comparison to a population-based design, in the chosen industry-based design a high proportion of study participants are exposed to hand–arm vibration and high levels of vibration. Therefore, this design increases not only the statistical power for the initial purpose of this study (compared to a population-based design for the same sample size), but also provides relevant evidence in quantifying exposure–response relationships for work-related and vibration-induced MSDs.
In this study, the controls were selected as a random sample of all types of compensable occupational injuries. Compensable occupational injuries are injuries that lead to at least 3 days of absence from work. There is no indication that occupational injuries in all parts of the body are associated with hand–arm vibration exposure. We even found that there is no significant association between injury of the upper limbs and hand–arm vibration exposure doses among the controls in this study (comparison between persons with and without upper limb injury: p = 0.1543 in a Wilcoxon two-sample test). Therefore, the sampling strategy for controls in this study (random sample of occupational injuries) is unlikely to bias the distribution of hand–arm vibration exposure when compared to the initial baseline population. The controls selected reflect the vibration exposure for a random sample of the initial baseline population. This sampling strategy is equivalent to the so-called ‘case-based or case-cohort sampling’. The OR estimated in a case–cohort design provides the exact value of relative risk (RR) [Citation12].
Like all published occupational epidemiological studies, this one has some limitations. One limitation could be the low response rate in the sampling of controls. About 80% of the potential controls did not respond to our contact letters (in comparison to 34% among the cases). This low response rate reflects a general lack of interest among workers. Although we believe that this lack of interest is not associated with hand–arm vibration exposure, we cannot prove it. A non-responder analysis (regarding the vibration exposure) cannot be carried out due to the lack of data. Nevertheless, the low response among the controls may have had some influence on the proportions of some confounding factors (such as musculoskeletal comorbidities). Yet since all relevant confounders related to musculoskeletal comorbidities were adjusted for in the analyses, it is unlikely that the different response rate among the cases and controls would have had any influence on the estimated exposure–response relationships. Another limitation is the estimated 7.7% cases misdiagnosed. All of the potential cases in this study who were sent by local physicians had some kind of symptomatic MSDs. However, not all of them had diagnoses which met the criterion of occupational disease No. 2103. Nevertheless, they were still patients with MSDs. A previous study demonstrated that hand–arm vibration exposure generally has a strong effect on the risk of musculoskeletal symptoms [Citation6]. Therefore, the estimated 7.7% misdiagnoses among the cases in this study most probably only had a minimal influence on the estimated exposure–response relationships. A further limitation could be that all cases in this study were suspected (by local physicians) of having legal occupational disease No. 2103. This at least means that all cases have had vibration exposure in their work history. Many of them may even have had long years of employment with vibration exposure, although the magnitude of exposure level could not be estimated by the local physicians. To avoid a systemic bias, we only recruited controls who have had hand–arm vibration exposure in the past. The descriptive analysis in this study demonstrates that there is no difference between the cases and the controls regarding employment duration (Table ) and the initial vibration values of the technical power tools used (Figure ). Therefore, the sampling strategy in this study is unlikely to have introduced any systemic bias in the quantification of exposure–response relationships.
Despite the aforementioned limitations, there are some important strengths in this study. Besides the practical and relatively high-quality design and large sample size, one striking strength of this study is the exposure assessment method. Exposure assessment is the most important and difficult part in an occupational epidemiological study. The quality of evidence provided in this type of study depends largely on the exposure assessment methods used. In this study, standardized personal interviews were carried out by specially trained safety engineers who had comprehensive knowledge about the working process and technical power tools used at the workplaces in the related industrial sectors. This may largely decrease the recall bias of the study participants and provide more precise information about the technical power tools used in the individual’s work history. Furthermore, the previously experienced hand–arm vibration exposures were quantified for the first time based on an objective equipment exposure matrix. Since all vibration values in the exposure matrix were determined in the field under real operating conditions according to the international standard [Citation7], the exposure assessment method used allows for a standardized, objective and valid quantification of both daily and lifetime vibration exposure.
5. Conclusions
Overall, this study has a large sample size and high methodological quality and shows for the first time an exposure–response relationship between hand–arm vibration exposure and the risk of MSDs of the upper limbs based on clearly defined morphological changes. Our analysis indicates that cumulative vibration doses of Dhv > 19,600 m2/s4 •day or Dhw > 5,300 m2/s4 •day may lead to a 10% increased risk of MSDs according to occupational disease No. 2103. A cumulative vibration dose of Dhv > 142,300 m2/s4 •day or Dhw > 38,700 m2/s4 •day may even lead to a doubled risk of MSDs according to occupational disease No. 2103. These findings provide useful guidance for the prevention and compensation of work-related and vibration-induced MSDs of the upper limbs.
Supplement tables Draft8.docx
Download MS Word (20.8 KB)Acknowledgements
The authors acknowledge that there is no financial interest or benefit arising from the application of this research project.
Disclosure statement
No potential conflict of interest was reported by the authors.
Data availability
Due to the nature of this research, participants of this study did not agree for their data to be shared publicly, so supporting data are not available.
Ethical consideration
This is an observational (non-interventional) study with no ethical considerations. Therefore, German Social Accident Insurance did not require ethical approval for this study.
Supplemental data
Supplemental data for this article can be accessed at http://dx.doi.org/10.1080/10803548.2023.2295722 description of location.
Additional information
Funding
References
- House R, Wills M, Liss G, et al. Upper extremity disability in workers with hand–arm vibration syndrome. Occup Med (Lond). 2009;59(3):167–173. doi:10.1093/occmed/kqp016
- Youakim S. Hand–arm vibration syndrome. BCMJ. 2009;51:10.
- Hagberg M. Clinical assessment of musculoskeletal disorders in workers exposed to hand–arm vibration. Int Arch Occup Environ Health. 2002;75:97–105. doi:10.1007/s004200100283
- Christ E. Vibration exposure at workplaces – risk assessment and prevention. Die BG. 2002;5:225–232. German.
- Brammer AJ. Dose–response relationships for hand-transmitted vibration. Scand J Work Environ Health. 1986;12:284–288. doi:10.5271/sjweh.2139
- Sauni R, Pääkkönen R, Virtema P, et al. Dose–response relationship between exposure to hand–arm vibration and health effects among metalworkers. Ann Occup Hyg. 2009;53:55–62.
- Mechanical vibration – measurement and evaluation of human exposure to hand-transmitted vibration. International Standard Organization; 2001. Standard No. ISO 5349-1: 2001.
- Dupuis H, Hartung E, Konietzko J. Work-related technical conditions for the recognition of occupational disease number 2103. Arbeitsmed Socialmed Umweltmed. 1998;33:490–496. German.
- Bovenzi M, Zadini A, Franzinelli A, et al. Occupational musculoskeletal disorders in the neck and upper limbs of forestry workers exposed to hand–arm vibration. Ergonomics. 1991;34(5):547–562. doi:10.1080/00140139108967336
- Bovenzi M. Health risks from occupational exposures to mechanical vibration. Med Lav. 2006;97:535–541.
- Charles LE, Ma CC, Burchfiel CM, et al. Vibration and ergonomic exposures associated with musculoskeletal disorders of the shoulder and neck. Saf Health Work. 2018;9(2):125–132. doi:10.1016/j.shaw.2017.10.003
- Rothman K, Greenland S. Modern epidemiology. 2nd ed. Philadelphia (PA): Lippincott Williams & Wilkins; 1998; p. 108–110.
