
ABSTRACT
We reported in 2003 that exposure to metals on laundered shop towels (LSTs) could exceed toxicity criteria. New data from LSTs used by workers in North America document the continued presence of metals in freshly laundered towels. We assessed potential exposure to metals based on concentrations of metals on the LSTs, estimates of LST usage by employees, and the transfer of metals from LST-to-hand, hand-to-mouth, and LST-to-lip, under average- or high-exposure scenarios. Exposure estimates were compared to toxicity criteria. Under an average-exposure scenario (excluding metals’ data outliers), exceedances of the California Environmental Protection Agency, U.S. Environmental Protection Agency, and the Agency for Toxic Substances and Disease Registry toxicity criteria may occur for aluminum, cadmium, cobalt, copper, iron, and lead. Calculated intakes for these metals were up to more than 400-fold higher (lead) than their respective toxicity criterion. For the high-exposure scenario, additional exceedances may occur, and high-exposure intakes were up to 1,170-fold higher (lead) than their respective toxicity criterion. A sensitivity analysis indicated that alternate plausible assumptions could increase or decrease the magnitude of exceedances, but were unlikely to eliminate certain exceedances, particularly for lead.
INTRODUCTION
While inadvertent ingestion by children of Pb transferred from their hands to their mouths was recognized more than a century ago as the cause of Pb poisoning (Lin-Fu 1992), the recognition of the hand-to-mouth pathway as part of everyday activities for adults, in particular workers, is more recent (Nicas and Best Citation2008; Beamer et al. Citation2009; Cherrie et al. Citation2006) and is rarely addressed in occupational literature. One exception is the early recognition of inadvertent ingestion of Pb, which was recognized more than a century ago as the cause of Pb poisoning in adults exposed to Pb in the workplace (NIOSH Citation1978). Indeed, the U.S. Occupational Safety and Health Administration (OSHA) Pb standard promulgated in 1978 was one of the first occupational standards to specifically recognize the hazards of inadvertent ingestion (OSHA 1978; U.S. Office of the Federal Register 2011) and it remains even today one of the few standards to explicitly address inadvertent ingestion OF A TOXICANT.
The recognition of the hand-to-mouth pathway as a potentially important route of exposure to chemicals other than Pb (e.g., pesticides) in the workplace, is more recent (Cherrie et al. Citation2006; Fenske Citation2000). Even today, while much is known about human exposure to workplace hazardous substances by inhalation and skin contact, there has been little systematic research into ingestion of hazardous substances used at work (Cherrie et al. Citation2006).
Nonetheless, a small number of relatively recent studies, many of which have used biological monitoring and wipe samples, have identified jobs in which inadvertent ingestion of metals (especially Pb, As, and Ni) appears likely to occur and, in some cases, is the most plausible explanation for discrepancies between biomonitoring results that are higher than expected based on environmental measurements. For example, studies in Pb battery plants (Chia et al. Citation1991), semiconductor facilities (Hwang and Chen Citation2000), electroplating shops (Kiilunen et al. Citation1997a), and in electrolytic Ni refining (Kiilunen et al. Citation1997b) indicate exposure by routes other than inhalation, such as ingestion. Studies in Pb workers also indicate that ingestion may still be playing a major role in Pb exposure (Enander et al. Citation2004; Karita et al. Citation1997).
Evaluating exposure to particles transferred from hand to mouth requires understanding how particles are transferred from one surface to another (a wipe, hand, etc.). This process is surprisingly complex and affected by numerous factors, including the accessibility of the particles on the contact surface, relative humidity, surface charge, and especially particle size (which is itself influenced by charge and humidity) (Rodes et al. Citation2001; Beamer et al. Citation2009). In general, the larger the particle size, the easier it is to remove from a surface: for each order of magnitude decrease in size, the motion required to a remove a particle from a surface increases by approximately two orders of magnitude (Rodes et al. Citation2001). In addition, handling of dry media leads to preferential adherence of smaller particles (Bergstrom et al. Citation2011). Other important factors affecting the transfer of materials from hand to mouth are visibility and perceived hazard: the proportion of material likely to be absorbed by ingestion will increase for substances that are not visible or not viewed by the worker as hazardous (Cherrie et al. Citation2006).
Shop towels are cloths that workers use to wipe oil, solvents, and other chemicals from machinery and work surfaces (Moran Citation2012), as well as their face and hands. Used shop towels are sent to commercial laundries for washing, where the laundries apparently wash shop towels from different workplaces together. Once laundered, shop towels become laundered shop towels (LSTs); they are returned to clients for reuse.
We have been involved in an ongoing effort to estimate possible exposure via inadvertent ingestion by workers to metals in LSTs based on the concentrations of metals measured in LST samples (Beyer et al. Citation2003) and to screen estimated exposure against recognized toxicity or regulatory criteria. In our prior analysis, as in this analysis, we estimated oral intake of metals in clean LSTs for two potential exposure pathways: hand contact with LSTs and subsequent transfer to the mouth, and direct contact of LSTs with the lips. Estimated potential exposure to metals for both of these pathways was based on metals’ loading on the LSTs and estimates of transfer efficiencies for LST-to-hand, hand-to-mouth, and LST-to-lip. However, the estimated exposure to metals directly transferred from LSTs to the lips was so minimal, that it is not discussed any further. The present analysis incorporates new data on metals’ concentrations in LSTs and LST usage, and refines our earlier methodology for transfer of metals from surfaces to hands.
METHODS
LST Usage
At the time the LSTs were collected for analysis, safety and/or purchase managers for each company submitted a form in which company managers reported the number of people using LSTs and the total number of LSTs used. We divided the total number of LSTs used by the number of employees using them to derive average daily LST use. We then used these data to calculate summary statistics.
Metals’ Concentrations in LSTs
We estimated oral intake of metals in LSTs by combining the 2011 data with the newer 2012 data from washed, used, rental shop towels collected from 54 North American companies. A testing program was set up in which North American companies each sent bundles of approximately 10–15 LSTs directly to TestAmerica Incorporated (Pensacola, Florida) following the laboratory's chain-of-custody procedures. At the laboratory, 10 LSTs were randomly selected for analysis from each bundle, and each LST was visually divided into four quadrants. Using ceramic scissors, subsamples were cut from the center of the LST and from the center of each of the four LST quadrants so that ∼45–60 grams of sample were collected from each LST. The subsamples collected from the 10 LSTs were then “homogenized,” digested, and analyzed for 29 metals and oil/grease. In addition, one unused LST was analyzed for 28 metals (not mercury) and oil/grease.
We reviewed the quality control (QC) sample results, including matrix spikes/matrix duplicates, laboratory control samples, and method blanks, to determine whether qualifications of the data were needed due to exceedances of TestAmerica's QC criteria. We determined that all of the metals’ data were usable, with only minor data qualifications.
Estimate of Exposure via Hand Contact
To estimate exposure from using LSTs, we used our previously developed approach (Beyer et al. Citation2003). In our prior analysis (Beyer et al. Citation2003) and in the present analysis, we evaluated the amount of metal that could be transferred from the LSTs to the lips via the hands, ultimately leading to ingestion of metals. We evaluated two different concentration/usage scenarios: the average-exposure scenario and the high-exposure scenario. In the average scenario, we coupled the average metal's concentrations (which we defined as 95% upper confidence limit on the mean [UCLM]) with average LST use (also defined as 95% UCLM), or 14 LSTs per day. In the high-exposure scenario, we used the 95th percentile metal's concentrations in LSTs and the 95th percentile number of LSTs used daily, or 20 LSTs per day. The U.S. Environmental Protection Agency (USEPA 1989) does not prescribe the exact percentile value for each variable in an exposure assessment. Rather, USEPA recommends that the combined variable values should result in an exposure that is reasonably expected to occur. The derivation of the variable values we used is described in more detail in the Results section.
We estimated transfer of metals from LSTs to hands based on empirical data regarding transfer of residues from surfaces to hands, the number of LSTs used daily per person, and an estimate of the percentage of the LST surface area that would contact the hand. The amount of metal transferred to the hand that ultimately could be ingested was based on a hand-to-mouth transfer efficiency (HTE), using methodology developed by the U.S. Consumer Products Safety Commission (CPSC) for evaluating exposure to dislodgeable residues on treated wood surfaces (CPSC 1990).
Intake of metals in LSTs via hand contact was estimated using the following equation:
This equation assumes that metals are transferred from LSTs to the mouth in a two-step process. First, metals are transferred from the LSTs to the hands as a function of the metals’ loading on the LSTs, the surface area of the LST in contact with the hands, and a LST-to-hand transfer efficiency. Once the metals are on the hands, they are transferred to the mouth, as estimated by a daily HTE.
Metals’ load on LST surface
We used the 95% UCLM to characterize the average concentrations as recommended by USEPA (Citation1992, 2002), and we used the 95th percentile concentrations to estimate high exposure. To calculate the metals’ loading we multiplied the concentration of each metal (mg/kg) times the weight of the LST (kg), (1 oz. or 0.0283 kg based on the average (mean) weight for three LSTs (Beyer et al. Citation2003) and then divided by the average total surface area (front and back) of the LST (cm2) (2,268 cm2, based on measurements from five LSTs (Beyer et al. Citation2003). We assumed that half of the total metals detected in the LST would be available for transfer to the hands on each side of the LST.
The remaining parameters used in the above equations are presented in with the exception of LST-to-hand transfer and daily hand-to-mouth transfer efficiency; both are discussed below.
Table 1 Exposure parameters.
Table 3 Detected concentrations (without outlier data) and estimated load.
LST-to-hand transfer. We updated the underlying literature used in our prior analysis, focusing on studies that met the following criteria: transfer studies that used human volunteers; studies that presented transfer efficiencies for natural removal methods (using saliva, artificial salivary fluids, or no fluids); and studies that assessed the transfer of chemicals from soft surfaces (i.e., carpets), which are more relevant than hard surfaces to the scenario in which LSTs contact workers’ hands. Due to the absence of metal-specific-studies, we included the transfer efficiencies of all other compounds evaluated in the literature (e.g., dust particles, pesticides).
We used transfer efficiencies from seven studies: Cohen Hubal et al. (2005, 2008); Lu and Fenske (Citation1999); Midwest Research Institute (Citation1993, Citation1994); Rodes et al. (Citation2001); and Camann et al. (Citation1996) (). Several of these studies found different transfer efficiencies for different compounds. For example, Camann et al. (Citation1996) reported mean transfer efficiencies of 1.1%, 4.8%, and 2.8% for chlorpyrifos, pyrethrin I, and piperonyl butoxide, respectively. Similarly, Cohen Hubal et al. (Citation2008) found higher transfer efficiencies for uvitex OB tracer than riboflavin. Within each study, we averaged the relevant transfer percentages for each compound, resulting in one transfer efficiency per hand condition per study.
Table 2 LST-to-hand transfer studies from carpet to hand.
Table 4 Toxicity reference values.
Table 5 Metals with exceedances by health-based criterion and comparison of results with and without outlier data.
Skin condition affects the transfer efficiency of contaminants. In reviewing the current literature, Rodes et al. (Citation2001) and Cohen Hubal et al. (2005, 2008) found higher transfer efficiencies of contaminants under moist/damp hand conditions than dry conditions. The average transfer to moist hands (10%) is double the average transfer to dry hands (5%) (). Because workers are likely to come into contact with LSTs with both dry and moist hands, we averaged the transfers to dry and moist hands separately, then averaged the two averages, to equally weight the results from both categories. This value (7%) is comparable to the transfer efficiency used in the 2003 evaluation (5%) and the transfer of soft surfaces to skin used by the World Trade Center Indoor Air Task Force Working Group (2003) (10%).
Daily hand-to-mouth transfer efficiency. Based on our literature review, there are no studies of workers that measured hand-to-mouth transfer of metals. To estimate the amount of metal on the hands that might be ingested via hand-to-mouth contact, we calculated the HTE, which quantifies the fraction of material in soil on the hands that is likely to be transferred to the mouth and ultimately ingested.
The HTE methodology was developed originally by the CPSC (1990) and later used in other evaluations, including two by the CPSC in 2003 (CPSC Citation2003) and 2006 (Babich Citation2006) as well as an evaluation by Dubé et al. (Citation2004). The HTE is based on estimates of the amount of soil transferred from the surface of hands to the mouth, where it is subsequently ingested (or the ratio of incidental ingestion of soil on the hand to the total soil loading on the hand). The HTE represents a 12-h period, which is independent of the number of individual mouthing events, and is calculated as follows:
We assumed that the entire surface area of the hands (i.e., mean surface area of both hands, 980 cm2 (USEPA 2011a), was available for oral exposure, and we used USEPA's recommended soil adherence factor of 0.2 mg/cm2 for a heavy equipment operator/utility worker (USEPA Citation2004), yielding 196 mg. Workers were assumed to wear a short-sleeved shirt, long pants, and shoes and to limit exposure to face, hands, and forearms. This weighted adherence factor (0.2 mg/cm2) was calculated using the adherence factors of soil to skin and the surface areas for the various body parts. Using the incidental ingestion rate of 12 mg/day, the hand-to-mouth transfer is 0.06 or 6% (12 mg divided by 196 mg). The calculated HTE is comparable to the transfer efficiencies calculated by DiBiasio and Klein (Citation2003) (4%), which the California Environmental Protection Agency (CalEPA) uses to calculate human health risks from exposure to metals on contaminated structural surfaces.
RESULTS
LST Usage
LST usage information was obtained from 44 (31 U.S. and 13 Canadian) companies that used between 750 and 17,000 LSTs a week; companies using fewer than 750 LSTs per week were not surveyed. Overall, the Canadian companies reported a higher average daily LST per use per employee (represented by the 95% UCLM) of 26 LSTs versus 13 LSTs reported by the U.S. companies.
The 95% UCLM of the number of LSTs used per day per employee was calculated and used to represent the average daily LST use per employee. The mean number of LSTs used per day per employee was 12, while the 95% UCLM was 14 LSTs. For the high-exposure scenario, the 95th percentile daily use of 20 LSTs was used.
Concentrations of Metals in LSTs
A total of 54 LST samples were collected from 2007 to 2011. Two companies provided two sets of LST samples. In order to weight the results from different companies equally, the concentrations from both sample numbers for these two facilities were averaged resulting in one set of results per company. Consequently, metals’ and Hexane Extractable Material's (HEM) (oil/grease) data from 54 samples were used in our analysis: 16 samples from companies in Canada and 38 from companies in the United States. Overall, the detection frequency was comparable between the two countries and, based on the Wilcoxon-Mann-Whitney test, detected concentrations between the United States and Canada were similar with no statistically significant difference (p > .05). Industries providing LSTs included painting, printing, aviation, automotive, and electronics, as well as food/beverage packaging; the military; and manufacturers of metals, heavy equipment, construction materials, inks, machines, packaging, pumps, medical devices, ammunition, and chemicals.
In the LSTs, 27 metals were detected (counting Cr and CrVI as one metal). Al, Sb, Ba, Cd, Ca, Cr, Co, Cu, Fe, Pb, Mg, Mn, Mo, Ni, K, Se, Ag, Na, Sr, Sn, Ti, V, Zn, and HEM were detected in 96–100% of the 54 LST samples; Tl was not detected in any sample and Be was detected in 36% of the samples (). Concentrations ranged from less than 1 mg/kg to 22,000 mg/kg.
Due to this wide range of detected concentrations, we used Rosner's outlier test (Singh et al. Citation2010) to identify potential outliers. The Rosner test orders the data from smallest to largest. The test statistic is then based on the sample mean and standard deviation computed without the two extreme values (smallest and largest). If the statistic is greater than the critical value based on the same size for a significant level of 0.05, the extreme values are considered outliers. The test is repeated until the statistic is no longer greater than the critical value. Using Rosner's outlier test and one-half the detection limit for analytes that were not detected, all detected metals had at least one outlier except for Sb. For example, for Pb, the 95% UCLM calculated using the outlier data is 1,991 mg/kg, while the 95% UCLM calculated without the outlier data is 231 mg/kg (the outlier concentration for Pb was 19,000 mg/kg). The outlier data are valid, but we elected not to use them to ensure that our estimates of exceedances were not based on single high concentrations.
Listed in are the summary statistics for concentrations (without the outlier data) for compounds found in the LSTs: % detected, mean, 95% UCLM, 95th percentile, and load for both average- and high-exposure scenarios. Mean concentrations, standard deviations, and 95th percentiles were calculated using half the lower detection limit (method detection limit) for samples in which the analyte was not detected. The 95% UCLM was calculated using Pro-UCL, a USEPA software program (V. 4.1) (USEPA Citation2002). The calculated 95% UCLMs ranged from 0.13 (Be) to 6,600 (iron) mg/kg ().
A shop towel that had never been used was also analyzed. In this unused sample, eight metals were not detected: As, Be, Cd, CrVI, Co, Ag, Tl, and V (data not shown). In general, the detected concentrations in the 54 LSTs were higher, for example, from 4-fold (Sb) up to 1,900-fold higher (Mo) than the unused sample (data not shown).
SEM Photographs and Spectrum of Metal Particles
Some LST samples were evaluated by scanning electron microscopy (SEM), which documented the presence of Pb on the surface of LSTs, in at least two samples. Shown in are an unused towel and a used LST in which a section is highlighted. As can be seen, the unused LST has virtually no particles visible, while there are numerous particles on the used LST. Documented in , which is a color photograph indicating the composition of the various particles in the highlighted section in , is the presence of Pb, Al, Fe, Ti, Ca, and Si on the surface of the towel. The presence of these metals is further verified by the spectrum shown in .
Figure 1 Unused shop towel. (Color figure available online.)
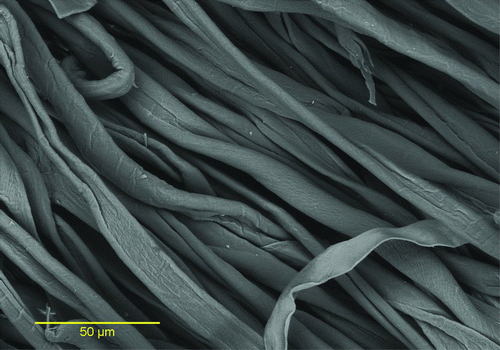
Figure 2 Laundered shop towel with area selected for analysis. (Color figure available online.)
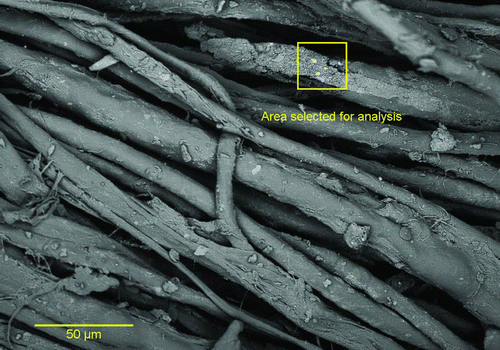
Figure 3 Composition of selected particles from area selected for analysis in Figure 2. (Color figure available online.)
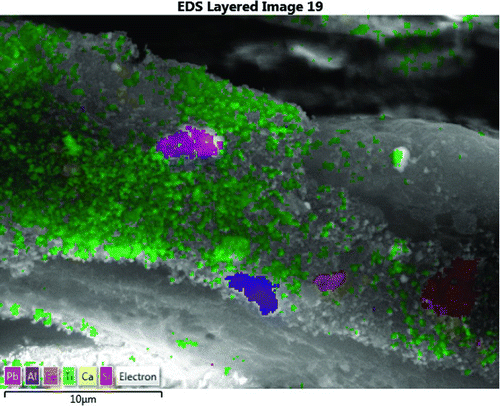
Figure 4 Spectrum from area selected for analysis in Figure 2. (Color figure available online.)
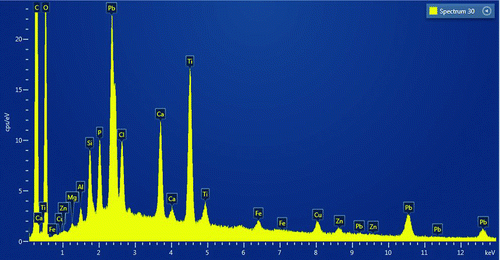
To achieve the SEM images, approximate 1-inch squares were cut from each LST and evaluated in a Hitachi SU6600 variable pressure, field emission SEM. Images and X-ray emission data were collected using the attached Oxford Instruments Aztec system. Particle searching was performed in the backscattered electron imaging (BEI) mode at 20 kV at a pressure of 90 pascals. Clumps of particles were imaged and mapped using the Pb L spectral lines. It should be noted that there was considerable overlap between the Pb M lines and the S K and Mo L lines.
The sample containing particle 2 (a particle in ) was coated with Cr so that secondary electron images (SEIs), which show surface topography well, could be acquired in high-vacuum mode. Image and element map data were re-acquired on the particle such that the images have a more conventional appearance. When particles containing Pb were observed, the spectral information was stored with the image data. Composite images were produced where some selected elemental distributions were mapped over the electron images.
Toxicity Criteria
Estimated average- and high-exposure intakes from exposures via hand contact were compared to a range of oral toxicity criteria to evaluate the potential for health risks from exposure. We used four criteria and USEPA MCLs or ALs for drinking water ().
MCLs are health-protective regulatory limits established under the U.S. Safe Drinking Water Act that also take feasibility into account. While MCLs are not bona fide toxicity criteria, as health-protective regulatory limits, they can provide valuable insight and a point of reference. This is especially useful for Pb, which does not have a federal toxicity criterion.
| • | Oral Reference Dose (RfD): “an estimate of daily exposure level for human populations, including sensitive subpopulations, that is likely to be without an appreciable risk of deleterious effects during a lifetime” (USEPA 1989); from USEPA's Regional Screening Level (RSL) tables (USEPA 2011b). Multiple forms of some metals are included in USEPA's RSL table (2011b). The form of the metals used is presented in . | ||||
| • | Oral Minimum Risk Level (MRL): “an estimate of the daily human exposure to a hazardous substance that is likely to be without appreciable risk of adverse non-cancer health effects over a specified duration of exposure” (ATSDR 2012). We used chronic MRLs when available, and intermediate MRLs when chronic MRLs were unavailable. Presented in is the duration associated with the Minimum Risk Level (MRL) as well as the form of the metals used in our evaluation. | ||||
| • | Maximum Allowable Dose Level (MADL): the maximum allowable dose that would result in no observable reproductive toxicity effect assuming exposure at 1,000 times that level (CalEPA 2009) from CalEPA's Proposition 65Footnote 1 criteria (OEHHA Citation2011). | ||||
| • | No Significant Risk Level (NSRL): the daily intake level that would result in one excess cancer case in an exposed population of 100,000 assuming lifetime exposure (CalEPA 2009) from CalEPA's Proposition 65 criteria (OEHHA Citation2011). | ||||
| • | Maximum Contaminant Levels (MCLs): the concentrations of chemicals allowed in public drinking water. Primary MCLs are enforceable standards that are health protective and based on MCL goals, consideration of feasibility, available treatment technology, and cost (USEPA 2011c). When primary MCLs were unavailable, we used Secondary MCLs, which are based on taste, odor, color, or cosmetic effects (skin/tooth discoloration) (USEPA 2011c). | ||||
| • | Action Levels (ALs): Instead of an MCL, Pb and Cu are regulated by a treatment technique that requires systems to control the corrosiveness of their water. If more than 10% of tap water samples exceed the AL, water systems must take additional steps. The AL is 1.3 mg/L for Cu and 0.015 mg/L for Pb (USEPA 2011c). | ||||
In general, as shown in , for non-cancer endpoints, averaging time (days) was exposure duration (25 years × 365 days/year), or 9125 days/year (USEPA Citation1991). For cancer endpoints, averaging time (days) was 70 years (standard lifetime) × 365 days/year, or 25,550 days (USEPA Citation1991). However, for comparing intakes to CalEPA maximum allowable dose level (MADL) or no significant risk level (NSRL), we adjusted exposures to conform with the exposure duration and averaging times used in developing these criteria. For the MADL, we used an averaging time of 14,600 days (40 years × 365 days/year). For comparing intakes with the NSRL, we averaged exposures over a 70-year lifetime, as recommended by CalEPA's Office of Environmental Health Hazard Assessment (OEHHA 2003), for an averaging time of 25,550 days. For comparing intakes to the USEPA Maximum Contaminant Level (MCL) or Action Level (AL), the MCL (mg/kg-day) = MCL (mg/L) × Drinking Water Rate (2 L/day) × Exposure Frequency (365 day/yr) × Exposure Duration (70 yr)/(Bodyweight 70 kg × Averaging Time 25,550 day).
Comparison of Estimated Exposure via Direct Mouth Contact to Toxicity Criteria
Presented in is a comparison of our exposure estimates to the toxicity criteria (including USEPA MCLs and ALs). The column labeled “Without Outlier Data” presents the results achieved with a dataset in which the outliers were removed. Under the average-exposure scenario, comparison of estimated exposure to non-cancer criteria resulted in multiple exceedances that, depending on metal and exposure assumptions, ranged from relatively modest to more than 400-fold in the case of Pb and the CalEPA MDL. Concentrations of Pb also exceeded the cancer criterion (CalEPA NSRL) by almost 5-fold.
Under a high-exposure scenario, our analysis indicates that the same compounds exceed the same toxicity criteria but with higher exceedances and that additional compounds exceed the criteria. Again, Pb had the highest exceedance, with an intake 1,170-fold higher than the CalEPA MADL, and 14-fold higher than the CalEPA NSRL (). In both exposure scenarios, Ca, Mg, K, and Na were not evaluated. USEPA identifies these compounds as essential nutrients that do not need to be evaluated in a risk assessment (USEPA 1989).
Comparison to 2003 Analysis
When comparing the dataset without outliers to the 2003 concentrations, 10 metals (Al, Ba, Ca, Cu, Mg, Mn, K, Na, Sr, and Ti) had statistically higher concentrations than observed in 2003 (Beyer et al. Citation2003). Despite these differences in concentrations and slight differences in approach, the overall findings are the same. In both assessments, intakes of Pb resulted in the highest exceedance ratios. More compounds exceeded the toxicity criteria in the current evaluation due to higher detected concentrations, additional toxicity criteria, higher number of LSTs used per day reflecting actual usage data (compared to the estimate made in 2003 of 2.5 LSTs per day), and higher LST-to-hand transfer efficiency.
DISCUSSION
Because calculation of exposure requires the use of assumptions, there are uncertainties inherent in the exposure estimates that could result in the actual exposures being greater or less than the estimated values presented here. For example, due to a lack of empirical data, there is uncertainty regarding the transfer of metals from the LST to the hands, and from the hands to the mouth. Additional areas of uncertainty include (but are not limited to) surface loading of metals on the LSTs, number of LSTs used daily per person, the fraction of LSTs in contact with the hands, and suitability of the toxicity criteria for evaluating potential risks associated with metals on the LSTs. These areas of uncertainty, and their potential impact on our analysis, are discussed in more detail below.
Metals’ Loading on LST Surface
The number of LSTs collected and analyzed is relatively modest. Thus, the representativeness of the estimates of metals’ concentrations on these LSTs (with respect to LSTs from the same or other industries, or the same or other laundries) is uncertain. Nonetheless, the use of the 95% UCLM and the 95th percentile concentrations of metals in the LSTs provides relatively stable estimates of average- and high-exposure concentrations (although analysis of additional LSTs could yield both higher and lower concentrations of metals and, hence, surface loadings).
Number of LSTs Used Daily Per Person
In general, purchasing managers of the companies provided information regarding the number of LSTs used and the number of employees using them. The total number of LSTs used was divided by the total number of employees using them to calculate the mean number of LSTs per employee, but actual LST usage by individual employees could differ based on job, work practices, personal preference/hygiene, or the specific industry.
Although LSTs were collected from a number of industries, not all industries using LSTs submitted samples, and some industries submitted more samples than others. Based on the compiled surveys, daily average LST use varied by industry and within industries, ranging, for example, from an average of 1–20 LSTs in four machine manufacturing facilities (with a mean of 7.5 LSTs per employee), to 5–50 LSTs in nine printing facilities (with a mean of 19 LSTs per employee). Additional samples would likely change some averages.
Fraction of LST in Contact with Hands
Another area of uncertainty in this analysis is the fraction of the LST in contact with hands. For this analysis, we assumed that 75% of the total surface area of the LST would contact the hands, based on measuring the wet area on a LST used to dry wet hands. Other uses, such as cleaning shop equipment, may involve contact with different portions of the LST; the fraction of the LST in contact with the hands for all uses throughout the day may be greater than the fraction contacted for drying hands. In addition, using a LST multiple times would likely increase the total surface area used.
LST-to-Hand Transfer
For this analysis, we estimated transfer of metals from the LST to the hands based primarily on data regarding transfer of pesticides from surfaces to hands (five studies), with additional data from two studies with tracers and one study on metals in dust particles. These were the only reliable data we found regarding transfer of substances to hands. However, use of pesticide transfer data introduces uncertainty in transfer rates, notably for organics (pesticides) versus inorganics (metals) and the relatively small-sized pesticide residues versus metal particles (which could be larger or smaller), as well as differences in adherence of recently applied pesticide residues versus metal particles on an LST (Rodes et al. Citation2001; Murnyak and Chang Citation2011). In spite of these uncertainties, there is a precedent for estimating transfer rates for inorganics based on pesticide data. For example, USEPA used pesticide transfer data to estimate transfer of As (to hands) from wood structures treated with Cu chromated As (ManTech and USEPA 2002).
An additional area of uncertainty is our use of transfer rates measured under different conditions (e.g., transfer rates to water-wetted and saliva-wetted hands, transfer at 4-h post-application and 24-h post-application). Transfer rates were greater to water-wetted hands than saliva-wetted hands and at 4-h post-application than 24-h post-application. However, all four scenarios are conceivable in the workplace.
In addition, the studies used to calculate the LST-to-hand transfer efficiencies did not have consistent study designs, which could introduce uncertainty. For example, the Midwest Research Institute (Citation1994) and Rodes et al. (Citation2001) evaluated transfers of malathion and metals in dust particles, respectively, immediately after application to carpet, while Lu and Fenske (Citation1999) measured transfer of chlorpyrifos hours after it was applied to carpet. Studies measured the transfer of compounds using different approaches (e.g., hand presses, smudging, and dragging). We averaged the transfer efficiencies of these different exposure scenarios within a study and only accounted for hand dryness/wetness when averaging across the studies; this was the only parameter evaluated consistently in the studies. We included all these scenarios because they are feasible in the workplace.
Hand-to-Mouth Transfer Efficiency
Hand-to-mouth transfer of metals is worker-specific, varying with individual hygiene and work practices. If companies provide adequate hand washing facilities and/or personal protective equipment (e.g., gloves), hand-to-mouth contact and/or transfer efficiency could be decreased or eliminated.
An additional aspect of uncertainty regarding the HTE parameter is the time frame of exposure, which as developed by USEPA, integrates exposure due to hand-to-mouth activity occurring throughout a 12-h day (approximately). Using the HTE parameter without adjusting for the length of a typical 8-h workday could overestimate actual intake of metals from LSTs if increased exposure time increases exposure linearly.
Some studies have calculated hand-to-mouth transfers using the CPSC method incorporating contact frequency between the contaminated surface and the hand (DiBiasio and Klein Citation2003; Michaud et al. Citation1994; Paull Citation1997). In all cases, the authors assumed contaminated surface contact frequency of 8 times/day or 1 time/day in an 8-h day. However, the HTE, as used by others (including CPSC (1990, 2003), Babich (Citation2006), and Dubé et al. (Citation2004) and as developed in our analysis) reflects a net transfer throughout the day and does not require assumptions as to contact frequency or loading, unloading, and reloading of contaminants on hands.
We considered using the more recent Stochastic Human Exposure and Dose Simulation Model (SHEDS), which, like the CPSC model, has been used to assess risks for children contacting playsets and decks treated with chromate Cu arsenate (CCA) (Zartarian et al. Citation2005). SHEDS is a complex model that calculates incidental intake using a mechanistic approach (e.g., fraction of hand with residue mouthed per mouthing event, frequency of hand inserted into mouth per hour, number of hand washing events in a day), which allows for extrapolation to different scenarios (e.g., changes in frequency of hand-to-mouth contact by age). However a number of parameters are highly uncertain (e.g., intensity of hand-to-mouth contact while engaged in play, temporal relationship between hand-to-mouth activity and washing), and input data are especially limited for workplace scenarios. In contrast, the CPSC model, which can be adjusted for an occupational scenario, accounts for a hand-to-mouth transfer efficiency that reflects a net transfer throughout the day consistent with soil ingestion rates and is not based on mechanistic assumptions. The SHEDs model has not been evaluated to determine whether the inferred transfer rates yield results consistent with empirical data (i.e., it is unknown whether the inferred incidental intake in SHEDS is consistent with the widely published soil incidental ingestion rates in the literature). For these reasons, we considered the CPSC model a more appropriate tool for our analysis.
Bioavailability
Because no data are available regarding the bioavailabilityFootnote 2 of metals on LSTs, our analysis assumes that the bioavailability of metals in the LSTs is comparable to that of metals in studies on which the toxicity criteria are based. However, we note that toxicity criteria are typically based on the more soluble forms of metals, whereas metals present in the LSTs may be in a relatively insoluble, metallic (and hence less bioavailable) form.
Summarized in is the impact of the uncertainties discussed above on the likelihood of exceeding the toxicity criteria (ATSDR MRL, CalEPA Proposition 65, and USEPA RfD and MCL/AL). Taking the uncertainties into consideration as a whole, they are unlikely to change the conclusions regarding Pb—the metal with the highest exceedances. This is due to the relatively large exceedance of the CalEPA MADL for reproductive toxicity for Pb where, assuming high exposure, intake is 1,170-fold higher than the MADL.
Table 6 Impact of alternative exposure assumptions on likelihood of exceeding toxicity criteria.
Outliers
As mentioned earlier, we evaluated the data to identify outliers, and we removed them from the dataset that form the basis of the results presented in this article. We did this to ensure that our estimates of exceedances were not based on single high concentrations, even though the data are believed to be reliable and come from towels that workers would have used if the towels had not been selected for analysis.
Had we based the comparisons to regulatory criteria on data that included the outliers, additional and larger exceedances would have been noted ().
CONCLUSIONS
Concentrations of metals in LSTs can result in estimated exposures (as evaluated using the screening methodology presented in this article) that exceed toxicity criteria for certain metals. Specifically, the overall conclusions of this analysis are:Footnote 3
| • | Workers may be exposed to metals in “clean” LSTs at levels that could exceed various agency toxicity criteria and USEPA MCLs for drinking water. | ||||
| • | Under an average-exposure scenario (without outliers), exceedances of CalEPA Proposition 65 limits and USEPA and the Agency for Toxic Substances and Disease Registry's (ATSDR's) toxicity criteria may occur for Al, Cd, Co, Cu, Fe, and Pb. Calculated intakes for these metals were more than 400-fold higher (Pb) than their respective toxicity criterion. | ||||
| • | For the high-exposure scenario, additional exceedances of USEPA criteria or CalEPA Proposition 65 limits for Sb, Be, and Mn may occur. High-exposure intakes were up to 1,170-fold higher (Pb) than their respective toxicity criterion. | ||||
| • | If companies provide adequate hand-washing facilities and/or personal protective equipment (e.g., gloves), hand-to-mouth contact and/or transfer efficiency could be decreased or eliminated. | ||||
ACKNOWLEDGMENTS
This work was funded by the Kimberly-Clark Corporation, which also set up and paid for the testing program and obtained the LST usage information from company managers. In addition Joel Brostin of Kimberly-Clark provided the SEM images of the LSTs (–) and the SEI image of one of the particles found on a LST ().
© Gradient
Notes
Editor's note: Proposition 65, the State of California's Safe Drinking Water and Toxic Enforcement Act of 1986, was enacted as a ballot initiative in November 1986. The Proposition was intended by its authors to protect California's citizens and the state's drinking water sources from chemicals known to cause cancer, birth defects, or other reproductive harm, and to inform citizens about exposures to such chemicals. Proposition 65 requires California's Governor to publish, at least annually, a list of chemicals known to the state to cause cancer or reproductive toxicity.
In evaluating the potential for toxicity, it is important to consider the amount of a chemical that is absorbed into the bloodstream, since it is the absorbed form of the chemical that is typically of toxicological concern. Following ingestion, a chemical may not be completely absorbed into the bloodstream; some fraction of the dose may pass through the gastrointestinal tract unabsorbed. This phenomenon is reflected in the term “relative bioavailability.” Bioavailability is dependent on a number of factors, including chemical form, solubility, and particle size (Valberg et al. Citation1997).
Disclaimer: The conclusions in this article are derived from the exposure assumptions provided herein. Utilization of different exposure assumptions, or comparison to different LSTs (which may contain different concentrations of metals), could affect the conclusions.
REFERENCES
- ATSDR (Agency for Toxic Substances and Disease Registry) . 2012 . Minimal Risk Levels (Mrls) for Hazardous Substances . Available at http://www.atsdr.cdc.gov/mrls/pdfs/atsdr_mrls_february_2012.pdf
- Babich , M A . 2006 . CPSC Staff Preliminary Risk Assessment of Flame Retardant (FR) Chemicals in Upholstered Furniture Foam , Bethesda , , MD, USA : US Consumer Product Safety Commission (CPSC) . Available at http://www.cpsc.gov/library/foia/foia07/brief/ufurn2.pdf
- Beamer , P , Canales , R A and Leckie , J O . 2009 . Developing probability distributions for transfer efficiencies for dermal exposure . J Exposure Sci Environ Epidemiol , 19 : 274 – 83 .
- Bergstrom , C , Shirai , J and Kissel , J . 2011 . Particle size distributions, size concentration relationships, and adherence to hands of selected geologic media derived from mining, smelting, and quarrying activities . Sci Total Environ , 409 : 4247 – 56 .
- Beyer , L A , Seeley , M R and Beck , B D . 2003 . Evaluation of potential exposure to metals in laundered shop towels . Int Nonwovens J , 12 : 22 – 37 .
- Calabrese , E J , Stanek , E J Gilbert , C E . 1990 . Preliminary adult soil ingestion estimates: Results of a pilot study . Regul Toxicol Pharmacol , 12 : 88 – 95 .
- CalEPA (California Environmental Protection Agency) . 2009 . Proposition 65 Safe Harbor Levels: No Significant Risk Levels for Carcinogens and Maximum Allowable Dose Levels for Chemicals Causing Reproductive Toxicity , California Office of Environmental Health Hazard Assessment (CalOEHHA), Reproductive and Cancer Hazard Assessment Section . Available at http://oehha.ca.gov/prop65/pdf/2009FebruaryStat.pdf
- Camann , D E , Majumdar , T K Harding , H J . 1996 . “ Transfer efficiency of pesticides from carpet to saliva-moistened hands ” . In Measurement of Toxic and Related Air Pollutants , 532 – 40 . Research Triangle Park , , NC, USA : WMA Publication VIP-64, Air & Waste Management Association . Proceedings of an International Specialty Conference, May 7–9, 1996
- Cherrie , J W , Semple , S Christopher , Y . 2006 . How important is inadvertent ingestion of hazardous substances at work? . Annl Occup Hyg , 50 : 693 – 704 .
- Chia , S E , Chia , K S and Ong , C N . 1991 . Ethnic differences in blood lead concentration among workers in a battery manufacturing factory . Annl Acad Med Singapore , 20 : 758 – 61 .
- Cohen Hubal , E A , Nishioka , M G Ivancic , W A . 2008 . Comparing surface residue transfer efficiencies to hands using polar and nonpolar fluorescent tracers . Environ Sci Technol , 42 : 934 – 9 .
- Cohen Hubal , E A , Suggs , J C Nishioka , M G . 2005 . Characterizing residue transfer efficiencies using a fluorescent imaging technique . J Exposure Anal Environ Epidemiol , 15 : 261 – 70 .
- CPSC (US Consumer Product Safety Commission) . 1990 . Playground Equipment—Transmittal of Estimate of Risk of Skin Cancer from Dislodgeable Arsenic on Pressure Treated Wood Playground Equipment Washington , , DC, USA
- CPSC . 2003 . Interoffice memorandum by J.M. Hatlelid to P. Bittner re , Cancer Risk Assessment for Arsenic Exposure from CCA-Treated Wood Playground Structures . January 23. Available at http://www.cpsc.gov/phth/ccafact.html
- Davis , S and Mirick , D K . 2006 . Soil ingestion in children and adults in the same family . J Exposure Sci Environ Epidemiol , 16 : 63 – 75 .
- DiBiasio , K and Klein , K . 2003 . “ Human health risk evaluation of structural surfaces contaminated with metals ” . In Society of Toxicology 42nd Annual Meeting Salt Lake City , , Utah, USA Available at http://www.dtsc.ca.gov/AssessingRisk/upload/Eval-Metal-Contaminated-Surfaces.pdf
- Dubé , E M , Petito Boyce , C Beck , B D . 2004 . Assessment of potential human health risks from arsenic in CCA-treated wood . Hum Ecol Risk Assess , 10 : 1019 – 67 .
- Enander , R T , Cohen , H J Gute , D M . 2004 . Lead and methylene chloride exposures among automotive repair technicians . J Occup Environ Hyg , 1 : 119 – 25 .
- Fenske , R A . 2000 . Dermal exposure: A decade of real progress . Annl Occup Hyg , 44 : 489 – 91 .
- Hwang , Y H and Chen , S C . 2000 . Monitoring of low level arsenic exposure during maintenance of ion implanters . Arch Environ Health , 55 : 347 – 54 .
- Karita , K , Shinozaki , T Tomita , K . 1997 . Possible oral lead intake via contaminated facial skin . Sci Total Environ , 199 : 125 – 31 .
- Kiilunen , M , Aitio , A and Tossavainen , A . 1997a . Occupational exposure to nickel salts in electrolytic plating . Ann Occup Hyg , 41 : 189 – 200 .
- Kiilunen , M , Utela , J Rantanen , T . 1997b . Exposure to soluble nickel in electrolytic nickel refining . Ann Occup Hyg , 41 : 167 – 88 .
- Lin-Fu , J S . 1992 . “ Modern history of lead poisoning: A century of discovery and rediscovery ” . Edited by: Needleman , H L . Boca Raton , , FL, USA : Human Lead Exposure, CRC Press .
- Lu , C and Fenske , R A . 1999 . Dermal transfer of chlorpyrifos residues from residential surfaces: Comparison of hand press, hand drag, wipe, and polyurethane foam roller measurements after broadcast and aerosol pesticide applications . Environ Health Perspect , 107 : 463 – 7 .
- ManTech (ManTech Environmental Technology, Inc.), USEPA (US Environmental Protection Agency) . 2002 . SHEDS-Wood—Stochastic Human Exposure and Dose Simulation Model for a Wood Preservative Exposure Scenario: Technical Manual: User's Manual for SHEDS-Wood (Final Draft) , Washington , , DC, USA : USEPA Office of Research and Development .
- Michaud , J M , Huntley , S L Sherer , R A . 1994 . PCB and dioxin re-entry criteria for building surfaces and air . J Exposure Anal Environ Epidemiol , 4 : 197 – 227 .
- Midwest Research Institute . 1993 . “ Protocol for Dermal Exposure Assessment: A Technical Report. EPA-600/X-93/005 ” . Las Vegas , , NV, USA : USEPA, Office of Research and Development, Environmental Monitoring Systems Laboratory .
- Midwest Research Institute . 1994 . Total Dermal Exposure Program (Draft Final Report). EPA Contract No. 68-DO-0137, MRI Project No. 9802-A(70). Submitted to USEPA, Environmental Monitoring System Laboratory , Las Vegas , , NV, USA : USEPA .
- Moran , B. and [Connecticut Health Investigative Team] . 2012 . EPA Investigating Toxic Laundry Emissions In New England . Available at http://c-hit.org/2012/11/19/epa-investigating-toxic-laundry-emissions-in-new-england/
- Murnyak , G and Chang , H Y . 2011 . Derivation of health-based screening levels for evaluating indoor surface contamination . J ASTM Int , : 8
- Nicas , M and Best , D. 2008 . A study quantifying the hand-to-face contact rate and its potential application to predicting respiratory tract infection . J Occup Environ Hyg , 5 : 347 – 52 .
- NIOSH (National Institute for Occupational Safety and Health) . 1978 . Criteria for a Recommended Standard…Occupational Exposure to Inorganic Lead (Revised criteria—1978) , Rockville , , MD, USA : National Technical Information Service (NTIS) DHEW (NIOSH) . Publication No. 78-158, NTIS PB81–225278
- OEHHA (California, Office of Environmental Health Hazard Assessment) . 2003 . Air Toxics Hot Spots Program Risk Assessment Guidelines: The Air Toxics Hot Spots Program Guidance Manual for Preparation of Health Risk Assessments . Available at http://www.oehha.ca.gov/air/hot_spots/pdf/HRAguidefinal.pdf
- OEHHA . 2011 . Proposition 65 Safe Harbor Levels: No Significant Risk Levels for Carcinogens and Maximum Allowable Dose Levels for Chemicals Causing Reproductive Toxicity , Sacramento , , CA, USA : Reproductive and Cancer Hazard Assessment Branch, California Environmental Protection Agency (CalEPA) .
- OSHA (Occupational Safety and Health Administration) . 1978 . Occupational Exposure to Lead (Final standard) . Fed. Regist , 43 ( 220 ) : 52952 – 53014 . 29 CFR Part 1910
- Paull , J M . 1997 . A Proposed Risk-Based Model for the Evaluation of Surface Contamination and the Assessment of Potential Dermal Exposure , Baltimore , , MD, USA : Johns Hopkins University, School of Hygiene and Public Health .
- Rodes , C E , Newsome , J R Vanderpool , R W . 2001 . Experimental methodologies and preliminary transfer factor data for estimation of dermal exposures to particles . J Exposure Anal Environ Epidemiol , 11 : 123 – 39 .
- Singh , A , Armbya , N and Singh , A K . 2010 . ProUCL Version 4.1.00 Technical Guide: Statistical Software for Environmental Applications for Data Sets with and without Nondetect Observations (Draft). EPA/600/R-07/041. Report to USEPA , Atlanta , , GA, USA : Office of Research and Development, Las Vegas, NV USA and USEPA Region IV . Available at http://www.epa.gov/osp/hstl/tsc/ProUCL_v4.1_tech.pdf
- Stanek , E J , Calabrese , E J Barnes , R . 1997 . Soil ingestion in adults—Results of a second pilot study . Ecotoxicol Environ Saf , 36 : 249 – 57 .
- USEPA (US Environmental Protection Agency) . 1989 . Risk Assessment Guidance for Superfund (RAGS). Volume I: Human Health Evaluation Manual (Part A) (Interim final) , Washington , , DC, USA : Office of Emergency and Remedial Response . EPA-540/1-89-002
- USEPA . 1991 . Risk Assessment Guidance for Superfund (RAGS). Volume I: Human Health Evaluation Manual—Supplemental Guidance: Standard Default Exposure Factors (Interim final) , Washington , , DC, USA : Office of Emergency and Remedial Response . OSWER Directive 9285.6-03, NTIS PB91-921314
- USEPA . 1992 . Risk Assessment Guidance for Superfund: Supplemental Guidance to RAGS: Calculating the Concentration Term , Washington , , DC, USA : Office of Emergency and Remedial Response . OSWER Directive 9285.7-08I, NTIS PB92-963373
- USEPA . 2002 . Calculating Upper Confidence Limits for Exposure Point Concentrations at Hazardous Waste Sites [Supplemental Guidance to RAGS.] OSWER Directive 9285.6–10 , Washington , , DC, USA : Office of Emergency and Remedial Response . Available at http://www.epa.gov/oswer/riskassessment/pdf/ucl.pdf
- USEPA . 2004 . Risk Assessment Guidance for Superfund (RAGS). Volume I: Human Health Evaluation Manual (Part E, Supplemental Guidance for Dermal Risk Assessment) (Final) , Washington , , DC, USA : Office of Superfund Remediation and Technology Innovation . EPA/540/R/99/005. Available at http://www.epa.gov/oswer/riskassessment/ragse/pdf/part_e_final_revision_10-03-07.pdf
- USEPA . 2011a . Exposure Factors Handbook: 2011 Edition. EPA/600/R-090/052F. Office of Research and Development , Washington , , DC, USA : National Center for Environmental Assessment (NCEA) . Available at http://www.epa.gov/ncea/efh/pdfs/efh-complete.pdf
- USEPA . 2011b . Regional Screening Level (RSL) Summary Table—November 2011 . Available at http://www.epa.gov/region9/superfund/prg/
- USEPA . 2011c . Drinking Water Contaminants: National Primary Drinking Water Regulations . Available at http://water.epa.gov/drink/contaminants/index.cfm
- U.S. Office of the Federal Register . 2011 . Code of Federal Regulations: Labor (Title 29, Parts 1910.1000—End) , Washington , , DC, USA : National Archives and Records Administration, Office of the Federal Register, US GPO, Superintendent of Documents .
- Valberg , P A , Beck , B D Bowers , T S . 1997 . Issues in setting health-based cleanup levels for As in soil . Regul Toxicol Pharmacol , 26 : 219 – 29 .
- World Trade Center Indoor Air Task Force Working Group . 2003 . World Trade Center indoor Environmental Assessment: Selecting Contaminants of Potential Concern and Setting Health-Based Benchmarks , New York , , NY, USA : Contaminants of Potential Concern (COPC) Committee .
- Zartarian , V G , Xue , J Ozkaynak , H . 2005 . A Probabilistic Exposure Assessment for Children Who Contact CCA-Treated Playsets and Decks; Using the Stochastic Human Exposure and Dose Simulation Model for the Wood Exposure Scenario (SHEDS-Wood) (Final Report) , Washington , , DC, USA : USEPA Office of Research and Development .