
 ?Mathematical formulae have been encoded as MathML and are displayed in this HTML version using MathJax in order to improve their display. Uncheck the box to turn MathJax off. This feature requires Javascript. Click on a formula to zoom.
Abstract
Yellowknife, Northwest Territories, Canada, is located near two closed gold mines. Elevated arsenic concentrations reported in fish are a public health concern. We collected 180 samples of three species of commonly consumed fish in 2013–2018 and analyzed arsenic species, including inorganic arsenic (As(III) and As(V)), monomethylarsonate (MMA), dimethylarsinic acid (DMA), and arsenobetaine. The average total arsenic concentration in fish muscle tissue was 2.30 ± 1.72 µg/g dry weight, and that in burbot liver tissue was 3.16 ± 2.49 µg/g dry weight. Nontoxic arsenobetaine was the main arsenic species in fish muscle (mean = 58.6 ± 34.5%), whereas DMA was the predominant species in burbot liver (mean = 76.6 ± 21.6%). On average, inorganic arsenic species accounted for less than 20% of the arsenic detected in fish. Data on the consumption of locally caught fish were collected from 1611 residents in Yellowknife in 2017 and 2018, including 1417 general residents and 194 members of the Yellowknives Dene First Nation. We evaluated the health risks from inorganic arsenic exposure using Monte Carlo simulations. Our results indicated that there were negligible non-cancer health risks, and the cancer risk was below the baseline cancer risk level of arsenic exposure among the Canadian general population.
Introduction
Arsenic is a ubiquitous trace element that is naturally present in the earth’s crust, mainly in the form of arsenopyrite (Mandal and Suzuki Citation2002). Exposure to elevated levels of arsenic has been reported in areas worldwide, including Bangladesh (Smith et al. Citation2000), Taiwan (Lai et al. Citation1994), and South America (Biggs et al. Citation1997; Concha et al. Citation1998; Mazumder Citation2007). Oral exposure is the primary route of human environmental exposure to inorganic arsenic, occurring through the dietary intake of arsenic-contaminated food or drinking water, as well as incidental ingestion of arsenic-containing soil or sediments (NRC Citation2001; US EPA Citation2019a). In Canada, elevated arsenic levels in drinking water is relatively uncommon; high arsenic exposure is usually from anthropogenic sources, such as the wood preservative industry and mining activities (Wang and Mulligan Citation2006). The Giant Mine in Yellowknife, Northwest Territories, Canada, was one of the largest and most productive gold mines in Canadian history (Keeling and Sandlos Citation2012), yielding more than 20,000 kg of gold over its lifetime. It operated from 1948 to 1999 and on limited production from 1999 to 2004. Together with the neighboring Con Mine (1938–2003), an estimated 10,000 kg of arsenic trioxide dust was released daily via the roasting of arsenopyrite ores to extract gold particles (Keeling and Sandlos Citation2012). Currently, 237,000 tonnes of arsenic trioxide by-product is stored in 15 underground chambers on the Giant Mine property, along with three large tailing ponds that drain into Baker Creek and eventually Yellowknife Bay. Giant Mine is recognized as one of the most contaminated sites in Canada, with a projected CAD 1 billion required for remediation costs and up to 15 years to clean up (INAC Citation2018). Although the mines are no longer operational, transport of arsenic and other metals by surface runoff and groundwater migration is still possible. In 2015, the Giant Mine Remediation Project proposed the artificial freezing of underground arsenic trioxide in blocks to prevent the drainage of arsenic from underground chambers (INAC Citation2018).
Fish is a good source of protein and essential fatty acids, and its consumption has been linked to a reduced risk of cardiovascular diseases, myocardial infarction, inflammatory-related diseases, and other health benefits (Daviglus et al. Citation2002). The Yellowknives Dene First Nation is the Indigenous peoples living in Yellowknife. Based on data from the NWT Labour Force Surveys conducted in 1998, 2003, 2008, and 2013, about 40% of people residing in the Northwest Territories hunt or fish their own food resources (GNWT Citation2015). Yellowknives Dene First Nation members have been exposed to legacy mining contaminants because of their dependence on land and water as their primary food resources (AFN Citation2009). On average, 43% of Indigenous residents in the Northwest Territories hunt or fish for subsistence and recreational purposes, compared to only 33% in non-Indigenous communities (GNWT Citation2015). Therefore, fish consumption could be a significant source of arsenic to Yellowknife residents. Among fish consumers, fish consumption rate has been shown to correlate with arsenic concentrations in various biomarkers of exposure, including blood, cord blood, breast milk (Miklavčič et al. Citation2013), and urine (Navas-Acien et al. Citation2011).
Chronic arsenic exposure at a dose as low as 0.05 mg/kg body weight has systemic effects on the human body, including cardiovascular, integumentary, pulmonary, and endocrine effects, and can lead to cancer in multiple organs (ATSDR Citation2007). Meanwhile, acute arsenic exposure at an oral dose of 1–3 mg/kg is lethal (ATSDR Citation2007). The toxicity of arsenic compounds has been reported to follow the order As(III) > As(V) > monomethylarsonate (MMA) > dimethylarsinic acid (DMA) > organic arsenic species (NRC Citation2001; ATSDR Citation2007). The inorganic arsenic species As(III) and As(V) have been classified by the International Agency for Research on Cancer as Class I chemicals, carcinogenic to humans; meanwhile, MMA and DMA species are classified as Class IIB chemicals, possibly carcinogenic to humans based on in vitro evidence (Wnek et al. Citation2011; Escudero-Lourdes et al. Citation2012; IARC Citation2012). Several in vitro studies have revealed the trivalent form of MMA to be more toxic to human cells than As(III) by inhibiting DNA repair processes, disrupting enzymatic activities, and inducing chromosomal mutations (Mass et al. Citation2001; Kligerman et al. Citation2003; Wnek et al. Citation2011; Escudero-Lourdes et al. Citation2012). Health effects from arsenic exposure are generally associated with exposure to As(III) and As(V). Upon ingestion, inorganic arsenic is metabolized via a series of reduction and methylation processes into MMA, and DMA.
Arsenic speciation studies have revealed that most arsenic in fish muscle is found as organic arsenobetaine, which is nontoxic in humans and is rapidly excreted in urine after ingestion (ATSDR Citation2007). Inorganic arsenic usually makes up less than 10% of the total arsenic in fish muscle (Schoof and Yager Citation2007; de Rosemond et al. Citation2008). Nevertheless, the pathway of arsenic species biotransformation in fish remains unclear. Researchers have proposed that fish transform inorganic arsenic into organic arsenic species, marked by the high concentration of organic arsenic species in tissue (Lunde Citation1972; Zhang et al. Citation2012, Citation2016).
The aims of this study were (1) to measure the concentration of arsenic and its species in fish around Yellowknife, and (2) to evaluate the potential health risks from inorganic arsenic exposure through fish consumption. We hypothesized that (1) the distance between each lake and the mining area would be negatively associated with total arsenic and inorganic arsenic concentrations in fish because of higher arsenic levels in the food web closer to the mining area due to historical arsenic deposition onto the lake; and (2) members of the Yellowknives Dene First Nation would have elevated health risks from inorganic arsenic exposure compared to the general population because they consume more fish.
Materials and methods
Sample collection and sites
We collected a total of 180 fish samples from nine lakes around Yellowknife, Northwest Territories, Canada (). Ten dorsal fish muscle samples were collected from each of lake whitefish (Coregonus clupeaformis) and northern pike (Esox lucius) in each lake, with the exception of eight northern pike dorsal muscle samples from Grace Lake. Samples were obtained from the following lakes by Dr. Mark Poesch of the University of Alberta through the Environment and Natural Resources in 2017: Long Lake (62°28′41.30″N, 114°26′3.91″W), Grace Lake (62°25′10.37″N, 114°26′37.90″W), Kam Lake (62°25′19.10″N, 114°24′17.54″W), Lower Martin Lake (62°30′47.21″N, 114°25′16.04″W), Walsh Lake (62°34′54.53″N, 114°16′15.10″W), and Banting Lake (62°38′16.05″N, 114°17′22.61″W). Dr. John Chételat (Environment and Climate Change Canada) also provided eight to ten fish muscle tissue samples from the 2013–2015 sampling season for each of the two fish species, in addition to five burbot (Lota lota) liver tissue samples from both Yellowknife Bay (62°29′4.40″N, 114°20′13.00″W) and Great Slave Lake (62°20′56.68″N, 114°21′40.33″W). Burbot liver was included in this study because it is a popular food item among residents of Yellowknife, and the consumption rate was collected in the population study. Additional fish samples of lake whitefish and northern pike from Small Lake (62°31′3.96″N, 113°49′35.36″W) were collected by Dr. Pete Cott and Mike Palmer in 2018. The captured fish were euthanized by pithing the head with a sharp knife. Fish were skinned and dissected in the field and shipped to the Laboratory for the Analysis of Natural and Synthetic Environmental Toxicants at the University of Ottawa (Ottawa, Canada) using ice coolers. The fork length (in millimeters) and the total weight (in grams) of all fish were recorded (). Our fish collection protocol was in accordance with the Canadian Council on Animal Care’s Guidelines on: the care and use of fish in research, teaching and testing (CCAC Citation2005), and was approved by the University of Ottawa’s Animal Care Committee under Protocol BL-2894, Fisheries and Oceans Canada for the use of fish for scientific purposes under License S-17/18-3032-YK-A2, and Aurora Research Institute under License #16043.
Figure 1. Fish sampling locations in Yellowknife, Northwest Territories, Canada.
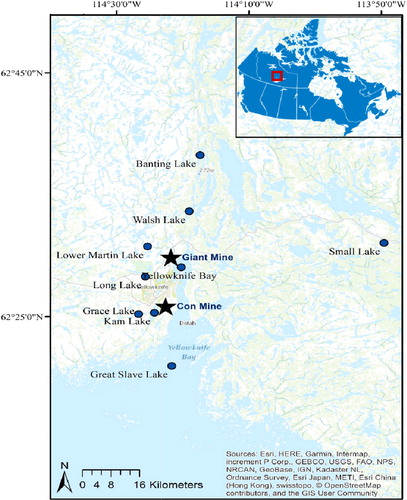
Figure 2. Total arsenic and inorganic arsenic concentrations in fish tissue from lakes around Yellowknife. Mean arsenic concentrations in fish from each lake labeled with the same lowercase letters (a, b, c, d) do not differ significantly (two-way ANOVA, post-hoc Tukey’s; p > 0.05).
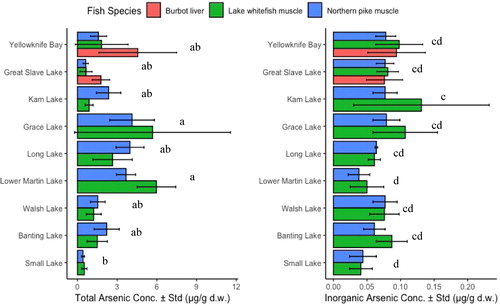
Table 1. Biometrics of the collected fish samples from nine lakes around Yellowknife.
Sample preparation and arsenic analysis
Sample preparation
Fish tissue samples were freeze-dried using a commercial lyophilizer (SuperModulyo; Thermo Scientific, Waltham, MA, USA) for 24–36 h, and then homogenized using a Magic Bullet processor (NutriBullet, Pacoima, CA, USA) before arsenic analysis. The sample weights before and after lyophilization were used to determine the percent moisture content.
Total arsenic analysis
First, 0.1–0.5 g of homogenized sample was digested with 2.5 mL of 70%v/v OmniTrace HNO3 (EMD Millipore, USA) on a DigiPREP block digestion system (SCP Science, Baie D'Urfé, QC, Canada) at 100 °C for 180 min, after which 1.5 mL of 30% v/v certified ACS H2O2 (Fisher Chemical, USA) was added to each tube on the hotplate and heated for an additional 45 min at 95 °C. The extracts were cooled to room temperature and diluted with Milli-Q deionized water to 10 mL. The digested solutions were then filtered using 0.45-micron DigiFILTERs (SCP Science) and vortexed before analysis. The concentration of total arsenic was determined using inductively coupled plasma–mass spectrometry (ICP-MS; 7700x; Agilent Technologies, Santa Clara, CA, USA). The reference materials used were IAEA-407 (International Atomic Energy Agency, Monaco) and DOLT-5 (National Research Council, Canada) for fish tissues. Total arsenic concentrations were within 95–125% of certified values, with a mean of 104 ± 7%.
Arsenic speciation analysis
First, 0.1 g of dry sample was extracted using 4 mL of 1:1 methanol:Milli-Q water at 100 °C for 180 min on a DigiPREP block (SCP Science) and diluted to 10 mL using Milli-Q deionized water. Extracts were centrifuged at 4000 rpm for 15 min and syringe-filtered using 0.2 µm polyvinylidene difluoride filter media (Whatman, Maidstone, UK) before analysis. The concentrations of the arsenic species As(III), As(V), MMA, DMA, and arsenobetaine in samples were measured using high-performance liquid chromatography (1200 HPLC; Agilent Technologies) with ICP-MS (7700x; Agilent Technologies) in accordance with the Food and Drug Administration standards, Elemental Analysis Manual Section 4.11. The method limits of detection were 0.002 µg/g for arsenobetaine, 0.06 µg/g for As(III), 0.07 µg/g for DMA, 0.004 µg/g for MMA, and 0.1 µg/g for As(V). Method blanks, calibration blanks, and standards, as well as the standard reference materials DORM-4 and DOLT-5 (National Research Council, Canada), were used for quality assurance. Mass balances for all reference materials and samples were tested to be within the range of 95–130% of certified values (mean = 115 ± 10%) for accuracy.
Human health risk assessment
Data on the frequencies and amounts of fish species consumed among the adult (aged 18–65) and child (aged 3–17) residents of Yellowknife were obtained from the Food Frequency Questionnaire (FFQ) collected by the Yellowknife Health Effects Monitoring Program for risk assessment studies (Chan et al. Citation2019). Participants were also asked about the specific locations where they obtained their fish. Information on fish meal portions was gathered using visual food models. All data used in this study were provided by consenting participants, recruited through random selection and on a voluntary basis. Participants comprised the general residents of Yellowknife and the Yellowknives Dene First Nation living in Yellowknife for at least 12 months. The Yellowknife Health Effect Monitoring Program applied the First Nations principles of ownership, control, access, and possession of data throughout the entire process ( Schnarch Citation2004). The protocol used by the research program was approved by the University of Ottawa Research Ethics Board under file #H05-17-07, the Aurora Research Institute under license #16497, and Aurora College Research Ethics Committee under protocol #20180401.
Daily fish consumption rates among participants were calculated by adding the total amount of fish consumed in a year (in grams) divided by the total days of fish meals in a year (in days). The survey was conducted in two waves (fall 2017 and spring 2018), with a total of 1611 participants: 1417 general residents (1150 adults and 267 children) and 194 members of the Yellowknives Dene First Nation (123 adults and 71 children). The daily fish consumption rates (in grams per day) of lake whitefish, northern pike, and burbot liver from lakes around the city were used to estimate the potential non-carcinogenic and carcinogenic health risks related to long-term arsenic exposure from fish consumption among reporting consumers. Only the inorganic forms of arsenic (As(III) and As(V)) in fish were considered in this risk assessment because they are the most toxic and carcinogenic species to humans (ATSDR Citation2007). At the time this manuscript was prepared, the United States Environmental Protection Agency (US EPA) was revising its arsenic risk assessment under the Integrated Risk Information System. Therefore, the methodology adopted in this paper was based on the latest available guidelines used by the US EPA and Health Canada. The chronic non-cancer hazard quotient (HQ), lifetime average daily dose (LADD), and incremental lifetime cancer risk (ILCR) were calculated using the following equations (US EPA Citation2000; Health Canada Citation2010a):
(1)
(1)
(2)
(2)
(3)
(3)
where: CfiAs = concentration of inorganic arsenic in fish (µg/g wet weight)
IR = daily ingestion rate of fish (g/day)
EF = exposure frequency (365 days/year)
ED = exposure duration (adult = 80 years (Health Canada Citation2010a, Citation2010b), child = 10 years (US EPA Citation2019b))
BW = body weight of Yellowknife inhabitant (kg)
LE = life expectancy (80 years)
RfDiAs = reference dose of inorganic arsenic (3 × 10⁻⁴ mg/kg BW·day) (US EPA Citation2000)
CSFiAs = cancer slope factor of inorganic arsenic exposure (1.8 kg BW·day/mg) (Health Canada Citation2010b)
An HQ value greater than 0.2 was used to indicate an elevated health risk when not all sources of exposure were accounted for in the assessment (Health Canada Citation2010a). An ILCR value of less than 1 × 10⁻⁵ was used to indicate a negligible carcinogenic health risk (Health Canada Citation2010a). Self-reported body weight was used to estimate daily exposure. The measured inorganic arsenic concentration in fish in dry weight was converted to the wet weight based on the corresponding percent moisture content, using average conversion factors of 0.2 for fish muscle tissue and 0.4 for burbot liver.
We used Monte Carlo simulations to calculate the non-carcinogenic and carcinogenic health risks (HQ and ILCR indices, respectively) from inorganic arsenic exposure through fish consumption among Yellowknife residents using the distribution of three variables: body weight and fish consumption rate (both specific to the population and age groups), as well as inorganic arsenic concentration in fish. These simulation tests were generated through the Crystal Ball software version 11.1 for Windows (Oracle, Redwood City, CA, USA) to account for the uncertainty distributions of all variables in HQ and cancer risk computations using N = 10,000 trials.
Statistical analysis
All data are presented as the mean ± one standard deviation. The arsenic concentration in fish samples was measured in µg/g dry weight (dw). All figures and statistical analyses were generated in R software version 3.5.2 for Mac OS X. We used two-way analysis of variance (ANOVA) and post-hoc Tukey’s multiple comparisons of means tests to compare the total arsenic and inorganic arsenic concentrations in fish samples between the two fish species (lake whitefish and northern pike) and to compare fish total arsenic and inorganic species concentrations in the sampled lakes around Yellowknife. Two-sample t-test was used to compare arsenic species concentrations in lake whitefish and northern pike within each lake. The relationships between the concentrations of different arsenic species detected in fish tissues were measured using Pearson’s correlation tests. Statistical significance for all analyses was set at 0.05.
Results and discussion
Total and inorganic arsenic concentrations in fish
The average total arsenic concentration in fish muscle tissues from the nine lakes in the Yellowknife area was 2.30 ± 1.72 µg/g dw (range: 0.42–5.97 µg/g dw) (). These levels were comparable to other published results on fish arsenic concentrations in the Yellowknife area: 0.05–2.80 µg/g dw (Cott et al. Citation2016), 0.57–1.15 µg/g dw (de Rosemond et al. Citation2008), and < 0.05 to 6.90 µg/g dw (Stantec Citation2014). Location was a significant factor determining total arsenic concentration in fish (two-way ANOVA; p < 0.05) and differences in total arsenic concentration in fish were not related to species. Conversely, both fish species and location were significant factors determining the inorganic arsenic concentration in fish (two-way ANOVA; p < 0.05).
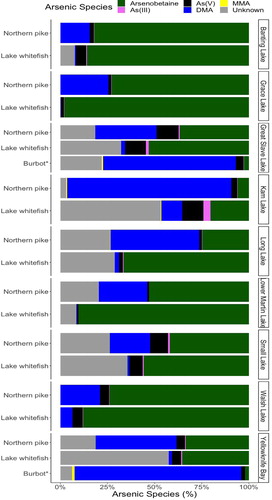
Figure 3. Proportion of detected arsenic species in the muscle tissue of fish across lakes. *Burbot arsenic concentration was measured in liver tissue.
The arsenic concentrations in fish muscle tissue from Yellowknife Bay were not significantly different from those in Great Slave Lake, the reference surface water body (post-hoc Tukey’s; p > 0.05). The arsenic concentrations in fish from Grace Lake and Lower Martin Lake were significantly higher than the reference Small Lake (Grace Lake: mean difference = 4.44 µg/g dw, p < 0.05; Lower Martin Lake: mean difference = 4.35 µg/g dw, p < 0.05). Fish from Lower Martin Lake and Grace Lake had the highest total arsenic concentrations in muscle tissue of 5.97 ± 1.46 µg/g dw and 5.68 ± 5.89 µg/g dw, respectively. Fish from the reference Small Lake, located 27 km east of the mining area, had the lowest average total arsenic concentration in muscle tissue of 0.46 ± 0.16 µg/g dw. These results suggest that fish from inland lakes near the mine roasters are more affected by legacy arsenic from mining than fish from lakes further from the mine roasters. As an exception, Kam Lake was located close to the mining area but had relatively low total arsenic concentrations in fish (lake whitefish: 0.88 ± 0.30 µg/g dw, northern pike: 2.36 ± 0.92 µg/g dw); however, Tukey’s test showed that fish from Kam Lake had significantly higher inorganic arsenic concentrations than fish from the reference Small Lake (mean difference = 0.06 µg/g, p < 0.05) (). Although the total arsenic concentration in fish from Kam Lake was low, the inorganic arsenic concentration in these fish was the highest among the sampled lakes, especially in lake whitefish (0.131 ± 0.101 µg/g dw). The results highlight the importance of measuring arsenic species concentrations in fish for risk assessments for human health.
The average arsenic concentration in burbot liver was 3.16 ± 2.49 µg/g dw. Total arsenic concentrations in burbot liver were higher than those in fish muscle tissue samples collected from the same sites (). This was expected, as liver accumulates more arsenic than muscle tissue because it is the main biotransformation organ of arsenic (Lunde Citation1972). Studies have reported that arsenic bioconcentrates in fish organs in the order gastrointestinal tract > liver > muscle (de Rosemond et al. Citation2008; Foata et al. Citation2009). Arsenic concentrations in burbot liver were also higher in sampling sites closer to the mines, e.g., 4.56 ± 2.94 µg/g dw in Yellowknife Bay compared to 1.77 ± 0.66 µg/g dw in Great Slave Lake.
Arsenic speciation in fish
The main arsenic species in fish muscle was organic arsenobetaine (mean = 58.6 ± 34.5%) (). On average, inorganic arsenic comprised less than 20% of total arsenic in fish tissues (). Lake whitefish had a higher inorganic arsenic concentration in muscle than northern pike (mean difference = 0.02 µg/g, p < 0.05), and a higher proportion of inorganic arsenic to total arsenic (mean difference = 2.96%, p < 0.05). There are two possible explanations for the higher inorganic arsenic levels found in lake whitefish: (1) Adult lake whitefish feed primarily on benthic invertebrates at the lake bottom (COSEWIC Citation2005), which might expose these fish to high inorganic arsenic through sediment ingestion, contributing to the higher inorganic arsenic concentration in muscle tissue, whereas northern pike feed nearly exclusively on midwater fish (Harvey Citation2009). (2) Lake whitefish occupy a lower trophic position than northern pike (Cott et al. Citation2011; Tanamal Citation2019)), which has been associated with higher arsenic concentration and proportion of inorganic arsenic to total arsenic in freshwater organisms (Tanamal Citation2019). Most arsenic species in burbot liver were in the form of DMA (mean = 76.6 ± 21.6%), and less than 5% of total arsenic was in the form of inorganic arsenic (mean = 3.9 ± 2.7%). Since inorganic As(III) and As(V) are the predominant soluble arsenic species in lake water and sediment (Pothier et al. Citation2018), we concluded that the organic arsenicals in fish tissues were products of inorganic arsenic biotransformation and retention through dietary exposure. Inorganic arsenic was taken up by fish through gills and ingestion (Zhang et al. Citation2012; Fonseca et al. Citation2017). Northern pike had a significantly higher proportion of DMA to total arsenic in tissue than lake whitefish (two-sample t-test, mean difference = 34.5%, p < 0.0001), indicating that inorganic arsenic species are preferably biotransformed into DMA rather than arsenobetaine in northern pike. Conversely, lake whitefish metabolize most arsenic into arsenobetaine (mean arsenobetaine proportion = 68.7 ± 36.4%). These findings suggest species-specific retention of arsenic compounds in fish species that could be related to differences in arsenic biotransformation pathways and diets.
Table 2. Summary of total arsenic and inorganic arsenic (iAs) concentrations in various fish species across lakes in Yellowknife.
Correlation of arsenic species in fish tissues
The correlation matrices of arsenic species concentrations in the three fish species are presented in . In lake whitefish muscle, total arsenic concentration was significantly correlated with concentrations of As(V) (r = 0.236, p < 0.05) and arsenobetaine (r = 0.960, p < 0.01). In northern pike, high total arsenic concentration in muscle was significantly correlated with high MMA (r = 0.480, p < 0.01), DMA (r = 0.624, p < 0.01), and arsenobetaine (r = 0.721, p < 0.01) concentrations, whereas in burbot liver tissue, high arsenic concentration was strongly correlated to high MMA (r = 0.827, p < 0.01), DMA (r = 0.967, p < 0.01), and arsenobetaine (r = 0.869, p < 0.01) concentrations. These results indicate that upon exposure, inorganic arsenic in fish is transformed into predominantly arsenobetaine in lake whitefish, and into MMA, DMA, and arsenobetaine in northern pike and burbot liver tissue.
Table 3. Pearson correlation matrices of arsenic concentration and arsenic species in (A) lake whitefish muscle, (B) northern pike muscle, and (C) burbot liver.
The proportion of inorganic arsenic to total arsenic in fish was inversely related to total arsenic concentration in all three fish species (lake whitefish: r = −0.434, p < 0.01; northern pike: r = −0.727, p < 0.01; burbot liver: r = −0.655, p < 0.05), suggesting that inorganic arsenic concentration in fish does not increase proportionally to total arsenic concentration in tissues. Rather, the accumulation of toxic inorganic arsenic in tissues was restricted with increasing total arsenic in tissues. A similar decline in the retention of inorganic arsenic with an increasing arsenic concentration in fish was reported by Jia et al. (Citation2018). In this study, we observed two possible pathways of arsenic biotransformation in fish species: (1) biotransformation into arsenobetaine, as in lake whitefish, and (2) biotransformation into methylated arsenic species (MMA and DMA), as in northern pike and burbot liver. These pathways could be specific to the fish species.
Fish consumption in Yellowknife
The fish consumption data are presented in . Out of 1417 participants from the general population group, 1409 participants (99%) provided consumption information for each of the fish species in the FFQ. All 194 participants from the Yellowknives Dene First Nation provided their consumption data for all fish species indicated in the FFQ. The most consumed fish species in both groups were lake whitefish (89–98% of consumers), lake trout (49–71% of consumers), walleye (21–43% of consumers), and northern pike (10–34% of consumers) (). Similar to the Dene Dietary Survey in 1998, whitefish and trout remained the two most commonly consumed fish species (83–97% of consumers) among the Yellowknives Dene First Nation. However, the number of pike consumers declined significantly (1998: 26–50% of consumers; 2017–2018: 10–12% of consumers) (Receveur et al. Citation1998). The daily consumption rates of lake whitefish, northern pike, and burbot liver included in this risk assessment covered approximately 60% of total fish consumption reported among Yellowknife residents.
Table 4. Summary of daily fish consumption (g/day) of various fish species among general residents in Yellowknife (YK) (N = 1417 participants) and the Yellowknives Dene First Nation (N = 194 participants).
We included the most common sources of locally caught fish among Yellowknife residents in our exposure assessment: Yellowknife Bay, Great Slave Lake, Long Lake, Grace Lake, Kam Lake, Martin Lake, Walsh Lake, Banting Lake, and Small Lake. Out of 1073 participants who reported fishing in Yellowknife, 89% reported consuming locally harvested fish (N = 960). More than half of participants (63%) reported fishing in the Great Slave Lake area, and 46% reported fishing in the Yellowknife Bay and Back Bay area. Moreover, 15% of participants reported fishing in Walsh Lake, 8% in Long Lake, and around 5% or less of participants reported fishing in each of the following locations: Banting Lake, Kam Lake, Grace Lake, and Small Lake. Other lakes that were frequently mentioned by the participants but not covered in this study were Prosperous Lake, Prelude Lake, and Pontoon Lake. These three lakes are large lakes measuring over 300 ha in surface area situated at least 10 km away from the mining area, with water arsenic concentrations below 10 µg/L (Palmer et al. Citation2015). Based on these characteristics, we expect that these lakes probably have similar or lower arsenic and inorganic arsenic concentrations in fish than the range of concentrations reported in this study. Therefore, this risk assessment serves as an overall assessment of inorganic arsenic exposure through fish intake from the most commonly fished lakes in the area. However, it does not cover all arsenic exposure from all fish consumption.
Daily fish consumption rates of all fish species combined were highest among the Yellowknives Dene First Nation adult consumers (mean = 32 g/day), compared to general adult consumers (mean = 14 g/day) (). Children in Yellowknife generally consumed smaller portions of fish than adults (general population: mean = 7 g/day; Yellowknives Dene First Nation: mean = 14 g/day). Northern pike and burbot were consumed more among the general residents (northern pike: 2–4 g/day; burbot: 2–3 g/day, burbot liver: 0.5–2 g/day, inconnu: 3 g/day), compared to the Yellowknives Dene First Nation residents (northern pike: 1–3 g/day; burbot: 0.3–2 g/day, burbot liver: 0–1 g/day). The recommended fish intake proposed by Health Canada’s Food Guide for Healthy Eating is at least 150 g (two servings) per week (Health Canada Citation2007) or equivalent to 21 g/day. The average general resident group in Yellowknife consumed less than the recommended total fish intake (adults: 13 g/day; children: 5 g/day), while Yellowknives Dene First Nation adults consumed more than the recommended fish intake (32 g/day), but children much less (11 g/day) ().
Risk assessment
The HQ and ILCR estimates based on Monte Carlo simulation are presented in . Body weight and daily fish consumption data were collected from consumers of whitefish, pike, and burbot liver, with N = 1055 adults and 267 children from the general population, and N = 120 adults and 68 children from the Yellowknives Dene First Nation.
Table 5. Variables used for Monte Carlo simulation of non-carcinogenic health risk and carcinogenic risk on inorganic arsenic (iAs) exposure from the reported fish consumption among general population and the Yellowknives Dene First Nation.
The probabilistic distributions of HQ and ILCR in the two resident groups are shown in . The mean HQ was 0.007 (95% confidence interval (CI) = 0.00–0.03) among adult consumers from the general population and 0.01 (95%CI = 0.00–0.05) among the Yellowknives Dene First Nation adults. Since this study did not account for all sources of arsenic intake, we used a standard risk assessment practice that characterizes risk by estimating potential hazards against a hazard benchmark of 0.2. This ensures that site-related exposures do not exceed 20% of the toxicity reference value on a daily basis. Although the Yellowknives Dene First Nation adults had higher HQ values than the adult general residents, the values at the 95th percentile were still much lower than the value at a HQ of 0.2 (Health Canada Citation2010a), indicative of negligible long-term non-carcinogenic health risks related to fish consumption in adults of both groups. Since the children in the two resident groups consumed much less fish than the adults, the ranges of probabilistic HQ in children were lower than those in adults (general residents: mean = 0.001, 95%CI = 0.00–0.005; Yellowknives Dene First Nation: mean = 0.001, 95%CI = 0.00–0.005).
Table 6. Monte Carlo simulation (N = 10,000) of non-carcinogenic health risk (HQ) and carcinogenic risk (ILCR) of inorganic arsenic exposure based on the reported fish consumption rates among the general population and Yellowknives Dene First Nation.
The probabilistic ILCR values for the average adult residents were within the acceptable level (general residents: ILCR = 3.8 × 10⁻⁶; Yellowknives Dene First Nation: ILCR = 7.5 × 10⁻⁶). However, the ILCR values among adults at the 95th percentile (general residents: ILCR = 1.4 × 10⁻⁵; Yellowknives Dene First Nation: ILCR = 2.7 × 10⁻⁵) exceeded the limit of negligible cancer risk of 1 × 10⁻⁵ proposed by Health Canada (Citation2010a), suggesting that there was a slight cancer risk associated with fish intake at the 95th percentile among the adult population in Yellowknife. In children, the probabilistic ILCR values at the 95th percentile (general residents: ILCR = 3.0 × 10⁻⁶; Yellowknives Dene First Nation: ILCR = 2.4 × 10⁻⁶) were within the acceptable range (ILCR < 10−5). Although the probabilistic ILCR values in adults were higher at the 95th percentile, these values were still lower than the ILCR values at the 5th percentile for arsenic exposure among the general population in Canada (ILCR = 1.4 × 10⁻⁴) (Faure et al. Citation2020). These results suggest that the cancer risk associated with arsenic exposure from fish consumption among Yellowknife residents is below the baseline cancer risk levels of arsenic exposure among the Canadian general population.
In summary, our risk assessment indicates that fish consumption in Yellowknife does not pose any substantial chronic health risks to the average resident, and the cancer risk associated with arsenic exposure from fish consumption among Yellowknife residents is below the baseline cancer risk levels of arsenic exposure among the Canadian general population. However, there are several weaknesses in the study design that might have resulted in an underestimation of health risks. We did not consider arsenic exposure from store-bought fish, other local fish species consumed, or fish caught in other lakes in the area. We covered approximately 60% of reported fish consumption in the Yellowknife population using the consumption data for lake whitefish, northern pike, and burbot liver in our risk assessment. Assuming that other fish species had similar inorganic arsenic concentrations, the estimated daily exposure rate of inorganic arsenic from fish consumption would be 0.26 µg/day among general resident adults, 0.02 µg/day among general resident children, 0.54 µg/day among Yellowknives Dene First Nation adults, and 0.03 µg/day among Yellowknives Dene First Nation children. Using the distribution of body weight, we estimated that the daily dose of inorganic arsenic exposure from fish consumption in Yellowknife encompassed 1–2% of the US EPA’s reference dose of 3 × 10⁻⁴ mg/kg·day (US EPA Citation2000).
Fish consumption serves as an essential source of nutrition, especially for eicosapentaenoic acid and docosahexaenoic acid, among other nutrients that are irreplaceable by other food substitutes. Fishing also has a significant cultural value in the Indigenous communities that rely on fishing for nourishment. A Yellowknife Dene Dietary Survey in 1998 showed that about 70% of Dene households reported fishing and 30% of participants revealed that they could not afford to buy all their food from the store if traditional sources of food were not available (Receveur et al. Citation1998). Fish consumption has been linked to many health benefits, such as reduced cardiovascular-related mortality (Mozaffarian and Rimm Citation2006), reduced obesity and diabetes (Nkondjock and Receveur Citation2003), and improved neuropsychological performance in children and adolescents (Butler et al. Citation2017). Incorporation of sufficient seafood in maternal diets of more than 340 g/week has been correlated with developmental benefits in children according to the Avon Longitudinal Study of Parents and Children involving 11,875 pregnant women, and limiting this source of nutrients could be detrimental to children (Hibbeln et al. Citation2007). Our findings show that the risk of lost nutrients from fish outweighs the health risks associated with inorganic arsenic exposure from fish consumption in the majority of the Yellowknife population. Therefore, we support incorporating sufficient fish in diets, in accordance with Health Canada’s recommendation of at least 150 g/week and following site-specific fish consumption advisories posted by the Health and Social Services in Yellowknife. For instance, the Health and Social Services of the Government of the Northwest Territories has advised residents of Yellowknife to avoid fishing around David Lake, Fox Lake, Frame Lake, Gar Lake, Handle Lake, Jackfish Lake, Kam Lake, Niven Lake, Peg Lake, Meg Lake, and Rat Lake based on the concern of arsenic exposure (Health and Social Services Citation2019). In addition, our results suggest that fish consumption from Kam Lake might be discouraged because it had a significantly higher concentration of inorganic arsenic species compared to fish from the regional reference lake. Large-bodied fish occupying a higher trophic position in food webs generally accumulate less inorganic arsenic in the tissues (Tanamal, 2019), posing few issues in terms of consumption. However, large-bodied fish with low inorganic arsenic concentrations in tissue could still have high concentrations of methylmercury or other chemicals of potential concern.
We calculated the allowable daily intake and weekly servings for each of the fish species in each location without exceeding 20% of the reference dose (). The results show that there is a negligible risk of inorganic arsenic exposure, even with the consumption of multiple servings of fish per day. It is important to note that this study did not address the potential long-term effects of legacy arsenic exposure in the Yellowknife population when Giant Mine was still in operation. Also, the Yellowknives Dene First Nation may have taken special precautions to lower their arsenic exposure, for instance by avoiding fish from lakes that are known to have higher arsenic levels and reducing local fish consumption. This study also did not address other indirect health risks associated with changes in their traditional diet and lifestyle as a result of the mining operations.
Table 7. The allowable daily intake (g) and weekly servings for each fish species at each lake without exceeding 20% of the reference dose.
Conclusion
Elevated concentrations of total arsenic in fish were still seen almost two decades after the closing of both Giant Mine and Con Mine near Yellowknife. An important factor determining the variability in total arsenic concentrations in fish around Yellowknife was the location and proximity of lakes to the legacy mining operations, whereas the speciation of arsenic in fish was influenced by both fish species and lake location. Arsenobetaine was the main arsenic species in fish muscle, with inorganic arsenic comprising less than 20% of total arsenic. Burbot liver contained primarily DMA, and less than 5% of total arsenic was inorganic arsenicals. Inorganic arsenic concentration in fish was inversely related to the total arsenic concentration in tissue, indicating that the inorganic arsenic concentration in fish tissue does not increase proportionally with the total arsenic concentration in tissue. Therefore, it is important to measure arsenic species for human health risk assessments.
Acknowledgments
We express our gratitude to the individuals who were actively involved in the fish collection effort for this project, namely Dr. Peter Cott, Michael Palmer, Gila Somers, Dr. Mark Poesch, and Dr. John Chételat. We thank all members of the Yellowknife Health Effects Monitoring Program Advisory members, Harriet Philips and Clarie McAuley, for providing constructive comments on the manuscript.
Disclosure statement
All authors report no potential conflict of interest.
Additional information
Funding
References
- Agency for Toxic Substances and Disease Registry (ATSDR). 2007. Toxicological profile for arsenic. U.S Public Health Service, Agency for Toxic Substances and Disease Registry [accessed August 24]. https://www.atsdr.cdc.gov/toxprofiles/tp2.pdf.
- Assembly of First Nations (AFN). 2009. First Nations perceptions of environmental issues: study areas of importance—building First Nations capacity in environmental health. Ottawa (ON). https://www.afn.ca/uploads/files/fn_perceptions_enviro_health.pdf
- Biggs ML, Kalman DA, Moore LE, Hopenhayn-Rich C, Smith MT, Smith AH. 1997. Relationship of urinary arsenic to intake estimates and a biomarker of effect, bladder cell micronuclei. Mutat Res-Rev Mutat. 386(3):185–195. doi:10.1016/S1383-5742(97)00012-4
- Butler LJ, Janulewicz PA, Carwile JL, White RF, Winter MR, Aschengrau A. 2017. Childhood and adolescent fish consumption and adult neuropsychological performance: an analysis from the Cape Cod Health Study. Neurotoxicol Teratol. 61:47–57. doi:10.1016/j.ntt.2017.03.001
- Canadian Council on Animal Care (CCAC). 2005. Guidelines on: the care and use of fish in research, teaching and testing. Ottawa (ON). http://www.ccac.ca/Documents/Standards/Guidelines/Fish.pdf
- Chan L., Rosol R., Cheung J., Parajuli R., Hu X., Yumvihoze E. (2019). Health Effects Monitoring Program in Ndilo, Dettah and Yellowknife. ProgressReport: Results from the Phase I Baseline Study (2017-2018)(2017). http://ykhemp.ca/documents/reports/Progress_Report_Phase_1_Baseline_Study_2019_.pdf (Accessed on July 23 2020).
- Committee on the Status of Endangered Wildlife in Canada (COSEWIC). 2005. Assessment and update status report on lake whitefish. Ottawa (ON). https://wildlife-species.canada.ca/species-risk-registry/virtual_sara/files/cosewic/sr_lake_whitefish_e.pdf (Accessed on July 23, 2020)
- Concha G, Vogler G, Lezcano D, Nermell B, Vahter M. 1998. Exposure to inorganic arsenic metabolites during early human development. Toxicol Sci. 44(2):185–190. doi:10.1006/toxs.1998.2486
- Cott PA, Johnston TA, Gunn JM. 2011. Food web position of burbot relative to lake trout, northern pike, and lake whitefish in four sub-Arctic boreal lakes. J Appl Ichthyol. 27(1):49–56. doi:10.1111/j.1439-0426.2011.01843.x
- Cott PA, Zajdlik BA, Palmer MJ, McPherson MD. 2016. Arsenic and mercury in lake whitefish and burbot near the abandoned Giant Mine on Great Slave Lake. J Great Lakes Res. 42(2):223–232. doi:10.1016/j.jglr.2015.11.004
- Daviglus M, Sheeshka J, Murkin E. 2002. Health benefits from eating fish. Comments Toxicol. 8(4-6):345–374. doi:10.1080/08865140215064
- de Rosemond S, Xie Q, Liber K. 2008. Arsenic concentration and speciation in five freshwater fish species from Back Bay near Yellowknife, NT, Canada. Environ Monit Assess. 147(1-3):199–210. doi:10.1007/s10661-007-0112-6
- Escudero-Lourdes C, Wu T, Camarillo JM, Gandolfi AJ. 2012. Interleukin-8 (IL-8) over-production and autocrine cell activation are key factors in monomethylarsonous acid [MMA(III)]-induced malignant transformation of urothelial cells. Toxicol Appl Pharmacol. 258(1):10–18. doi:10.1016/j.taap.2011.10.002
- Faure S, Noisel N, Werry K, Karthikeyan S, Aylward LL, St-Amand A. 2020. Evaluation of human biomonitoring data in a health risk based context: an updated analysis of population level data from the Canadian Health Measures Survey. Int J Hyg Environ Health. 223(1):267–280. doi:10.1016/j.ijheh.2019.07.009
- Foata J, Quilichini Y, Torres J, Pereira E, Spella MM, Mattei J, Marchand B. 2009. Comparison of arsenic and antimony contents in tissues and organs of brown trout caught from the river presa polluted by ancient mining practices and from the river Bravona in Corsica (France): a survey study. Arch Environ Contam Toxicol. 57(3):581–589. doi:10.1007/s00244-009-9300-4
- Fonseca AR, Sanches Fernandes LF, Fontainhas-Fernandes A, Monteiro SM, Pacheco F. 2017. The impact of freshwater metal concentrations on the severity of histopathological changes in fish gills: a statistical perspective. Sci Total Environ. 599-600:217–226. doi:10.1016/j.scitotenv.2017.04.196
- GNWT 2015. NWT State of the Environment Report. 18.2 Trends in hunting and fishing in the NWT. https://www.enr.gov.nt.ca/en/state-environment/182-trends-hunting-and-fishing-nwt (Accessed on July 23, 2020).
- Harvey B. 2009. A biological synopsis of northern pike (Esox Lucius). Canadian Manuscript Report of Fisheries and Aquatic Sciences 2885. Victoria (BC). http://www.dfo-mpo.gc.ca/Library/337844.pdf (Accessed on July 23, 2020).
- Health and Social Services. 2019. Arsenic in lake water around Yellowknife. https://www.hss.gov.nt.ca/en/newsroom/arsenic-lake-water-around-yellowknife (Access on July 23, 2020).
- Health Canada. 2007. Human health risk assessment of mercury in fish and health benefits of fish consumption. Ottawa (ON). https://www.canada.ca/content/dam/hc-sc/migration/hc-sc/fn-an/alt_formats/hpfb-dgpsa/pdf/nutrition/merc_fish_poisson-eng.pdf (Accessed on July 23, 2020).
- Health Canada. 2010a. Part I: guidance on human health preliminary quantitative risk assessment. Ottawa (ON): Government of Canada.
- Health Canada. 2010b. Part II: Health Canada toxicological reference values (TRVs) and chemical specific factors. Ottawa (ON): Government of Canada.
- Hibbeln JR, Davis JM, Steer C, Emmett P, Rogers I, Williams C, Golding J. 2007. Maternal seafood consumption in pregnancy and neurodevelopmental outcomes in childhood (ALSPAC study): an observational cohort study. Lancet. 369(9561):578–585. doi:10.1016/S0140-6736(07)60277-3
- Indigenous and.Northern Affairs Canada. 2018. Remediation Project’s Frozen Block Method. Accessed on July 23, 2020.
- International Agency for Research on Cancer (IARC). 2012. A review of human carcinogens. Part C: arsenic, metals, fibres and dusts. Lyon. http://monographs.iarc.fr/ENG/Monographs/vol100C/mono100C.pdf. (Accessed on July 23, 2020).
- Jia Y, Wang L, Li S, Cao J, Yang Z. 2018. Species-specific bioaccumulation and correlated health risk of arsenic compounds in freshwater fish from a typical mine-impacted river. Sci Total Environ. 625:600–607. doi:10.1016/j.scitotenv.2017.12.328
- Keeling A, Sandlos J. 2012. Giant Mine: historical Summary, 21. https://research.library.mun.ca/638/3/GiantMine_HistorySummary.pdf. (Accessed on July 23, 2020).
- Kligerman AD, Doerr CL, Tennant AH, Harrington-Brock K, Allen JW, Winkfield E, Poorman-Allen P, Kundu B, Funasaka K, Roop BC, et al. 2003. Methylated trivalent arsenicals as candidate ultimate genotoxic forms of arsenic: induction of chromosomal mutations but not gene mutations. Environ Mol Mutagen. 42(3):192–205. doi:10.1002/em.10192
- Lai MS, Hsueh YM, Chen CJ, Shyu MP, Chen SY, Kuo TL, Wu MM, Tai TY. 1994. Ingested inorganic arsenic and prevalence of diabetes mellitus. Am J Epidemiol. 139(5):484–492. doi:10.1093/oxfordjournals.aje.a117031
- Lunde G. 1972. The absorption and metabolism of arsenic in fish. FISKERIDIREKTORATETS SKRIFTER SERIE TEKNOLOGISKE UNDERS0KELSER 5(12). https://www.canada.ca/content/dam/hc-sc/migration/hc-sc/fn-an/alt_formats/hpfb-dgpsa/pdf/nutrition/merc_fish_poisson-eng.pdf (Accessed on July 23, 2020).
- Mandal BK, Suzuki KT. 2002. Arsenic round the world: a review. Talanta. 58(1):201–235. https://doi.org/10.1016/S0039-9140. (02)00268-0 doi:10.1016/S0039-9140(02)00268-0
- Mass MJ, Tennant A, Roop BC, Cullen WR, Styblo M, Thomas DJ, Kligerman AD. 2001. Methylated trivalent arsenic species are genotoxic. Chem Res Toxicol. 14(4):355–361. doi:10.1021/tx000251l
- Mazumder D. 2007. Arsenic and non-malignant lung disease. J Environ Sci Health, Part A. 42(12):1859–1867. doi:10.1080/10934520701566926
- Miklavčič A, Casetta A, Snoj Tratnik J, Mazej D, Krsnik M, Mariuz M, Sofianou K, Špirić Z, Barbone F, Horvat M. 2013. Mercury, arsenic and selenium exposure levels in relation to fish consumption in the Mediterranean area. Environ Res. 120:7–17. doi:10.1016/j.envres.2012.08.010
- Mozaffarian D, Rimm EB. 2006. Fish intake, contaminants, and human health. JAMA. 296(15):1885. doi:10.1001/jama.296.15.1885
- National Research Council (NRC). 2001. Arsenic in drinking water: 2001 Update. Washington, D.C.: National Academies Press. doi:10.17226/10194.
- Navas-Acien A, Francesconi KA, Silbergeld EK, Guallar E. 2011. Seafood intake and urine concentrations of total arsenic, dimethylarsinate and arsenobetaine in the US population. Environ Res. 111(1):110–118. doi:10.1016/j.envres.2010.10.009
- Nkondjock A, Receveur O. 2003. Fish-seafood consumption, obesity, and risk of type 2 diabetes: an ecological study. Diabetes Metab.29(6):635-42. doi:10.1016/S1262-3636(07)70080-0.
- Palmer MJ, Galloway JM, Jamieson HE, Patterson RT, Falck H, Kokelj SV. 2015. The concentration of arsenic in lake waters of the Yellowknife area. NWT Open File. Report No: 2015-06 (October 2016):29.NWT Geoscience Office,Yellowknife 25 p. doi:10.13140/RG.2.1.2582.5041.
- Pothier MP, Hinz AJ, Poulain AJ. 2018. Insights into arsenite and arsenate uptake pathways using a whole cell biosensor. Front Microbiol. 9:2310. doi:10.3389/fmicb.2018.02310
- Receveur O, Ing A, Chan L, Kuhnlein H. 1998. Recovery of Yellowknives Dene dietary survey. Ste Anne de Bellevue (QC). Montreal, QC, Canada: McGill University.
- Schnarch B. 2004. Ownership, control, access, and possession (OCAP) or self-determination applied to research: A critical analysis of contemporary First Nations research and some options for First Nations communities. Journal of Aboriginal Health. 1:80
- Schoof RA, Yager JW. 2007. Variation of total and speciated arsenic in commonly consumed fish and seafood. Human Ecol Risk Assess. 13(5):946–965. doi:10.1080/10807030701506454
- Smith AH, Lingas EO, Rahman M. 2000. Contamination of drinking water by arsenic in Bangladesh: a public health emergency. Bull World Health Organ. 78:1093–1103.
- Stantec. 2014. Analysis of contaminants in tissues of fish captured in the Yellowknife Bay area, NT, (March). http://www.rpic-ibic.ca/documents/RPIC_FCS2014/Presentations/SIBBALD_rpic_fcs_april16_930am_csibbald_english.pdf (Accessed on July 23, 2020).
- Tanamal C. 2019. The Impacts of Legacy Mining Operation onInorganic Arsenic Bioaccumulation and Exposure in Yellowknife, NorthwestTerritories, Canada. M.Sc. thesis. The University of Ottawa. July 23, 2020
- United States Environmental Protection Agency (US EPA). 2000. Guidance for assessing chemical contaminant data for use in fish advisories. Volume 2, Risk assessment and fish consumption limits. 3rd edition. Report No. EPA 823-B-00-008. Washington (DC): United States Environmental Protection Agency.
- United States Environmental Protection Agency (US EPA). 2019a. updated problem formulation and systematic review protocol for the inorganic arsenic IRIS assessment. Report No: EPA/635/R-19/049. Washington (DC): United States Environmental Protection Agency.
- United States Environmental Protection Agency (US EPA). 2019b. Regional screening levels (RSLs)—user’s guide. [accessed 2019 November 15]. https://www.epa.gov/risk/regional-screening-levels-rsls-users-guide#arsenic
- Wang S, Mulligan CN. 2006. Occurrence of arsenic contamination in Canada: sources, behavior and distribution. Sci Total Environ. 366(2-3):701–721. doi:10.1016/j.scitotenv.2005.09.005
- Wnek SM, Kuhlman CL, Camarillo JM, Medeiros MK, Liu KJ, Lau SS, Gandolfi AJ. 2011. Interdependent genotoxic mechanisms of monomethylarsonous acid: role of ROS-induced DNA damage and poly(ADP-ribose) polymerase-1 inhibition in the malignant transformation of urothelial cells. Toxicol Appl Pharmacol. 257(1):1–13. doi:10.1016/j.taap.2011.08.029
- Zhang W, Guo Z, Zhou Y, Chen L, Zhang L. 2016. Comparative contribution of trophic transfer and biotransformation on arsenobetaine bioaccumulation in two marine fish. Aquat Toxicol. 179:65–71. doi:10.1016/j.aquatox.2016.08.017
- Zhang W, Huang L, Wang WX. 2012. Biotransformation and detoxification of inorganic arsenic in a marine juvenile fish Terapon jarbua after waterborne and dietborne exposure. J Hazard Mater. 221–222:162–169. doi:10.1016/j.jhazmat.2012.04.027