
 ?Mathematical formulae have been encoded as MathML and are displayed in this HTML version using MathJax in order to improve their display. Uncheck the box to turn MathJax off. This feature requires Javascript. Click on a formula to zoom.
Abstract
An overview of recent European background inorganic arsenic (iAs) levels and related human health risks is given. The main aim was to summarize and confront the existing concentration data, unresolved low dose-response issues (linearity, nonlinearity, threshold, adaptation, hormesis), and methodological approaches hampered by several uncertainties on several levels. Daily doses are calculated from dietary intake (food, water As content multiplied by intake frequencies) and compared by reverse calculated doses from urine iAs metabolites (iAs + dimethylarsenic acid + monomethylarsonic acid) from human biomonitoring data (both in a range 0.05–0.60 μg kg−1 bw/day for children, adolescents and adults). With data obtained a health risk assessment is performed by existing regulation norms. Several flaws are addressed. For instance, urine DMA used as iAs metabolite is overestimated as its source can also be food items. Further, existing regulation norms (which are under reevaluation by US EPA) are based on a linear dose-response approach valid for high exposure only and highly questionable at low exposure levels. Nevertheless, even by using the conventional approaches with discussed flaws leading to anticipated overestimation, the potential cancer risk was estimated to be of low concern regarding the margins of exposure (MOE) for investigated age groups with average food intake and average iAs concentration in diet (15.3–40.6), supported by MOE calculated from human biomonitoring data (21.4).
Introduction
The main aim of the given overview was to critically evaluate the exposure of the European population to inorganic arsenic (iAs) and related human health risks using the data from the last 20 years. Current European background levels of iAs in food items and drinking water and measured exposure via As metabolites in human urine (biomonitoring studies) were used for daily doses calculations. Calculated daily doses were further used for risk assessments by existing regulative norms. Critical issues in methodological approaches including As analyses, population data collection, and flaws in assessing the health risk at low exposure levels are stressed in light of new findings. Most data included are from the studies published after the year 2000.
In the first part, we briefly summarize arsenic exposure in Europe and emphasize problems using existing regulations developed on high dose-response data for risk assessment at low-level exposure.
Further, we calculate the exposure of different population groups (iAs daily doses) obtained by combining intake frequencies (FoodEx Citation2016) and iAs concentrations in food items and drinking water or by reverse dose calculation (Hays et al Citation2010) from urine iAs metabolites gathered in human biomonitoring (HBM) studies, respectively. Both types of daily iAs dose estimates—from food intake and HBM urine data—are further used for the assessment of As (cancer) health risks based on the proposed regulative levels.
Using the conservative risk assessment approach by applying existing regulative norms given in Box 1, the assessed risk is still very low, particularly for a population with low As exposure in drinking water (far below 10 μg L−1) as valid for most Europeans, who consume the mean amount of food with mean iAs content. Obtained results rarely exceed warning levels; regarding lung cancer the simple multiplication of estimated daily doses of iAs from diet or HBM studies with a proposed lifetime excess cancer risk of 1.7 × 10⁻³ per 1 µg kg−1 bw/day (JECFA Citation2011) results in 2.4 × 10⁻⁴ expected cancers. Nevertheless, the calculated value must be interpreted with caution as the credibility of such simple calculations, based on poorly justified assumptions, is misleading.
Proposed regulative levels used in this work.
Accordingly, in the end, we accentuate and discuss several uncertainties related to low iAs exposures (particularly < 10 μg L−1 arsenic in drinking water) which are mostly disregarded in daily food calculations, HBM studies, and risk assessments as has been already warned in several publications. They are requiring enhanced attention and consideration in future research and risk assessment, respectively. Regarding new relevant scientific data, the existing conservative approaches are highly questionable, and believed to overestimate risk at low exposure levels (below 50–100 µg L−1 of arsenic in drinking water). Primarily, the existing limits were not supposed to be used for very low exposure levels as the shape of low-dose-response curves has not been tested at the time. Further, all existing regulatory limits and officially proposed cancer risk slopes are derived by extrapolations of evidence obtained from human studies investigating the effects of high(er) iAs exposures from regions with endemic contamination of drinking water that require various assumptions (e.g., linear non-threshold dose-response across all exposure levels disputed by recent data, physiological and nutritional similarity among different populations). Such assumptions mostly remain inadequately considered or transparently acknowledged and inevitably contribute to the uncertainties of the risk assessment process following regulatory guidelines. In addition, there is an increasing amount of evidence that is not yet acknowledged by regulatory guidelines about the mode of action evidence on a cellular level that suggests adaptation (or hormesis) mechanisms at low levels of iAs exposure, further supporting the notion of nonlinearity and/or a threshold, which has to be exceeded for the toxic effects to prevail. In general, repeated low-dose exposures to internal or environmental stresses (including contaminants like As and radiation) appear to induce adaptive mechanisms that result in protection and reduce the risk to develop negative effects including cancer (probably by the activation of the Nfr2 response) (Davies Citation2016; Sthijns et al Citation2016; Calabrese and Kozumbo Citation2021; Rix et al Citation2022).
Inorganic As exposure and low-dose/exposure issues
Arsenic compounds
Arsenic is omnipresent in the geosphere and biosphere. As one of the most known poisons in human history it is, without doubt, harmful when ingested or inhaled in higher concentrations (Klaassen et al. Citation2013). Opinions on its effects at very low concentrations vary from beneficial to harmless and toxic. So-called “arsenic eaters” from Austria ( (Przygoda et al., Citation2001; Scientific American Citation1869) show the first evidence that arsenic might even be essential, the research which was much later connected to methionine metabolism and DNA methylation (Uthus Citation1992, Citation2003), although the essentiality of arsenic was never confirmed.
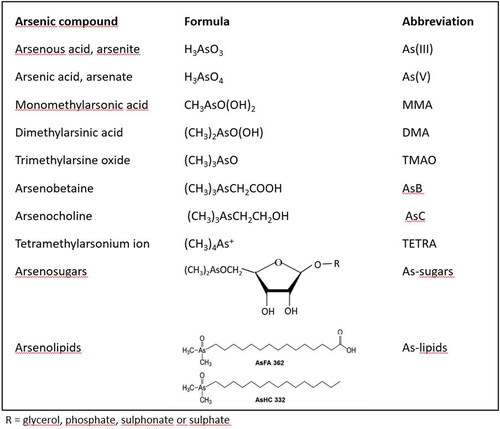
Arsenic as a chemical element is present in the environment in a form of numerous compounds. Due to the different toxicity, knowledge of the type of compound (speciation) is imperative, since total arsenic concentrations say little about the potential health risks (Luvonga et al. Citation2020). Although this study is focused on toxicologically most relevant As species—primarily iAs, also some other common arsenic compounds are given in . Arsenic compounds are further grouped below according to their potential impact on human health into toxicologically most relevant species, nontoxic and almost nontoxic species, and other species with unknown toxicity or very low abundance in food. In analytical chemistry, it is common to express the concentration of different arsenic compounds as arsenic so that 1 molar solution of any compound containing 1 atom of arsenic per molecule would have the same concentration of 75 g L−1.
Figure 1. Most common arsenic species in living organisms (Taleshi et al. Citation2014; Luvonga et al. Citation2020).
Toxicologically most relevant arsenic compounds
Inorganic arsenic (iAs) in its reduced (arsenite, As(III)) and oxidized form (arsenate, As(V)) is toxic. As(III) is more toxic and carcinogenic (indirectly-acting genotoxic carcinogen), but in the environment, in food, and human body As(III) and As(V) pass from one form to another and the equilibrium depends on redox conditions. As(III) targets sulfhydryl group-containing proteins and enzymes and disturbs several metabolic pathways. As(V) is more readily excreted, but anyway it can replace the phosphate group and is harmful to ATP production (Luvonga et al. Citation2020).
Monomethylarsonic acid (MMA) and dimethylarsinic acid (DMA), both of which contain arsenic in the pentavalent form, are the product of iAs methylation in the environment and organisms including humans. Their toxicity is tens of times lower than the toxicity of iAs but still significant. As a methylation end-product, the DMA content in humans is often higher than MMA content. In the absence of seafood intake, multiple studies have shown that between 60 and 80% of total arsenic in human urine is DMA (Del Razo et al. Citation1997). Metabolic intermediates, MMA(III) and DMA(III), in which arsenic is in trivalent form, are much more toxic but less frequently present in the environment and even then at much lower concentrations (Luvonga et al. Citation2020).
Nontoxic arsenic compounds and compounds with very low toxicity
Arsenobetaine is considered nontoxic. It is very common in the marine biota and is after ingestion excreted unchanged with urine. Tetramethylarsonium ion (TETRA), present in seafood in very low concentrations, also seems to have no toxicity (Sattar et al. Citation2016).
Compounds with unknown toxicity and/or low abundance in food
Arsenosugars, a range of ribofuranosides containing arsenic, are present mainly in seaweed and mollusks, possibly at fairly high concentrations. Upon ingestion, they are degraded to several products with unknown toxicity and DMA (Francesconi et al. Citation2002). Arsenolipids, a vast group of lipid-soluble compounds containing arsenic, are present in low concentrations in the fatty tissue of marine animals and algae (Al Amin et al. Citation2020; Xue et al. Citation2022). Their toxicity or potential physiological role is largely unknown and the major metabolite after ingestion of cod liver containing arsenolipids is DMA (Schmeisser et al. Citation2006; Xue et al. Citation2022). Among a range of different arsenolipids, some exhibit high cytotoxicity (Luvonga Citation2020) Trimethylarsine oxide (TMAO) and arsenocholine (AsC) are less toxic than MMA and DMA (Sattar et al. Citation2016), and their concentrations in food are often negligible. In food and the environment, many other organoarsenic compounds exist, many of them where oxygen in the above-mentioned compounds is replaced by sulfur—the so-called thiolated arsenic compounds. Their concentrations are usually much lower and toxicity varies from compound to compound and is in many cases unknown (Herath et al. Citation2018; Luvonga et al. Citation2020).
Arsenic in the environment and food in Europe
Soil
The soil in the EU generally contains low levels of arsenic with exception of some hot—spots, mainly connected to natural sources, mining, and industrial activities (Tarvainen et al. Citation2013). Over 95% of top soils in Europe contain less than 20 mg kg−1 of arsenic (P75 < 10 mg kg−1), including high proportion below 3 mg kg−1 (P25). The Working group on arsenic, cadmium, and nickel compounds evaluated the daily intake of arsenic from soil and dust to be 0.0017 µg kg−1 bw/day at an average arsenic concentration of 5 mg kg−1 in soil (European Commission Citation2001). Most arsenic in soil is in inorganic form and its bioavailability is low.
Drinking water
The level of arsenic in natural waters generally ranges between 1 and 2 µg L−1 (NRC 1999); all arsenic in drinking water is in inorganic form. The maximum permissible value for drinking water of 10 µg L−1 is recommended by WHO (2011), US EPA (2001), and the EU (Directive 2020/2184), while 1 µg L−1 is a goal in achievable conditions (WHO 2017). A survey of 579 tap water samples from EU and non-EU European countries showed that the median arsenic concentration in tap water is 0.19 µg L−1 (P75 0.47 µg L−1, Banks et al. Citation2015) with 99% of EU samples below 10 µg L−1. Dieter (Citation1994) found that 93.5% of drinking water samples in Germany were below 2 µg L−1 of arsenic, out of that 74.4% were below the detection limit and 1.2% above 10 µg L−1.
Drinking water in only some areas of Europe can contain arsenic levels above the current provisional guideline value of 10 µg L−1. Elevated arsenic in drinking water was reported in some areas of Romania, Hungary, Slovakia, Greece, Ireland, Croatia, Serbia, Denmark, Finland, and Italy (Van Halem et al. Citation2009).
Air
According to the data from 2017, in most parts of the EU, the mean annual level of arsenic in the air is low, mostly below the detection limit (<1 ng m−3) or 1–3 ng m−3 (EEA 2019). The Working group on arsenic, cadmium, and nickel compounds (European Commission Citation2001) evaluated the daily intake of arsenic from the air with an average concentration of 2 ng m−3 arsenic to be 0.0003 µg kg−1 bw/day.
Food
Comprehensive documents on total arsenic in food in the EU were published by European Food Safety Authority (EFSA 2009, 2014) and supplemented in 2021 with a new one, focused on iAs concentrations and exposure via food (EFSA 2021). summarizes the information on total arsenic and iAs concentrations in a broad range of food items from European markets reported in recent studies, published between 2015 and 2021. The data shown in was collected by considering only studies in which a high number of products from many food groups were analyzed by analytical procedures with relatively low detection limits. While the majority of foods are normally expected to include only low levels of arsenic, some food groups do need special attention.
Table 1. Recent data for total and inorganic As (iAs) concentrations in foods from European markets from studies with low detection limits and a large number of samples (mean values, µg kg−1).
The highest total arsenic concentrations of all foods are found in marine fish, mollusks, and crustaceans, which, in general, contain a very complex mixture of arsenic compounds, but with relatively low amounts of iAs. Arsenic speciation is mandatory to estimate the potential risk of adverse effects following ingestion (Luvonga et al. Citation2020). Some edible seaweeds can also contain high concentrations of iAs and arsenosugars (Banach et al. Citation2020; Luvonga et al. Citation2020; EFSA 2021). Potentially elevated content of DMA, arsenosugars, and arsenolipids in seafood is relevant for the estimation of dietary intake of iAs via urine analysis because all of these compounds yield increased DMA content in urine (Al Amin et al. Citation2020), which is at the same time used as a marker of iAs exposure. Anyway, the lack of examples of chronic toxicity among humans and other mammals consuming foods high in arsenosugars indicates low toxicity when compared to exposure to elevated iAs from drinking water.
Cereals, especially rice, are an important source of arsenic. Rice on the European market contains on average about 90 µg kg−1 of iAs and 20–30 µg kg−1 DMA (both dry weight, Šlejkovec et al. Citation2021). The EU specifies maximum allowable iAs levels of 200 µg kg−1 (white rice) and 250 µg kg−1 (parboiled and brown rice); rice products intended for infants and small children are allowed to contain less iAs (100 µg kg−1) (European Union Regulation 2006). Other cereals including wheat can also contain more arsenic than non-cereal plants (Upadhyay et al. Citation2019). Zhao et al. (Citation2010) investigated arsenic in wheat grown on low-arsenic soils in Europe (1.3–11 mg kg−1) and found 7.7 ± 5.4 µg kg−1 arsenic in grain; at one of the trial sites arsenic level in the soil was higher (29 mg kg−1), and much higher As concentrations (69 ± 17 µg kg−1) were present in the wheat grain. All arsenic in grain was in inorganic form. Further attention should thus be given to wheat, and potentially other cereals as well.
Mushrooms, especially wild ones, popular in several countries, also contain a broad mixture of arsenic compounds in potentially high concentrations and not rarely a lot of iAs as well (Braeuer and Goessler Citation2019). Nevertheless, the most commonly consumed button mushrooms (Agaricus bisporus) contain little iAs.
Health risk assessment of iAs and low-dose/exposure issues
Excessive to moderate long-term chronic exposure to iAs is related to various health effects (Fowler et al. Citation2015). Lung, skin, and bladder cancer are the three most sensitive and well-known targets of arsenic-related carcinogenicity, while ischemic heart disease and skin lesions (hyperpigmentation, hypopigmentation, and keratosis) are the most well-known non-cancer adverse health effects related to excessive iAs exposure. Other priority outcomes, although less well documented, are prostate, liver, and kidney cancer as probable targets of carcinogenicity; neurotoxicity; diabetes in susceptible subgroups; nonmalignant respiratory disease with inflammatory changes such as bronchitis and damage of the upper respiratory tract; infant morbidity (pregnancy outcome); and (prenatal) neurodevelopmental toxicity and immune effects (Fowler et al. Citation2015; Tsuji et al. Citation2019; Nurchi et al. Citation2020). Anyway, identification of arsenic-induced kidney, liver, and prostate cancer is difficult and highly uncertain as they may be confounded by other factors like for instance hepatitis for liver cancer.
Nevertheless, the main arsenic effects given above are indisputable in circumstances with prolonged moderate to high iAs exposure and less so at shorter exposure at high levels or longer exposure at lower levels. According to studies for Taiwanese populations exposed to As-contaminated water (Tseng et al. Citation1968; Tseng Citation1977), low (10–<300 μg L−1), medium (300–600 μg L−1) and high exposure (>600 μg L−1) resulted in 2.6/1000, 10.1/1000 and 21.4/1000 cases of skin cancer, respectively while in unexposed control population no skin cancer cases were observed among 7500 persons drinking clean water (1–17 μg L−1 As). The minimal amount of As in well water necessary to induce skin cancer was thus established to be less than 290 µg L−1 and much above 10 µg L−1. Based on this study, the WHO concluded that the lifetime risk for skin cancer is 25% per mg As/L of drinking water (WHO 1981; Fowler et al. Citation2015). In a later follow-up study of the same Taiwanese cohort, the increase in bladder cancer was found to be statistically significant only in subjects presumably exposed to contaminated drinking water for 40 years or longer (Chiou et al. Citation1995); Tseng et al. (Citation1968) found an increased incidence of skin cancer in the older population as well, although the youngest person with skin cancer in their study was only 24 years old. Additionally, Guo reported a significantly increased rate difference for bladder (Guo and Tseng Citation2000) and lung cancer (Guo Citation2004) in men and women in Taiwan exposed to greater than 640 µg L−1 in drinking water, but not at lower exposure levels. Further, the NRC analyzed the lifetime risk of bladder and lung cancer at various As levels in drinking water (linear modeling) and estimated that at low concentrations of 3 µg As L−1 in drinking water, the lifetime risk estimate for bladder and lung cancer combined is 4 × 10⁻⁴ and 11 × 10−4 using Taiwan or US background rates of these cancers, respectively (Morales et al. Citation2000 ; NRC 1999, 2001). Anyway, the later data must be interpreted with caution, as the risk could be lower due to possible confounding factors (e.g., co-exposures, nutrient deficiencies, and smoking) which were not taken into account.
In a meta-regression analysis of epidemiological data, Lynch et al. (Citation2017a) calculated a much lower lifetime risk of the bladder (2.20 × 10⁻⁶) and lung cancer (7.10 × 10⁻⁶) in the US at 10 μg L−1 of As in water using linear approach taking into account major differences between Asian and non-Asian populations included in their study (lower water consumption and higher average body weight in non-Asians). Later, these values were corrected to be 2.64 × 10⁻⁵ and 8.40 × 10⁻⁵ for bladder and lung cancer, respectively, although conclusions remained the same—epidemiological evidence for increased risk below about 100 μg L−1 of As in water remains inconclusive, and the incremental risks of bladder and lung cancer associated with iAs remain relatively low, relative to background lifetime cancer risk (Lynch et al. Citation2017b, corrigendum). In recent re-investigations using the same (non-threshold) models, Cohen et al. (Citation2019) have also noted that the association at low doses was largely determined by the relationship at high doses and listed various pieces of evidence supporting a non-linear approach.
Accordingly, Tsuji et al (Citation2019) performed a complex reevaluation of As health risks at lower exposures. They combined results from extensive mechanistic, in vitro, and in vivo, investigations with selected well-defined epidemiological data, using only studies with low As exposure in drinking water (<150 µg L−1). They provided an alternative model (mode of action-based approach) for assessing health-protective levels of oral arsenic exposure and estimated a threshold level for inorganic arsenic in the drinking water between 50 and 150 µg/L, which is consistent with the value calculated based on mechanistic, in vitro and in vivo investigations. It should also be noted, that based on the relevant epidemiological studies with individual-level data the Joint FAO/WHO Expert Committee on Food Additives also highlighted a possibility of a threshold level for iAs in drinking water for cancers of the urinary bladder, lung, and skin and non-skin cancer around 100 µg L−1 (or between 50 and 150 µg L−1) (JECFA Citation2011). In other words, for areas where arsenic concentrations in water are elevated between 10 and 50 μg/L, JEFCA concluded that while there is a possibility of some adverse effects, ‘these would be at a low incidence that would be difficult to detect in epidemiological studies’.
The estimated threshold level as given above (Tsuji et al Citation2019) is far above the recommended limit for As in drinking water (10 µg L−1). A similar estimation was also reported by Boffetta and Borron (Citation2019) in a meta-analysis with a slightly different set of epidemiological data and different statistical evaluations for lung and bladder cancer. Additionally, recent ecological analyses of the dose-response relationship between lung cancer incidence for US counties and As ground water supply (<50 µg As L−1) (Lamm et al Citation2018) and between prostate cancer incidence and As ground water supply (<200 µg As L−1) (Ahn et al Citation2020) indicate the existence of a threshold. In both studies modeled curve was of J-shape with minimum risk at 50 µg As L−1 in the first study and at 8–18 µg As L−1 in the second study. Their models include confounders such as smoking-related prevalence rates and demographic variables; the possible effect of iAs from food intake (estimated as national mean amounts; <4 µg As kg−1 bw/day) was also discussed and evaluated. Their results are pointing to the activation of adaptive mechanisms at low levels of exposure which is in accordance with experimental data on cell cultures.
Lately, much attention was given to the role of low iAs exposure in cardiovascular disease (CVD), but with no clear evidence. For instance, Sidhu et al. (Citation2015) could not find a well-established mode of action in the development of CVD at low levels of exposure (<100 µg L−1 in drinking water) and suggested a threshold mechanism at a cellular level. Some authors found a positive association between CVD and arsenic at levels < 50 μg L−1 in drinking water, but the evidence is unclear (Medrano et al. Citation2010; Xu et al. Citation2020); exposures were municipality-based with sometimes high differences between the lowest and the highest concentrations and the link at the individual level is missing. Moon et al. (Citation2013) also found associations between CVD and elevated arsenic in urine, but associations were attenuated after adjustments for confounders. Eshak et al. (Citation2014) studied the association between rice (a rich source of iAs) consumption and CVD morbidity or mortality in 91,000 Japanese participants and found no difference between low (251 ± 83 g/day) and high rice consumers (542 ± 127 g/day) even though participants with high consumption of rice tended to be older and less likely to practice sports daily. Muraki et al. (Citation2015) also found no association between eating white or brown rice and CVD in a population of 207,556 American men and women. Sun et al. (Citation2010) reported an association between white rice consumption and diabetes but an inverse association for brown rice consumption in a population of 39,765 men and 157,463 women. A higher intake of white rice (5 or more servings per week vs. <1 per month) was associated with a higher risk of type 2 diabetes. In contrast, high brown rice intake (2 or more servings per week vs. <1 per month), which contains more arsenic, was associated with a lower risk of type 2 diabetes. Farzan et al. (Citation2015) found a clear association between arsenic in toenails and CVD for long-time (30 years) smokers, but not for other participants.
Altogether, it could not be overlooked that an increasing number of studies are giving new evidence for a nonlinear approach for low-dose effects (Rhomberg et al. Citation2011; Lamm et al. Citation2018, Citation2021; Shao et al. Citation2021) and the existence of threshold not only for arsenic (Sidhu et al. Citation2015; Lamm et al. Citation2018; Boffetta and Borron Citation2019; Cohen et al. Citation2019; Tsuji et al. Citation2019; Ahn Citation2020; Cohen et al. Citation2021; Shao et al. Citation2021) but also for DNA-reactive and epigenetic experimental chemical carcinogens (Kobets and Williams Citation2019), and low dose radiation (LDR) as well (Tharmalingam et al. Citation2019). Accordingly, US EPA is preparing a new risk assessment guidance with opening new possibilities for using new epidemiological low-exposure data and different approaches in arsenic health risk assessment (including hierarchical, Bayesian meta-analysis approach combined with sensitivity analysis) (US EPA 2019; National Academies of Sciences, Engineering and Medicine Citation2019). Anyway, not all problems can be addressed by a sophisticated modeling approach without having relevant and detailed databases for confounders and exposure regimes, separate men and women studies, and without considering arsenic metabolism and the mode of action for arsenic toxicity and carcinogenicity (Scrafford et al. Citation2016; Tsuji et al. Citation2021). Among various investigated modes of action (Hughes et al. Citation2011; Cohen et al. Citation2019; Tsuji et al. Citation2019) are interaction with sulfur, interaction with phosphate, hypo/hypermethylation (dose-depending effect pointing to essentiality), apoptosis, oxidative stress, interferences with DNA repair, interference with signal transduction including low dose NRF-2 dependent (Schmeisser et al. Citation2013) protective effects; a lot of them are different at high and low doses. The question of arsenic essentiality was also never resolved for humans (Uthus Citation1992, Citation2003; Nielsen Citation1996; Przygoda et al. Citation2001; Yokel et al. Citation2006) although if existing, required amounts would probably be at the level of non-exposed populations. Essentiality evidence (at least for inorganic arsenic in some animal studies) was noticed and evaluated also by the US EPA arsenic science advisory board with a conclusion that arsenic essentiality is in ‘need of further research’ (US EPA 2007; Hughes Citation2011).
According to the investigations summarized above, it is clear that the existing As regulative is conservative, outdated, and overestimates the level of risk. With that in mind, the following evaluation of recent European iAs exposure for the age-stratified general population and corresponding risk estimated by existing regulative (Box 1) as presented in the next two chapters points to the need for redirection of HBM studies from general healthy populations to heavily exposed and/or extremely vulnerable populations. A rule should be to observe outliers. Besides, mostly the real problem is not a slightly elevated level of pollutants including As, but underlying socioeconomic factors leading to suboptimal nutrition (with a lack of vitamins, minerals, and proteins) and excessive psychological stress which usually stays hidden, with no evidence in HBM data obtained by questionnaires.
Estimation of iAs exposure via diet and related (cancer) risk estimates
The information on As concentration in the environment in the EU indicates that the largest amount of potential As exposure is expected to occur through the ingestion of food and drinking water, while the contribution of exposure through inhalation (at least for the general population) is expected to be of several orders of magnitude lower (European Commission Citation2001; EEA 2019) and, therefore, of relatively less importance. Consequently, in this study, we have been focused on the evaluation of iAs exposure through the oral route. A conservative approach was used for iAs bioavailability (taken as 100%) and for risk assessment by applying existing regulative norms (Box 1), which do not take into account several important uncertainties related to low As exposure calculations.
Calculation of iAs daily doses from the diet for different population groups
Dietary exposure to iAs for seven age-stratified population groups (infants, up to 1 year old, toddlers, 12–35 months, other children, 3–9 years, adolescents, 10–17 years, adults, 18–64, elderly, 65–74 years and very elderly, >75 years of age) was calculated. Estimated body weight (bw), used in the calculation, roughly corresponds to ages of 1 (infants, 10 kg), 3 (toddlers, 14 kg), 8 (other children, 30 kg), 14 (adolescents, 50 kg), and 18 and above (all adults, 70 kg). iAs exposure was calculated by multiplying the mean and P95 consumption of each food (FoodEx Citation2016, Level 1 data, additionally rice from Level 2) with the corresponding iAs concentration (minimum, mean, and maximum). iAs levels were taken from recent studies comprising a high number of samples and low detection limits (Jackson et al. Citation2012; Sommella et al. Citation2013; Mania et al. Citation2015; Cubadda et al. Citation2016; Chekri et al. Citation2019; EFSA 2021). Intake from different food categories was summed up and divided by estimated body weight for a particular population group. In the Supplementary, the detailed explanation of the methodological approach together with selected food items, coexisting iAs concentration levels, and countries included in the dietary survey are given in Tables S1, S2, and S3. These data allowed us to calculate exposure/daily intake per kg bw per day as summarized in .
Table 2. Summary of calculated iAs intake (daily dose per kg body weight, an average of all included countries) via food and water for EU population groups in comparison with BMDL0.5 value.
Table 3. Lifetime cancer risk calculated according to different oral cancer slopesTable Footnote* for age stratified population groups derived from calculated iAs daily doses from diet intake and from HBM urine data by reverse calculation, adopting the linear (non-threshold) approach, taking into account the duration of exposure for each population group.
A trend of gradual iAs intake decrease can be observed from infants to very elderly: infants > toddlers > other children > adolescents > adults and elderly > very elderly. Our calculations for different patterns (food intake, iAs concentrations) agree well with the newest literature data for the EU (EFSA 2021). For infants and toddlers, estimated iAs intake is higher compared to other age groups due to high food intake per kilogram of body weight (). Signes-Pastor et al. (Citation2017) studied infants during the weaning period and found a significant increase of iAs and its metabolites in the urine of 11 infants after weaning—the summary of iAs + MMA + DMA in urine increased from an average of 0.57 to 2.81 μg L−1. The increase was most associated with the consumption of rice cereal, fruit, and vegetables (Signes-Pastor et al. Citation2017, Citation2018). Calculated iAs intake for other children is somewhat lower—the average for 14 countries is 0.12 μg kg−1 bw/day for mean food intake and mean iAs levels (). Nevertheless, it should be noted that recent studies indicate that children possess an excellent capacity for methylation (second methylation ratio) of arsenic to DMA and are therefore less endangered than adults at a similar exposure level (Skröder Löveborn et al. Citation2016; Stajnko et al. Citation2019; Yamauchi and Takata Citation2021). In all population groups, the highest contribution to iAs intake is from the following groups: rice, grains, and grain-based products, nonalcoholic beverages (except milk-based beverages), vegetables and vegetable products, and, in adults, elderly, and very elderly, alcoholic beverages as well.
Risk estimated by BMDL0.5, CSF, and MOE for calculated iAs daily doses from food intake
Benchmark dose lower confidence limit (BMDL0.5)
Calculated daily doses of iAs via food intake are much lower () than BMDL0.5 (statistical benchmark dose lower 95% confidence limit), representing a 0.5% increased incidence of cancers of the lung and bladder as recommended by JECFA in 2011. The limits, 3–5 μg kg−1 bw/day for lung and 5.2–11.4 μg kg−1 bw/day for urinary bladder cancer, were obtained by modeling the data from selected studies. They selected north eastern Taiwan (China) population (Chen et al. Citation2010a, Citation2010b) presented in two prospective studies with a flow-up time of an average of 11.5 years, documented exposure categories below 100 μg L−1, and assessed smoking behavior and water use categories. The low end of the observed data range was a 0.5% increased incidence of cancer over the background. It is also interesting that the risk was elevated, but not significant for the exposure below 100 μg L−1. BMDL0.5 of 3 µg kg−1 bw/day for lung cancer presents the lowest value at which 0.5% increased risk is observed. Our calculated daily doses were much lower: for mean food intake and mean iAs levels for different population groups lie in a range of 0.07–0.20 µg kg−1 bw/day (15–43 times lower than BMDL0.5) and for P95 food intake and mean iAs levels between 0.19–0.64 µg kg−1 bw/day (5–16 times lower than BMDL0.5, ).
Oral cancer risk slope factors (CSF)
The excess lifetime risk of developing lung cancer from the intake of 1 µg kg−1 bw/day (close to 1 liter water per day at concentrations of 50 µg L−1), is 1.7 per 1000 based on BMDL0.5 data from north eastern Taiwan population mentioned above and evaluated by the non-threshold approach (JECFA Citation2011; ECHA 2013). The newest US FDA (2016) report used the same epidemiological studies with the Taiwan population (Chen et al. Citation2010a, Citation2010b), but included more explanatory variables in modeling. They estimate that 383 bladder and 1123 lung cancers per million are expected for 1 µg kg−1 bw/day (together 1.5 per 1000 based on BMDL0.5), all by assuming a non-threshold linear relationship at low levels as well. The usual level of acceptable risk for carcinogens is between 10−5–10−6 (US EPA 2022). According to the classification of Calman (Citation1996), 10−5 is minimal or acceptable and 10−6 is a negligible or insignificant risk (also accepted by Health Canada Citation2021). Anyway, 10−5 is mostly applied for contaminated sites or in exposure/non-exposure comparisons; US EPA is using this range for superfund regions (US EPA 2022) and otherwise the lower range end (10−6). According to considered linearity, health risk increases almost proportionally with an increase in daily iAs intake. Such calculations should be used only for populations with iAs doses within the range of the population used for the development of risk ranges, otherwise, there are serious uncertainties with low-dose extrapolations. Our assessment for even the highest exposure is an order of magnitude lower (5–16 times lower than BMDL0.5, ). Allen et al. (Citation2020) advocate for the use of Bayesian hierarchical dose-response meta-analysis of epidemiological studies which prioritize the use of high quality, low exposure (<100 μg L−1 in drinking water), incidence rate epidemiological studies with low risk of bias, and the consideration of linear and nonlinear models.
Using daily doses calculated for mean iAs content and mean food (or P95 for food) intake, we calculated cancer risk for the EU (). also gives comparable risk levels using HBM urine data for reverse daily dose calculations which are explained and commented on in the chapter “Estimation of arsenic exposure based on recent human biomonitoring (HBM) studies.” When the relative duration of each exposure period is taken into account, we assume that the life expectancy at birth in the EU is 81.3 years the calculated cancer risk is very low for younger populations due to the short time of exposure. For instance, infancy only lasts for one year and we cannot reasonably assume and extrapolate the estimated high daily doses during infancy throughout the lifetime and base increased cancer risk estimates on them. Apart from a change in a daily dose (i.e., from infants to toddlers and further toward adulthood) also changes in efficiency and rate of metabolism are not to be neglected. Cancer risk only becomes relevant for adults (in the area of 1 × 10⁻⁴–3 × 10⁻⁴ for mean and P95 food intake). Such estimates are only valid if a strictly linear (non-threshold) approach is taken into account, which disregards newer findings that support the threshold approach for cancer effects related to low-level arsenic exposure, estimated to be around 100 µg L−1 iAs in drinking water (between 50 and 150 µg L−1) (Boffetta and Borron Citation2019; Cohen et al. Citation2019, Citation2021; Tsuji et al. Citation2019, Citation2021). Recent epidemiological studies on selected large populations exposed to well-defined low As levels in drinking water (Lamm et al. Citation2018; Ahn et al. Citation2020) could not find any increase in cancer incidence at low-level exposures (10–50 μg L−1) although in a meta-regression analysis by Lynch et al. (Citation2017b, corrigendum), using linear approach, calculated water arsenic concentration needed to cause 10−4 cancers would be 1.19 μg L−1 for lung and 3.79 μg L−1 for bladder cancer.
Margins of exposure (MOE)
To overcome the concerns about low dose extrapolation by using cancer slope factors, EFSA (2009) recommends following a margin of exposure (MOE) approach for evaluating the potential risks associated with the food substances that are both genotoxic and carcinogenic and supposed to have non-threshold effects. MOE represents a ratio between BMDL and contaminant intake (see equation below) or in other words a ratio between the dose at which a small but measurable adverse effect can be detected (reference point—BMDL) and the total intake for consumers. The magnitude of the MOE gives an indication of the level of concern, but is not a quantification of risk; a small MOE indicates a higher concern than a very large one. In interpreting the MOEs calculation for iAs The Committee on Toxicity of Chemicals (COT 2016) accepted the BMDL0.5 lower limit of 3.0 µg kg−1 bw/day (lung cancers in humans) as proposed by JECFA (Citation2011), which was based on more reliable epidemiological studies (Chen et al. Citation2010a) than BMDL01 proposed by EFSA (2009). Furthermore, the COT (2016) noted that iAs does not appear to exhibit direct genotoxicity; it appears instead to exhibit genotoxicity as a secondary effect, potentially following primary effects such as oxidative damage, epigenetic effects, and interference with DNA damage repair. Later comprehensive reviews of the in vitro, animal, and human toxicology support cytotoxicity and regenerative hyperplasia as the key mode of action for toxicity and carcinogenicity (Cohen et al. Citation2019; Tsuji et al. Citation2019). For mentioned reasons, the COT (2016) agreed that in this case a MOE of 10 or above would be considered of low concern, values between 1 and 10 are associated with very low risk, and values below 1 present a higher level of risk (COT 2016).
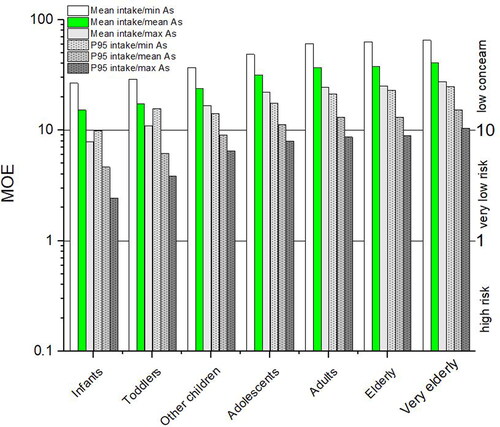
In MOEs are calculated taking into account calculated iAs intake as given in (average daily dose for data from all countries for different population groups) and JECFA recommended BMDL0.5 (JECFA Citation2011). All obtained MOE levels, regardless of the age group and/or food exposure scenario, are above 1 which is outside of a higher level of risk. Furthermore, all MOE levels related to any population age group with mean food intake and mean iAs, are above 10 thus representing very low concern. Accordingly, the exposure of infants and toddlers is of low concern for mean food intake and at the same time min or mean iAs concentration group (MOE 15.2–29.0), and is at very low risk for groups with P95 food intake and maximal arsenic concentration group (MOE 2.4–10.9). MOE for other children is higher (6.5–37.0). Adolescents are very close to adults (MOE 8.0–48.5). For adults, the elderly, and the very elderly, calculated MOE is very similar between groups. Exposure is of low concern for all (MOE 12.6–65.2) except for P95 food intake and maximal arsenic concentration group (MOE 8.7–9.5), which is of very low risk.
Figure 2. Margins of exposure calculated with the newest BMDL0.5 value of 3 µg kg−1 bw/day (JECFA Citation2011; COT 2016). In green, mean food intake with mean iAs is highlighted.
Estimation of iAs exposure based on recent human biomonitoring (HBM) studies
Human biomonitoring studies
Human biomonitoring studies are evaluating human internal As concentrations in larger populations and can confirm the exposure regardless if routes of administration and whether concentrations of arsenic in diet and the environment are known or not. A marker of iAs exposure is a concentration of iAs and its metabolites MMA and DMA in urine. Anyway, according to German standards, concentrations of total urine arsenic up to 15 µg L−1 are considered normal (Schulz et al. Citation2009), largely due to the expected presence of nontoxic arsenobetaine. Elevated concentrations of total arsenic in the urine of the non-exposed population can almost always be ascribed to arsenobetaine ingested with seafood and excreted unchanged. includes urinary arsenic data (summary of toxicologically relevant species iAs and its metabolites MMA and DMA) from recently published HBM studies in Europe (most published after 2010, one older study from the Czech Republic from 2002 included as well since there are no newer data for the area) and, for comparison, in the USA and Canada.
Table 4. Urinary concentrations of iAs and its metabolites according to recent findings of human biomonitoring projects of populations without known exposure to arsenic and a daily dose of iAs per kg body weight taking into account the relationship from Hays et al. (Citation2010), calculated from measured data.
It should be noted that when the total arsenic concentrations are elevated in HBM studies, arsenic speciation in urine is mandatory for risk estimation, and even then not fully reliable. DMA is the main product of iAs methylation in a body but DMA detected in urine can also originate directly from food, especially from rice and seafood, and can also be formed from ingested arsenosugars and arsenolipids (Francesconi et al. Citation2002; Schmeisser et al. Citation2006; see chapter Uncertainties). This is visible from Study 21 (), which reported unusually high urinary iAs + MMA + DMA. The authors suspect that DMA must have originated directly from the diet (Yusà et al. Citation2018).
Risk estimation by biomonitoring equivalents (BE) for noncancer effects
Biomonitoring equivalent (BE) is defined as the concentration of a chemical or its metabolites (iAs + MMA + DMA) in a biological medium (urine) that corresponds to an existing health-based exposure guidance value and is calculated using pharmacokinetic data (Hays et al. Citation2010). BE can be used as a screening tool to interpret population biomonitoring data in a health risk context (e.g., LaKind et al. Citation2008; Kirman et al. Citation2012). Yet, each BE is only as strong as the exposure guidance value on which is based. As already mentioned, in the case of low iAs exposures, the available guidelines/recommendations have been questioned and are still a matter of debate and reevaluation (Cohen Citation2019, Citation2021; National Academies of Sciences, Engineering and Medicine Citation2019; Tsuji et al. Citation2019, Citation2021; US EPA 2019) and the caution is needed in using BE as also warned by Kenyon (Citation2021).
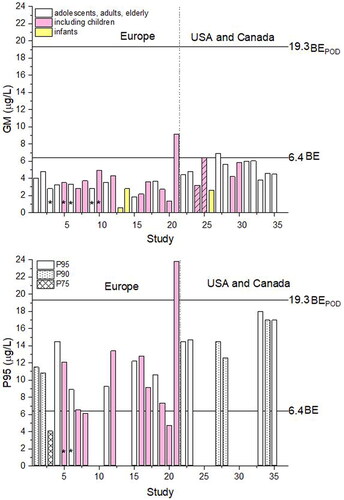
BE for iAs as suggested by ATSDR for chronic exposure (non-cancer end-points) is 6.4 µg L−1 and BEPOD (BE point of departure) is 19.3 µg L−1 of iAs + MMA + DMA (ATSDR Citation2007; Hays et al. Citation2010). includes 35 sets of urinary arsenic data (sum of toxicologically relevant species iAs and its metabolites MMA and DMA) from recently published HBM studies (after 2010) in Europe and, for comparison, some studies from the USA and Canada. Geometric mean (GM) data from the European studies (1.33–4.80 µg L−1, one outlier, 9.15 µg L−1, ) compared to BE for iAs with its metabolites indicate low priority for follow-up studies for all but Study 21. P95 urinary iAs and its metabolites are in the range of 4.7–14.5 µg L−1, still below BEPOD, and one outlier has reached 23.9 µg L−1 (Study 21). Reasons for high iAs in study 21 were attributed to seafood and cereals consumption (Yusà et al. Citation2018). In absence of seafood ingestion, the measured biomarker values which are above the human equivalent BEPOD indicate a high priority for risk assessment follow-up (LaKind et al. Citation2008).
In , geometric means (GM) and P95 data from HBM studies from are compared to BE for non-cancer endpoints. An especially interesting example is a Study 24/25 of 7398 children from the USA (Bulka et al. Citation2017), in indicated with striped columns. It shows how small differences in the calculation of results (adding up iAs + MMA + DMA, study 25, or subtracting AsB and AsC from the total As concentration, study 24) can change the explanation of data—either well below or spot on BE value (see chapter “Uncertainties related to the HBM studies—arsenic speciation in urine” for further explanation). For the evaluation of HBM data, it is important to keep in mind the prevalence of studies including children (in colored pink) over studies including other population groups.
Figure 3. Sum of iAs and its metabolites MMA and DMA in urine in recent HBM studies numbered as in . *indicates sets of data given in µg/g creatinine. Striped, are GM data from the same study calculated either by summing iAs + MMA + DMA (Study 25) or by subtracting arsenobetaine and arsenocholine from the total As (Study 24) in the study of Bulka et al. (Citation2017, ). In studies 1, 2, 27, 28 and 34, P90 data are shown (dotted) and in study 3, P75 instead of P95 is shown (crossed).
Comparison of daily dose and risk estimates obtained by diet and HBM urine data
To calculate the amount of arsenic excreted (iAs + MMA + DMA) depending on the dose ingested, Hays et al. (Citation2010) used a simple ratio between the administered dose and the excreted quantity of urine, because it was quite stable in studies conducted in healthy volunteers by Tam et al. (Citation1979) and Buchet et al. (Citation1981), with an average 61% excreted fraction (Hays et al. Citation2010). The expected urinary arsenic concentration (Cv) (in μg L−1) after administration of a D dose expressed in μg kg−1 bw was calculated by applying the following formula:
For the expression in μg g−1 of creatinine, the urine output is replaced by the amount of creatinine excreted daily to give concentration Cc in urine. The average concentrations expected after exposure to 1 μg kg−1 bw/day are 24.2 μg L−1 or 31.1 μg g−1 creatinine. This relationship offers the possibility to back-calculate daily dose (reverse dosimetry) from the urinary concentrations of iAs and its metabolites () by dividing urinary iAs + MMA + DMA concentration by 24.2 when given in μg L−1 or by 31.1 when given in μg g−1 creatinine.
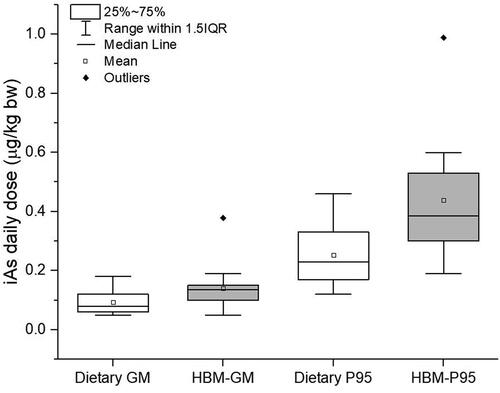
The daily dose derived from HBM data in the EU is 0.14 ± 0.04 µg kg−1 bw/day (average value of GMs) ( and ). Due to a small number of studies, the average includes children (almost all above age 6 years), adolescents, and adults. HBM-derived data are in good agreement with daily dose calculated from food intake and iAs concentration data in food in for mean food intake for other children (0.08–0.18 µg kg−1 bw/day), adolescents (0.06–0.14 µg kg−1 bw/day) and adults, elderly and very elderly (0.05–0.12 µg kg−1 bw/day). For P95 food intake, calculation from food intake (0.19–0.46 µg kg−1 bw/day, ), also agrees with HBM-derived data (0.42 ± 0.13 µg kg−1 bw/day, ), although HBM-derived data are on a higher side. From these calculations, we can be confident that there are no major »hidden« exposures for the general population. Except for study 21, an outlier with much higher iAs + MMA + DMA in the urine of children and adolescents performed in Spain, there is a noticeable absence of proof that children are exposed to a higher daily dose of iAs (). Similar conclusions were derived for 120 children in China, albeit at much higher daily doses (Wang et al. Citation2022). Average calculated daily doses for 3–6-year-olds were double compared to 7–12-year-olds, which was again about double as for 13–17-year-olds. Differences in unadjusted urinary arsenic levels were much smaller. After adjustment for creatinine, arsenic levels were double for 3–6-year-olds compared to 7–12 years olds while older children did not differ much from 7–12-year-olds (Wang et al. Citation2022). Adjustment of urinary arsenic for creatinine will tend to increase urinary arsenic concentrations for younger children versus older children because of the increase in lean body mass and urinary creatinine with age (Barr et al. Citation2005). Very few data are available for infants and toddlers. Signes-Pastor et al. (Citation2017) studied a group of 79 infants before and after weaning and found a significant increase in urinary iAs + MMA + DMA levels post-weaning (2.81 µg L−1) compared to pre-weaning (0.57 µg L−1).
Figure 4. Comparison of iAs dose calculated from food and drinking water intake (Dietary GM and P95) and from HBM measured urinary data (HBM-GM and P95) for a mixed group of other children, adolescents, and adults as given in Table 4.
Somewhat higher HBM-derived data compared to calculated daily doses are expected since dietary exposure calculations do not include additional exposure of smokers (European Commission Citation2001; Brima et al. Citation2006; Minichilli et al. Citation2018), undetected or unknown occupational exposure, and exposure via air, soil, and dust. An especially important source of discrepancy is the direct ingestion of DMA and its precursors’ arsenosugars and arsenolipids (Francesconi et al. Citation2002; Schmeisser et al. Citation2006), which is not included in dietary exposure calculation but is measured in urine. Compared to iAs, seafood often contains more DMA, arsenosugars, and arsenolipids (Taylor et al. Citation2017; Al Amin et al. Citation2020). Except for rice and seafood, DMA concentrations in other food are mainly unknown so the calculation of dietary exposure to DMA is highly speculative. Nevertheless, a rough estimate gives a very broad range from 0.01 to 0.16 µg kg−1 bw/day for adults with main contributions from rice, cereals, meat, and fish when consumption is combined with DMA content using the same Foodex (Citation2016) database for quantities of consumed food as for other calculations (Supplementary Table S4 for concentrations and references). The highest HBM-measured urinary iAs levels were observed in Spain, a country with on average the highest seafood consumption of all included countries (75 g/person/day, Foodex Citation2016). One needs to be aware that additional dietary contribution of directly ingested DMA and DMA from the degradation of arsenosugars and arsenolipids is expected to be of lower risk as exposure to iAs due to the lower toxicity of DMA (Taylor et al. Citation2017). DMA also undergoes different metabolic pathways; according to ATSDR (Citation2007), the minimum risk for chronic exposure is expected at 20 µg kg−1 bw/day, a much higher daily dose compared to iAs. Analytical problems discussed in the next chapter (very low urinary concentrations, several compounds below detection limit in many samples) might also contribute to the overestimation of exposure based on HBM data. HBM data would thus show a darker picture of iAs exposure as it is, especially for higher (P95) data, which would be expected to include more dietary DMA.
Estimated cancer risk from HBM-derived average daily doses (0.14 ± 0.04 µg kg−1 bw/day) taking into account the previously discussed non-threshold approach lies around 2.1 × 10⁻⁴ (lung + bladder cancer, cancer slope 1.5 × 10⁻³ from US FDA 2016) and 2.4 × 10⁻⁴ (lung cancer, cancer slope 1.7 × 10⁻³, JECFA Citation2011) and is from reasons connected to non-threshold approach most probably overestimated as discussed in the literature data (Rhomberg et al. Citation2011; Sidhu et al. Citation2015; Lynch et al. Citation2017a; Lamm et al. Citation2018, Citation2021; Boffetta and Borron Citation2019; Cohen et al. Citation2019, Citation2021; Tsuji et al. Citation2019; Ahn Citation2020; Shao et al. Citation2021). Cancer risk calculated from HBM studies is higher than cancer risk calculated from dietary data, mainly due to the additional contribution of directly ingested and excreted DMA, which does in reality pose a lower risk than iAs.
MOE for iAs intake calculated from food () are in the same range as MOE calculated from HBM data. MOE from mean food intake combined with mean iAs content for other children, adolescents, and adults are between 23.8 and 37.0 (low concern, ), while HBM data for Europe for the same population groups result in MOE of 21.4, also a low concern (calculated from GM urinary iAs + MMA + DMA from transformed to internal dose according to Hays et al. (Citation2010)). For P95 HBM data (), a MOE of 7.14 was calculated, agreeing well with data from P95 food intake combined with maximum iAs concentration resulting in MOE of 6.5–8.7 (), both in a very low-risk group.
Finally, although the default linear risk assessment approach with oral cancer slope risk factors could imply elevated risk level of developing cancer (>10−6, ), the scientifically more reasonable MOE approach suggests that only the individuals with a not seemingly reasonable range of exposure are possibly at very low cancer risk. Nevertheless, taking into account the uncertainties discussed throughout the text and specifically in the next sections, both approaches yield uncertain and overestimated estimates.
Uncertainties
Several uncertainties related to low As exposures are mostly disregarded in daily food intake calculations, HBM studies, and risk assessments as has been already warned in several publications. One of the most recent is a review “Essential Concepts for Interpreting the Dose-Response of Low-Level Arsenic Exposure in Epidemiological Studies” published in a special issue of “Toxicity and Carcinogenicity of Arsenic” of the journal Toxicology (Tsuji et al Citation2021). Uncertainties are related to potential errors with all analytical techniques; unknown bioavailability of iAs from different food items; unreliable information of self-reported data related to food intake or other personal data influencing As metabolism (past exposures, nutritional status, smoking, chronic diseases), and consequently risk assessment; representativeness of populations and applicability of epidemiological data; urine DMA levels as an unreliable biomarker of iAs exposure due to its wide spread presence in food; lacking mechanistic (mode of action) explanation or evidence of a causal association between iAs exposure and specific endpoints at low doses; ignorance of adaptation mechanisms at low-level exposure; linear versus nonlinear dose-response relationship or threshold versus non-threshold dose-response approach; and susceptibility to As at population and/or individual level. Considering all of them, consistent and trustworthy risk assessments at low exposure levels seem to be hardly achievable.
A few of these uncertainties, most relevant from our point of view, are emphasized below.
Uncertainties related to from food intake
Calculation of exposure (daily doses) at low levels is particularly vulnerable due to the lack of data on arsenic speciation (iAs concentration) in a wide range of foods and a high number of food items with no detectable arsenic, for which detection limit determines a high proportion of the daily dose. High overestimation is possible in a case of high detection limits as is especially obvious in an old document of EFSA (2009). A wide range of possible iAs content within the same food groups also makes calculations difficult. Additionally, the oral bioavailability and bioaccessibility of iAs from different food items or food mixtures is not well known and by using a conservative approach we should be aware that we are dealing with a potentially high overestimate when assuming that bioavailability is 100% (2 to 3.7 fold for iAs from rice, Li et al. Citation2017). Unreliable information about self-reported food intake also adds to uncertainties in calculated exposure.
Uncertainties related to the HBM studies—arsenic speciation in urine
In human biomonitoring (HBM) studies, arsenic speciation in urine is typically performed in spot samples, which show sufficiently stable urinary arsenic profile (presence and concentration of arsenic compounds, Calderon et al. Citation1999) when adjusted to specific gravity or creatinine to correct for dilution (Hsieh et al. Citation2019; Middleton et al. Citation2019). In epidemiologic studies, variations in hydration are expected to follow Gaussian distribution and if the number of participants is high enough, geometric means and P95 data will not be greatly affected if raw data (not corrected to SG or creatinine) will be taken. However when data with low exposure levels are used in gene-environment associations studies—associations between iAs metabolites and AS3MT genetic polymorphisms—the most reliable adjustment is unavoidable, and SG is better than creatinine although still not the ideal solution (24 h samples of urine are usually a rarity). Adjusting spot urine samples using creatinine or SG adds additional uncertainty and variation (Barr et al. Citation2005; Bulka et al. Citation2017; Abuawad et al. Citation2022). Low urinary creatinine is also associated with diseases such as diabetes and risk of cardiovascular disease (Oterdoom et al. Citation2009; Carter et al. Citation2012). However, adjusting for or dividing the urinary arsenic concentration by a low urinary creatinine level increases the urinary arsenic concentration per gram of creatinine, thereby resulting in an association with these diseases.
Separation and accurate quantification of a range of toxicologically relevant arsenic species are common to several analytical techniques with high-performance liquid chromatography, which separates the compounds of interest (As(III), As(V), MMA and DMA, and potentially arsenobetaine) before detection, being the base of most of them (B'Hymer and Caruso Citation2004; Nearing et al. Citation2014). For quality control purposes, Standard Reference Materials (SRMs) for arsenic speciation in urine are available from the National Institute of Standards and Technology, USA (NIST SRM 2669, NIST SRM 3669) and the National Institute for Environmental Studies, Japan (NIES No. 18). Nevertheless, despite strict quality control measures and several available intercomparisons, arsenic speciation at these very low (background) levels as in the case of diluted urine of unexposed populations, is a demanding task. Bulka et al. (Citation2017) made two estimates of exposure to iAs using the same set of measured total arsenic and its metabolites in 7398 urine samples: results obtained by subtracting arsenobetaine and arsenocholine (both considered nontoxic) from the total urinary arsenic, were twice as low as the sum of As(III), As(V), MMA and DMA (3.2 and 6.4 µg L−1, respectively). Such differences are possible if values below the limit of detection are taken as a part of the LOD value (LOD/2 or LOD/√2), often the case for 3 out of four expected compounds or due to uncertainty in measurements. A possible reason might also be an overestimation of tiny peaks in a noisy baseline, which is sometimes done “by hand” since software might in some set-ups be unable to correctly identify very small peaks—this is particularly common if urine samples are diluted before analysis to prevent deterioration of chromatographic column performance. Normally the concentration of iAs and its metabolites is measured in diluted samples and concentrations of As(III), As(V), MMA, and DMA are summed up, and, as indicated in the example of Bulka et al (Citation2017), might at least sometimes yield questionable results.
Uncertainties related to iAs metabolism
A confusing role in the urine-derived estimation of dietary exposure to iAs as the most toxic arsenic species is played by DMA in food. Not all urinary DMA represents the metabolic end product of ingested iAs. DMA is a relatively common less toxic arsenic species present in higher concentrations, especially in rice and seafood, which is not taken into account when calculating iAs exposure. In the US, DeCastro et al. (Citation2014) found elevated DMA among NHANES study participants related to fish, fruits, grain products, legumes, nuts, seeds, meat, poultry, sugars, sweets, and beverages consumption as well. The presence of urinary DMA from the breakdown of some other less toxic organic As compounds (arsenosugars, arsenolipids; Francesconi et al. Citation2002; Schmeisser et al. Citation2006) in vivo and from its direct intake via seafood and rice is confounding to biomonitoring studies (Aylward et al. Citation2014)—DMA is not a reliable marker of iAs exposure (Navas-Acien et al. Citation2011 and references therein). Its concentration in urine thus reflects recent ingestion of DMA, arsenosugars, arsenolipids, and iAs. Intake of at least ¼ cup of cooked white rice (14.1 g of dry rice) in a day before urine sampling was shown in urinary median arsenic in 2323 American children; urine of non-rice eaters contained 5.5 µg L−1 and of rice-eaters 8.9 µg L−1 of total arsenic, mainly in a form of DMA (3.6 and 6.0 µg L−1, respectively) (Davis et al. Citation2012). For that reason, 3-day abstinence from seafood routinely advised before urine sampling should also be used for rice when rice is not a daily staple food. For estimation of exposure to iAs, it would be better to use the sum of MMA and iAs concentration in urine, but this is problematic in low-level exposure (drinking water concentration < 10 µg L−1), where these compounds are often present at extremely low levels close to a detection limit of even the best analytical methods, especially after dilution of urine samples.
Uncertainties related to the shape of the dose-response curve at low exposure levels and mode of action for iAs
It has always been at least slightly disputable if direct extrapolation from high concentrations predicts health effects at very low concentrations (linear non-threshold approach). Accordingly, JECFA (Citation2011) based on an epidemiological study of the moderate to highly exposed North Eastern Taiwanese population (Chen et al. Citation2010a, Citation2010b) concluded that while in areas with relatively low arsenic concentrations in water (10–50 µg L−1) there is a possibility of adverse effects these would be at a low incidence that would be difficult to detect in epidemiological studies. However, guideline values based on such a linear approach are continuously used in several low-exposure risk assessment studies, official and scientific, until today. Such an approach was in the past and recently seriously questioned by several researchers like Rhomberg et al (Citation2011), Tsuji et al. (Citation2019, Citation2021), Boffetta and Borron (Citation2019), Cohen et al. (Citation2019, Citation2021), and others, arguing that there is no compelling evidence-based justification for general low-exposure linearity. On a contrary, several publications (Tsuji et al. Citation2019, Citation2021; Allen et al. Citation2020; Boffetta and Borron Citation2019; Shao et al. Citation2021) provide comprehensive evidence from human, animal, and mechanistic studies supporting a non-linear or threshold-based dose-response. The more recent studies evaluating dose-response at low doses have combined the low-dose epi data from multiple studies to critically examine the shape of the dose-response at low doses (e.g., Tsuji et al. Citation2019, Citation2021; Allen et al. Citation2020; Boffetta and Borron Citation2019; Shao et al. Citation2021). Consequently, EPA (US EPA 2019) is in a phase of reevaluation of As guidelines (discussed also above) encouraging the investigations at a low level of exposure by using various mathematical models. Although the mode of action is one of the scopes in EPA's most recent draft, it is still poorly represented in proposed evaluations of risk. The protocol was evaluated and accepted by a committee of experts, although with a separate opinion of J.I. Goodman who disagreed with the modeling approach without the inclusion of a mode of action (National Academies of Sciences, Engineering and Medicine. Citation2019). Generally, relying mostly on mathematical models without considering the background biology (causality) relevant to human hazards and risks, is highly questionable. A few important points related to such risk assessment are covered by Aschner et al. (Citation2018) who also expose that testable objective conclusions are not always possible. However, considering well-known cellular and organisms adaptive responses it seems that for damage to occur a sufficient concentration of arsenic is needed indicating that arsenic toxicity is a threshold process (reviewed in Tsuji et al. Citation2019) and a possible threshold was put somewhere between 50–150 μg L−1 arsenic in drinking water. In animal and cell culture experiments very low and very high doses of arsenic, compared to control amounts, resulted in an apparent hypomethylation of DNA. Because global DNA hypomethylation is associated with an increased incidence of cancer, both, too low and too high arsenic can lead to the development of cancer (Uthus Citation2003). Citing Nielsen (Citation2000): “There is a prevalent impression that any form or amount of arsenic is unnecessary, toxic or carcinogenic, and thus exposure to this element should be reduced to the lowest level possible. Setting toxicological standards with this mindset could have just the opposite of the desired result if arsenic is essential or beneficial at normal dietary intakes. Thus to prevent potentially harmful effects that could include increased susceptibility to cancer and heart disease, through misguided toxicological standards, dietary reference intakes should be established for arsenic. Based on data obtained from animal studies, a possible arsenic requirement for humans was determined to be about 12–25 μg/day” (0.17–0.36 μg kg−1/day). And, even clear opponents of the essentiality idea claim that “The arsenic for phosphorus swap is accidental, rather than a facultative one, and the question whether arsenic is nonessential or toxic is quantitative, not a qualitative one” (Dani Citation2011).
Uncertainties related to differences between populations
An important issue, mostly not well addressed in epidemiological studies and risk assessments, is a difference in the quantity of ingested water between warm countries like Bangladesh compared to the temperate climate in Europe. Lynch et al. (Citation2017a) calculated that at 100 μg L−1 of arsenic in drinking water and water used for cooking in Bangladesh, a daily dose is 9.4 μg kg−1/day while the same water concentration in the US results in a daily dose of 2.0 μg kg−1/day due to lower consumption and higher average body weight.
Another important difference between individuals and populations is their ability to metabolize arsenic as reflected by the widely varying proportions of iAs and its methylated forms in urine and blood. iAs is enzymatically biotransformed by arsenic methyltransferase (AS3MT) to MMA and further to DMA; both metabolites have higher urine elimination rates than iAs. Such variability depends on life stage, nutritional status, preexisting diseases, smoking, alcohol consumption, pregnancy, synchronic exposures to multiple substances (mixtures), historical exposure to arsenic, and certainly on the (epi)genetics of As metabolism and toxicity (Tsuji et al. Citation2021; Broberg and Pawlas Citation2022). Gene polymorphism of the AS3MT enzyme system, either alone or in combination with polymorphic forms of some other enzymes may play role in differences and susceptibility or adaptability to the various clinical manifestations of arsenic effects (toxicity), particularly in combination with nutritional status. Many of the populations with high arsenic exposures and related health effects (e.g., Bangladesh) are nutritionally deficient. Nutritional deficiency is reducing the methylation capacity of iAs; particularly important are protein, folate, and selenium deficiency. For instance, selenium and arsenic are well-known mutual detoxifiers (Zeng et al. Citation2005; Falnoga et al. Citation2014; Melgar et al. Citation2019) and the status of selenium is significantly lower in EU populations than in the USA population (Combs Citation2001; Stoffaneller and Morse Citation2015). Thus, the results of epidemiological studies could be site-specific and hardly comparable without adjustment for their nutritional status.
Synthesis of risk evaluation
The dose makes the poison is a fundamental concept of toxicology (Klaassen Citation2013). The toxicity of arsenic at high doses is not a subject of debate although its potential impacts on human health at environmental and dietary exposure to low amounts are not as clear as its toxicity at high concentrations. The binding of trivalent iAs and trivalent organoarsenic compounds to sulfhydryl groups of several peptides and proteins can on one side immobilize arsenic but might at the same time, if levels are high enough, directly or indirectly damage critical proteins and enzymes resulting in cytotoxicity and regenerative hyperplasia (Cohen et al. Citation2013) and eventually lead to disease, including cancer. There are also experimental data pointing to adaptive, even beneficial responses at low levels. The assumption that direct extrapolation from high concentrations could predict health effects at very low concentrations (linear approach) is ignoring such low-dose effect observations for many stressors, despite using the same cancer slopes for low and high exposure levels could potentially bias in the direction of low-dose linearity. The linear approach was for arsenic repeatedly used and also repeatedly seriously questioned in the past and more recently by several authors (i.e., Cohen et al. Citation2019, Citation2021; Tsuji et al. Citation2019, Citation2021) who are presenting the evidence for the existence of a threshold and nonlinearity. The shape of the low-dose As-response curve at concentrations approaching zero (J-shape, U-shape, threshold) is still under investigation. The evidence for nonlinearity and potential methodological pitfalls in recent dose-response evaluating epidemiology seems to have been clear enough to trigger the ongoing reassessment of iAs risks and risk methodology by EPA (US EPA 2019). However, (as discussed above) EPA is still not relying on the mode of action but tries to solve the problem on a mathematical basis using various sophisticated models and low-exposure epidemiological data without including the mode of action which could justify their relevance to human hazards, and risks. Their recently published modeling of bladder cancer epidemiological studies (Allen et al. Citation2020) is based on a model not sensitive to nonlinearity at lower doses, as shown by Shao et al. Citation2021. Next to iAs, the no-threshold approach is currently revised for low-dose radiation-induced health risks and some other DNA-reactive and epigenetic experimental carcinogens (Kobets and Williams Citation2019; Tharmalingam et al. Citation2019). Ted Simon in his recent book (Simon Citation2019) claims that “… the linear no-threshold hypothesis for chemical carcinogens was derived from early 20th-century work on radiation mutagenesis and has been used for the past 25 years. However, recent investigations of radiation mutagenesis and the increasing knowledge about fundamental biology and nature of cancer suggest that this hypothesis is based on flawed assumptions and is inconsistent with the biology.”
Based on the BMDLs calculated for human cellular effects (primary uroepithelial cells) of trivalent arsenic mixtures representative of human internal exposures, the threshold for potentially adverse cellular effects from exposure to iAs in drinking water is likely to occur at urinary concentrations of trivalent arsenic above 0.2 µM (15 µg L−1). This concentration is confirmed to have toxic effects at the tissue level; below 0.1 µM (7.5 µg L−1), any changes that might occur are adaptive as shown by gene expression studies (Yager et al. Citation2013). This corresponds to drinking water’s total arsenic concentrations above 65 µg L−1 (Yager et al. Citation2013). Concentrations below this level are unlikely to result in adverse cellular effects, even after chronic exposure (Tsuji et al. Citation2019), and especially when even lower exposure is evident (i.e., <10 µg L−1). In our overview, the measured urinary As(III) concentrations in HBM studies in Europe are very much lower; the calculated average of GMs of iAs + MMA + DMA of 28 European HBM studies is 3.4 ± 1.9 µg L−1 and the average P95 is 11.6 ± 4.8 µg L−1 (). For the European population, by far the main compound in urine is normally DMA presenting more than 70% of this sum while As(III) is below 10%, Beukers et al., in preparation). We also should be aware that one urine measurement is not always representative, especially due to variable intake of DMA and its precursors’ arsenosugars and arsenolipids in food, while water iAs content is more or less stable. If DMA from food is not quantified, it is falsely attributed to iAs exposure. However, in areas where arsenic levels in water are below the WHO drinking-water guideline value, health effects are unlikely and in Europe, iAs levels in the environment (soil, air) are in general low. Thus, long-term actions including human biomonitoring and clean-up procedures are only needed to reduce excessive exposure to arsenic from mining, metal smelting, refining, combustion of low-grade coal, pesticide use, timber treatment, or any other pollution source.
As given in the chapter “Arsenic in the environment and food in Europe,” drinking water for most of the European population contains very little iAs: 75% of samples < 0.47 µg L−1, 99% of EU samples below 10 µg L−1 (Banks et al. Citation2015). The same is valid for food except for rice, seafood, and some other cereals and grains. In the present overview, the average exposure levels/daily doses calculated from food and water consumption data and iAs concentrations in food are in the range of 0.07 to 0.20 µg kg−1 bw/day (adults–infants) for a group consuming mean amounts of foods with mean iAs concentration (). Extreme consumption patterns and mean iAs concentrations result in potentially much higher exposures (0.19–0.64 µg kg−1 bw/day; adults–infants, ). Using the existing reference value for BMDL0.5 (3 µg kg−1 bw/day), the margins of exposure (MOE) for investigated groups with average food intake and average iAs concentration in food items—are of low concern (MOE > 10) i.e., 37.0–40.6 for adults, elderly and very elderly, 31.7 for adolescents and 15.3–23.8 for infants, toddlers, and other children (, green bars). Nevertheless, all groups with higher consumption patterns, P95 food intake, and maximum food iAs, might be of very low cancer risk (MOE > 1) (MOE 2.44–10.5, ). Inside each consumption pattern, infants and toddlers are most exposed due to higher food consumption per kilogram of body weight and due to the higher proportion of rice-containing meals in their diet; nevertheless, several large, well-controlled prospective studies have not found increased risks of arsenic-related cancers or cardiovascular disease in those who consume more rice. (e.g., Eshak et al. Citation2014; Muraki et al. Citation2015; Zhang et al. Citation2016). On the other hand, infants and toddlers are presumably better protected by their higher methylation rates of iAs (Yamauchi and Takata Citation2021) and this high-exposure period is short.
As commented above, European HBM studies (published between 2010–2020) suggest low exposure levels to iAs in selected populations, which is evident from low urinary excretion of iAs and its metabolites MMA and DMA (). Back-calculation (reverse dosimetry) of the mean daily dose of iAs received from exposure based on urinary arsenic levels from HBM data agrees well with calculated intake from food and water: GM 0.14 ± 0.04 µg kg−1 bw/day () versus 0.05–0.18 µg kg−1 bw/day (, average food intake and minimum, mean or maximum iAs levels for other children, adolescents, and adults). For P95 food intake for other children, adolescents, and adults, calculation from food intake (0.23–0.46 µg kg−1 bw/day, ), also agrees well with HBM P95 calculated data (0.42 ± 0.13 µg kg−1 bw/day, ). From these calculations, we can be confident that there are no major »hidden« exposures for the general population. Higher HBM—calculated daily doses are expected due to additional exposure to iAs of smokers and exposure via other sources (air, soil, and dust) and especially due to direct ingestion of DMA, arsenosugars, and arsenolipids, all contributing to elevated DMA in urine. This additional, external, DMA is expected to be of lower risk than exposure to iAs due to its lower toxicity.
Based on food- or HBM-derived daily doses and urinary iAs and its metabolites concentrations we conclude that iAs presents a low concern for nutritionally sufficient general adult populations with low arsenic exposure in drinking water (<10 µg L−1) in Europe, which is also evident from MOEs values ().
Excess lifetime cancer risk (for lung or lung and bladder cancer) estimated according to currently (still) proposed linear non-threshold approaches (ECHA 2013, cancer slopes) does show an increased risk for adults in the range of 1–3 × 10⁻⁴ (). However as commented above several research groups recently advocate for the use of the nonlinear approach (Rhomberg et al. Citation2011; Lynch et al. Citation2017a; Boffeta and Borron Citation2019; Lamm et al. Citation2018, Citation2021; Tsuji et al. Citation2019; Ahn et al. Citation2020; Shao et al. Citation2021). In addition to uncertainties related to the dose response of arsenic-caused cancer at low exposure levels, there are additional uncertainties, specific to the use of HBM data. These include uncertainty related to the representativeness of populations and applicability of epidemiological data, overestimation of iAs due to the widespread presence of DMA in food, analytical challenges related to the speciation of As species in urine, inter-individual differences (gender, ethnicity, smoking, undefined exposures to co-carcinogen, chronic diseases, etc.). Accordingly, the estimated cancer risk assessment is of poor relevance, and the prediction is overestimated.
Finally, in Europe, the average healthy nonsmoking adult population is exposed to low levels of iAs with very low expected health risk so a further risk assessment should be limited to occupational situations, vulnerable populations, and those living at environmental hot-spots where iAs intake with related indications of health effects might be of real concern due to elevated arsenic in drinking water, soil or air. The ongoing risk assessments with the existing default regulations based on the no-threshold hypothesis (Buekers et al. submitted and those presented in this overview) should be postponed until new regulations are set. Further, in future exposure and risk assessment studies or evaluations, the iAs exposure biomarkers should be redefined (exclusion of DMA?) and complemented by targeted As health effects biomarkers and explanatory variables (personal and population) to steer clear of exposure and risk biases discussed in many publications and throughout the text.
Acknowledgments
The study was supported in part by the Slovenian Research Agency and the Chemicals Office of the Republic of Slovenia through the Jožef Stefan Institute program group P1-0143 (Slovenia), national projects “Exposure of children and adolescents to selected chemicals through their habitat environment” (CRP-V3-1640, grant agreement No. C2715-16-634802), the National Human Biomonitoring program (2018–2022; grant agreement No. C2715-18-634803; C2715-19-634801; C2715-21-634801) and the Neurophysiological dysfunctions caused by low-level exposure to selected environmental pollutants in susceptible populations (NEURO-DYS; J7-9400). The research was also supported by the HBM4EU project from the European Union’s Horizon 2020 research and innovation program under grant agreement No. 733032.
Part of this study, which included previously unpublished human urine samples data, was conducted in accordance with the Code of Ethics of the World Medical Association (Declaration of Helsinki). The protocol was approved by the National Medical Ethics Committee of the Republic of Slovenia (number of accordance: 98/05/06 and 65/09/14).
References
- Abuawad A, Goldsmith J, Herbstman JB, Parvez F, Islam T, LoIacono N, Graziano JH, Navas-Acien A, Gamble MV. 2022. Urine dilution correction methods utilizing urine creatinine or specific gravity in arsenic analyses: comparisons to blood and water arsenic in the FACT and FOX studies in Bangladesh. Water. 14(9):1477.
- AGES. 2015. Aufnahme von Arsen über Lebensmittel. https://www.ages.at/fileadmin/AGES2015/Themenbericht_Arsen_20151113.pdf.
- Aguilera I, Daponte A, Gil F, Hernandez AF, Godoy P, Pla A, Ramos JL. 2010. Urinary levels of arsenic in children and adolescents living in the industrialised area of Ria of Huelwa (SW Spain). Environ. International. 6:563–569.
- Ahn J, Boroje IJ, Ferdosi H, Kramer ZJ, Lamm SH. 2020. Prostate cancer incidence in U.S. counties and low levels of arsenic in drinking water. IJERPH. 17(3):960.
- Al Amin M, Xiong C, Francesconi KA, Itahashi Y, Yoneda M, Yoshinaga J. 2020. Variation in arsenolipid concentrations in seafood consumed in Japan. Chemosphere. 239:124781.
- Allen B, Shao K, Hobbie K, Mendez W, Jr, Lee JS, Cote I, Druwe I, Gift JS, Allen Davis J. 2020. Bayesian hierarchical dose-response meta-analysis of epidemiological studies: modeling and target population prediction methods. Environ Int. 145:106111.
- Aschner M, Autrup H, Berry CL, Boobis AR, Cohen SM, Dekant W, Galli CL, Goodman JI, Gori GB, Greim HA, et al. 2018. Obfuscating transparency? Regul Toxicol Pharmacol. 97:A1–A3.
- Agency for Toxic Substances and Disease Registry (ATSDR). 2007. Toxicological profile for Arsenic. Atlanta, GA: U.S. Department of Health and Human Services, Public Health Service. DOI: 10.15620/cdc:11481
- Aylward LL, Ramasamy S, Hays SM, Schoeny R, Kirman CR. 2014. Evaluation of urinary speciated arsenic in NHANES: issues in interpretation in the context of potential inorganic arsenic exposure. Regul Toxicol Pharmacol. 69(1):49–54.
- Banach JL, Hoek-van den Hil EF, van der Fels-Klerx HJ. 2020. Food safety hazards in the European seaweed chain. Compr Rev Food Sci Food Saf. 19(2):332–364.
- Banks D, Birke M, Flem B, Reimann C. 2015. Inorganic chemical quality of European tap-water: 1. Distribution of parameters and regulatory compliance. Appl. Geochem. 59:200–210.
- Barr DB, Wilder LC, Caudill SP, Gonzalez AJ, Needham LL, Pirkle JL. 2005. Urinary creatinine concentrations in the U.S. population: implications for urinary biologic monitoring measurements. Environ Health Perspect. 113(2):192–200.
- Boffetta P, Borron C. 2019. Low-level exposure to arsenic in drinking water and risk of lung and bladder cancer: a systematic review and dose-response meta-analysis. Dose Response. 17(3):1559325819863634.
- Buekers J, Baken K, Govarts E, Vogel N, Kolossa-Gehring M, Šlejkovec Z, Falnoga I, Horvat M, Lignell S, Lindroos AK, et al. submitted. Human urinary arsenic species, associated exposure determinants and potential health risks assessed in the HBM4EU Aligned Studies. Int J Hyg Environ Health.
- B'Hymer C, Caruso JA. 2004. Arsenic and its speciation analysis using high-performance liquid chromatography and inductively coupled plasma mass spectrometry. J Chromatogr A. 1045(1–2):1–13.
- Bocca B, Pino A, Vecchi Brumatti L, Rosolen V, Ronfani L, D'Aversa J, Ruggieri F, Petrucci F, Calamandrei G, Barbone F, et al. 2020. Children exposure to inorganic and organic arsenic metabolites: a cohort study in Northeast Italy. Environ Pollut. 265(Pt B):114826.
- Braeuer S, Goessler W. 2019. Arsenic species in mushrooms, with a focus on analytical methods for their determination - a critical review. Anal Chim Acta. 1073:1–21.
- Brima EI, Haris PI, Jenkins RO, Polya DA, Gault AG, Harrington CF. 2006. Understanding arsenic metabolism through a comparative study of arsenic levels in urine, hair, and fingernails of healthy volunteers from three unexposed ethnic groups in the United Kingdom. Toxicol Appl Pharmacol. 216(1):122–130.
- Broberg K, Pawlas N. 2022. Gene–environment interactions and metal toxicity. In: Nordberg GF, Costa M, editors. Handbook on the toxicology of metals. 5th ed. London: Elsevier and Academic Press. p. 349–368.
- Buchet JP, Lauwerys R, Roels H. 1981. Comparison of the urinary excretion of arsenic metabolites after a single oral dose of sodium arsenite, monomethylarsonate, or dimethylarsinate in man. Int Arch Occup Environ Health. 48(1):71–79.
- Bulka CM, Davis MA, Karagas MR, Ahsan H, Argos M. 2017. The unintended consequences of a gluten-free diet. Epidemiology. 28:e24–e25.
- Bulka CM, Mabila SL, Lash JP, Turyk ME, Argos M. 2017. Arsenic and obesity: a comparison of urine dilution adjustment methods. Environ Health Persp. 125(8):087020. doi:10.1289/EHP1202.
- Calabrese EJ, Kozumbo WJ. 2021. The hormetic dose-response mechanism: Nrf2 activation. Pharm Res. 167:105526.
- Calderon RL, Hudgens E, Le XC, Schreinemachers D, Thomas DJ. 1999. Excretion of arsenic in urine as a function of exposure to arsenic in drinking water. Environ Health Perspect. 107(8) :663–667.
- Calman KC. 1996. Cancer: science and society and the communication of risk. BMJ. 313(7060):799–802.
- Canada. 2016–2017. Fifth Report on Human Biomonitoring of Environmental Chemicals in Canada. https://www.canada.ca/en/health-canada/services/environmental-workplace-health/reports-publications/environmental-contaminants/fifth-report-human-biomonitoring/page-2.html#s8-2.
- Carter CE, Gansevoort RT, Scheven L, Lambers Heerspink HJ, Shlipak MG, De Jong PE, Ix JH. 2012. Influence of urine creatinine on the relationship between the albumin-to-creatinine ratio and cardiovascular events. Clin J Am Soc Nephrol. 7(4):595–603.
- [CDC] Center for Disease Control and Prevention. 2019. Fourth national report on human exposure to environmental chemicals, Updated tables, January 2019, Vol. 1. https://www.cdc.gov/exposurereport/pdf/FourthReportUpdatedTablesVolume1Jan2019-508.pdf.
- Chekri R, Le Calvez E, Zinck J, Leblanc JC, Sirot V, Hulin M, Noel L, Guerin T. 2019. Trace element contents in foods from the first French total diet study on infants and toddlers. J Food Compost Anal. 78:108–120.
- Chen C-L, Chiou H-Y, Hsu L-I, Hsueh Y-M, Wu M-M, Chen C-J. 2010a. Ingested arsenic, characteristics of well water consumption and risk of different histological types of lung cancer in northeastern Taiwan. Environ Res. 110(5):455–462.
- Chen C-L, Chiou H-Y, Hsu L-I, Hsueh Y-M, Wu M-M, Wang Y-H, Chen C-J. 2010b. Arsenic in drinking water and risk of urinary tract cancer: a follow-up study from northeastern Taiwan. Cancer Epidemiol Biomarkers Prev. 19(1):101–110.
- Chiou HY, Hsueh YM, Liaw KF, Horng SF, Chiang MH, Pu YS, Lin JS, Huang CH, Chen CJ. 1995. Incidence of internal cancers and ingested inorganic arsenic: a seven-year follow-up study in Taiwan. Cancer Res. 55(6):1296–1300.
- Cohen SM, Arnold LL, Beck BD, Lewis AS, Eldan M. 2013. Evaluation of the carcinogenicity of inorganic arsenic. Crit Rev Toxicol. 43(9):711–752. doi:10.3109/10408444.2013.827152. 24040994
- Cohen SM, Arnold LL, Tsuji JS. 2019. Inorganic arsenic: a nongenotoxic threshold carcinogen. Curr Opin Toxicol. 14:8–13.
- Cohen JM, Beck BD, Rhomberg LR. 2021. Historical perspective on the role of cell proliferation in carcinogenesis for DNA-reactive and non-DNA-reactive carcinogens: arsenic as an example. Toxicology. 456:152783.
- Combs G. 2001. Selenium in global food systems. Br J Nutr. 85(5):517–547.
- [COT] Committee On Toxicity Of Chemicals. 2016. Food, consumer products and the environment statement on potential risks from arsenic in the diet of infants aged 0 to 12 months and children aged 1 to 5 years. COT Statement 2016/6. https://cot.food.gov.uk/sites/default/files/finalstatementonarsenic_0.pdf
- Cubadda F, D'Amato M, Aureli F, Raggi A, Mantovani A. 2016. Dietary exposure of the Italian population to inorganic arsenic: the 2012–2014 Total Diet Study. Food Chem Toxicol. 98(Pt B):148–158.
- Dani SU. 2011. The arsenic for phosphorus swap is accidental, rather than a facultative one, and the question whether arsenic is nonessential or toxic is quantitative, not a qualitative one. Sci Total Environ. 409(22):4889–4890.
- Davies KJA. 2016. Adaptive homeostasis. Mol Aspects Med. 49:1–7.
- Davis MA, Mackenzie TA, Cottingham KL, Gilbert-Diamond D, Punshon T, Karagas MR. 2012. Rice consumption and urinary arsenic concentrations in U.S. children. Environ Health Perspect. 120(10):1418–1424.
- DeCastro BR, Caldwell KL, Jones RL, Blount BC, Pan Y, Ward C, Mortensen ME. 2014. Dietary sources of methylated arsenic species in urine of the United States population, NHANES 2003–2010. PLoS One. 9(9):e108098.
- Del Razo LM, Garcia-Vargas GG, Vargas H, Albores A, Gonsebatt ME, Montero R, Ostrosky Wegman P, Kelsh M, Cebrian ME. 1997. Altered profile of urinary arsenic metabolites in adults with chronic arsenicism. A pilot study. Arch Toxicol. 71(4):211–217.
- de Moraes NV, Carey M, Neville CE, Cruise S, McGuinness B, Kee F, Young IS, Woodside JV, Meharg AA. 2020. Water dilutes and alcohol concentrates urinary arsenic species when food is the dominant source of exposure. Expo Health. 12(4):699–710.
- Dieter HH. 1994. Trinkwasser. In: Wichmann HE, Schlipköter HW, Fülgraff G, editors. Handbuch der Umweltmedizin. Landsberg (Germany): Ecomed Verlag, IV-3-1, p. 11.
- [ECHA] European Chemical Agency. 2013. Services to support the assessment of remaining cancer risks related to the use of chromium- and arsenic-containing substances in Applications for Authorisation. Service Request under the Multiple Framework Contract with re-opening of competition for scientific services for ECHA REFERENCE: ECHA/2011/01 – SR-11 Final report for Arsenic.
- [EEA] European Environment Agency. 2019. Annual mean arsenic concentrations in 2017. https://www.eea.europa.eu/data-and-maps/figures/annual-mean-arsenic-concentrations-in-2017.
- [EFSA] European Food Safety Authority. 2009. Scientific Opinion on Arsenic in Food, EFSA Panel on Contaminants in the Food Chain (CONTAM), Parma, Italy. EFSA J. 7:1351.
- [EFSA] European Food Safety Authority. 2014. Scientific report of EFSA: dietary exposure to inorganic arsenic in the European population. EFSA J. 12:3597. https://efsa.onlinelibrary.wiley.com/10.2903/j.efsa.2014.3597
- [EFSA] European Food Safety Authority. 2021. Scientific report of EFSA: chronic dietary exposure to inorganic arsenic. EFSA J. 19:6380.
- Eshak ES, Iso H, Yamagishi K, Kokubo Y, Saito I, Yatsuya H, Sawada N, Inoue M, Tsugane S. 2014. Rice consumption is not associated with risk of cardiovascular disease morbidity or mortality in Japanese men and women: a large population-based, prospective cohort study. Am J Clin Nutr. 100(1):199–207.
- European Commission. 2001. Working group on arsenic, cadmium and nickel compounds in 2000: ambient air pollution by As, Cd and Ni compounds. Position paper, office for official publications of the European communities. https://ec.europa.eu/environment/air/pdf/pp_as_cd_ni.pdf.
- [EU] European Union Directive. 2020. 2020/2184 of the European Parliament and of the Council of 16 December 2020 on the quality of water intended for human consumption (recast), Official Journal of the European Union. L 435/1. https://eur-lex.europa.eu/eli/dir/2020/2184/oj.
- [EU] European Union Regulation. 2006. Commission Regulation No 1881/2006, 2006, setting maximum levels for certain contaminants in foodstuffs. 2006R1881-EN-21.05.2015-015.001-1.
- Falnoga I, Mazej D, Podgornik H, Zver S, Cernelc P, Šlejkovec Z. 2014. Critical serum-selenium levels in APL and MM patients during ATO-treatment (according to APL and MAC/DAC schemes). Blood. 124(21):5231–5231.
- Farzan SF, Chen Y, Rees JR, Scot Zens M, Karagas MR. 2015. Risk of death from cardiovascular disease associated with low-level arsenic exposure among long-term smokers in a US population-based study. Toxicol Appl Pharmacol. 287(2):93–97.
- Fillol C, Dor F, Denys S, Tack K, Labat L, Seta N. 2013. Arsenic urinary concentrations in children living in a naturally arsenic contaminated area. J Expo Sci Environ Epidemiol. 23(2):145–150.
- FoodEx. 2016. EFSA Comprehensive European Food Consumption Database, Released 2016-03-0, Modified 2018-06-15. https://data.europa.eu/euodp/en/data/dataset/the-efsa-comprehensive-european-food-consumption-database.
- Fowler BA, Chou SJ, Jones RL, Sullivan JR, Chen DW. 2015. Arsenic. In: Nordberg GF, Fowler BA, Nordberg M, Editors. Handbook on the toxicology of metals. USA: Elsevier, Academic Press. p. 581–624.
- Francesconi KA, Tanggaar R, McKenzie CJ, Goessler W. 2002. Arsenic metabolites in human urine after ingestion of an arsenosugar. Clin Chem. 48(1):92–101.
- Fréry N, Vandentorren S, Etchevers A, Fillol C. 2012. Highlights of recent studies and future plans for the French human biomonitoring (HBM) programme. Int J Hyg Environ Health. 215(2):127–132.
- González N, Calderón J, Rúbies A, Timoner I, Castell V, Domingo JL, Nadal M. 2019. Dietary intake of arsenic, cadmium, mercury and lead by the population of Catalonia, Spain: analysis of the temporal trend. Food Chem Toxicol. 132:110721.
- Guo HR. 2004. Arsenic level in drinking water and mortality of lung cancer (Taiwan). Cancer Causes Control. 15(2):171–177.
- Guo HR, Tseng YC. 2000. Arsenic in drinking water and bladder cancer: comparison between studies based on cancer registry and death certificates. Environ Geochem Health. 22(2):83–91.
- Hays SM, Aylward LL, Gagne M, Nong A, Krishnan K. 2010. Biomonitoring equivalents for inorganic arsenic. Regul Toxicol Pharmacol. 58(1):1–9.
- Health Canada. 2021. Human health risk assessment for legacy arsenic contamination around Yellowknife. Final report, Government of Northwest Territories. Canada North Environmental Services. p.1-10. https://www.enr.gov.nt.ca/sites/enr/files/resources/arsenic_human_health_risk_assessment_summary_june_2021_0.pdf.
- Herath I, Vithanage M, Seneweera S, Bundschuh J. 2018. Thiolated arsenic in natural systems: what is current, what is new and what needs to be known. Environ Int. 115:370–386.
- Hsieh CY, Wang SL, Fadrowski JJ, Navas-Acien A, Kuo CC. 2019. Urinary concentration correction methods for arsenic, cadmium, and mercury: a systematic review of practice-based evidence. Curr Environ Health Rep. 6(3):188–199.
- Hughes MF, Beck BD, Chen Y, Lewis AS, Thomas DJ. 2011. Arsenic exposure and toxicology: a historical perspective. Toxicol Sci. 123(2):305–332.
- Jackson BP, Taylor VF, Punshon T, Cottingham KL. 2012. Arsenic concentration and speciation in infant formulas and first foods. Pure Appl Chem. 84(2):215–223.
- Jain RB. 2021. Contribution of diet and other factors for urinary concentrations of total arsenic and arsenic species: data for US children, adolescents, and adults. Environ Sci Pollut Res Int. 28(36):50094–50116. 10.1007/s11356-021-14230-9. 33948846
- Jecfa FAO, Joint WHO, Expert Committee On FA. 2011. Safety evaluation of certain contaminants in food. WHO Food Additives, Series 63, FAO JECFA Monographs 8, Prepared by the Seventy-second meeting of JECFA, WHO, Geneva, 2011 and FAO of the United Nations, Rome. http://www.fao.org/3/a-at881e.pdf.
- Kenyon EM. 2021. Arsenic toxicokinetic modeling and risk analysis: progress, needs and applications. Toxicology. 457:152809.
- Klaassen CD, Casarett LJ, Doull J. 2013. Casarett and Doull’s toxicology: the basic science of poisons. Klaassen CD, editor. 8th ed. New York: McGraw-Hill Education/Medical.
- Kirman CR, Aylward LL, Blount BC, Pyatt DW, Hays SM. 2012. Evaluation of NHANES biomonitoring data for volatile organic chemicals in blood: application of chemical-specific screening criteria. J Expo Sci Environ Epidemiol. 22(1):24–34.
- Kobets T, Williams GM. 2019. Review of the evidence for thresholds for DNA-Reactive and epigenetic experimental chemical carcinogens. Chem Biol Interact. 301:88–111.
- Koppen G, Franken C, Den Hond E, Plusquin M, Reimann B, Leermakers M, Covaci A, Nawrot T, Van Larebeke N, Schoeters G, et al. 2020. Pooled analysis of genotoxicity markers in relation to exposure in the Flemish Environment and Health Studies (FLEHS) between 1999 and 2018. Environ Res. 190:110002.
- LaKind JS, Aylward LL, Brunk C, DiZio S, Dourson M, Goldstein DA, Kilpatrick ME, Krewski D, Bartels MJ, Barton HA, Biomonitoring Equivalents Expert Workshop, et al. 2008. Guidelines for the communication of biomonitoring equivalents: report from the biomonitoring equivalents expert workshop. Regul Toxicol Pharmacol. 51(3 Suppl):S16–S26.,
- Lamm SH, Boroje IJ, Ferdosi H, Ahn J. 2018. Lung cancer risk and low (≤50 μg/L) drinking water arsenic levels for US counties (2009–2013) - A negative association. IJERPH. 15(6):1200.
- Lamm SH, Boroje IJ, Ferdosi H, Ahn J. 2021. A review of low-dose arsenic risks and human cancers. Toxicology. 456:152768.
- Li HB, Li J, Zhao D, Li C, Wang XJ, Sun H-J, Juhasz AL, Ma LQ. 2017. Arsenic relative bioavailability in rice using a mouse arsenic urinary excretion bioassay and its application to assess human health risk. Environ Sci Technol. 51(8):4689–4696.
- Luvonga C, Rimmer CA, Yu LL, Lee SB. 2020. Organoarsenicals in seafood: occurrence, dietary exposure, toxicity, and risk assessment considerations – A review. J Agric Food Chem. 68(4):943–960.
- Lynch HN, Zu K, Kennedy EM, Lam T, Liu X, Pizzurro DM, Loftus CT, Rhomberg LR. 2017a. Quantitative assessment of lung and bladder cancer risk and oral exposure to inorganic arsenic: meta-regression analyses of epidemiological data. Environ Int. 106:178–206.
- Lynch HN, Zu K, Kennedy EM, Lam T, Liu X, Pizzurro DM, Loftus CT, Rhomberg LR. 2017b. Corrigendum to "Quantitative assessment of lung and bladder cancer risk and oral exposure to inorganic arsenic: meta-regression analyses of epidemiological data. Environ Int. 106:178–206.
- Mania M, Wojciechowska-Mazurek M, Starska K, Rebeniak M, Szynal T, Strzelecka A, Postupolski J. 2015. Toxic elements in commercial infant food, estimated dietary intake, and risk assessment in Poland. Pol J Environ Stud. 24(6):2525–2536.
- Medrano MAJ, Boix R, Pastor-Barriuso R, Palau M, Damián J, Ramis R, Del Barrio JL, Navas-Acien A. 2010. Arsenic in public water supplies and cardiovascular mortality in Spain. Environ Res. 110(5):448–454.
- Melgar MJ, Núñez R, García MÁ. 2019. Selenium intake from tuna in Galicia (Spain): health risk assessment and protective role against exposure to mercury and inorganic arsenic. Sci Total Environ. 694:133716.
- Middleton DRS, Watts MJ, Polya DA. 2019. A comparative assessment of dilution correction methods for spot urinary analyte concentrations in a UK population exposed to arsenic in drinking water. Environ Int. 130:104721.
- Minichilli F, Bianchi F, Ronchi AM, Gorini F, Bustaffa E. 2018. Urinary arsenic in human samples from areas characterized by natural and anthropogenic pollution in Italy. IJERPH. 15(2):299.
- Moon KA, Guallar E, Umans JG, Devereux RB, Best LG, Francesconi KA, Goessler W, Pollak J, Silbergeld EK, Howard BV, et al. 2013. Association between exposure to low to moderate arsenic levels and incident cardiovascular disease. A prospective cohort study. Ann Intern Med. 159(10):649–659.,
- Morales KH, Ryan L, Kuo TL, Wu MM, Chen CJ. 2000. Risk of internal cancers from arsenic in drinking water. Environ Health Perspect. 108(7):655–661. doi:10.1289/ehp.00108655. 10903620
- Muraki I, Wu H, Imamura F, Laden F, Rimm EB, Hu FB, Willett WC, Sun Q. 2015. Rice consumption and risk of cardiovascular disease: results from pooled analysis of 3 U.S. cohorts. Am J Clin Nutr. 101(1):164–172.
- National Academies of Sciences, Engineering and Medicine. 2019. Review of EPA’s updated formulation and protocol for the inorganic arsenic IRIS assessment. Washington (DC): The National Academies Press. p. 1–29.
- Navas-Acien A, Francesconi KA, Silbergeld EK, Guallar E. 2011. Seafood intake and urine concentrations of total arsenic, dimethylarsinate and arsenobetaine in the US population. Environ Res. 111(1):110–118.
- Nearing MM, Koch I, Reimer KJ. 2014. Complementary arsenic speciation methods: a review. Spectrochim Acta, B. 99:150–162.
- Nielsen FH. 1996. How should dietary guidance be given for mineral elements with beneficial actions or suspected of being essential? J Nutr. 126(9 Suppl):2377S–2385S.
- Nielsen FH. 2000. Importance of making dietary recommendations for elements designated as nutritionally beneficial, pharmacologically beneficial, or conditionally essential. J Trace Elem Exp Med. 13(1):113–129.
- [NRC] National Research Council of the National Academies. 1999. US National Research Council: arsenic in drinking water. Washington (DC): National Academies Press.
- [NRC] National Research Council of the National Academies. 2001. US National Research Council: arsenic in drinking water: an update. Washington (DC): National Academies Press.
- Nurchi VM, Djordjevic AB, Crisponi G, Alexander J, Bjørklund G, Aaseth J. 2020. Arsenic toxicity: molecular targets and therapeutic agents. Biomolecules. 10(2):235.
- Oterdoom LH, Gansevoort RT, Schouten JP, De Jong PE, Gans ROB, Bakker SJL. 2009. Urinary creatinine excretion, an indirect measure of muscle mass, is an independent predictor of cardiovascular disease and mortality in the general population. Atherosclerosis. 207(2):534–540.
- Perharič L, Martinčič M, Uršič S, Kukec A, Zadnik V, Mazej D, Šlejkovec Z, Šter M, France-Štiglic A, Eržen I. 2017. Poglobljena ocena tveganja za zdravje otrok zaradi izpostavljenosti arzenu v občini Zagorje ob Savi (In-depth assessment of the risk to children’s health due to arsenic exposure in the municipality of Zagorje ob Savi). Ljubljana, Slovenia: NIJZ.
- Przygoda G, Feldmann J, Cullen WR. 2001. The arsenic eaters of Styria: a different picture of people who were chronically exposed to arsenic. Appl Organometal Chem. 15(6):457–462. doi:10.1002/aoc.126.
- Rhomberg LR, Goodman JE, Haber LT, Dourson M, Andersen ME, Klaunig JE, Meek B, Price PS, McClellan RO, Cohen SM. 2011. Linear low-dose extrapolation for noncancer health effects is the exception, not the rule. Crit Rev Toxicol. 41(1):1–19.
- Rix RR, Guedes RNC, Cutler GC. 2022. Hormesis dose-response contaminant-induced hormesis in animals. Curr Opin Toxicol. 30:100336.
- Saoudi A, Zeghnoun A, Bidondo ML, Garnier R, Cirimele V, Persoons R, Fréry N. 2012. Urinary arsenic levels in the French adult population: the French National Nutrition and Health Study. Sci Total Environ. 433(2007):206–215.
- Sattar A, Xie S, Abdul Hafeez M, Wang X, Iftikhar Hussain H, Iqbal Z, Pan Y, Iqbal M, Abubakr Shabbir M, Yuan Z. 2016. Metabolism and toxicity of arsenicals in mammals. Environ Toxicol Pharmacol. 48:214–224.
- Schoeters G, Colles A, Den Hond E, Croes K, Vrijens J, Baeyens W, Nelen V. 2012. The Flemish Environment and Health Study (FLEHS) – second survey (2007–2011): establishing reference values for biomarkers of exposure in the Flemish population. In L Knudsen & DF Merlo (eds), Biomarkers and human biomonitoring: ongoing programs and exposures. Iss Toxicol. 9:135–165.
- Schmeisser E, Goessler W, Francesconi KA. 2006. Human metabolism of arsenolipids present in cod liver. Anal Bioanal Chem. 385(2):367–376.
- Schmeisser S, Schmeisser K, Weimer S, Groth M, Priebe S, Fazius E, Kuhlow D, Pick D, Einax JW, Guthke R, et al. 2013. Mitochondrial hormesis links low dose arsenite exposure to lifespan extinction. Aging Cell. 12(3):508–517.
- Schulz C, Angerer J, Ewers U, Heudorf U, Wilhelm M, Human Biomonitoring Commission of the German Federal Environment Agency. 2009. Revised and new reference values for environmental pollutants in urine or blood of children in Germany derived from the German Environmental Survey on Children 2003–2006 (GerES IV). Int J Hyg Environ Health. 212(6):637–647.
- Scrafford CG, Barraj LM, Tsuji JS. 2016. Considerations when using longitudinal cohort studies to assess dietary exposure to inorganic arsenic and chronic health outcomes. Food Chem Toxicol. 93:111–118.
- Shao K, Zhou Z, Xun P, Cohen SM. 2021. Bayesian benchmark dose analysis for inorganic arsenic in drinking water associated with bladder and lung cancer using epidemiological data. Toxicology. 455:152752.
- Scientific American. 1869. The arsenic eaters of Styria. 21:215.doi:10.1038/scientificamerican10021869-215
- Sidhu MS, Desai KP, Lynch HN, Rhomberg LR, Beck BD, Venditti FJ. 2015. Mechanisms of action for arsenic in cardiovascular toxicity and implications for risk assessment. Toxicology. 331:78–99.
- Signes-Pastor AJ, Woodside JV, McMullan P, Mullan K, Carey M, Karagas MR, Meharg AA. 2017. Levels of infants’ urinary arsenic metabolites related to formula feeding and weaning with rice products exceeding the EU inorganic arsenic standard. PLoS One. 12(5):e0176923.
- Signes-Pastor AJ, Cottingham KL, Carey M, Sayarath V, Palys T, Meharg AA, Folt CL, Karagas MR. 2018. Infants’ dietary arsenic exposure during transition to solid food. Sci Rep. 8(1):7114.
- Signes-Pastor AJ, Punshon T, Cottingham KL, Jackson BP, Sayarath V, Gilbert-Diamond D, Korrick S, Karagas MR. 2020. Arsenic exposure in relation to apple consumption among infants in the New Hampshire Birth Cohort Study. Expo Health. 12(4):561–567.
- Simon T. 2019. Preface in environmental risk assessment, a toxicological approach. 2nd ed. Boca Raton: Imprint CRC Press. 10.1201/9780429286001.
- Skröder Löveborn H, Kippler M, Lu Y, Ahmed S, Kuehnelt D, Raqib R, Vahter M. 2016. Arsenic metabolism in children differs from that in adults. Toxicol Sci. 152(1):29–39.
- Snoj Tratnik J, Falnoga I, Mazej D, Kocman D, Fajon V, Jagodic M, Stajnko A, Trdin A, Šlejkovec Z, Jerana Z, et al. 2019. Results of the first national human biomonitoring in Slovenia: trace elements in men and lactating women, predictors of exposure and reference values. Int J Hyg Environ Health. 222(3):563–582.
- Sommella A, Deacon C, Norton G, Pigna M, Violante A, Meharg AA. 2013. Total arsenic, inorganic arsenic, and other elements concentrations in Italian rice grain varies with origin and type. Environ Pollut. 181:38–43.
- Spěváčková V, Čejchanová M, Černá M, Spěváček V, Šmíd J, Beneš B. 2002. Population-based biomonitoring in the Czech Republic: urinary arsenic. J Environ Monit. 4(5):796–798.
- Stajnko A, Šlejkovec Z, Mazej D, France-Štiglic A, Briški Sešek A, Prpić I, Špirić Z, Horvat M, Falnoga I. 2019. Arsenic metabolites; selenium; and AS3MT, MTHFR, AQP4, AQP9, SELENOP, INMT, and MT2A polymorphisms in Croatian-Slovenian population from PHIME-CROME study. Environ Res. 170:301–319.
- Sthijns M, Weseler A, Bast A, Haenen G, GRMM Haenen. 2016. Time in redox adaptation processes: from evolution to hormesis. IJMS. 17(10):1649.
- Stoffaneller R, Morse NL. 2015. A review of dietary selenium intake and selenium status in Europe and the Middle East. Nutrients. 7(3):1494–1537.
- Sun Q, Spiegelman D, Van Dam RM, Holmes MD, Malik VS, Willett WC, Hu FB. 2010. White rice, brown rice, and risk of type 2 diabetes in US men and women. Arch Intern Med. 14:961–969.
- Šlejkovec Z, Gorše L, Grobler A, Jagodic M, Falnoga I. 2021. Arsenic speciation and elemental composition of rice samples from the Slovenian market. Food Chem. 342:128348.
- Taleshi MS, Seidler-Egdal RK, Jensen KB, Schwerdtle T, Francesconi KA. 2014. Synthesis and characterization of arsenolipids: naturally occurring arsenic compounds in fish and algae. Organometallics. 33(6):1397–1403.
- Tam GK, Charbonneau SM, Bryce F, Pomroy C, Sandi E. 1979. Metabolism of inorganic arsenic (74As) in humans following oral ingestion. Toxicol Appl Pharmacol. 50(2):319–322.
- Tarvainen T, Albanese S, Birke M, Poňavič M, Reimann C. 2013. Arsenic in agricultural and grazing land soils of Europe. Appl Geochem. 28:2–10.
- Taylor V, Goodale B, Raab A, Schwerdtle T, Reimer K, Conklin S, Karagas MR, Francesconi KA. 2017. Human exposure to organic arsenic species from seafood. Sci Total Environ. 580:266–282.
- Tharmalingam S, Sreetharan S, Brooks AL, Boreham DR. 2019. Re-evaluation of the linear no-threshold (LNT) model using new paradigms and modern molecular studies. Chem Biol Interact. 301:54–67.
- Tseng WP. 1977. Effects and dose-response relationships of skin cancer and Blackfoot disease with arsenic. Environ Health Perspect. 19:109–119.
- Tseng WP, Chu HM, How SW, Fong JM, Lin CS, Yeh S. 1968. Prevalence of skin cancer in an endemic area of chronic arsenicism in Taiwan. J Natl Cancer Inst. 40:453–462.
- Tsuji JS, Chang ET, Gentry PR, Clewell HJ, Boffetta P, Cohen SM. 2019. Dose-response for assessing the cancer risk of inorganic arsenic in drinking water: the scientific basis for use of a threshold approach. Crit Rev Toxicol. 49(1):36–84.
- Tsuji JS, Lennox KP, Watson HN, Chang ET. 2021. Essential concepts for interpreting the dose-response of low-level arsenic exposure in epidemiological studies. Toxicology. 457:152801.
- Upadhyay MK, Shukla A, Yadav P, Srivastava S. 2019. A review of arsenic in crops, vegetables, animals and food products. Food Chem. 276:608–618.
- [US EPA] U.S. Environmental Protection Agency. 2001. EPA announces arsenic standard for drinking water of 10 parts per billion, EPA press release.
- [US EPA] U.S. Environmental Protection Agency. 2007. Letter to S. Johnson (US EPA) re: advisory on EPA’s assessments of carcinogenic effects of organic and inorganic arsenic: a report of the US EPA Science Advisory Board. EPA-SAB-07–008
- [US EPA] U.S. Environmental Protection Agency. 2019. Updated problem formulation and systematic review protocol for the inorganic arsenic IRIS assessment. Report No: EPA/635/R-19/049. Washington (DC): The United States Environmental Protection Agency.
- [US EPA] U.S. Environmental Protection Agency. 2022. Regional removal management levels (RMLs) user’s guide. https://www.epa.gov/risk/regional-removal-management-levels-rmls-users-guide.
- [US FDA] U.S. Food and Drug Administration. 2016. Arsenic in rice and rice products risk assessment report, Center for food safety and applied nutrition, https://www.fda.gov/media/96071/download.
- Uthus EO. 1992. Evidence for arsenic essentiality. Environ Geochem Health. 14:55–58.
- Uthus EO. 2003. Arsenic essentiality: a role affecting methionine metabolism. J Trace Elem Exp Med. 16(4):345–355.
- Van Halem D, Bakker SA, Amy GL, van Dijk JC. 2009. Arsenic in drinking water: a worldwide water quality concern for water supply companies. Drink Water Eng Sci. 2(1):29–34.
- Wang B, Cheng H, Lin C, Zhang X, Duan X, Wang Q, Xu D. 2022. Arsenic exposure analysis for children living in central China: from ingestion exposure to biomarkers. Chemosphere. 287(Pt 2):132194.
- Watson CV, Lewin M, Ragin-Wilson A, Jones R, Jarrett JM, Wallon K, Ward C, Hilliard N, Irvin-Barnwell E. 2020. Characterization of trace elements exposure in pregnant women in the United States, NHANES 1999–2016. Environ Res. 183:109208.
- [WHO] World Health Organization. 1981. Environmental health criteria. Geneva: World Health Organisation. p. 1–174.
- [WHO] World Health Organization. 2011. Arsenic in Drinking water, Background document for development of WHO Guidelines for Drinking-water Quality WHO/SDE/WSH/03.04/75/Rev/1.
- [WHO] World Health Organization. 2017. Guidelines for drinking water quality. 4th ed. with 1st addendum. Geneva: WHO.
- Xu L, Mondal D, Polya DA. 2020. Positive association of cardiovascular disease (CVD) with chronic exposure to drinking water arsenic (As) at concentrations below the WHO provisional guideline value: a systematic review and meta-analysis. IJERPH. 17(7):2536.
- Xue XM, Xiong C, Yoshinaga M, Rosen B, Zhu YG. 2022. The enigma of environmental organoarsenicals: insights and implications. Crit Rev Environ Sci Technol. 52(21):3835–3862.
- Yager JW, Robinan Gentry P, Thomas RS, Pluta L, Efremenko A, Black M, Arnold LL, McKim JM, Wilga P, Gill G, et al. 2013. Evaluation of gene expression changes in human primary uroepithelial cells following 24-hr exposures to inorganic arsenic and its methylated metabolites. Environ Mol Mutagen. 54(2):82–98.
- Yamauchi H, Takata A. 2021. Arsenic metabolism differs between child and adult patients during acute arsenic poisoning. Toxicol Appl Pharmacol. 410:115352.
- Yokel RA, Lasley SM, Dorman DC. 2006. Speciation of metals in mammals influences their toxicokinetics and toxicodynamics and therefore human health risk assessment. J Toxicol Environ Health. 9(1):63–85.
- Yusà V, Pérez R, Sánchez A, Pardo O, Roca M. 2018. Exposure and risk assessment to arsenic species in Spanish children using biomonitoring. Sci Total Environ. 628-629:302–309.
- Zeng H, Uthus EO, Combs GF. 2005. Mechanistic aspects of the interaction between selenium and arsenic. J Inorg Biochem. 99(6):1269–1274.
- Zhang R, Zhang X, Wu K, Wu H, Sun Q, Hu FB, Han J, Willett WC, Giovannucci EL. 2016. Rice consumption and cancer incidence in US men and women. Int J Cancer. 138(3):555–564.
- Zhao FJ, Stroud JL, Eagling T, Dunham SJ, McGrath SP, Shewry PR. 2010. Accumulation, distribution, and speciation of arsenic in wheat grain. Environ Sci Technol. 44(14):5464–5468.
- Zimmermann P, Murawski A, Schmied-Tobies MIH, Rucic E, Hildebrand J, Göen T, Kolossa-Gehring M. in preparation. Arsenic and its species in urine of children and adolescents in Germany – human biomonitoring results of the German Environmental Survey 2014–2017 (GerES V).