
Abstract
Saliva is valuable in exposure assessment having been successfully used for drug and environmental pollutant detection, providing a surrogate measure of plasma concentrations. Pyrethroid biomarkers have not previously been assessed in saliva, although are prime candidates for saliva detection. This study’s objectives were to (1) develop a liquid-liquid extraction (LLE) method to quantify six pyrethroid metabolites using gas chromatography/ion trap mass spectrometry and (2) assess its application for an occupationally exposed population. Several solvents and mixing protocols were optimized for metabolite recovery. The optimized method was applied to a population of pest control operators (PCOs) and compared against a urine sample before and after a full workday using pesticides. A questionnaire collected demographic information, occupational history, and occupational and non-occupational exposure data. LLE recoveries ranged from 85–104% and 72–88% for toluene and dichloromethane using slow mixing, and 49–103% for methyl tert-butyl ether by fast mixing. Urinary 3-Phenoxybenzoic acid (3PBA) was detected in 100% of pre- and post-work urine samples. Three PCOs had increased urinary pyrethroid metabolite levels post-work. Salivary 3PBA was present below detection limit in two of the three PCO’s post-work saliva samples, demonstrating that salivary 3PBA could be measured in PCOs after the workday. This study presents preliminary findings of a potential, low-risk biomonitoring technique that may be utilized in future occupational pyrethroid exposure and risk assessment research.
SUSTAINABLE DEVELOPMENT GOALS:
Introduction
Pyrethroid insecticides are synthetic forms of their predecessor, pyrethrins, naturally derived insecticides from the chrysanthemum flower (Richardson et al. Citation2019). Pyrethroids’ prominence in public health and pest management sectors have grown rapidly during the past two decades due to their low mammalian toxicity, effectively replacing organophosphate pesticides (Kaneko Citation2011). While this factor reduces overt toxicity in non-target organisms, occupational settings continually pose some of the greatest risks of exposure and any potential toxic effects, particularly when proper precautions are not taken to minimize exposures. Major routes of exposure for occupational workers include inhalation and dermal absorption when they are preparing and handling these pesticides, and working in contaminated environments (Silva Pinto et al. Citation2020).
Biomonitoring is among the most valuable measures in occupational exposure assessment, as it can capture the actual internalized dose of the compound in an individual. In-field assessments often require noninvasive approaches to make sampling more convenient for both the researcher and participant. Urine is a commonly used biofluid in biomonitoring, as it is a natural and plentiful by-product of the body and excretes metabolized xenobiotic products that can be used to identify an individual’s exposure. Blood is still considered a gold standard and valuable biomatrix, but comes with challenges, particularly for in-field collection. Blood draws require trained phlebotomists on-site and carry greater risks to the subject. There are also limitations on the volume and frequency of blood draws in research, which makes it impractical for monitoring multiple time points throughout the day (OHRP Citation1998).
Alternative biomonitoring matrices have been studied in adults and children, such as hair, sweat, and saliva or oral fluid (Schramm Citation2008; Genuis et al. Citation2013; Michalke et al. Citation2015; Porucznik et al. Citation2015), and their utility in biomonitoring has been recognized (Gallardo and Queiroz Citation2008; Mullangi et al. Citation2009). Of particular interest to this study, saliva can be sampled readily and repeatedly throughout the day. It is considered an unconcentrated ultrafiltrate of blood, acting as an excellent surrogate measure of circulating concentrations. Diffusion rates of lipophilic compounds as well as variable flow rates produce salivary concentrations 10x–100x less than that found in blood (Caporossi et al. Citation2010). Saliva presents several advantages over urine in field assessments, including (1) no required facilities to collect specimens, (2) samples are representative of current blood levels prior to conjugation and other metabolic processes which delay appearance in urine, and (3) multiple samples can be taken on demand in short periods of time regardless of water intake.
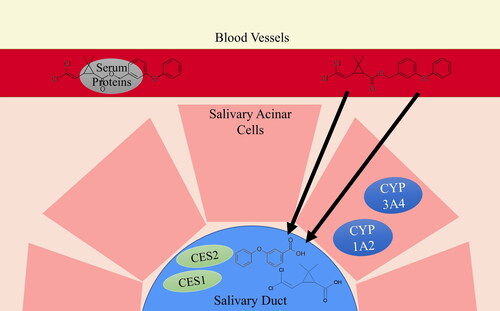
Saliva has been used in the detection of doping agents, illicit substances, biomarkers of systemic and oral diseases, and more recently, environmental contaminants (Hold et al. Citation1996; Caporossi et al. Citation2010; Ntihabose et al. Citation2018; Martín Santos et al. Citation2020). The fraction of lipophilic environmental contaminants not bound to serum albumin in the blood can be transported through the highly permeable membrane of salivary duct cells into oral fluid primarily through passive transcellular diffusion (Timchalk et al. Citation2015; Weber et al. Citation2017). While not verified by in vitro or in vivo studies, due to their highly lipophilic nature, pyrethroids are capable of passive diffusion into saliva, which makes them good candidates for saliva biomonitoring. illustrates the proposed mechanism for the fate and transport of pyrethroid biomarkers in saliva. Translocation of pyrethroids from blood into saliva has not been researched previously; however, it is likely that the unbound fraction of non-metabolized pyrethroids is able to diffuse into salivary ducts through similar mechanisms, as demonstrated for other pesticides by in vitro and in vivo studies (Skalsky et al. Citation1979; Borzelleca and Skalsky Citation1980; Timchalk et al. Citation2015; Weber et al. Citation2017; Carver et al. Citation2018). Metabolites may be a significant salivary biomarker due to the presence of pyrethroid-metabolizing enzymes in human salivary glands and oral fluid (Nishimura and Naito Citation2006; Kragelund et al. Citation2008); both parent compounds and metabolites of other pesticides have been found in saliva of exposed individuals (Nigg et al. Citation1993). It should be mentioned that there are technical differences between saliva and oral fluid. Saliva is the secretions collected directly from the three major salivary glands in the mouth. Oral fluid is a mixture of secreted saliva from major and minor glands, as well as gingival crevice secretions and cellular debris (Crouch Citation2005). While saliva collection requires a trained technician to sample from the gland, oral fluid can be collected by the subject themselves. For simplicity and ease of recognition, we will refer to the biofluid used in this study as saliva.
Figure 1. Diagram of proposed mechanism of transport and metabolism for the fate of pyrethroid metabolites detected in saliva using permethrin as an example.
Pyrethroid insecticides have never been successfully measured in saliva. Several studies have measured pesticides or their metabolites in the saliva of exposed populations, demonstrating its potential as a noninvasive biofluid in pesticide exposure assessment (Nigg et al. Citation1993; Denovan et al. Citation2000; Lu et al. Citation2006). Additionally, several studies emphasize the importance of measuring metabolic products in saliva (Nigg et al. Citation1993; Lu et al. Citation2006; Smith et al. Citation2012). Therefore, the objectives of this study were to (1) develop an extraction protocol to quantify an array of six pyrethroid metabolites in saliva by gas chromatography – ion trap mass spectrometry (GC-ITMS), and (2) validate the method in an occupationally exposed population.
Materials and methods
Standards/reagents
Individual native standard solutions for pyrethroid metabolites, cis- and trans-3-(2,2-dichlorovinyl)-2,2-dimethyl-cyclopropanecarboxylic acid (c/t-DCCA, 100 µg/mL in acetonitrile, 98% purity, 46/54 isomer ratio), cis-3-(2,2-dibromovinyl)-2,2-dimethyl-cyclopropane carboxylic acid (c-DBCA, 99.1% purity), 4-fluoro-3-phenoxybenzoic acid (FPBA, 100 µg/mL in acetonitrile, 98% purity), and 3-phenoxybenzoic acid (3PBA, 100 µg/mL in acetonitrile, 98% purity) were obtained from Cambridge Isotope Laboratories (Andover, MA, USA). Cis- and trans-chrysanthemum dicarboxylic acid (c/t-CDCA) were synthesized and graciously supplied by Dr. André Charette at Université de Montréal. Isotopically labeled internal standard (IS) solutions of trans-3-(2,2-dichlorovinyl)-2,2-dimethyl-cyclopropanecarboxylic acid (D6-t-DCCA,) and 3-phenoxybenzoic acid (13C6-3PBA, 100 µg/mL in acetonitrile, 98% chemical purity, 99% isotopic purity) were purchased from Cambridge Isotope Laboratories.
1,1,1,3,3,3-Hexafluoro-2-propanol (HFIP, Supelco), sodium bicarbonate (NaHCO3, Sigma-Aldrich), N, N′ Diisopropylcarbodiimide (DIC, Sigma-Aldrich), and helix pomatia β-glucuronidase (100,000 units/mL) (Sigma-Aldrich) were purchased from MilliporeSigma (St. Louis, MO, USA). Methanol (MeOH), hexane, acetonitrile (ACN), toluene (TOL) and methyl tert-butyl ether (MTBE) were analytical grade (>98% purity) and purchased from Thermo Fisher Scientific (Waltham, MA) and dichloromethane (DCM) from Burdick & Jackson (Morris Plains, NJ, USA). Concentrated J.T. Baker hydrochloric acid (HCl, 37%) was purchased from Avantor Performance Materials (Center Valley PA, USA). Deionized (DI) water was generated by the Milli-Q Gradient Water Purification System (Molsheim, France). Gases used for instrumentation and lab equipment had a minimum purity of 99.99%. Helium and nitrogen were purchased from Airgas Inc. (Hapeville, GA, USA).
Surine negative control urine (Cerilliant) was purchased from MilliporeSigma. Pooled, anonymously donated human saliva and urine were collected from a non-occupationally exposed population to perform recovery and method development experiments and generate matrix-matched calibration curves.
Calibration preparation
A 10 µg/mL standard solution mixture was prepared in MeOH from five 100 µg/mL individual analytical standards. This 10 µg/mL mixture was serial diluted with MeOH to achieve 10 and 100 ng/mL working standard solutions. A calibration curve of 0, 0.5, 1, 2, 4, 6, 10, 15, 20, 40, 60, 100 ng/mL was prepared by spiking blank saliva with the appropriate amount of standard for a 20 µL final volume. A calibration curve of 0, 1, 2, 4, 8, 10, 15, 20, 40, 60, 80, 100, 150, 200 ng/mL was prepared for urine in a similar fashion to saliva but for a 40 µL final volume. Prior to the addition of the working standard solutions, each blank sample was spiked with 2 and 10 µL of 1 µg/mL IS mix (13C6-3PBA, D6-t-DCCA, c-CDCA) in saliva and urine, respectively.
Sample preparation
Saliva
Equal parts water were added to 0.5 mL saliva sample and spiked with 2 μL 1 µg/mL IS mix prior to adding 0.12 mL sodium acetate buffer (pH = 4.65). The sample was allowed to sit for 30 min before adding 0.1 mL 37% concentrated HCl and incubating for another 30 min. Liquid-liquid extraction (LLE) was performed by three replicate extractions of 1.5 mL MTBE. Samples were vortexed for 30 s and then centrifuged for 10 min at 3,500 RPM using the GS-6R centrifuge (Beckman & Coulter, Brea, CA, USA). The pooled organic extract was evaporated to dryness under a continuous stream of N2 gas using the Reacti-vap Evaporator (Pierce, Rochford, IL, USA) before reconstituting in 125 µL ACN and vortex mixing for 10 s. Seventy-five µL HFIP and 10 µL DIC was used as derivatization reagents to create analyte boiling points that were compatible with the GC. Samples were vortex mixed for 30 s, and the analyte/reagent mixture was sonicated for 20 min at room temperature in the B2500A-DTH ultrasonic cleaner (Avantor, Radnor, PA, USA) followed by 10 min on a roto-shake genie orbital shaker at 90 RPM (Scientific Industries, Bohemia, NY, USA). Samples were transferred to a 2.0 mL plastic screwcap centrifuge tube containing 1.0 mL 1 M NaHCO3. One hundred and twenty-five µL hexane was added to the glass vial to extract any remaining analyte residue and pipetted into the plastic tube. Samples were vortex mixed for 30 s and centrifuged for 3 min at 12,500 RPM the micro 18 R centrifuge (Avantor, Radnor, PA, USA) before transferring the supernatant to a 150 µL GC glass insert with a spring bottom placed in a 1.8 mL amber glass vial. Hexane clean-up was repeated once more, directly pipetting solvent into the plastic tube. The pooled hexane extract was evaporated down to a final volume of 20 µL and stored at −20 °C until analysis.
Urine
This method was adapted from Leng and Gries (Citation2005). Two mL urine samples were spiked with 10 µL 1 µg/mL IS mix followed by addition of 0.5 mL sodium acetate buffer (pH = 4.65) and 10 µL helix pomatia β-glucuronidase. Samples were incubated in a water bath at 37 °C and 90 oscillations per min for 16 h. Samples were removed and equilibrated to room temperature before adding 0.5 mL 37% concentrated HCl. LLE extraction was performed using three replicate extractions of 3.0 mL MTBE. Samples were vortexed for 30 s and then centrifuged for 10 min at 3,500 RPM. The pooled organic extract was evaporated to dryness under a slow stream of N2 gas before reconstituting in 250 µL ACN and vortex mixed for 10 s. One hundred and fifty µL HFIP and 20 µL DIC were used as derivatization reagents to allow for adequate analyte volatility within the GC column. Samples were vortex mixed for 30 s and the sample was allowed to react for 20 min in the sonicator followed by 10 min on an orbital shaker at 90 RPM. Samples were transferred to a two mL plastic screwcap centrifuge tube containing one mL 1 M NaHCO3. Two hundred and fifty µL hexane was added to the glass vial to extract any remaining analyte residue and pipetted into the plastic tube. Samples were vortex mixed for 30 s and centrifuged for 3 min at 10,850 RPM before transferring the supernatant to a 150 µL GC glass insert placed in a 1.8 mL amber glass vial. The hexane clean-up was repeated once more, directly pipetting solvent into the plastic tube. Pooled hexane extract was evaporated down to a final volume of 40 µL.
Instrument analysis
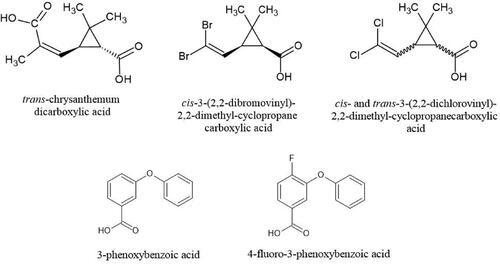
Six pyrethroid metabolites, t-CDCA, c/t-DCCA, c-DBCA, FPBA, and 3PBA (), were analyzed by the Agilent 7890 C GC System paired with the Agilent 240 ITMS. The instrument method was modified from the protocol published by Wren et al. (Citation2021). Notable changes were made as the method was migrated to a different manufacturer’s instrument. The initial temperature ramp was reduced from 4 °C/min to 2.5 °C/min to ensure full separation of the higher volatility analytes, which lengthened run time to 42.6 min. Injector temperature was changed to an isothermal temperature profile of 250 °C to promote immediate and consistent sample vaporization within the inlet.
Figure 2. Six pyrethroid metabolites commonly used in biological monitoring studies as analytes of interest for detection in saliva.
MS parameters changed significantly between instruments due to detection issues. Analytes and internal standards were measured in select ion storage (SIS) mode rather than MS/MS mode. Better performance in SIS mode may have been the result of the external ionization source. The two most abundant ions in a full scan run were selected as each analyte’s quantitation ions for SIS mode. TIC count and µScans were modified to 8,000 counts and 3 µScans averaged, respectively, based on suggested parameters of the manufacturer. Data analysis was performed using extracted ion monitoring (EIM).
Quantification
Separate saliva and urine matrix-matched calibration curves were used to quantify metabolite concentrations in unknown samples. Twelve calibration standards were prepared for saliva and 14 calibration standards were prepared for urine. Each point on the calibration curve was generated from the area ratio of the spiked analyte peak area to the spiked IS peak area plotted against the expected concentration. Area ratios for detectable peaks above and below the detection limit were generated for all unknown samples. The limit of detection (LOD) was calculated for each analyte as the point on the calibration curve that returned an S/N ratio of 3. The LOD was used as the detection threshold criteria for urines. Quantification was not performed on values below the LOD. Unambiguous identification of metabolites in saliva were reported as a detection. Detection of metabolites in saliva below the LOD were verified by comparing reference mass spectra to each sample; no quantification was performed. Calculated IS recoveries were used to correct reported concentrations. This was achieved by plotting the concentration of the native calibration standard of each analyte against their uncorrected area counts. The resulting linear equation was used to calculate the concentration of recovered IS in each sample. This value was used to correct the analyte concentrations in each sample.
Quality control
IS mixture (1 µg/mL) was spiked into each subject sample and quality control (QC) sample to monitor recoveries for each sample as well as intra- and inter-day variation. QC samples refers to the calibration standards and the field blanks. A laboratory generated QC sample was made from pooled anonymous samples and stored at −80 °C. The field blanks did not have any target analyte present. Aliquots were thawed to room temperature before analysis. An artificial urine sample and a water sample were transported in the field to serve as field blanks for urine and saliva, respectively.
Method application
Two field sampling devices were assessed: SalivaBio® passive drool sampler with the saliva collection aid (Salimetrics, Carlsbad, CA) and Salivette® (Sarstedt, Nümbrecht, Germany). To test recoveries from SalivaBio® sampler, 1 mL analyte-spiked saliva was pipetted into the device before being pipetted into a sample prep vial. To test recoveries from Salivette®, 1 mL analyte-spiked saliva was slowly pipetted onto the cotton swab to absorb the entire sample. Salivette® were centrifuged for 10 min at 2,000 RPM and washed three times with 1 mL water to remove the total sample from the cotton swab.
Study population
This study recruited nine pesticide applicators from a regional pest control company servicing the NY/NJ/PA tristate area. The study protocol was reviewed and approved by the Rutgers Biomedical and Health Sciences Institutional Review Board (Pro2018001306). Saliva and urine samples were collected from each participant before and after one full workday using a 2 mL SalivaBio® passive drool sampler and a 120 mL urine specimen container (Thermo Fisher Scientific, Waltham, MA, USA). Prior to saliva collection, participants were asked to rinse their mouths with water twice for 30 s and wait for 10 min. The field technician administered a questionnaire during the afternoon visit to gather information on the participants’ age, height, weight, race, occupational history, same-day pesticide application activity, personal protective equipment usage, non-occupational exposure, and factors that could interfere with pyrethroid metabolism, including consuming grapefruit and medication/supplement use.
Two mL DI water and surine negative control urine were taken to the sample collection site during the morning visit as field blanks in their respective collection containers. If multiple participants were sampled on the same day, one field blank was used for that day. All collected samples were transported on ice to the research facility and stored at −20 °C until analysis.
Results
Method optimization
Two primary liquid-liquid extraction (LLE) protocols for saliva using TOL, DCM, and MTBE were compared to optimize analyte recoveries, preparation time, and emulsion formation: (1) fast mixing and (2) slow mixing followed by centrifugation (). Slow mixing was achieved by 360° rotation at high speed on the RotoShake Genie (Scientific Industries, Inc., Bohemia, New York); fast speed was achieved by vortex mixing for 30 s using the VWR fixed speed mini vortex mixer (VWR International, Radnor, PA). TOL extraction recoveries under slow mixing conditions ranged from 85–104%, DCM recoveries were 72–88% under slow mixing conditions, and MTBE recoveries were 49–103% under fast mixing conditions. Data are not available for c/t-DCCA and t-CDCA for slow mixing because the instrument was unable to detect these compounds at the time of analysis.
Table 1. Recoveries (%) for liquid-liquid extraction (LLE) method development of 100 ng/mL six pyrethroid metabolite mixture spiked in saliva, comparing mixing speed and extraction solvent.
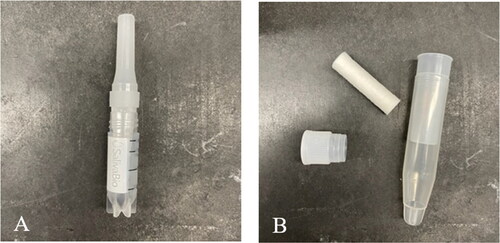
Two devices were assessed to collect saliva samples (), the SalivaBio® collection device and Salivette®. SalivaBio® passive drool method collects saliva through a collection aid attached to a 2 mL cryovial (). Salivette® requires participants to place a cylindrical cotton swab directly into their mouths and chew slowly for two min, spitting the swab into the device upon completion (). Extraction efficiencies were comparable; however, sufficient analyte recoveries with Salivette® required a series of MeOH washing steps. SalivaBio® collection device was chosen because it produced whole saliva without the additional washing step.
Figure 3. Two saliva collection devices tested for this study: (A) SalivaBio® sample collection aide attached to 2 mL cryovial, and (B) salivette® sample collection device showing cotton swab and cap separate from collection device.
Optimized chromatographic and mass spectrometric conditions used to identify and quantify the six pyrethroid metabolites are shown in . SIS and MS/MS modes were assessed for optimal sensitivity, and sufficient sensitivity was found using SIS for all analytes. c/t-DCCA and c/t-CDCA did not fragment sufficiently to effectively use MS/MS mode on the Agilent 240, and there was no significant difference in sensitivity between SIS and MS/MS for all six compounds (unpublished data).
Table 2. Retention time (RT), quantification (Q) ions and confirmation ions of six pyrethroid metabolites and three internal standards using gas chromatography – ion trap mass spectrometry in select ion storage mode.
Method application
presents demographic and exposure questionnaire data. Nine male PCOs were recruited for this study, average age 36 yr. old (range: 24–60 yr.) and average weight and height 195 lbs. and 71.3 in., respectively. Seventy-eight percent of workers used pyrethroid products at work on the day of sample collection and 89% prepared fresh mixtures. Fifty-six percent wore gloves while mixing. The most frequently used active ingredient was Demand CS, active ingredient lambda-cyhalothrin. Lambda-cyhalothrin is a type-2 pyrethroid whose principal metabolites are cyhalothrinic acid and 3PBA. Outdoor (28%) and indoor fan spray (20%), followed by indoor crack and crevice (15%), other methods (37%), which consisted of power misting and gel bait traps were the most common pesticide application methods used by the group. They spent on average 0.4 h. applying pesticides at each site and 1.1 h. applying pesticides during the workday. Data were also collected on non-occupational pyrethroid exposures, such as number of fruits and vegetables eaten daily, whether they wash their produce, and pesticide use at their residence and other factors affecting pyrethroid metabolite formation. PCOs did not use pyrethroid-containing pesticides at their residence, and they ate an average of 2.3 vegetables and 1.4 fruits daily. No significant sources of non-occupational exposures were documented. Twenty-two percent of the population took medications that interacted with pyrethroid-metabolizing CYPs.
Table 3. Questionnaire data including demographic information, occupational history, occupational and non-occupational exposures, and metabolic interferences of the study population.
Inter- and intra-day variations (%) for the saliva methodology, as well as LODs (ng/mL) and detection frequencies of pyrethroid metabolites in 18 urines samples and 17 saliva samples, are reported in . Intra-day variation for metabolites spiked in saliva ranged from 10% to 27%. Inter-day variation ranged from 2.67% to 49.4%. Metabolite LODs ranged from 0.08 to 0.34 ng/mL for urine and 0.04 and 0.22 ng/mL for saliva. Urinary 3PBA was detected in 100% of pre- and post-work samples. Cis/trans-DCCA were found in 11% pre-work and 33% post-work urine samples, and c-DBCA was detected in 11% of post-work urine samples. 3PBA was present in 0% of pre-work saliva samples and 22% of post work samples < LOD.
Table 4. Intra-day (n = 7) and inter-day (n = 5) variation (%) of saliva methodology, limit of detection (LOD) (ng/mL) and detection frequencies (%) for six pyrethroid metabolites analyzed in pre-work (n = 9) and post-work (n = 8) saliva and pre-work (n = 9) and post-work urine (n = 9) of nine pest control operators before and after a full day of work.
Average analyte concentrations detected in urine samples pre- and post-work are displayed in . One participant’s post-work saliva sample was lost during transport, which resulted in an n of 8 for post-work saliva. No significant differences were found in the metabolite levels between groups (paired t-test, p ≤ 0.05). Seven out of the nine PCOs had higher 3PBA levels in their urine at the beginning of the day compared to the end of the day. When comparing pre- and post-work urine samples, increased urinary metabolite concentrations were detected in three PCOs, specifically c/t-DCCA, c-DBCA, and 3PBA, which is likely due to work-related exposures. 3PBA was detected at < LOD in two of the three PCO’s post-work saliva samples that had work-related exposures that day.
Table 5. Mean concentrations (ng/mL) of six pyrethroid metabolites in pre- and post-work urine samples of nine pest control operators.
Discussion
The largest obstacle to overcome during the extraction process was the formation of stable or partial emulsions between saliva and the organic extraction solvents. An emulsion is a mixture of two or more immiscible liquid components, where one component becomes distributed into the other as fine droplets. Saliva is an effective emulsifier when mixed with organic solvents due to its protein content, which allows for stable, solid emulsions to form (Glumac et al. Citation2019). This limits the solvent’s ability to extract analytes from the biological matrix. Two mixing speeds were tested to determine whether a slower mixing speed over a longer time period would reduce emulsion formation from the faster, shorter vortex mixing speed. Both fast and slow mixing methods were found to form stable emulsions. Agitation speed is a significant variable used in emulsion formation procedures, where lower agitation speeds do not deter emulsion formation, but change properties of the emulsion (Sajjadi Citation2006). Also tested were various centrifugation steps as well as adding other diluents (water, 40% MeOH solution, and saturated NaCl solution). Since emulsion formation was unavoidable, the most effective way to break up the emulsions once formed was through diluting saliva with equal parts water and including a five-min centrifugation, subsequent 30 s vigorous vortex mixing and a final 10 min centrifugation step.
Derivatization reagent types and volumes were previously optimized in a serum method developed by this lab and adapted to saliva (Wren et al. Citation2021). Several organic solvents were tested along with two mixing speeds to optimize LLE recoveries for the six pyrethroid metabolites. TOL yielded the highest recoveries under slow mixing conditions; however, stable emulsions formed easily, and evaporation time lengthened the procedure significantly. Ultimately, MTBE with fast mixing was chosen because of its high volatility which reduced evaporation time, and it yielded adequate, reproducible analyte recoveries.
When assessing optimal ion storage modes on the Agilent 240 ITMS, this study did not find a difference in sensitivity between SIS and MS/MS mode. Generally, MS/MS mode provides greater sensitivity by ITMS analysis due to the molecular fingerprint generated by the MS/MS fragmentation process (Sheehan and Yost Citation2015). It is not clear why this instrument could not properly fragment c/t-DCCA and c/t-CDCA, and more research should be done to identify the cause of this phenomenon. Ionization source location (external to the trap) may have played a role. Sensitivity was improved for t-CDCA (455 m/z) and 3PBA (364 m/z) when only using their quantitation ions for data analysis. This reduced background levels and removed matrix peaks that co-eluted with or were adjacent to the analytes.
Higher pre-work urinary 3PBA concentrations were detected in seven PCOs as compared to their post-work 3PBA levels. Three individuals showed increased post-work urinary metabolite levels, which indicate same day work-related exposures. Urine samples were collected in the morning prior to work and assumed to be first morning voids. First morning voids have a greater accumulation of metabolites overnight than other spot samples taken throughout the day. These results indicate that urinary metabolite levels were primarily driven by previous workday exposures and other non-occupational exposures. Data were not collected on their applications from the past 48 h, so their occupational use of other pyrethroid containing pesticides cannot be confirmed.
Interestingly, the metabolites found in the PCOs post-work urine samples did not correlate with the pesticides they documented in their daily pesticide log. Previous contamination of their trucks, equipment, clothing, application equipment and other work areas could explain why different pyrethroid exposures were detected from the compounds they used that day. We believe the detected exposures were a combination of chronic exposures due to the likelihood of consistent occupational exposures and acute exposures at irregular intervals which could be dependent on the PCO’s daily application method and frequency, environment, and PPE use while mixing and applying pesticides. Additionally, this population did not show high concentrations or detection frequencies of pyrethroid exposure through their workday. Explanations for this observation include proper PPE compliance by most participants during mixing and application, as well as varied exposure risk based on application site (e.g., indoor/outdoor) and method (e.g., fan spray vs. gel bait).
Of the three PCOs that experienced work-related exposures, as evidenced by higher post-work urinary metabolite concentrations, 3PBA was found in two PCOs post-work salivary samples < LOD. While pyrethroid metabolites were present in 0% pre-work saliva samples, the recent exposures captured by the post-work urines explain why 3PBA was visible in post-work saliva. Salivary concentrations are highly correlative to blood concentrations, for which pyrethroids and their metabolites have relatively short half-lives, ranging from 2 to 17 h (Hanson et al. Citation2015). Pyrethroids that entered into the bloodstream would be transferred into and visible in saliva within this approximate time range. Since metabolite levels detected in pre-work urine are assumed to be from previous workday exposures, most of the pesticides should have already been removed from circulation, and, therefore, were not present in pre-work saliva samples. Overall, low correspondence between urinary and salivary metabolite concentrations within individuals are likely due to the nature of each biological matrix. Salivary concentrations are driven by the concentration of unbound (free) circulating pyrethroids in blood and are subject to short circulating half-lives while urinary levels represent the majority of unbound, serum protein-bound, and conjugated pyrethroids in the body and have a comparatively longer elimination half-life, detected in urine samples up to 48-hrs post-exposure (Leng et al. Citation1997). It was expected that simultaneously collecting whole saliva and urine samples at only one post-work time point so soon after a potential exposure would not yield perfectly synced exposure data between biomatrices. However, this was done to favor the likelihood of detecting pyrethroid biomarkers in the whole saliva. Even with the greater frequency of pre-work detects in urine, this study was able to document increased pyrethroid metabolite urinary levels in two out of the three subjects that had post-work saliva detects.
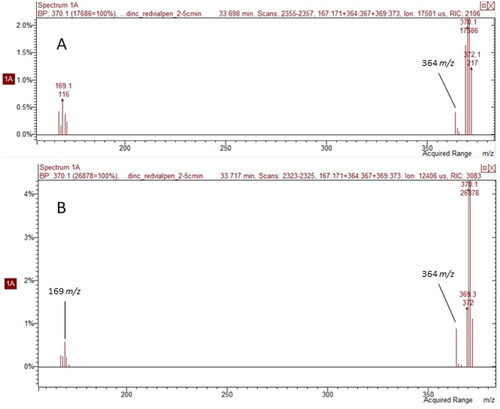
3PBA was present in saliva samples < LOD. Its identity was confirmed within each sample by evaluating quantitation ions, confirmation ions and isotopic ratios. Example mass spectra of 3PBA detected in PCO saliva and a 10 ppb 3PBA matrix-spiked saliva sample are presented in . It was not surprising to see 3PBA as a singular marker of exposure in saliva because it is a common metabolite for several different pyrethroids. In addition, PCOs frequently used pesticides with active ingredients that generate 3PBA as a metabolic product, such as cyhalothrin, deltamethrin, and cypermethrin. We did not correlate the 3PBA levels in saliva with those in urine because salivary concentrations were under the detection limit. We did not use them as quantifiable values, but rather as a qualitative measure of their detection.
Figure 4. Comparison of mass spectra for 3PBA detected in (A) a pest control operator (PCO) saliva sample and (B) 10 ppb 3PBA-spiked saliva sample. Both spectra exhibit characteristic quantitation ions, 364 m/z and 169 m/z, and similar retention times.
compares the present study to four previous studies assessing salivary pesticide levels in occupationally exposed workers. Two types of occupational populations were assessed in these studies, pesticide applicators and pesticide manufacturer workers. Five different pesticide classes were measured in saliva: pyrethroids, TCP-γ (a chlorpyrifos metabolite), diazinon, atrazine, and ethion. Peak salivary pesticide concentrations ranged between < LOD and 9.5 ng/mL. The current study documented lower urinary concentrations and detection frequencies than most studies. This may be due to rapid metabolism and elimination of pyrethroids compared to the other pesticides studied. It may also be due to reduced exposures to the applicator, either through proper PPE use or lower frequencies of application during the workday. One study found unreasonably high levels of ethion in saliva samples, which they attributed to mouth contamination. This limitation does not exist with other biological fluids that strictly represent internalized doses.
Table 6. Biomonitoring studies assessing pesticide levels in saliva, population characteristics, methodology, and sample analysis.
Differences in occupational exposures may have influenced study outcomes as well. The frequencies, durations, and magnitudes of exposures for each job type may be more uniform across the population in one study versus another, which can also influence exposure levels and subsequent salivary concentrations. For instance, Lu et al. (Citation2006) sampled from agricultural workers who were handling and applying the same concentration of diazinon, over similar time periods using one application method. Questionnaire results from the present study indicated that PCOs were applying different active ingredients using a variety of application methods at different times of the day. Additionally, PPE use and adherence to other safety protocols can vary among countries and are strong predictors of exposure in occupationally exposed populations (Blanco et al. Citation2005).
Sampling designs varied between studies as well. All studies collected a post-work sample to best capture work-related exposures. Most studies sampled twice, either once before work or once the following day. Zhang et al. (Citation2013) only sampled post-work, and Lu et al. (Citation2006) sampled at multiple time-points throughout the pre-season and application season. Denovan et al. (Citation2000) and Nigg et al. (Citation1993) referenced specific sampling times, and Lu et al. (Citation2006) sampled relative to the actual application time, as opposed to the end of their workday. Timing is a critical factor in detecting biomarker concentrations in saliva, and as more research is conducted using saliva in occupational biomonitoring studies, a standardized sampling protocol should be established that best captures exposure levels.
Studies used the parent molecules, metabolites, or both as biomarkers to assess salivary concentrations. Studies that used parent molecules were able to consistently detect their target analytes, ranging from 41% to 100% of the study population. Conversely, metabolite detection was not uniform between studies. Nigg et al. (Citation1993) noted that ethion metabolite levels in saliva were variable but detected at low concentrations. Zhang et al. (Citation2013) however found a 100% detection rate of TCP-γ among the applicator saliva samples. Pesticides evaluated in these studies are lipophilic compounds, which can passively transfer into saliva based on their Kow values (Michalke et al. Citation2015). Metabolites differ in this regard. They are often hydrophilic in nature and some are ionized at serum pH (∼7), which would hinder their ability to transport across cellular membranes (e.g., 3PBA pKa ∼3.8) (Aps and Martens Citation2005). Metabolites present in the saliva would be a result of hydrolysis and oxidative metabolism performed by enzymes located in salivary acinar cells and within oral fluid (Nishimura and Naito Citation2006; Kragelund et al. Citation2008). Detection frequencies and exposure estimates would be underreported if a portion of the pyrethroids present in saliva had not been metabolized. This factor could also account for the lower detection frequencies reported in the current study.
Another important factor to consider in salivary transport is a compound’s serum protein binding capacity (Michalke et al. Citation2015; Carver et al. Citation2018) which will influence what fraction of the compound in circulating blood is available to be transported into saliva. Serum protein binding capacity for commonly used biocides range from 18% to 97% (Maliwal and Guthrie Citation1981; Lu et al. Citation1998). Pyrethroids are highly bound in blood circulation (88–90%) which may also contribute to the lower detection frequencies found in the current study (Sethi et al. Citation2019).
While other saliva assays have been developed to improve pesticide exposure assessment protocols in workers, they only detect one specific compound. Multi-analyte methodologies to assess salivary contents are limited (Martín Santos et al. Citation2020), and this study was enhanced by its multi-analyte detection capabilities. Analytical chemistry-based methods have the potential to greatly expand the target analyte list, detecting a wide range of pesticides and other toxic agents in occupational settings. This is potentially preferential to enzyme-linked immunosorbent assays which are time consuming to develop, analyte-specific, and prone to cross-react with structurally similar compounds (Zhang et al. Citation2013). The utility of the method can only be enhanced by the sensitivity improvements in analytical instrumentation.
We acknowledge the limitations of this study include a small sample size and limitations in the timing of sampling collection to measure exposures. Under IRB specifications, a sample size ≤ 9 can be considered as a pilot study, which was our main driving factor for limiting our study to nine participants. Additionally, the purpose of this study was to verify the presence of pyrethroid metabolites in saliva within an occupational population. We chose to limit our sampling times to convenient, consistent locations and times for both participants and research technicians to collect samples and administer the questionnaire all in one day. Our attempt was to collect the urine and saliva samples before and after a workday in order to capture potential acute exposures and better characterize chronic exposures utilizing the questionnaire. Future studies can be conducted to capture toxicokinetic profiles of salivary pyrethroid biomarkers in comparison to standard biomatrices, such as urine and blood.
Conclusions
While saliva collection provides noninvasive, convenient method for detecting drugs, metals, organic pollutants, and other clinically relevant biomarkers, research investigating its values in pesticide exposure assessment is lacking. This is the first attempt to assess the value of saliva to detect pyrethroid exposures in any population. Noninvasive sampling methodologies, such as saliva collection, may improve worker compliance in health and safety monitoring programs and reduce risk in sampling procedures compared to routine blood draws. Pyrethroid metabolites were present in 22% of saliva samples under the detection limit in the study population. More research should be done to determine the toxicokinetic profile of pyrethroid biomarkers in saliva and how they relate to concentrations in other biological compartments, such as urine and blood. Method development and characterization of salivary pyrethroid biomarkers will provide a viable biomonitoring alternative that can be used in exposure characterizations of future risk assessment studies. Saliva is easier to collect, less invasive, and more accepted in this post-COVID era.
Author contributions
Melody Wren was responsible for sample collection and analysis, data analysis, result interpretation, and manuscript writing. Brian Buckley was responsible for funding acquisition, results interpretation, manuscript editing, and content review. Mark Robson was responsible for recruitment, results interpretation, and content review.
Acknowledgments
Acknowledgements to Tri-County Termite and Pest Control Inc. and the employees that participated in this study. Thank you to Patrick Kenny MPH, who liaised with Tri-County Termite and Pest Control Inc. and assisted with recruitment and field work. The authors acknowledge the Rutgers – New Jersey Agricultural Experiment Station for their participation and support. This study was supported by the National Institute of Environmental Health Sciences (P30ES005022) and National Instituteof Environmental Health Sciences (T32ES019854 and T32ES007148).
Disclosure statement
No potential competing interest is reported by the author(s).
Additional information
Funding
References
- Aps JKM, Martens LC. 2005. Review: the physiology of saliva and transfer of drugs into saliva. Forensic Sci Int. 150(2–3):119–131. doi: 10.1016/j.forsciint.2004.10.026.
- Blanco LE, Aragón A, Lundberg I, Lidén C, Wesseling C, Nise G. 2005. Determinants of dermal exposure among nicaraguan subsistence farmers during pesticide applications with backpack sprayers. Ann Occup Hyg. 49(1):17–24. doi: 10.1093/annhyg/meh084.
- Borzelleca JF, Skalsky HL. 1980. The excretion of pesticides in saliva and its value in assessing exposure. J Environ Sci Health B. 15(6):843–866. doi: 10.1080/03601238009372220.
- Caporossi L, Santoro A, Papaleo B. 2010. Saliva as an analytical matrix: state of the art and application for biomonitoring. Biomarkers. 15(6):475–487. doi: 10.3109/1354750X.2010.481364.
- Carver ZA, Han AA, Timchalk C, Weber TJ, Tyrrell KJ, Sontag RL, Luders T, Chrisler WB, Weitz KK, Smith JN. 2018. Evaluation of non-invasive biomonitoring of 2,4-Dichlorophenoxyacetic acid (2,4-D) in saliva. Toxicology. 410:171–181. doi: 10.1016/j.tox.2018.08.003.
- Crouch DJ. 2005. Oral fluid collection: the neglected variable in oral fluid testing. Forensic Sci Int. 150(2–3):165–173. doi: 10.1016/j.forsciint.2005.02.028.
- Denovan LA, Lu C, Hines CJ, Fenske RA. 2000. Saliva biomonitoring of atrazine exposure among herbicide applicators. Int Arch Occup Environ Health. 73(7):457–462. doi: 10.1007/s004200000174.
- Gallardo E, Queiroz JA. 2008. The role of alternative specimens in toxicological analysis. Biomed Chromatogr. 22(8):795–821. doi: 10.1002/bmc.1009.
- Genuis SJ, Beesoon S, Birkholz D. 2013. Biomonitoring and elimination of perfluorinated compounds and polychlorinated biphenyls through perspiration: blood, urine, and sweat study. ISRN Toxicol. 2013:483832. doi: 10.1155/2013/483832.
- Glumac M, Qin L, Chen J, Ritzoulis C. 2019. Saliva could act as an emulsifier during oral processing of oil/fat. J Texture Stud. 50(1):83–89. doi: 10.1111/jtxs.12375.
- Hanson B, Bond C, Buhl K, Stone D. 2015. Pesticide half-life fact sheet. Oregon State University Extension Services. http://npic.orst.edu/factsheets/half-life.html.
- Hold KM, de Boer D, Zuidema J, Maes RA. 1996. Saliva as an analytical tool in toxicology. Int J Drug Test. 1(1):1–36.
- Kaneko H. 2011. Pyrethroids: mammalian metabolism and toxicity. J Agric Food Chem. 59(7):2786–2791. doi: 10.1021/jf102567z.
- Kragelund C, Hansen C, Torpet LA, Nauntofte B, Brøsen K, Pedersen AML, Buchwald C, Therkildsen MH, Reibel J. 2008. Expression of two drug‐metabolizing cytochrome P450‐enzymes in human salivary glands. Oral Dis. 14(6):533–540. doi: 10.1111/j.1601-0825.2007.01415.x.
- Leng G, Gries W. 2005. Simultaneous determination of pyrethroid and pyrethrin metabolites in human urine by gas chromatography–high resolution mass spectrometry. J Chromatogr B Analyt Technol Biomed Life Sci. 814(2):285–294. doi: 10.1016/j.jchromb.2004.10.044.
- Leng G, Leng A, Kühn KH, Lewalter J, Pauluhn J. 1997. Human dose-excretion studies with the pyrethroid insecticide cyfluthrin: urinary metabolite profile following inhalation. Xenobiotica. 27(12):1273–1283. doi: 10.1080/004982597239859.
- Lu C, Anderson LC, Morgan MS, Fenske RA. 1998. Salivary concentrations of atrazine reflect free atrazine plasma levels in rats. J Toxicol Environ Health A. 53(4):283–292. doi: 10.1080/009841098159286.
- Lu C, RodrÍGuez T, Funez A, Irish RS, Fenske RA. 2006. The assessment of occupational exposure to Diazinon in Nicaraguan plantation workers using saliva biomonitoring. Ann N Y Acad Sci. 1076(1):355–365. doi: 10.1196/annals.1371.057.
- Maliwal BP, Guthrie FE. 1981. Interaction of insecticides with human plasma lipoproteins. Chem Biol Interact. 35(2):177–188. doi: 10.1016/0009-2797(81)90141-1.
- Martín Santos P, Jiménez Carracedo C, del Nogal Sánchez M, Pérez Pavón JL, Moreno Cordero B. 2020. A sensitive and automatic method based on microextraction by packed sorbents for the determination of polycyclic aromatic hydrocarbons in saliva samples. Microchem J. 152:104274. doi: 10.1016/j.microc.2019.104274.
- Michalke B, Rossbach B, Göen T, Schäferhenrich A, Scherer G. 2015. Saliva as a matrix for human biomonitoring in occupational and environmental medicine. Int Arch Occup Environ Health. 88(1):1–44. doi: 10.1007/s00420-014-0938-5.
- Mullangi R, Agrawal S, Srinivas NR. 2009. Measurement of xenobiotics in saliva: is saliva an attractive alternative matrix? Case studies and analytical perspectives. Biomed Chromatogr. 23(1):3–25. doi: 10.1002/bmc.1103.
- Nigg H, Stamper J, Mallory L. 1993. Quantification of human exposure to ethion using saliva. Chemosphere. 26(5):897–906. doi: 10.1016/0045-6535(93)90364-B.
- Nishimura M, Naito S. 2006. Tissue-specific mRNA expression profiles of human phase I metabolizing enzymes except for cytochrome P450 and phase II metabolizing enzymes. Drug Metab Pharmacokinet. 21(5):357–374. doi: 10.2133/dmpk.21.357.
- Ntihabose R, Surette C, Foucher D, Clarisse O, Bouchard MF. 2018. Assessment of saliva, hair and toenails as biomarkers of low level exposure to manganese from drinking water in children. Neurotoxicology. 64:126–133. doi: 10.1016/j.neuro.2017.08.011.
- OHRP. 1998. Expedited review: categories of research that may be reviewed through an expedited review procedure. https://www.hhs.gov/ohrp/regulations-and-policy/guidance/categories-of-research-expedited-review-procedure-1998/index.html
- Porucznik CA, Cox KJ, Wilkins DG, Anderson DJ, Bailey NM, Szczotka KM, Stanford JB. 2015. A preliminary study of biomonitoring for bisphenol-A in human sweat. J Anal Toxicol. 39(7):562–566. doi: 10.1093/jat/bkv055.
- Richardson JR, Fitsanakis V, Westerink RHS, Kanthasamy AG. 2019. Neurotoxicity of pesticides. Acta Neuropathol. 138(3):343–362. doi: 10.1007/s00401-019-02033-9.
- Sajjadi S. 2006. Effect of mixing protocol on formation of fine emulsions. Chem Eng Sci. 61(9):3009–3017. doi: 10.1016/j.ces.2005.10.071.
- Schramm KW. 2008. Hair-biomonitoring of organic pollutants. Chemosphere. 72(8):1103–1111. doi: 10.1016/j.chemosphere.2008.04.017.
- Sethi P, Bruckner JV, Mortuza T, Cummings BS, Muralidhara S, White CA. 2019. Plasma protein and lipoprotein binding of cis- and trans-permethrin and deltamethrin in adult humans and rats. Drug Metab Dispos. 47(9):941–948. doi: 10.1124/dmd.118.085464.
- Sheehan T, Yost RA. 2015. What’s the most meaningful standard for mass spectrometry: instrument detection limit or signal-to-noise ratio. Curr Trends Mass Spectrom. 13:16–22.
- Silva Pinto BG, Marques Soares TK, Azevedo Linhares M, Castilhos Ghisi N. 2020. Occupational exposure to pesticides: genetic danger to farmworkers and manufacturing workers – a meta-analytical review. Sci Total Environ. 748:141382. doi: 10.1016/j.scitotenv.2020.141382.
- Skalsky HL, Lane RW, Borzelleca J. 1979. Excretion of carbaryl into saliva of the rat and its effect on cholinesterase. Inter-American Conference on Toxicology and Occupational Medicine, Miami, FL.
- Smith JN, Wang J, Lin Y, Klohe EM, Timchalk C. 2012. Pharmacokinetics and pharmacodynamics of chlorpyrifos and 3,5,6-trichloro-2-pyridinol in rat saliva after chlorpyrifos administration. Toxicol Sci. 130(2):245–256. doi: 10.1093/toxsci/kfs251.
- Timchalk C, Weber TJ, Smith JN. 2015. Computational strategy for quantifying human pesticide exposure based upon a saliva measurement. Front Pharmacol. 6:115. doi: 10.3389/fphar.2015.00115.
- Weber TJ, Smith JN, Carver ZA, Timchalk C. 2017. Non-invasive saliva human biomonitoring: development of an in vitro platform. J Expo Sci Environ Epidemiol. 27(1):72–77. doi: 10.1038/jes.2015.74.
- Wren M, Liu M, Vetrano A, Richardson JR, Shalat SL, Buckley B. 2021. Analysis of six pyrethroid insecticide metabolites in cord serum using a novel gas chromatography-ion trap mass spectrometry method. J Chromatogr B Analyt Technol Biomed Life Sci. 1173:122656. doi: 10.1016/j.jchromb.2021.122656.
- Zhang W, Tang Y, Du D, Smith J, Timchalk C, Liu D, Lin Y. 2013. Direct analysis of trichloropyridinol in human saliva using an Au nanoparticles-based immunochromatographic test strip for biomonitoring of exposure to chlorpyrifos. Talanta. 114:261–267. doi: 10.1016/j.talanta.2013.06.012.