
Abstract
Scientists and health communication professionals expressed frustration over the relationship between misinformation circulating on the Internet and global public perceptions of and responses to the Ebola epidemic originating in West Africa. Using the big data platform Media Cloud, we analyzed all English-language stories about keyword “Ebola” published from 1 July 2014 to 17 November 2014 from the media sets U.S. Mainstream Media, U.S. Regional Media, U.S. Political Blogs, U.S. Popular Blogs, Europe Media Monitor, and Global Voices to understand how social network theory and models of the networked global public may have contributed to health communication efforts. 109,400 stories met our inclusion criteria. The CDC and WHO were the two media sources with the most inlinks (hyperlinks directed to their sites). Twitter was fourth Significantly more public engagement on social media globally was directed toward stories about risks of U.S. domestic Ebola infections than toward stories focused on Ebola infections in West Africa or on science-based information. Corresponding public sentiments about Ebola were reflected in the policy responses of the international community, including violations of the International Health Regulations and the treatment of potentially exposed individuals. The digitally networked global public may have influenced the discourse, sentiment, and response to the Ebola epidemic.
Due to rapid Internet advancements and emerging media technologies, the last two decades have been marked by the rise of a highly connected and digitally empowered general public. In contrast to most of the 20th century, today’s public sphere is a complex global network of many voices fostered by the growing variety of modes of (mostly digital) communication both in publishing content and in determining which content attracts attention. In this networked public sphere, attention continues to follow the traditional power law: a few stories and sources within any given issue usually attract the vast majority of the attention (Barabási, Citation1999). Some argue that the continued operation of this power law indicates that only a few elite actors will have meaningful influence on public sentiment about a given topic (Barabási, Citation1999; Hindman, Citation2008). Others argue that the networked public sphere can act as an “attention backbone,” directly and indirectly gathering attention from a diverse set of actors and modes of publishing, and ultimately influencing whose voices are heard and shared online (Benkler, Citation2006).
Scientists and health professionals expressed tremendous frustration over the relationship between misinformation circulating on the Internet and the global public’s perceptions and responses during the Ebola epidemic that originated in West Africa (Chandler et al., Citation2015; The Lancet, Citation2014; Merino, Citation2014; Mitman, Citation2014; Oyeyemi, Gabarron, & Wynn, Citation2014; Ratzan & Moritsugu, Citation2014; Trad, Fisher, & Tambyah, Citation2014). Their interpretation of the situation was often unidirectional: misinformation shaped public sentiment. Thus, corresponding solutions were frequently too simplistic, aimed at correcting the misinformation in an effort to redirect public sentiment globally, an ultimately ineffective approach (Chandler et al., Citation2015). New network theory research suggests the true relationship between misinformation and public perception is much more complex: the networked public sphere is no longer merely a target audience but is now a major contributor to the online health communication arena, shaping the conversations with individual sentiments and social engagements. In this paper, we explore how models of the networked public sphere online may apply to modern health communication and the Ebola epidemic. We analyze the complex interplay between media, social media, and the broader international community’s response to the epidemic; complications magnified by modern media modalities likely negatively influenced policy responses, diverted attention and resources from where they were most needed, and may have played a role in violations of the International Health Regulations. This study aims to provide insight into how social network theory applies to modern health communication management moving forward.
Methods
For this study, we used Media Cloud, a big data platform for the quantitative study of online media. Media Cloud provides a searchable archive of over 250 million stories from 50,000 media sources over more than 5 years, along with tools to analyze that archive. It has been used successfully for the development of previous studies designed to elucidate the operation of the networked public sphere and online influence (Benkler, Roberts, Faris, Solow-Niederman, & Etling, Citation2013; Faris, Roberts, Etling, Othman, & Benkler, Citation2015; Graeff, Stempeck, & Zuckerman, Citation2014). We analyzed a set of web pages located by Media Cloud, as described below, to determine story identification and intensity of coverage, and performed link analysis, content clustering, and social media analysis to determine the most influential media sources and stories during our designated time period. The combination of these analyses would provide us with insights into the networked public sphere’s influence over online media engagement about Ebola.
Story Identification and Intensity of Coverage
We searched using the keyword “Ebola” for all English language stories published from 1 July 2014 to 17 November 2014 in the following media sets: U.S. Mainstream Media, U.S. Regional Media, U.S. Political Blogs, U.S. Popular Blogs, Europe Media Monitor, and Global Voices. The date range corresponded to the period of most intense media coverage of Ebola, as indicated by preliminary Media Cloud searches and thus provided us with the richest data set.
For each story discovered, we downloaded the HTML for that story. We extracted the substantive text of each story by eliminating advertisement, navigational, and other surrounding content and parsed the text into individual sentences. We then counted the number of sentences published each day to track intensity of coverage over time. We supplemented this set of stories by downloading each link in each story and adding to the set any more stories that included the keyword “Ebola” not yet included. We repeated this iterative spidering process 15 times, until very few new stories had been found and we determined we had reached saturation.
Link Analysis
As a metric of influence for media sources and stories, we used link analysis to report the number of incoming hyperlinks (inlinks) directed to a given story from a media source other than the publisher. This follows the approach used for social network analysis in previous Media Cloud-based studies (Adamic & Glance, Citation2005; Hargittai, Gallo, & Kane, Citation2007). In the process of spidering the hyperlinks of every story in the set, we recorded data about which of those stories linked to other stories in the set. We included only hyperlinks within the substantive text of each story. To determine influence within the link economy, we counted the number of inlinks for each story and for each media source. We counted as inlinks any links coming from media sources other than the stories’ own media source. This approach is based on the commonly accepted assumption that a link from one site to another indicates that the linked site has exerted some influence over the linking site. This behavior does not necessarily imply agreement but has been shown to indicate substantive engagement, a measure of influence within a network (Hargittai et al., Citation2007).
Content Clustering
We used content clustering to identify communities of media sources that used similar language and to determine how specific language maps onto those communities. For each of the 50 media sources with the most inlinks, and thus determined to be the most influential, we identified the 100 words most commonly used by each media source in its Ebola stories, for a total of 5,000 words. To generate this list of the top 100 words for each media source, we first stemmed each of the words and then omitted any of 4,362 English stopwords. We then generated a bipartite graph with both the media sources and their most common words as nodes and added an edge between each media source and each word among the top 100 words for the given media source. For example, an edge was created between the WHO node and the “epidemic” node because “epidemic” was among the 100 words most commonly used by WHO. Finally, we drew the map using the force-based layout algorithm Force Atlas 2 (Blondel, Guillaume, Lambiotte, & Lefebvre, Citation2008) to determine the position of the nodes and the Louvain community detection algorithm to determine the color of the nodes. Sources that used common language were clustered into color-coded communities within the visualization map.
Social Media Analysis
Because link analysis only tells us which sources and stories are receiving links and not who is reading or sharing those links, we used two different social media metrics to better understand the sources with which the public (as opposed to publishers) was engaging: Uniform resource locators (URLs), otherwise known as Internet addresses, shared on Twitter and clicks on Bitly links (shortened URL links found on social media sites that redirect users to original media sources). For both Twitter and Bitly data, we generated a list of common variants for the URL of each story, as well as a list of URLs found by the spider (an automated web crawler) to redirect to any of those URLs. For Twitter, we used the company’s application program interface (API) to count the number of times any of those URL variants were included in a tweet. This Twitter metric does not directly count the number of people who read the story, but it does indicate social media interest in a story or topic. For Bitly, we used the company’s API to count the number of times any web user clicked on a Bitly link that resolved to any of the story’s URL variants.
Results
Story Identification and Coverage Intensity
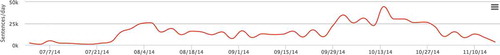
Our initial Media Cloud search identified 83,972 stories. The iterative spidering process identified an additional 25,428 stories, for a total set of 109,400 Ebola-related stories. Over the course of October, Ebola was by far the most prevalent news story in U.S. online media. In fact, U.S. media covered Ebola more intensely than it covered any topic for any month since October 2010 (the earliest date for which Media Cloud data is available), with the sole exception of coverage of the final month of the 2012 U.S. presidential election.
Three distinct peaks of Ebola coverage occurred around July 27, September 28, and 15 October 2014 (). On July 27, reports broke of the first infections of American doctors in Liberia. On September 30, media widely reported the infection of Thomas Duncan in Texas as the first infection on U.S. soil. On October 12, Ebola coverage intensified with the first infection of a health care worker in the United States. After October 12, a series of other U.S. infection-related events led to continuous coverage that gradually lessened in intensity over time.
Figure 1. Coverage intensity (number of online stories published) of the Ebola epidemic through online media from 1 July 2014 to 17 November 2014. (Source: Authors’ analysis of coverage intensity for keyword “Ebola” 2015.)
Link Analysis
lists the 10 media sources and lists the 10 stories with the most inlinks. Science- and medical-related actors and stories received the most inlinks within the network of coverage. The CDC and WHO were the two most inlinked media sources, followed by New York Times and Twitter. The rest of the 10 most inlinked sources were all U.S. mainstream media sites, with the exception of Reuters, a UK media company with a large U.S. footprint. Seven of the top 10 stories by inlinks were WHO or CDC stories. The Twitter “#ebola” hashtag itself was the fourth most inlinked story, an Ebola category page for ABC News was seventh, and a Texas infection story was tenth.
Table 1. Top 10 media sources online ranked by quantity of inlinks from 1 July 2014 to 17 November 2014
Table 2. Top 10 media stories online ranked by quantity of inlinks from 1 July 2014 to 17 November 2014
Content Clustering
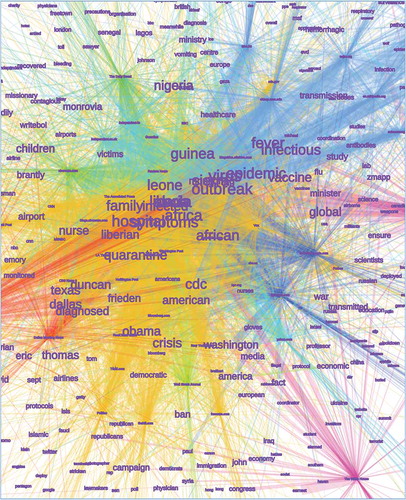
and are two different views of the map resulting from the content clustering. The map includes five communities, which are described in : (1) U.S./Politics (yellow); (2) U.S./Texas (red); (3) Human Suffering (bluegreens); (4) Science/Medical (violet); and (5) Governance (indigo). Overall, the U.S./Politics community constitutes the core of the networked map, with the Science/Medical sources mostly segregated into the top right corner. The U.S./Politics cluster consists overwhelmingly of major U.S. mainstream media (USA Today, LA Times, New York Times, etc.). The Science/Medical cluster consists mostly of national and international health agencies (WHO, NIH) and science-focused publications (Nature). The CDC is located among the Science/Medical sources by the layout algorithm but placed in the U.S./Politics community on the map, suggesting use of language from both categories. This map shows that sources focusing on language and phrasing oriented toward science and medicine were largely separate from those focusing on language oriented toward U.S. domestic concerns and politics.
Table 3. Summary of color-coded communities within the visualization maps shown in and
Figure 2. Network map of the five communities identified by the content clustering analysis that shared common language and phrasing during the Ebola epidemic, with example sources labeled. (Source: Authors’ content clustering analysis of communities and keywords, 2015.)
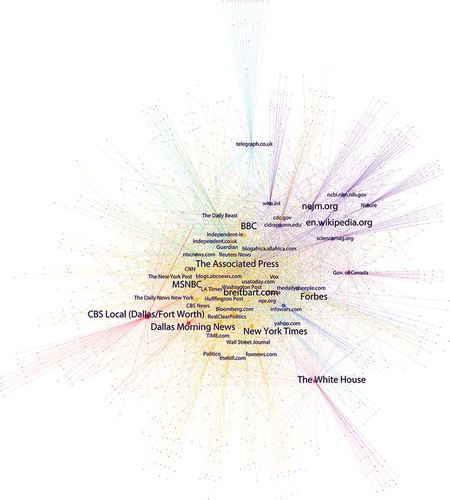
Figure 3. Network map of the five communities identified by the content clustering analysis that shared common language and phrasing during the Ebola epidemic, displaying examples of the most common words used in published text. (Source: Authors’ content clustering analysis of communities and keywords, 2015.)
Social Media Analysis
Six of the top 10 stories by Twitter shares are from the U.S./Politics content cluster, while 2 are cluster outliers and 2 are White House pages. Only 1 WHO or CDC story appears among the top 20 stories by Twitter shares. The list of media sources with the most Bitly clicks across social media consists solely of U.S./Politics sources, led by CNN, ABC News, and Washington Post.
lists the combined top 10 stories by Twitter shares and Bitly clicks. Twelve out of eighteen stories were focused directly on risks of domestic infection in the United States or Europe. Three stories were pieces debunking various aspects of that domestic risk. Two stories focused on emotional personal narratives of individuals in West Africa. The remaining story was a page of New York Times visualizations about Ebola, split roughly evenly between African- and U.S.-focused coverage.
Table 4. Top 10 stories by Twitter shares and Bitly clicks 1 July 2014 to 17 November 2014
Discussion
As of 23 September 2015, there had been 4 confirmed cases of Ebola in the United States and 1 reported death (World Health Organization, Citation2015a), compared with 28,295 Ebola cases reported to WHO from Guinea, Liberia and Sierra Leone, and 11,295 reported deaths (Centers for Disease Control and Prevention, Citation2015). However, our results show that vastly more public attention internationally within social media was directed toward stories about risks of U.S. domestic Ebola infections than toward stories focused on confirmed Ebola infections in the impacted African countries. For example, this imbalance existed in a media controversy that dominated the U.S. news cycle more than any other topic in the past 4 years other than the last month of the 2012 U.S. presidential election. As the largest donor globally during the crisis, making up more than 50% of total donations, the United States became a leader in thought and in action (Finanacial Tracking Service, Citation2015).
To understand media coverage in the networked public sphere globally, we must look beyond simple metrics like numbers of web page views for individual web pages or numbers of followers on Twitter for particular accounts. Instead, we must grapple with the networked interplay of publishers, content, link economy, and social media engagement. Our multimodal analysis provided several key findings. Challenges in communication included the immense engagement in U.S. and international online media focused mostly on risk of domestic infection in countries where true risk was low. Positive outcomes included the fact that the flood of stories about local U.S. cases also resulted in many inlinks to expert sources such as the CDC and WHO that promoted information consistent with the best available public health knowledge about Ebola. Additionally, attention was also paid to stories refuting misinformation. Notably, personal stories about African suffering, appealing to human emotion and compassion, during the Ebola outbreak were among the most highly engaged.
Although health and infectious disease authorities were clearly influential, our findings support our hypothesis that the digitally connected global public was a critical influencer within the network. In fact, our results provide evidence that health authorities were more influential among other media publishers than among the broader public, resulting in the prevalence of inlinks to public health sites but the scarcity of attention paid to those sites in social media (Twitter shares and Bitly clicks). As a result, international health authorities were largely unsuccessful in directing the narrative about the Ebola outbreak and response among the global public online.
A striking example of this public influence was the sharp contrast between particular international responses and the recommendations of Médecins Sans Frontières (MSF) and other prominent health authorities. MSF advised against forced quarantines and travel bans as methods for controlling the epidemic because these measures “breed fear and unrest” and interfere with the international community’s ability to respond (Doctors Without Borders, Citation2015). These sentiments were echoed by the scientific and health community throughout the epidemic (Asgary, Pavlin, Ripp, Reithinger, & Polyak, Citation2015; Bogoch et al., Citation2015; Drazen et al., Citation2014; Lancet Infectious Diseases, Citation2014; McCarthy, Citation2014a, Citation2014b; Ratzan & Moritsugu, Citation2014; Rosenbaum, Citation2015). In its July 2015 Report of the Ebola Interim Assessment Panel, the World Health Organization concluded, “the global community does not take seriously its obligations under the International Health Regulations (2005)—a legally binding document.” Close to one-quarter of its member states were in violation of the IHR by enacting travel bans and other restrictive measures that negatively impacted travel and aid to the affected countries (World Health Organization, Citation2015b). This may explain why the terms “quarantine” and “ban” were not found within the scientific language cluster in our map, but were found within the U.S./Politics cluster, reflecting the division between the medical/scientific and the political narratives responding to public fear and sentiment.
While scientific experts avoided discussion of bans and quarantines, those topics were widely discussed in the U.S./Politics cluster, and policymakers acted in accord with those discussions. The governors of New York and New Jersey instituted strict mandatory quarantines of all travelers who had been in direct contact with infected patients, regardless of whether or not they were showing symptoms (Santora, Citation2014). Schools in Ohio and Texas closed due to fears that faculty and students traveled on the same plane as a healthcare worker who later developed a low-grade fever after caring for an Ebola patient in Dallas (Bever, Citation2014). And a New Jersey school requested that two children who moved from Rwanda, a country with zero cases of Ebola, remain home from school for a “21 day waiting period.” The school later issued an apology (Milo, Citation2014).
The digitally networked global public in this case study acted not so much as a set of diverse independent actors publishing or passively consuming content. Instead, we see a complex set of interactions between diverse interests and the actions of international health institutions, largely mainstream media content publishers, and consumer attention expressed through social media. These findings suggest that we should view the general public not merely as a target audience for broadcast information, but rather as a contributing actor in the online global public health communication arena. Individuals from around the world shaped the conversations with their social engagements within the network by sharing stories of interest and by clicking on stories shared by others.
Health communication strategies may need to include not only traditional broadcast diffusion tactics but also social diffusion approaches that account for the networked public sphere and consequently the values of influencers within online networks. Health knowledge and information is born from a rigid, evidence-based process. Yet, once this information is published online, the networked public sphere determines what is relevant, credible, and worthy of online engagement in a process independent of the strength of scientific arguments.
Social health communication strategies could include innovative ways of interacting with the influencers within online social networks in order to amplify positive messaging supported by science and evidence. These strategies, grounded in network science, might be developed through a combination of testing various sources (open-access versus peer-reviewed subscription publications), content vehicles (info graphics, text-based, videos, or interactive activities), and social message testing (fact-based narrative, anecdotes and personal stories, or resources like fact sheets). Learning from this study, for example, global health agencies might model their content on successful debunking stories or on the individual narratives of African actors that gathered international attention despite running counter to fear-driven narratives of possible U.S. outbreaks.
Conclusion
Our study supports our hypothesis that the digitally networked global public online likely influenced the discourse, sentiment, and response to the Ebola epidemic. Small-scale incidents, such as the relatively limited number of cases in the United States and other developed countries, were amplified within the network and became one of the most highly visible aspects of the entire online conversation. The most common language used within the U.S./Politics network did not correlate with the response recommendations or reporting by health authorities and scientific experts. The network thus provided a platform for messages that reflected the fears and concerns of the networked public rather those of health officials. Our results warrant further research into how the networked public sphere is affecting current health communication successes (or failures) and whether innovative, socially oriented strategies are needed. We believe that systematic analysis of digital networks, which could include statistical testing for correlation between network engagement and specific social communication strategies, will broaden the scientific sphere of influence in order to compel positive, evidence-based public health communication approaches within the networked public with success.
Acknowledgment
We wish to acknowledge Megan Murray, MD, MPH, ScD of the Harvard Global Health Research Core for her support and insights into the development of this paper.
References
- Adamic, L. A., & Glance, N. (2005). The political blogosphere and the 2004 U.S. election. Proceedings of the 3rd International Workshop on Link Discovery - LinkKDD ‘05, 1–16. doi:10.1145/1134271.1134277
- Asgary, R., Pavlin, J. A., Ripp, J. A., Reithinger, R., & Polyak, C. S. (2015, February). Ebola policies that hinder epidemic response by limiting scientific discourse. American Journal of Tropical Medicine and Hygiene, 92(2), 240–241. doi:10.4269/ajtmh.14-0803
- Barabási, A. (1999). Emergence of scaling in random networks. Science, 286(5439), 509–512. doi:10.1126/science.286.5439.509
- Benkler, Y. (2006). The wealth of networks: How social production transforms markets and freedom. New Haven, CT: Yale University Press.
- Benkler, Y., Roberts, H., Faris, R., Solow-Niederman, A., & Etling, B. (2013, July 19). Social Mobilization and the Networked Public Sphere: Mapping the SOPA-PIPA Debate. Retrieved June 22, 2015, from http://papers.ssrn.com/sol3/papers.cfm?abstract_id=2295953
- Bever, L. (2014, October 17). Chain reaction: Concern about Ebola Nurse’s flight prompts school closings in two states. The Washington Post. Retrieved June 22, 2015, from http://wapo.st/11xeMU0
- Blondel, V. D., Guillaume, J., Lambiotte, R., & Lefebvre, E. (2008, October 9). Fast unfolding of communities in large networks. Journal of Statistical Mechanics: Theory and Experiment, 2008(10), 10008. doi:10.1088/1742-5468/2008/10/p10008
- Bogoch, I. I., Creatore, M. I., Cetron, M. S., Brownstein, J. S., Pesik, N., Miniota, J., … Khan, K. (2015, January). Assessment of the potential for international dissemination of Ebola virus via commercial air travel during the 2014 west African outbreak. The Lancet, 385(9962), 29–35. doi:10.1016/S0140-6736(14)61828-6
- Centers for Disease Control and Prevention. (2015, September 22). 2014 Ebola outbreak in West Africa—Case counts. Retrieved from http://www.cdc.gov/vhf/ebola/outbreaks/2014-west-africa/case-counts.html
- Chandler, C., Fairhead, J., Kelly, A., Leach, M., Martineau, F., Mokuwa, E., … Wilkinson, A. (2015, April). Ebola: Limitations of correcting misinformation. The Lancet, 385(9975), 1275–1277. doi:10.1016/S0140-6736(14)62382-5
- Doctors Without Borders. (2015, March 23). Ebola: Pushed to the limit and beyond. Retrieved from https://www.doctorswithoutborders.org/sites/usa/files/msf143061.pdf
- Drazen, J. M., Kanapathipillai, R., Campion, E. W., Rubin, E. J., Hammer, S. M., Morrissey, S., & Baden, L. (2014, November). Ebola and quarantine. New England Journal of Medicine, 371(21), 2029–2030. doi:10.1056/NEJMe1413139
- Faris, R., Roberts, H., Etling, B., Othman, D., & Benkler, Y. (2015, February 10). Score another one for the Internet? The role of the networked public sphere in the U.S. net neutrality policy debate. Berkman Center Research Publication No. 2015-4. Social Science Research Network. Retrieved September 28, 2015, from, http://ssrn.com/abstract=2563761
- Financial Tracking Sevice. (2015). Ebola Virus Outbreak—West Africa, April 2014. Tracking Global Humanitarian Aid Flows. Retrieved from https://fts.unocha.org/pageloader.aspx?page=emergencyDetails&emergID=16506
- Graeff, E., Stempeck, M., & Zuckerman, E. (2014, February 3). The battle for ‘Trayvon Martin’: Mapping a media controversy online and off-line. First Monday, 19(2). doi:10.5210/fm
- Hargittai, E., Gallo, J., & Kane, M. (2007). Cross-ideological discussions among conservative and liberal bloggers. Public Choice, 134(1–2), 67–86. doi:10.1007/s11127-007-9201-x
- Hindman, M. (2008). The myth of digital democracy. Princeton, NJ: Princeton University Press.
- Lancet. (2014, November 8). The medium and the message of Ebola. The Lancet, 384(9955), 1641. doi:10.1016/S0140-6736(14)62016-X
- Lancet Infectious Diseases. (2014, December 14). Rationality and coordination for Ebola outbreak in west Africa. The Lancet Infectious Diseases, 14(12), 1163. doi:10.1016/S1473-3099(14)71020-5
- McCarthy, M. (2014a, October 20). Obama calls for calm as US ramps up domestic Ebola response. BMJ, 349, g6333.
- McCarthy, M. (2014b, October 22). US revamps domestic Ebola response. BMJ, 349, g6417.
- Merino, J. G. (2014). Response to Ebola in the US: Misinformation, fear, and new opportunities. BMJ, 349, g6712–g6712. doi:10.1136/bmj.g6712
- Milo, P. (2014, October 21). Maple Shade school official apologizes for Ebola scare, report says. NJ.com. Retrieved from http://bit.ly/1KRGfkd
- Mitman, G. (2014, November). Ebola in a stew of fear. New England Journal of Medicine, 371(19), 1763–1765. doi:10.1056/NEJMp1411244
- Oyeyemi, S. O., Gabarron, E., & Wynn, R. (2014, October). Ebola, Twitter, and misinformation: A dangerous combination? BMJ, 349(oct14 5), g6178–g6178. doi:10.1136/bmj.g6178
- Ratzan, S. C., & Moritsugu, K. P. (2014). Ebola crisis–communication chaos we can avoid. Journal of Health Communication: International Perspectives, 19(11), 1213–1215. doi:10.1080/10810730.2014.977680
- Rosenbaum, L. (2015, January). Communicating uncertainty—Ebola, public health, and the scientific process. New England Journal of Medicine, 372(1), 7–9. doi:10.1056/NEJMp1413816
- Santora, M. (2014, October 24). First patient quarantined under strict new policy tests negative for Ebola. The New York Times. Retrieved June 22, 2015, from http://nyti.ms/1z48o4v
- Trad, M.-A., Fisher, D. A., & Tambyah, P. A. (2014, November). Ebola in west Africa. The Lancet Infectious Diseases, 14(11), 1045. doi:10.1016/S1473-3099(14)70924-7
- World Health Organization. (2015a, September 23). Ebola situation report—23 September 2015. Retrieved from http://apps.who.int/ebola/current-situation/ebola-situation-report-23-september-2015
- World Health Organization. (2015b, July), Report of the Ebola Interim Assessment Panel. Retrieved from http://www.who.int/csr/resources/publications/ebola/ebola-panel-report/en/