
Abstract
This study aims to generate evidence-based guidelines for researchers regarding how to effectively disseminate mental health research via Twitter. Three hundred mental health research Tweets posted from September 2018 to September 2019 were sampled from two large Australian organizations. Twenty-seven predictor variables were coded for each Tweet across five thematic categories: messaging; research area; mental health area; external networks; and media features. Regression analyses were conducted to determine associations with engagement outcomes of Favourites, Retweets, and Comments. Less than half (n = 10) of predictor variables passed validity tests. Notably, conclusions could not reliably be drawn on whether a Tweet featured evidence-based information. Tweets were significantly more likely to be Retweeted if they contained a hyperlink or multimedia. Tweets were significantly more likely to receive comments if they focused on a specific population group. These associations remain significant when controlling for organization. These findings indicate that researchers may be able to maximize engagement on Twitter by highlighting the population groups that the research applies to and enriching Tweets with multimedia content. In addition, care should be taken to ensure users can infer which messages are evidence-based. Guidelines and an accompanying resource are proposed.
Mental and substance use disorders are among the leading causes of burden of disease worldwide, affecting over one billion people globally in 2016 (Rehm & Shield, Citation2019). Despite the prevalence and impact of these disorders, research-to-practice gaps continue to slow the effective implementation of evidence-based practice and policy (Jorm & Malhi, Citation2013; Proctor et al., Citation2009; Wainberg et al., Citation2017; Wiltsey Stirman, Gutner, Langdon, & Graham, Citation2016). Currently, the average research-to-practice gap for health research is 17 years (Morris, Wooding, & Grant, Citation2011). Given this slow model of implementation, mental health knowledge dissemination beyond the academic sphere is an increasing point of focus of funding bodies, the public, and researchers (Chambers, Pintello, & Juliano-Bult, Citation2020; Proctor et al., Citation2009).
Social media is the leading alternative metric through which medical research is disseminated to the general public (Adams & Loach, Citation2015). Twitter (www.twitter.com), a microblogging site, is increasingly the social media site of choice for researchers wanting to share scholarly findings (Adams & Loach, Citation2015). Positive associations between Tweets and article citation rate have been observed across multiple fields of health research, with highly Tweeted articles more likely to be highly cited (Clavier et al., Citation2020; Eysenbach, Citation2011; Hayon et al., Citation2019; Ladeiras-Lopes, Clarke, Vidal-Perez, Alexander, & Luscher, Citation2020). A review of research dissemination and implementation science resources from 2015 to 16 found that 60% of resources involved social media, with Twitter being the most common (Darnell et al., Citation2017). Researchers using Twitter can “Tweet” up to 280 characters, including hyperlinks, hashtags and “mentions” (i.e., a Tweet that contains a hyperlink to another account by mentioning their username). The Tweet can be accompanied by enriched media content such as images and videos. Other Twitter users can then “follow” individuals or organizations. Users with higher follower counts have more visible Tweets to the wider Twitter user base.
In April 2023, Twitter was renamed “X,” and shortly after launched a paid subscription option (“Twitter Blue” or “X Premium”) that gives users access to additional features such as the ability to Tweet up to 10,000 characters. As of August 2023 these premium features have been accessed by a small minority (<0.2%) of users, the website name has remained “Twitter,” and nomenclature associated with the website (e.g., “Tweeting” and “Retweeting”) is still widely used across the platform (Binder, Citation2023a). While the content features of a Tweet (i.e., character limit) have remained very similar since the launch of “X,” the deregulation of content moderation (i.e., what the platform will allow in the messaging of a Tweet) appears to have negatively impacted user engagement. A survey of scientists using Twitter (n = 9,200) released by Nature in August 2023 showed more than half of respondents had reduced their Twitter usage in the past six months, with many reporting this was due to an increase in fake accounts and hate speech on the platform (Vidal Valero, Citation2023). This loss of scientists also appears to be reflective of Twitter’s broader userbase, with usage statistics shared by Twitter in September 2023 reporting a loss in daily active users ranging between 3.7–11.6% since November 2022 (Binder, Citation2023b).
Despite the recent loss of Twitter users, leading alternatives such as Threads and Mastodon are currently far less utilized than Twitter. Threads launched in July 2023 with an initial 2.3 million active users, which sharply declined to 576,000 in August 2023 (Clayton, Citation2023). Mastodon, launched in 2016, experienced a large increase in daily active users following the launch of “X” (from 1.17 million in April 2023–1.71 million as of September 2023), yet this is still a small fraction of Twitter’s 200–250 million daily active users as of September 2023 (Binder, Citation2023b; Mastodon, Citation2023). While the changes to Twitter following the launch of “X” have impacted Twitter’s userbase, it currently remains a leading social media platform.
It is estimated that 1 in 5 Australians and Americans use Twitter (Auxier & Anderson, Citation2021; Yellow, Citation2020). On average, users will spend 4 hours per week on the platform, and 38% will Tweet at least once during this time (Yellow, Citation2020). Recent findings indicate Twitter users have higher than average levels of education (with 42% of adult Twitter users holding a Bachelor degree or higher), which may make them a receptive social media audience to health research findings (Pew Research Centre, Citation2019).
However, due to its popularity and accessibility, Twitter has also been recognized as a source of misinformation. For example, a 2021 systematic review of health misinformation across a number of social media platforms (n = 69 studies) found that misinformation was most common on Twitter (Suarez-Lledo & Alvarez-Galvez, Citation2021). The dissemination of medical misinformation via Twitter also received increased attention as a result of the COVID-19 pandemic (Kouzy et al., Citation2020; The Lancet Digital, Citation2023; Petersen & Gerken, Citation2021; Scannell et al., Citation2021; Wang & Lu, Citation2022). A content analysis of 673 COVID-19 related Tweets sampled in February 2020 found that 1 in 4 (24.8%) contained misinformation (Kouzy et al., Citation2020), and researchers also noted an increase in preprinted publications that had not yet been peer reviewed being shared via Twitter (Carlson, Harris, & Blekhman, Citation2020). The growth of medical misinformation on Twitter resulted in the implementation of regulations to identify Tweets containing COVID-19 misinformation (such as the use of written warnings beneath Tweets), however these warnings have now been removed as COVID-19 cases continue to decline (Susarla, Citation2022). The struggle to contain the spread of medical misinformation during a global pandemic has continued to fuel debate about how to most effectively control medical misinformation on social media platforms, with a number of recent studies highlighting the need for individuals or organizations with expertise to provide reliable sources of information on social media that are engaging, while also delineating their content as evidence-based (Bin Naeem, Bhatti, & Khan, Citation2020; Chou, Gaysynsky, & Cappella, Citation2020; Muhammed & Mathew, Citation2022; Petersen & Gerken, Citation2021; Walter, Brooks, Saucier, & Suresh, Citation2020).
Despite this increased need for evidence-based voices on social media, and the potential of Twitter to be a powerful knowledge dissemination tool for health researchers and clinicians, there is a lack of guidance for how to use Twitter to effectively disseminate mental health research specifically.
Existing studies of mental health and Twitter have primarily focused on analyzing public discourse around mental health topics (e.g., people sharing their experiences of living with mental illness, analyzing languages changes relating to mental health in Tweets over time) (Berry et al., Citation2017; McClellan, Ali, Mutter, Kroutil, & Landwehr, Citation2017; Stupinski et al., Citation2022), or Twitter as a tool for symptom detection (e.g., assessing the severity of depression, PTSD or suicidality from Tweet content) (Azam, Agro, Sami, Abro, & Dewani, Citation2021; Coppersmith, Harman, & Dredze, Citation2014; O’Dea et al., Citation2015). These areas of focus are also reflected in studies of Twitter and health more broadly (Sinnenberg et al., Citation2017), and are distinct from mental health research Tweets, which focus more on sharing developments or findings from mental health research projects and/or project output such as publications.
The neglected questions of “what do I say” and “how do I say it” require addressing to guide researchers using Twitter toward higher content engagement and more impactful knowledge dissemination.
The aims of the current study are twofold;
To understand how the written text of mental health research Tweets is associated with user engagement (“What do I say?”)
To understand how content features (such as hashtags and external links) of mental health research Tweets are associated with user engagement (“How do I say it?”)
Methods
In the current study, the Tweets of two mental health research organizations were collected, coded, and correlations between content features (e.g., hashtags, subject matter, use of media) and user engagement (e.g., Retweets, Comments) were explored.
Organization Selection
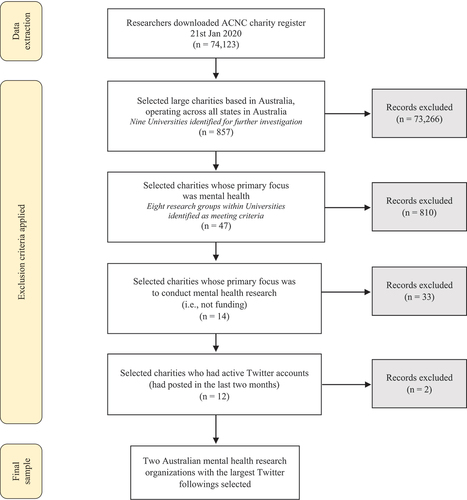
Twitter has no publicly available indexed list that could be used to identify mental health research organizations with the largest number of followers. As such, the authors designed a selection process utilizing the Australian Charities and Not-for-profits Commission (ACNC) charity register. It should be noted that most Australian universities and medical research institutes are included in this list. To be included in the current study, organizations needed to be operating in all Australian states; be focused primarily on mental health and conducting mental health research; and have an active Twitter account.
From this, the two Australian mental health research organizations with the largest Twitter followings were selected (). At the time of Tweet selection, the selected organizations Twitter accounts had a total of 38,267 and 8,841 followers, respectively.
Figure 1. Organization selection process.
Tweet Selection
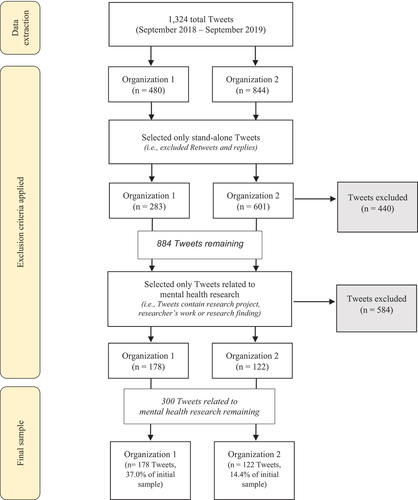
All Tweets from both organizations for the period of September 2018 – September 2019 were extracted using the online tool Followers Analysis (www.followersanalysis.com). This time period was selected to ensure results would be current but limited the impact that national and international emergencies such as the Australian bushfires (beginning November 2019) or the COVID-19 pandemic (beginning March 2020) had on the generalizability of findings. Researchers (EM, LT) reviewed the initial sample of 1,324 Tweets from both organizations, and following a selection process (), a final sample of 300 Tweets (178 from Organization 1 and 122 from Organization 2) were selected for content analysis.
Figure 2. Tweet selection process.
Data Collection and Outcome Measures
Engagement
User engagement with selected Tweets was the primary outcome for this study. Based on similar studies, four publicly available engagement metrics for each Tweet were considered when measuring engagement (Kim et al., Citation2017; Park, Reber, & Chon, Citation2016). These included number of Favourites (i.e., a user “liking” a Tweet), Video Views, Comments and Retweets (i.e., a user sharing a Tweet). The number of likes and Retweets a Tweet received was extracted from the Followers Analysis tool while number of Video Views and Comments were manually coded by EM, SGB, TG, ZB and CW.
Tweet Content Analysis
Content considered for coding and analysis was limited to the text contained within each Tweet. This encompassed hashtags, mentions, and any hyperlinks included within the text, as well as whether media content accompanied the Tweet or not (but not the content of accompanying media).
An initial codebook to extract key features of Tweets was developed by LT and trialed among a random selection of 30 Tweets independently coded by SGB, TG, ZB, CW, KP, SN, and CW. Coders met to discuss any conflicts and refine the initial codebook. The revised codebook (see ) was then used to code the final sample of Tweets (n = 300).
Table 1. Content codebook for research tweets
Twenty-seven predictor variables were coded for each Tweet across five thematic categories, which mapped on to the primary aims of the study: Messaging, Research Area, and Mental Health Area analyzed the written text of Tweets (“what do I say?”), whereas External Networks and Media Features analyzed the content features associated with Tweets (“how do I say it?”). Notably, certain content within Tweets was coded across multiple thematic categories. For example, written text that was part of a hashtag (e.g., #depression) was considered part of “what” the user was saying (coded under the thematic categories of Messaging, Research Area and Mental Health Area), as well as “how” the user had chosen to utilize content features to say it (i.e., coded as “Tweet uses hashtags” under the thematic category of External Network).
The authors acknowledged that due to the issue of misinformation on Twitter, further guidance was needed to discern which Tweets were “evidence-based” when coding. For the predictor variable “Tweet promotes research results or evidence-based information,” coders assessed Tweet text only to identify whether the information had come from an evidence-based source (e.g., a peer-reviewed article, conference presentation, or clinical guidelines).
EM and TG initially coded 150 tweets each. Predictor variables in the thematic categories of Messaging, Research Area and Mental Health Area (e.g., “Tweet promotes research program or tool”) were found to be subjective predictor variables with lower levels of initial agreement and as such, underwent inter-rater coding by a second reliability coder (SGB or ZB) to establish validity and reliability.
As inter-rater reliability scores are affected by marginal distributions (Syed & Nelson, Citation2015), subjective predictor variables underwent a frequency check, and variables present in < 10% or > 90% of the total 300 Tweets across the total primary coder dataset were eliminated. Remaining subjective predictor variables with a Cohen’s Kappa < 0.6 were determined to have poor reliability and were eliminated from further analysis.
Conversely, predictor variables in the thematic categories of External Network and Media Features (e.g., “Tweet mentions other accounts”) were found to be objective predictor variables with a high degree of initial agreement, and as such did not undergo inter-rater reliability tests.
All results were calculated using SPSS (Statistical Package of Social Sciences, Chicago, IL, USA) software version 27.
Regressions for Engagement Outcome Variables
Following coding, remaining predictor variables determined to be valid and reliable were considered for regression, performed by SO. As two of the dependent engagement outcome variables were non-normally distributed count data (i.e., one Retweet, Favourite), Poisson and negative binomial regression models were considered. To test the robustness of significant findings, “organization” was added as a covariate in the models, to account for potential confounds on the dependent engagement outcome variables. Statistics were calculated using R version 4.0.3 (R Core Team, Citation2021). MASS (v7.3–53; Venables & Ripley, Citation2002) and foreign (v0.8–80; R Core Team, 2020) packages were used for the Poisson, negative binomial, and binary logistic regression model analyses. Correlations between all predictors, and variance inflation factors for all models were investigated to ensure that multicollinearity assumptions were not violated for regression models.
Results
Primary coder data results () showed that for the thematic category of Messaging, Tweets promoting research results or evidence-based information were most frequent (50.0% of Tweets), followed by an announcement (43.0%), most often about collaborations with other research groups or external organizations. For Research Area, Tweets were most likely to be unclear or not otherwise specify the area of research the Tweet related to (48.3%), followed by treatment (22.0%), translation/implementation (18.7%), and prevention/early intervention (17.3%). Nearly two-thirds of Tweets (62.0%) did not specify a mental health condition as their focus, instead referring more generally to mental health research. A majority of Tweets used hashtags (90.0%), media (83.3%), and hyperlinks (78.3%), and just over half of Tweets mentioned another account (56.3%). On average, the organizations used two hashtags (m = 2.2, SD = 1.34) and mentioned one account (m = 1.3, 1.3 SD = 1.27) per Tweet.
Table 2. Predictor variable frequencies and reliability coding results
The most common hashtags used were #mentalhealth, #suicideprevention, #youthmh, and #depression. Mentioned accounts were most likely to be researchers affiliated with the organization such as directors or lead researchers.
Eleven subjective predictor variables were eliminated due to low frequency (present in < 10% of Tweets), with eight of these belonging to the Mental Health Area thematic category. No variables were eliminated for high frequency (>90%).
The remaining 12 subjective predictor variables underwent reliability coding ().
Average kappa scores between pairs of coders showed variables in the Mental Health Area category had the highest scores; depression and suicide subjective predictor variables both reached significance and had κ scores of > 0.90. Variables in the Research Area thematic category were all found to be unreliable (κ <0.6), and this category was eliminated from further analysis. For the category of Messaging, coders did not reliably agree on whether a Tweet featured research results or evidence-based information (κ = 0.56), or whether the Tweet promoted a research program or tool (κ = 0.46).
Following validity and reliability testing, 10 predictor variables (six subjective predictor variables and four objective predictor variables) remained for regression analyses ().
Table 3. Regression results for predictor variables found to be valid and reliable
All engagement outcome variables had a high level of variability. Videos were only present in eight (2.6%) Tweets, with a mean view count of 1,207 (SD = 734.71). Due to the low frequency of videos and high variation in view count, this engagement outcome variable was eliminated from further analysis. Commenting occurred in 20.3% of Tweets, with a Tweet receiving less than one comment on average (m = 0.49, SD = 1.76). This engagement outcome variable was converted to a “comment/no comment” dichotomous variable for binary logistic regression. Favouriting (i.e., a user “liking” a Tweet) occurred in 96.3% of Tweets, with an average Favourite count of 16 (m = 16.39, SD = 17.97). Retweets occurred in 92.3% of Tweets, with an average Retweet count of 7 (m = 7.19, SD = 7.17). Both Retweets and Favourites were over-dispersed, and negative binomial models had smaller fit indices for both engagement outcome variables. As such, negative binomial models were used for hypothesis testing.
Even after adjusting for the effect of organization (), Tweets were significantly more likely to receive Retweets if they contained a hyperlink (IRR = 2.05 [CI 1.53–2.75], p = <.001) or included media (IRR = 1.32 [CI 1.00–1.74], p = .045). Tweets were significantly more likely to receive Comments if they focused on the mental health of a specific population group (OR = 2.20 [CI 1.10–4.52], p = .028), and were significantly more likely to receive Favourites if the mental health area was suicide (IRR = 1.59 [CI 1.13–2.24], p = .007). Tweets were significantly less likely to receive Favourites if they used hashtags (IRR = 0.63 [CI 0.43–0.89], p = .011).
Discussion and Conclusion
What Do I Say?
Variables in the “what do I say” thematic categories of Messaging, Mental Health Area, and Research Area were largely found to have no significant impact on engagement. Exceptions were Tweets focusing on the mental health of specific population groups (e.g., youth or emergency workers) being significantly more likely to receive Comments, and Tweets focusing on suicide being significantly more likely to receive Favourites.
These findings aren’t consistent with other content analysis studies focused on health-related Tweets, where results indicate that the written text of a Tweet is associated with engagement across a number of content variables (Ju, Jia, & Cheng, Citation2023; Nastasi et al., Citation2018; Scannell et al., Citation2021; So et al., Citation2016; Wang & Lu, Citation2022). Only one study was found that analyzed the association between Tweet content and engagement for mental health Tweets specifically (Ju, Jia, & Cheng, Citation2023), and no studies of this kind were found that focused exclusively on mental health research Tweets. The content analysis study from Ju, Jia, and Cheng (Citation2023) consisted of 5,361 Tweets from three US mental health organizations posted between 14 November 2018 and –14 November 2019. Researchers analyzed Tweet content through categorical variables similar to our study (e.g., “mentions specific mental illness” and “includes call to action”) (Ju, Jia, & Cheng, Citation2023).
Analysis of variance tests in Ju, Jia, and Cheng (Citation2023) showed that Tweets mentioning a specific mental illness or mental health in general were more significantly more likely to receive Retweets, Comments and Favourites than Tweets that did not mention mental health. Tweets featuring a call to action were significantly more likely to receive Comments. The top three Retweeted and Favourited topics were stigma, mental health care and suicide/suicide prevention, and the top three Commented topics were stigma, mental health care and statistical overview (Ju, Jia, & Cheng, Citation2023).
This contrasts with our findings that only Tweets mentioning suicide were significantly more likely to receive Favourites, yet Tweets that mentioned mental health more generally did not receive more Retweets, Comments or Favourites than Tweets that did not mention mental health (e.g., Tweet announced researcher received an award, but it was unclear what for). We also found no consistency in the Messaging or Mental Health Area variables for our top three Retweeted, Favourited or Commented Tweets, and no significant association between Tweets featuring a call to action and engagement variables. The disparity between our findings and Ju, Jia, and Cheng (Citation2023) may indicate that the impact messaging has on engagement may differ between more general mental health Tweets (e.g., advocating against stigma or sharing experiences of care), and mental health research Tweets specifically, where messaging may focus more on factual information or key findings.
Notably, both our study and Ju, Jia, and Cheng (Citation2023) found that Tweets mentioning suicide had high rates of engagement (Ju, Jia, & Cheng, Citation2023). Contextualizing this finding among broader studies focusing on social media and suicide is difficult, as both our study and Ju, Jia, and Cheng (Citation2023) sampled Tweets from mental health organizations, whereas a majority of existing studies on this topic sample Tweets by hashtags or Tweet text. This method results in Tweet samples dominated by individuals sharing their experiences of suicide (i.e., attempts, ideation or the loss of a loved one), and studies focused on evaluating risk, symptom detection or peer support (Colombo, Burnap, Hodorog, & Scourfield, Citation2016; Cote et al., Citation2021; Jeri-Yabar et al., Citation2019; Rabani, Khan, & Khanday, Citation2020; Sinyor et al., Citation2021). The minority of studies evaluating how sharable suicide-related Tweet content is often equate shareability with a “contagion” effect (e.g., the “Blue Whale challenge”) (Khasawneh et al., Citation2020; Upadhyaya & Kozman, Citation2022), and this content is not comparable with our Tweet sample.
The increased engagement with suicide-related Tweets in both our study and Ju, Jia, and Cheng (Citation2023) may be indicative of the high prevalence of suicide, which remains among the top four causes of death in Australia and the US for people aged 10–50 (Australian Institute of Health and Welfare, Citation2021; Centers for Disease Control and Prevention, Citation2022). Similarly, both our study and Ju, Jia, and Cheng (Citation2023) found Tweets mentioning mental health in general were more common than Tweets mentioning specific mental illnesses, and that highly prevalent mental illnesses such as depression were more represented than less prevalent illnesses such as psychosis or OCD. Further research is needed with larger sample sizes from multiple mental health organizations to make sufficiently powered head-to-head comparisons between what drives engagement for mental health Tweets focused on different topics such as research, advocacy, or specific mental illnesses.
Our finding that researchers coding Tweets could not reliably agree on whether Tweets were evidence-based is representative of the broader issue of misinformation on social media, and how researchers can best delineate their content as evidence-based (Bin Naeem, Bhatti, & Khan, Citation2020; Chou, Gaysynsky, & Cappella, Citation2020; Muhammed & Mathew, Citation2022; Petersen & Gerken, Citation2021; Walter, Brooks, Saucier, & Suresh, Citation2020).
Although some Tweets appeared to be “evidence-informed” (i.e., a researcher commenting on their area of expertise), the source of the statement was unclear in the majority of Tweets. This raises further questions about the distinction between content that is easily recognizable as “misinformation” by the general public and researchers or experts (e.g., Tweets claiming COVID-19 vaccines have a high mortality rate) and “poor quality information,” where the level of evidence supporting a Tweet is not recognizable even to those trained to assess it. The inability of Twitter users to clearly communicate the quality of evidence supporting their content may be a constraint of the “microblogging” nature of Twitter, as well as authors not wanting to alienate the general public by citing study design and/or levels of evidence (e.g., NHMRC levels of evidence or the GRADE framework) (Balshem et al., Citation2011; National Health and Medical Research Council, Citation2009). A preliminary review of guidance available for researchers or health professionals using Twitter (most of which was not peer-reviewed) did not specify how users can best signal that Tweets are evidence-based within the limited character count available (Centers for Disease Control and Prevention, Citation2021; John Hopkins Medicine, Citation2021; Mollett, Moran, & Dunleavy, Citation2011; Schnitzler, Davies, Ross, & Harris, Citation2016; Schroeder & Bauman, Citation2019; Taylor & Francis Group, Citation2021).
How Do I Say It?
Variables in thematic categories relating to “how do I say it,” such as Media Features and External Networks had more of an impact on engagement. Tweets containing media (such as images, gifs, videos or polls) and hyperlinks had higher rates of engagement. Despite a majority of Tweets in our sample using hashtags (90.0%), the presence of hashtags were correlated with fewer Favourites, and mentioning other user accounts (present in 56.3% of Tweets) was not significantly associated with engagement outcomes.
Our finding that Tweets enriched with multimedia have higher engagement is consistent with existing health and mental health-focused Twitter studies (Chapman & Freeman, Citation2015; Ju, Jia, & Cheng, Citation2023; Schlichthorst et al., Citation2018; Veale et al., Citation2015; Wadhwa, Latimer, Chatterjee, McCarty, & Fitzgerald, Citation2017), and best-practice guides outside of peer-reviewed literature for researchers (Mollett, Moran, & Dunleavy, Citation2011; Taylor & Francis Group, Citation2021), health professionals (John Hopkins Medicine, Citation2021; Schroeder & Bauman, Citation2019) and businesses (Hootsuite Inc, Citation2021; Twitter, Citation2021). For example, a recent analysis of 1,032 Tweets from the American Journal of Neuroradiology found that Tweets accompanied by an image were significantly more likely to have an engagement score in the top 25th percentile (OR = 28.75 [17.654–46.816], p < .001) (Wadhwa, Latimer, Chatterjee, McCarty, & Fitzgerald, Citation2017). In addition, using multimedia also extends the space available to communicate research findings; images and hyperlinks often contain additional written or visual information that appears beneath the 280 characters of the Tweet to form a more complete message. However, the finding that hashtags were associated with lower levels of engagement contrasts with other health-focused Twitter studies (Elkbuli, Santarone, Boneva, Hai, & McKenney, Citation2021; Logghe, Pellino, Brady, McCoubrey, & Atallah, Citation2016; Moorley & Chinn, Citation2014; Petersen & Gerken, Citation2021; Wadhwa, Latimer, Chatterjee, McCarty, & Fitzgerald, Citation2017) and non-peer reviewed guidelines (Hootsuite Inc, Citation2021; John Hopkins Medicine, Citation2021; Mollett, Moran, & Dunleavy, Citation2011; Schroeder & Bauman, Citation2019; Taylor & Francis Group, Citation2021; Twitter, Citation2021) which predominantly encourage the use of hashtags and mentioning accounts to increase user engagement via health events (e.g., conferences or awareness campaigns) (Elkbuli, Santarone, Boneva, Hai, & McKenney, Citation2021; Schlichthorst et al., Citation2018), specific health communities (e.g., clinician or patient groups) (Logghe, Pellino, Brady, McCoubrey, & Atallah, Citation2016; Moorley & Chinn, Citation2014), or pertinent public health conversations (e.g., COVID-19) (Petersen & Gerken, Citation2021). Notably, the three top scoring Tweets from our sample (total Retweet, Favourite, Comment count > 100) all contained a hyperlink and an image, yet two of the Tweets contained 2–3 hashtags each. Considering this, as well as the context of this finding in the broader literature, a more purposeful use of hashtags may be appropriate.
To our knowledge, this is the first study to undertake an extensive analysis of which content features of mental health research Tweets are associated with user engagement. From 300 mental health research Tweets of two nationally representative Australian mental health research organizations, preliminary guidelines for mental health researchers have been developed that may maximize engagement while also retaining research integrity ().
Table 4. Preliminary guidelines for mental health researchers using twitter
To guide researchers in delineating their Tweets as evidence-based, we also contribute preliminary guidelines that advocate for researchers to consistently answer users’ questions of “what” (is the information), “where” (has it come from) and “who” (is it for) with combinations of text, images and hyperlinks to the source for more information. To facilitate the uptake and implementation of these recommendations, we created a more extensive guidelines resource that features examples of the guidelines in practice using “mock Tweets” (). These mock Tweets are inspired by Tweets from our dataset, and display common examples of how real Tweets did or did not utilize the recommendations made in the guidelines. In addition, we created examples of how the same Tweet might look after all the recommendations in the guidelines had been implemented. The guidelines are freely available via the Matilda Centre for Research in Mental Health and Substance Use website (https://bit.ly/twitter-guidelines-mh-research).
Table 5. An example of the guidelines in practice using mock tweets
Limitations
We acknowledge the limitations of this study, most notably that the 300 Tweets were sampled from two organizations within the broader field of mental health research. Although attempts were made to control for organization-specific factors during the selection process and analysis, organizational factors that might influence engagement are diverse (e.g., organizational size, resources, and offline community engagement). Although the organizations selected had a broad portfolio of research, their focus on specific mental health areas (e.g., suicide) or population groups (e.g., youth) resulted in other prevalent mental disorders such as anxiety, ADHD, and substance use being under-represented in the sample of Tweets. Further research is needed to determine how these factors impact engagement with Tweets.
In addition, whether mental health research Tweets perform better or worse than Tweets not related to research authored by the same organizations was beyond scope of this paper. Similarly, while the Tweet codebook was extensive, the content of media accompanying Tweets such as images and hyperlinks, and whether the sentiments in Comments and Retweets were supportive or critical of the author’s messaging, were also beyond scope. Further research is needed to determine the sentiments expressed by users who engage with mental health research Tweets.
Whether applying our preliminary guidelines for “what do I say” and “how do I say” is associated with increased engagement or ability to recognize evidence-based content also requires further research. The authors recommend a comparator-control design using similar “before and after” mock Tweets provided in the guidelines. Exploring the impact of the guidelines in practice on Twitter, as well as their translational value to other social media platforms (e.g., Facebook, Instagram or TikTok) is an area for future investigation.
Finally, while social media platforms have rapidly evolved over the past few decades and may undergo further change, the use of microblogging platforms as a tool for disseminating research will likely continue to grow alongside an ever-expanding user base. The content-focused nature of our proposed guidelines (“what” is the information, “where” has it come from, “who” is it for) have potential to be used across this changing social media landscape, serving as valuable principles for researchers looking to disseminate findings to a more general audience while also retaining research integrity.
Conclusion
Our findings produced preliminary guidelines and an accompanying resource for mental health researchers using Twitter to disseminate findings. Researchers may be able to maximize engagement by highlighting the population groups that the research applies to (e.g., youth or emergency workers) and enriching Tweets with multimedia content (e.g., images or hyperlinks). In addition, care should be taken to ensure users can infer which messages are evidence-based, and over-use of hashtags should be avoided.
Acknowledgments
KP received salary support from an Australian Rotary Health Royce Abbey Postdoctoral Fellowship. The authors would like to thank Professor Maree Teesson for her ongoing encouragement and unwavering support for new ideas.
Disclosure statement
No potential conflict of interest was reported by the author(s).
Data availability statement
The data underlying this article will be shared on reasonable request to the corresponding author.
Additional information
Funding
References
- Adams, J., & Loach, T. (2015). Altmetric mentions and the communication of medical research. Digital Science. Retrieved September 9, 2023, from https://figshare.com/articles/report/Altmetric_mentions_and_the_communication_of_medical_research/1314902
- Australian Institute of Health and Welfare. (2021). Australian Burden of disease study: Impact and causes of illness and death in Australia 2018. AIHW. Retrieved 9 September 2023 from https://www.aihw.gov.au/reports/burden-of-disease/abds-impact-and-causes-of-illness-and-death-in-aus/summary
- Auxier, B., & Anderson, M. (2021). Social Media Use in 2021. Pew Research Center. Retrieved September 30, 2022, from https://www.pewresearch.org/internet/2021/04/07/social-media-use-in-2021/
- Azam, F., Agro, M., Sami, M., Abro, M. H., & Dewani, A. (2021). Identifying depression among twitter users using sentiment analysis. 2021 International Conference on Artificial Intelligence (ICAI) Islamabad, Pakistan, 44–49. 10.1109/ICAI52203.2021.9445271
- Balshem, H., Helfand, M., Schünemann, H. J., Oxman, A. D., Kunz, R. … Guyatt, G. H. (2011). GRADE guidelines: 3. Rating the quality of evidence. Journal of Clinical Epidemiology, 64(4), 401–406. doi:10.1016/j.jclinepi.2010.07.015
- Berry, N., Lobban, F., Belousov, M., Emsley, R., Nenadic, G., & Bucci, S. (2017). #whywetweetmh: Understanding why people use twitter to discuss mental health problems. Journal of Medical Internet Research, 19(4), e107. doi:10.2196/jmir.6173
- Binder, M. (2023a). Elon Musk’s Creator Monetization Program Fails to Convince Many to Pay for X Premium. Mashable. Retrieved September 6, 2023, from https://mashable.com/article/x-premium-twitter-blue-subscriptions-creator-monetization-program
- Binder, M. (2023b). Twitter/X is losing daily active users. CEO Linda Yaccarino confirmed it. Mashable. Retrieved October 18, 2023, from https://mashable.com/article/twitter-x-daily-active-users-drop-under-elon-musk
- Bin Naeem, S., Bhatti, R., & Khan, A. (2020). An exploration of how fake news is taking over social media and putting public health at risk. Health Information & Libraries Journal, 38(2), 143–149. doi:10.1111/hir.12320
- Carlson, J., Harris, K., & Blekhman, R. (2020). Quantifying and contextualizing the impact of bioRxiv preprints through automated social media audience segmentation. Plos Biology, 18(9), e3000860. doi:10.1371/journal.pbio.3000860
- Centers for Disease Control and Prevention. (2021). Twitter Guidelines & Best Practices. Retrieved September 9, 2023, from https://www.cdc.gov/socialmedia/tools/guidelines/twitter.html
- Centers for Disease Control and Prevention. (2022). Health Topics – Suicide Prevention. U.S. Department of Health & Human Services. Retrieved September 12, 2023, from https://www.cdc.gov/policy/polaris/healthtopics/suicide/index.html
- Chambers, D. A., Pintello, D., & Juliano-Bult, D. (2020). Capacity-building and training opportunities for implementation science in mental health. Psychiatry Research, 283, 112511. doi:10.1016/j.psychres.2019.112511
- Chapman, S., & Freeman, B. (2015). Who has Australia’s most-followed Twitter accounts in health and medicine? Public Health Research & Practice, 25(3), e2531534. doi:10.17061/phrp2531534
- Chou, W., Gaysynsky, A., & Cappella, J. (2020). Where we go from here: Health misinformation on social media. American Journal of Public Health, 110(S3), S273–S275. doi:10.2105/AJPH.2020.305905
- Clavier, T., Besnier, E., Blet, A., Boisson, M., Sigaut, S. … Fischer, M. O. (2020). A communication strategy based on Twitter improves article citation rate and impact factor of medical journals. Anaesth Crit Care Pain Med, 39(6), 745–746. doi:10.1016/j.accpm.2020.11.001
- Clayton, A. (2023). Threads app usage plummets despite initial promise as refuge from Twitter. The Guardian. Retrieved 19 October 2023 from https://www.theguardian.com/technology/2023/aug/14/threads-app-slump-daily-active-users-twitter-competition
- Colombo, G. B., Burnap, P., Hodorog, A., & Scourfield, J. (2016). Analysing the connectivity and communication of suicidal users on twitter. Computer Communications, 73(Pt B), 291–300. doi:10.1016/j.comcom.2015.07.018
- Coppersmith, G., Harman, C., & Dredze, M. (2014). Measuring post traumatic stress disorder in twitter. Proceedings of the 8th International Conference on Weblogs and Social Media, ICWSM 2014, Michigan, United States, 579–582.
- Cote, D., Williams, M., Zaheer, R., Niederkrotenthaler, T., Schaffer, A., & Sinyor, M. (2021). Suicide-related Twitter Content in Response to a National Mental Health Awareness Campaign and the Association between the Campaign and suicide rates in Ontario. Canadian Journal of Psychiatry Revue Canadienne de Psychiatrie, 66(5), 460–467. doi:10.1177/0706743720982428
- Darnell, D. D., Melvin, C. N., Chi, A., Lyon, J., Lewis, A. R., & C, C. (2017). A content analysis of dissemination and implementation science resource initiatives: What types of resources do they offer to advance the field? Implementation science, 12(1), 137. doi:10.1186/s13012-017-0673-x
- Elkbuli, A., Santarone, K., Boneva, D., Hai, S., & McKenney, M. (2021). Analysis of the American college of surgeons clinical congress twitter hashtags and its impact on online engagement and attendance rates: The era of health care social media. The American Surgeon, 87(2), 235–241. doi:10.1177/0003134820950289
- Eysenbach, G. (2011). Can tweets predict citations? Metrics of social impact based on Twitter and correlation with traditional metrics of scientific impact [editorial]. Journal of Medical Internet Research, 13(4), e123. doi:10.2196/jmir.2012
- Hayon, S., Tripathi, H., Stormont, I. M., Dunne, M. M., Naslund, M. J., & Siddiqui, M. M. (2019). Twitter mentions and academic citations in the urologic literature. Urology, 123, 28–33. doi:10.1016/j.urology.2018.08.041
- Hootsuite Inc. (2021). Twitter Marketing: The Complete Guide for Business. Retrieved September 9, 2023, from https://blog.hootsuite.com/twitter-marketing/
- Jeri-Yabar, A., Sanchez-Carbonel, A., Tito, K., Ramirez-DelCastillo, J., Torres-Alcantara, A., Denegri, D., & Carreazo, Y. (2019). Association between social media use (twitter, Instagram, Facebook) and depressive symptoms: Are twitter users at higher risk? International Journal of Social Psychiatry, 65(1), 14–19. doi:10.1177/0020764018814270
- John Hopkins Medicine. (2021). Twitter Best Practices & Tips for Physicians. Retrieved 9 September 9, 2023, from https://www.hopkinsmedicine.org/fac_development/_documents/course-offerings/Twitter%20Best%20Practices.PDF
- Jorm, A. F., & Malhi, G. S. (2013). Evidence-based mental health services reform in Australia: Where to next? The Australian and New Zealand Journal of Psychiatry, 47(8), 693–695. doi:10.1177/0004867413497625
- Ju, R., Jia, M., & Cheng, J. (2023). Promoting mental health on social media: A content analysis of organizational tweets. Health Communication, 38(8), 1540–1549. doi:10.1080/10410236.2021.2018834
- Khasawneh, A., Chalil Madathil, K., Dixon, E., Wisniewski, P., Zinzow, H., & Roth, R. (2020). Examining the Self-Harm and suicide contagion effects of the blue whale challenge on YouTube and Twitter: Qualitative study. JMIR Ment Health, 7(6), e15973. doi:10.2196/15973
- Kim, S., Kageura, K., McHugh, J., Nepal, S., Paris, C. , and Wan, S. (2017). Twitter Content Eliciting User Engagement: A Case Study on Australian Organisations. Proceedings of the 26th International Conference on World Wide Web Companion, Perth, Australia, 807–808. doi:10.1145/3041021.3054237
- Kouzy, R., Abi Jaoude, J., Kraitem, A., El Alam, M. B., Karam, B. … Baddour, K. (2020). Coronavirus goes viral: Quantifying the COVID-19 misinformation epidemic on Twitter. Cureus, 12(3), e7255. doi:10.7759/cureus.7255
- Ladeiras-Lopes, R., Clarke, S., Vidal-Perez, R., Alexander, M., & Luscher, T. F. (2020). Twitter promotion predicts citation rates of cardiovascular articles: A preliminary analysis from the ESC journals randomized study. European Heart Journal, 41(34), 3222–3225. doi:10.1093/eurheartj/ehaa211
- Logghe, H. J., Pellino, G., Brady, R., McCoubrey, A. S., & Atallah, S. (2016). How twitter has connected the colorectal community. Techniques in Coloproctology, 20(12), 805–809. doi:10.1007/s10151-016-1542-3
- Mastodon. (2023). Mastodon Analytics. Retrieved October 18, 2023, from https://mastodon-analytics.com/
- McClellan, C., Ali, M. M., Mutter, R., Kroutil, L., & Landwehr, J. (2017). Using social media to monitor mental health discussions − evidence from Twitter. Journal of the American Medical Informatics Association, 24(3), 496–502. doi:10.1093/jamia/ocw133
- Mollett, A., Moran, D., & Dunleavy, P. (2011). Using Twitter in University Research, Teaching and Impact Activities: A Guide for Academics and Researchers. LSE Public Policy Group (PPG). Retrieved September 9, 2023, from https://apo.org.au/sites/default/files/resource-files/2011-09/apo-nid35791.pdf
- Moorley, C. R., & Chinn, T. (2014). Nursing and twitter: Creating an online community using hashtags. Collegian, 21(2), 103–109. doi:10.1016/j.colegn.2014.03.003
- Morris, Z. S., Wooding, S., & Grant, J. (2011). The answer is 17 years, what is the question: Understanding time lags in translational research. Journal of the Royal Society of Medicine, 104(12), 510–520. doi:10.1258/jrsm.2011.110180
- Muhammed, T. S., & Mathew, S. K. (2022). The disaster of misinformation: A review of research in social media. International Journal of Data Science and Analytics, 13(4), 271–285. doi:https://doi.org/10.1007/s41060-022-00311-6
- Nastasi, A., Bryant, T., Canner, J. K., Dredze, M., Camp, M. S., & Nagarajan, N. (2018). Breast cancer screening and social media: A content analysis of evidence use and guideline opinions on twitter. Journal of Cancer Education: The Official Journal of the American Association for Cancer Education, 33(3), 695–702. doi:10.1007/s13187-017-1168-9
- National Health and Medical Research Council. (2009). NHMRC Levels of Evidence and Grades for Recommendations for Developers of Guidelines. National Health and Medical Research Council (NHMRC). Retrieved September 9, from https://www.nhmrc.gov.au/sites/default/files/images/NHMRC%20Levels%20and%20Grades%20(2009).pdf
- O’Dea, B., Wan, S., Batterham, P. J., Calear, A. L., Paris, C., & Christensen, H. (2015). Detecting suicidality on twitter. Internet Interventions, 2(2), 183–188. doi:10.1016/j.invent.2015.03.005
- Park, H., Reber, B. H., & Chon, M. G. (2016). Tweeting as health communication: Health organizations’ use of twitter for health promotion and public engagement. Journal of Health Communication, 21(2), 188–198. doi:10.1080/10810730.2015.1058435
- Petersen, K., & Gerken, J. M. (2021). #covid-19: An exploratory investigation of hashtag usage on Twitter. Health Policy, 125(4), 541–547. doi:10.1016/j.healthpol.2021.01.001
- Pew Research Centre. (2019). Sizing Up Twitter Users. Pew Research Centre. Retrieved September 9, 2023, from https://www.pewresearch.org/internet/wp-content/uploads/sites/9/2019/04/twitter_opinions_4_18_final_clean.pdf
- Proctor, E., Landsverk, J., Aarons, G., Chambers, D., Glisson, C., & Mittman, B. (2009). Implementation research in mental health services: An emerging science with conceptual, methodological, and training challenges. Administration and Policy in Mental Health and Mental Health Services Research, 36(1), 24–34. doi:10.1007/s10488-008-0197-4
- Rabani, S. T., Khan, Q. R., & Khanday, A. M. U. D. (2020). Detection of suicidal ideation on twitter using machine learning & ensemble approaches. Baghdad Science Journal, 17(4), 1328–1339. doi:10.21123/bsj.2020.17.4.1328
- R Core Team. (2021). R: A language and environment for statistical computing. R Foundation for Statistical Computing, Vienna, Austria. https://www.R-project.org/
- Rehm, J., & Shield, K. D. (2019). Global burden of disease and the impact of mental and addictive disorders. Current Psychiatry Reports, 21(2), 10. doi:10.1007/s11920-019-0997-0
- Scannell, D., Desens, L., Guadagno, M., Tra, Y., Acker, E. … Fulk, M. (2021). COVID-19 vaccine discourse on twitter: A content analysis of persuasion techniques, sentiment and Mis/Disinformation. Journal of Health Communication, 26(7), 443–459. doi:10.1080/10810730.2021.1955050
- Schlichthorst, M., King, K., Turnure, J., Sukunesan, S., Phelps, A., & Pirkis, J. (2018). Influencing the conversation about masculinity and suicide: Evaluation of the man up multimedia campaign using twitter data. Journal of Medical Internet Research Mental Health, 5(1), e14. doi:https://doi.org/10.2196/mental.9120
- Schnitzler, K., Davies, N., Ross, F., & Harris, R. (2016). Using Twitter™ to drive research impact: A discussion of strategies, opportunities and challenges. International Journal of Nursing Studies, 59, 15–26. doi:10.1016/j.ijnurstu.2016.02.004
- Schroeder, S., & Bauman, S. (2019). Dissemination of Rural Health Research: A Toolkit. Center for Rural Health, University of North Dakota. Retrieved September 9, 2023 from https://www.ruralhealthresearch.org/dissemination-toolkit/modes/twitter
- Sinnenberg, L., Buttenheim, A. M., Padrez, K., Mancheno, C., Ungar, L., & Merchant, R. M. (2017). Twitter as a tool for health research: A systematic review. American Journal of Public Health, 107(1), e1–e8. doi:10.2105/AJPH.2016.303512
- Sinyor, M., Williams, M., Zaheer, R., Loureiro, R., Pirkis, J. … Niederkrotenthaler, T. (2021). The relationship between suicide-related twitter events and suicides in Ontario from 2015 to 2016. The Crisis, 42(1), 40–47. doi:10.1027/0227-5910/a000684
- So, J., Prestin, A., Lee, L., Wang, Y., Yen, J., & Chou, W.-Y. S. (2016). What do people like to “share” about obesity? A content analysis of frequent retweets about obesity on twitter. Health Communication, 31(2), 193–206. doi:10.1080/10410236.2014.940675
- Stupinski, A. M., Alshaabi, T., Arnold, M. V., Adams, J. L., Minot, J. R., Price, M., Dodds, P. S., & Danforth, C. (2022). Quantifying Changes in the Language Used Around Mental Health on Twitter Over 10 Years: Observational Study. JMIR Mental Health, 30(9(3)), e33685. doi:10.2196/33685
- Suarez-Lledo, V., & Alvarez-Galvez, J. (2021). Prevalence of health misinformation on social media: Systematic review [review]. Journal of Medical Internet Research, 23(1), e17187. doi:10.2196/17187
- Susarla, A. (2022). Twitter lifted its ban on COVID misinformation – research shows this is a grave risk to public health. The Conversation. Retrieved September 7, 2023. https://theconversation.com/twitter-lifted-its-ban-on-covid-misinformation-research-shows-this-is-a-grave-risk-to-public-health-195695
- Syed, M., & Nelson, S. C. (2015). Guidelines for establishing reliability when coding narrative data. Emerging Adulthood, 3(6), 375–387. doi:10.1177/2167696815587648
- Taylor & Francis Group. (2021). A Guide to Twitter for Researchers. Retrieved from August 13, 2023. https://authorservices.taylorandfrancis.com/research-impact/a-guide-to-twitter-for-researchers/
- The Lancet Digital, H. (2023). Twitter, public health, and misinformation. Lancet Digital Health, 5(6), e328. doi:10.1016/S2589-7500(23)00096-1
- Twitter, (2021). Organic Best Practices: Tips for Growing and Engaging Your Audience on Twitter. Retrieved from https://business.twitter.com/en/basics/organic-best-practices.html
- Upadhyaya, M., & Kozman, M. (2022). The blue whale challenge, social media, self-harm, and suicide contagion. The Primary Care Companion to CNS Disorders, 24(5). doi:10.4088/PCC.22cr03314
- Veale, H. J., Sacks-Davis, R., Weaver, E. R., Pedrana, A. E., Stoové, M. A., & Hellard, M. E. (2015). The use of social networking platforms for sexual health promotion: Identifying key strategies for successful user engagement. BMC Public Health, 15(1), 85–85. doi:10.1186/s12889-015-1396-z
- Venables, W.N., & Ripley, B.D. (2002). Modern Applied Statistics with S. Springer, New York, 271–300. doi:10.1007/978-0-387-21706-2
- Vidal Valero, M. (2023). Thousands of scientists are cutting back on twitter, seeding angst and uncertainty. Retrieved from https://www.nature.com/articles/d41586-023-02554-0#ref-CR1
- Wadhwa, V., Latimer, E., Chatterjee, K., McCarty, J., & Fitzgerald, R. T. (2017). Maximizing the tweet engagement rate in academia: Analysis of the AJNR twitter feed. AJNR American Journal of Neuroradiology, 38(10), 1866–1868. doi:10.3174/ajnr.A5283
- Wainberg, M. L., Scorza, P., Shultz, J. M., Helpman, L., Mootz, J. J. … Arbuckle, M. R. (2017). Challenges and opportunities in global mental health: A research-to-practice perspective. Current Psychiatry Reports, 19(5), 28. doi:10.1007/s11920-017-0780-z
- Walter, N., Brooks, J. J., Saucier, C., & Suresh, S. (2020). Evaluating the impact of attempts to correct health misinformation on social media: A meta-analysis. Health Communication, 36(13), 1–9. doi:10.1080/10410236.2020.1794553
- Wang, D., & Lu, J. (2022). How news agencies’ twitter posts on COVID-19 vaccines attract audiences’ twitter engagement: A content analysis. International Journal of Environmental Research and Public Health, 19(5), 2716. https://www.mdpi.com/1660-4601/19/5/2716
- Wiltsey Stirman, S. G., Gutner, C. A., Langdon, K., & Graham, J. R. (2016). Bridging the gap between research and practice in mental health service settings: An overview of developments in implementation theory and research. Behavior Therapy, 47(6), 920–936. doi:10.1016/j.beth.2015.12.001
- Yellow. (2020). Yellow Social Media Report 2020. Yellow. Retrieved 9 September 2023. https://2k5zke3drtv7fuwec1mzuxgv-wpengine.netdna-ssl.com/wp-content/uploads/2020/07/Yellow_Social_Media_Report_2020_Consumer.pdf