
 ?Mathematical formulae have been encoded as MathML and are displayed in this HTML version using MathJax in order to improve their display. Uncheck the box to turn MathJax off. This feature requires Javascript. Click on a formula to zoom.
ABSTRACT
Although recent findings suggest that gender-discriminatory practices unduly increased female mortality rates during infancy and childhood in historical Europe, especially in Southern and Eastern Europe, there is little research on the conditions that triggered these practices. Relying on child sex ratios (the number of boys per hundred girls in a particular age group) as a cumulative measure of sex-differential mortality around birth, infancy, and childhood, this article explores whether the notion of patriarchy – i.e., varying degrees of sex- and age-related social inequalities – helps to explain the variation in such discriminatory practices. For our analysis, we rely on the NAPP/Mosaic census database, which provides detailed information on more than 300 populations in historical Europe and western Siberia. Using a range of harmonised variables from the combined Mosaic and NAPP data, our results show that the Patriarchy Index, a recently developed composite measure of gendered and generational power relations in marital and family dynamics, is positively associated with child sex ratios across Europe. More specifically, we find that patrilocal norms, a low female age at marriage, and a direct measure of son preference – namely, the prevalence of having a boy as the last child – are strongly correlated with higher child sex ratios.
1. Introduction
While the concept of familial patriarchy plays a fundamental role in the literature on the ‘missing girls’ phenomenon among South and East Asian societies (Dong, Citation2016; Pande & Astone, Citation2007; Li et al., Citation2007; Attane & Guilmoto, Citation2007; Guilmoto, Citation2009, Citation2012; Das Gupta, Citation2010; Das Gupta et al., Citation2003; Arokiasamy & Goli, Citation2012; Miller, Citation2001; Greenhalgh, Citation2013; Quanbao et al., Citation2011; Lee & Wang, Citation1999; Malhotra et al., Citation1995; also Banister, Citation2004; Grogan, Citation2018; Derosas & Tsuya, Citation2010), the potential impact of patriarchal cultural formations on the neglect of female children in historical Europe has so far been little explored, either theoretically or empirically. This research gap is at odds with the significant variation in the manifestations of the patriarchal bias across European societies (Gruber & Szołtysek, Citation2016), and with recent discoveries of gender-discriminatory practices in infancy and childhood in Southern and Eastern Europe (e.g., Beltrán Tapia, Citation2019), which raise the question of whether the geographies of female neglect may not be accompanied by gender (and generational) asymmetries.
Most historical societies of Europe exhibit some degree of gender inequality, and in virtually all societies in the past, women’s freedom to choose was more limited than men’s (Gruber & Szołtysek, Citation2016; Manfredini et al., Citation2016; cf., Smuts, Citation1995). However, while women faced only mild or moderate constraints on their agency in some areas, in other societies, they were largely subordinate to males both in the family and in the public life of the community (Therborn, Citation2004; Poska, Citation2013; Kok, Citation2017; Carmichael & Rijpma, Citation2017; Dilli et al., Citation2019; also Ehmer, Citation2021, pp. 149–153). This gender inequality has implications not only for the level of support in old age that parents can expect from their sons and daughters, but ultimately also for the aspirations of couples regarding the sex of their children (Basu & Das Gupta, Citation2001; Miller, Citation2001; Kok, Citation2017). While in some regions of Europe, a preference for a gender-balanced family appears to have been the norm (Knodel & De Vos, Citation1980; Sandström & Vikström, Citation2015), in some other areas, an entrenched preference for boys has been documented (Kolk, Citation2011; Manfredini et al., Citation2016; Hanlon, Citation2016; Beltrán Tapia & Marco-Gracia, Citation2021; Beltrán Tapia & Raftakis, Citation2021; also Williamson, Citation1976; Arnold, Citation1997; cf., Derosas & Tsuya, Citation2010).
While imbalances in child sex ratios are known to result from a wide range of factors, little research has been done on the conditions that triggered such variations in historical Europe (cf., Bechtold, Citation2006; Beltrán Tapia, Citation2019; Beltrán Tapia & Gallego-Martínez, Citation2020; Szołtysek et al., Citation2022).Footnote1 This paper examines the hypothesis that levels of post-natal discrimination against female offspring (gauged by examining the sex ratios of children under age five; see, Basu & Das Gupta, Citation2001) were higher in societies with stronger patriarchal norms, as reflected in unequal gender relations, and in the senior generations having greater power within domestic groups. We contribute to the re-emerging debate on the scope and the determinants of unbalanced sex ratios in the European past by being, to the best of our knowledge, the first to empirically test the relationship between patriarchy and male-skewed sex ratios using comprehensive, spatially sensitive family-demographic evidence at a large European scale. Using harmonised samples of census microdata from the NAPP and Mosaic databases, we compute historical child sex ratios (henceforth, CSRs), along with a large number of other family and demographic indicators across 316 regions of historic Europe and western Asia stretching from Andalusia in the west to Siberia in the east, and from Tromsø in the north to Albania in the south-east, between 1700 and 1926.
This dataset covers a large share of the variation in historical family and household formation patterns across European populations, including multiple societies that were characterised by the rigid forms of patriarchal organisation that are commonly associated with the ‘missing girls’ phenomenon (e.g., Worobec, Citation1995; Halpern et al., Citation1996; Szołtysek, Citation2015b; also Derosas, Citation2012; Manfredini et al., Citation2016; Wolf, Citation2005), and thus introduces much more variation in how children were potentially valued based on their gender than was previously believed to have existed in historical Europe (Derosas & Tsuya, Citation2010; Lynch, Citation2011; also Mason, Citation1997; Kok, Citation2017). A recently developed multidimensional Patriarchy Index (henceforth, PI; Gruber & Szołtysek, Citation2016; Szołtysek et al., Citation2017) is applied to these data to measure gender and generational asymmetries at the domestic level across time and space, and to identify the potential channels through which the observed CSRs might have been affected. Thus, we are able to shift the discussion away from a focus on a limited set of economic and/or geographic variables that may affect CSRs (Bechtold, Citation2006; Beltrán Tapia, Citation2019; Beltrán Tapia & Gallego-Martínez, Citation2020), and towards an exploration of the varying degrees of sex- and age-related social inequalities across different family settings that may have contributed substantially to the variation in the preference for male children, while controlling for a host of proximate or confounding factors.
Our results show that the Patriarchy Index is positively associated with CSRs across historical Europe. Crucially, this positive link persists even after we explicitly take into account other dimensions that may also help to explain unbalanced sex ratios that are not related to gender-discriminatory practices (such as random noise; faulty enumeration; or other economic, environmental, or demographic characteristics of the populations under study). Moreover, this link generally holds regardless of the age group examined (0–1, 0–4, 1–5, and 5–9), and it is robust to different model specifications, including controlling for spatial autocorrelation. The second major contribution of this article is to identify which dimensions of the Patriarchy Index are more important for explaining the observed variation in child sex ratios. Specifically, we find that patrilocal norms, low female age at marriage, and a direct measure of son preference (the prevalence of having a boy as the last child) are strongly correlated with higher sex ratios. Taken together, our results provide evidence of a link between patriarchal family organisation and gender discrimination during infancy and childhood that is both statistically and economically significant.
The remainder of the paper is structured as follows. We begin by describing the theoretical associations between familial patriarchy and elevated child sex ratios. We then present our data and methods, including our model specification. In the main empirical section, we run multivariate regression models in order to evaluate the relationship between our measure of gender discrimination (CSRs) and our focal explanatory variable (the PI), while controlling for other relevant covariates. We also test whether our baseline results hold up when different model specifications are applied. In the next step, we seek to identify the particular features that contributed the most to the increases in sex ratios across our samples by disaggregating the PI into its four subindexes and ten components, and by running corresponding models. In the final section, we discuss our results, and conclude with some suggestions for further research.
2. Theoretical Background
2.1. The patriarchy-CSRs nexus
Following a seminal research strand, we define family patriarchy as encompassing the stratification of social attainment by sex, and – at the same time – the domination of men over each other based on the seniority principle, that is as including both gender and generational relations (Gruber & Szołtysek, Citation2016; Therborn, Citation2004, pp. 13–14; Halpern et al., Citation1996; Wiesner-Hanks, Citation2018; also Wolf, Citation2005; cf., Walby, Citation1990). These two forms of expropriation are dialectically related, and often reinforce each other in fostering a complex hierarchy of authority patterns based on both gender and age which – until the advent of the modern era – have been largely enacted through family households (domestic groups) which constitute the essential building blocks of historical economies and societies (Sen, Citation1983; Szołtysek, Citation2015a; Szołtysek et al., Citation2017; cf., Guilmoto, Citation2009; Arokiasamy & Goli, Citation2012).
Among the features of patriarchal family systems, patrilineal rules of kinship and descent and patrilocal residential norms appear to contribute the most to fostering hierarchical relationships based on male lineage, son preference, and other gender inequitable practices (e.g., Cain, Citation1993; Miller, Citation2001; Den Boer & Hudson, Citation2017; Ebenstein, Citation2014; Kandiyoti, Citation1988; Singh et al., Citation2021; Solati, Citation2017). Whereas in bilateral kinship systems, the value of children to their parents differs little depending on their gender, in patrilineal kinship societies raising sons is a much more attractive option both socially and economically, because whereas sons are expected to support their parents both before and after marriage, daughters are expected to live away from their natal families, and to have limited interactions with them after marriage (e.g., Attane & Guilmoto, Citation2007).Footnote2 This preference for sons is particularly pronounced in strong lineage societies, most of which trace descent through the male line only, and are therefore highly committed to the biological replication of male heirs (Szołtysek, Citation2015b). The dowry system may further strengthens negative attitudes towards girls, since enabling their marriages is a drain on household resources (Bhalotra et al., Citation2020; Jayachandran, Citation2015; cf., Kaplan, Citation1985). Therefore, in rigidly patrilineal and patrilocal settings, the survival biological advantage of girls is frequently offset by the perceived economic and emotional utility of boys in conjunction with the perceived inferior status of girls, which can result in higher mortality among girls in infancy and/or during early childhood (Das Gupta, Citation1987, Citation2010, p. 125; Dyson & Moore, Citation1983; Lee & Wang, Citation1999; also Rosenzweig & Schultz, Citation1982; Den Boer & Hudson, Citation2017; Lee et al., Citation1994). The marginalised position of women, and the privileges accorded to male children for economic, social, and cultural reasons that such a system entails, can influence the extent to which couples are willing to take certain steps – including female infanticide or post-natal mortal neglect – to prevent daughters from flourishing in the family, and in the broader society (Banister, Citation2004; Guilmoto, Citation2012, p. 37). In patriarchal contexts, less extreme forms of gender discrimination can also arise, such as neglect resulting from the unequal allocation of food, care, and other resources; and of the workload (Baten & Murray, Citation2000; Derosas & Tsuya, Citation2010; Guilmoto, Citation2009; Horrell & Oxley, Citation2016; Marco-Gracia & Beltrán Tapia, Citation2021; McNay et al., Citation2005).Footnote3
Patriarchal rigidities may also flourish through domestic group structures. Large and complex (often called ‘joint’) households headed by a senior male ‘patriarch’ – who is usually also the net user of household resources (like in Russian agnatic households of the repartitioned communes or Italian sharecropping societies; e.g., Verdon, Citation1998; Szołtysek & Gruber, Citation2014; also Mitterauer, Citation1981) – might incorporate some of the most important features that lead to gender differentials in mortality, such as the assumption that male labour is essential to sustaining the farm, the tendency to place a higher economic value on men, and the rigid enforcement of social roles within the household. While only a few studies have directly examined the effects of household structure on gender preferences and outcomes (Manfredini et al., Citation2017), it is likely that the preference for sons is more common in traditional extended/complex households, where the roles and opportunities for women are more constrained than they are in nuclear households (cf., Alter et al., Citation2004). Oftentimes, these types of residential arrangements have been associated with a particular type of multi-generational solidarity, whereby parents expect to receive constant economic, emotional, and other kinds of support from the families of their married sons (Skinner, Citation1997; cf., Guilmoto, Citation2009; Lee et al., Citation2004, pp. 437–38), thus potentially leading to an allocation of resources and care within the family that was advantageous for boys and detrimental for girls (Manfredini et al., Citation2016; also Arokiasamy & Goli, Citation2012; Singh et al., Citation2021).
3. Data and Methods
3.1. Data description
For our analyses, we use the largest existing collection of European historical census microdata which have been compiled by the North Atlantic Population Project (NAPP; distributed by IPUMS-International; Ruggles et al., Citation2011) and the Mosaic project (Szołtysek & Gruber, Citation2016). The major facets of this combined dataset have already been discussed in detail on several occasions before (Szołtysek et al., Citation2017; Szołtysek & Ogórek, Citation2020; Szołtysek et al., Citation2022, Citation2020; Szołtysek & Poniat, Citation2018; for the primary sources of all Mosaic and NAPP data, see the supplemental online material C).Footnote4 A novelty of the current version of the dataset is that it includes an expanded pool of historical census micro-data from the Russian territories, especially from the Sankt-Peterburg and the Northern Cis-Urals areas. Apart from the two basic dimensions of age and sex statistics from which the age-specific sex ratios are computed (our focal variable), the information contained in the censuses considered here allows us to derive a large number of family and demographic indicators, including the main explanatory variable.Footnote5
As in the previous research using the combined NAPP/Mosaic data, our approach is situated at the meso-level of comparative analysis, and our units of analysis are ‘regions’. Accordingly, the microdata from the NAPP on 21,559 rural parishes, sub-parishes, or communes were aggregated into 156 administrative units that were used in each respective census, and that were considered by the NAPP (generally counties). Similarly, more than 4,500 Mosaic locations (settlements, parishes, estates) were agglomerated into 160 regions that correspond either to their respective administrative units (usually also counties), or to geographical clusters in the absence of applicable administrative units.Footnote6 In total, we collected information on 316 regional populations representing most parts of Europe between 1700 and 1926, both urban and rural. However, due to the unequal supply of available digitised censuses, our data are not uniformly distributed across regions and time periods. Of the 316 regional populations, 82 are dated before 1800 (25.9%). These populations are located mainly in eastern and south-eastern Europe, as well as in Scandinavia. Another 18% of the regional populations (N = 57) are from the 1800–1850 period, while the remaining 56% (mostly in Great Britain) date from the post-1851 period. Whereas the pre-1800 locations are geographically clustered, a large share of the populations in the data from north-western Europe come from time periods when the industrial urban revolution was well underway. Although social and economic pressures to engage in gender discrimination may tend to diminish over time, in the absence of manipulation or the interference of historical events that affected either the males or the females in a population, the child sex ratios in human populations should evolve primarily in response to changes in the overall mortality environment (Spoorenberg, Citation2016; Beltrán Tapia & Gallego-Martínez, Citation2017; Beltrán Tapia, Citation2019; also Johansson & Nygren, Citation1991).
3.2. Patriarchy and its components
As we stated above, our main explanatory variable of interest is the social and ideological construct of patriarchy. To quantify it, we employ the Patriarchy Index (henceforth, PI) which has been developed by Gruber and Szołtysek, further elaborated upon in previously published papers in this and other journals (Gruber & Szołtysek, Citation2016; Szołtysek et al., Citation2017). However, for the purposes of this paper, the original computation of the PI (Gruber & Szołtysek, Citation2016) has been changed in three ways. First, the child sex ratio component had to be excluded in order to avoid circularity. Second, the original ‘married daughters’ component has been found subject to random measurement errors in its construction due to the variation in sample sizes between regions.Footnote7 Therefore, it was replaced with a more direct and more robust measure of the patrilocal bias across our data that was based on an extension of the definition proposed by Grogan (Citation2018).Footnote8 Finally, an additional component was added to the ‘generational domination’ domain to account for the residential isolation of the aged (‘elderly without relatives’; hence, a counter to patriarchal bias), replacing the ‘living in joint families’ variable. provides the descriptive statistics for all of the selected components, while section A in the online supplemental material provides the full definitions and measurements of these components, as well as indications of the expected direction of their relationships with patriarchy levels (±).Footnote9
Table 1. Descriptive statistics for the Patriarchy Index and its components for 316 regional populations of Europe (NAPP/Mosaic combined).
While most of the component variables directly capture various forms of gender and generational biases at the household/family level, some variables are proxies for behavioural patterns that could not be observed directly in our data. For example, as well as capturing the social prevalence of patrilocality, the patrilocality variable partially accounts for how the inheritance rules and property devolution procedures are defined (Goody, Citation1975). Similarly, the proportion of young females living as non-kin (i.e., mainly as domestic servants) can be related to measures of female labour force participation, at least under pre-industrial conditions. In addition, it should be noted that although the prevalence of having a boy as the last child does not translate directly into aggregate sex ratios (Basu & Jong, Citation2010, p. 523), it signals the prevalence of son preference. Overall, the PI characterises the situations of women, the aged, and young people based on the extent to which they had obtained socially valued (or desirable) position or status. Accordingly, we expect to find that the Patriarchy Index is positively correlated with child sex ratios across our data (see also, Guilmoto, Citation2012, p. 40ff).Footnote10
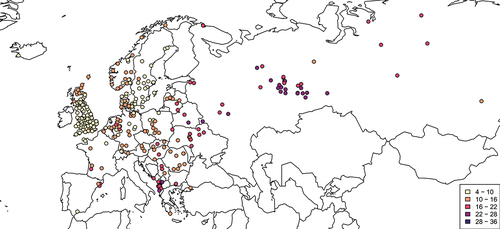
The observed PI values range from 4 to 36 points. There were no regional populations that had absolutely no patriarchal features, as defined above, although the majority of regions scored rather low on the PI scale ( = 11; see, ). However, while none of the regions could be characterised as ‘fully patriarchal’ (maximum PI = 40 points), a number of populations were approaching this value, especially those in Albania, Belarus, and Russia around the Urals. In addition, in a large number of the regions we studied, relatively high index values (above 16) can be observed. In general spatial terms, the ranking of the regions suggests that western and north-western Europe tended to be less patriarchal than eastern Europe. However, this apparent east–west divide in European patriarchy is qualified by a number of features. For example, intensities of patriarchy similar to those in the west have been observed in a number of populations scattered over the east-central parts of Europe, and even in western Siberia. It should also be noted that the lowest patriarchy scores were found not in the core areas of north-western Europe, but in Sweden in 1880.
Figure 1. Patriarchy Index in the NAPP/Mosaic dataset (316 regions).
3.3. The measure of sex proportions
While much of the literature on sex ratios deals with sex ratios at birth (a flow measure), this paper focuses on the child sex ratio (henceforth, CSR), defined as the number of boys aged 0–4 per hundred girls of the same age (a stock measure) (see, Klasen & Wink, Citation2003, p. 265; also Guilmoto & Oliveau, Citation2007). While the choice of this indicator is dictated by the nature of our data, it has certain advantages. First, as the CSR is a synthetic measure of gender imbalances that incorporates the impact of sex differentials in mortality around birth and during infancy and childhood, it includes discrimination of any form that leads to lower shares of girls in the population of children under age five; i.e., it accounts for female infanticide, as well as for mortal neglect in the early years of life (Miller, Citation1989; Agnihotri, Citation1996; Cai & Lavely, Citation2007; Bashkar & Bishnupriya, Citation2007; Den Boer & Hudson, Citation2006; Ebenstein, Citation2014). Second, this indicator is less subject to the inherent challenges that historical (pre-statistical) societies faced when enumerating live births and infant deaths (Henry, Citation1968; also Chao et al., Citation2019). Although population censuses were also subject to under-registration, a live toddler was more likely to be counted than a live or deceased infant; and this advantage increased as children grew older. Third, the 0–4 age group is not known to be significantly affected by the sex-specific migratory patterns that can greatly alter the sex ratio among older (juvenile) age groups. Finally, by including five annual cohorts, the CSR increases the sample size and reduces the effects of short-term fluctuations, and even of age misplacement (e.g., due to age heaping). Therefore, the CSR is more robust and statistically stable than other indicators. In addition, having exact information about the number of boys and girls at each age allows us to compute the sex ratios using other age groups as well (1–5, 5–9, etc.), which, in turn, enables us to test the robustness of the results achieved with the main measure.
depicts how the CSRs varied across our sample. We can see that a non-trivial fraction of locations has unusually high sex ratios. For example, 73 out of the 316 regions have ratios above 105 boys per 100 girls, a benchmark considered ‘neutral’ by contemporary standards (e.g., Visaria, 1967). Defining when a historical sex ratio is ‘too high’ is however not straightforward since, due to the female biological advantage, child sex ratios were ‘naturally’ lower in the high-mortality environments characteristic of past societies (Beltrán Tapia, Citation2019; Beltrán Tapia & Gallego-Martínez, Citation2017). In particular, societies experiencing infant mortality rates around 220 deaths per 1000 live births are expected to exhibit child sex ratios around parity.Footnote11 Therefore, instead of using a standard benchmark for all regions, this figure should depend upon a set of different variables and take into account the random variation that arises from the underlying sample size used to compute the CSRs (Szołtysek et al., Citation2022). Implementing this indicates that there are 48 such locations where the lower bound of the confidence interval is higher than what should be expected.
Figure 2. Child sex ratios in the NAPP/Mosaic dataset (316 regions).
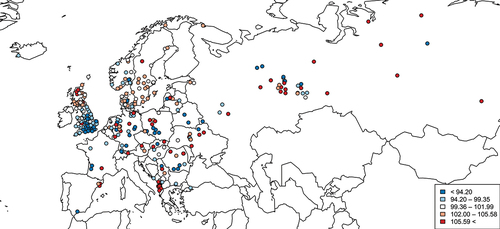
Although the regions with relatively high child sex ratios do not form any specific cluster, they tend to congregate somewhat towards the eastern and south-eastern section of our data – especially in parts of European Russia and western Siberia, and in the Balkans. Various isolated hot spots of similarly male-heavy sex ratios can also be detected in Slovakia and Hungary, in central Poland and Ukraine, as well as in Scotland, Catalonia, southern France, north-western Germany, Austria, and Switzerland. As shown elsewhere (Szołtysek et al., Citation2022), a large share of this overall variation cannot be attributed to differentials in sample size, infant mortality, or registration quality, which points to the possibility that discriminatory practices were unduly increasing female mortality in some of these locations. The goal of this paper is therefore to assess whether introducing the PI can help explain this variation in child sex ratios.Footnote12
3.4. Methods
Our main purpose is to examine whether patriarchal features were linked to possible discriminatory practices against girls across our dataset. Preliminary insights from unconditional bivariate correlation suggest that there is indeed a positive relationship between patriarchy, as measured by the PI, and the child sex ratios observed across our locations (). According to the prediction based on this simple bivariate relationship, a 10-point increase in the PI is associated with 3.8 more boys per hundred girls; which is a sizeable effect.
Figure 3. Patriarchy Index and child sex ratios in the NAPP/Mosaic dataset (316 regions).
Although the correlation is suggestive and runs in the expected direction, there is clearly the possibility that it is subject to the effects of potential confounders. In order to determine whether the association predicted by the historical patriarchy index is not spuriously driven, we examined it against a host of covariates. Accordingly, we estimate the following model:
CSR = α + β PI + X’y + ε
where the dependent variable, CSR, is the relative number of boys among children aged 0–4, and therefore captures the cumulative impact of excess female mortality at birth, and during infancy and early childhood.Footnote13 Given that the sizes of the samples from which the sex ratios are computed are not homogenous, the role of random noise in determining the observed sex ratios is different in each location. In order to address this issue, the above equation is estimated using a generalised linear model (GLM) fitted via maximum-likelihood that assumes a binomial distribution and relies on a logit function. This approach takes into account the underlying sample size (children of the corresponding age group), and therefore controls for the varying role that chance can play in determining sex ratios in different samples (Wilson & Hardy, Citation2002).
While PI refers to the Patriarchy Index described in the previous section (or to its domains or components, as in subsequent models), X´ refers to a set of demographic, socio-economic, census quality-related, and ecological variables that control for other dimensions that might be correlated with both the CSR and the PI. Although our choice of control variables was based on the literature examining sex ratios in developing countries today, as well as recent analyses of gender discrimination in historical Europe (Szołtysek et al., Citation2017, Citation2022), it also reflects the limitations of the available statistical sources (see, in the appendix and the following discussion for summary statistics and a description of all of the control variables).
First, we control for the mortality levels and fertility characteristics of the regions considered. To control for mortality, we include region-specific infant mortality rates derived from a novel dataset developed by Szołtysek et al. (Citation2022; due to data constraints, the number of observations drops to 308; see the supplemental online material B for a whole IMR data range) based on the premise that higher mortality rates (especially during infancy) reduces sex ratios for infants and children because male vulnerability is more visible in high-mortality environments, at least in absolute terms (Beltrán Tapia, Citation2019; Beltrán Tapia & Gallego-Martínez, Citation2017; Zarulli et al., Citation2018).Footnote14 In addition, we include the child-woman ratio (see, Willigan & Lynch, Citation1982), and an indirect measure of the onset of a monotonic fertility decline (dummy) in each region to account for the tendency of child sex ratios to respond to differences in the overall fertility levels and their secular changes. Whereas in high-fertility populations, couples can, on average, have a larger completed family size, and are thus more likely to achieve the gender composition of their offspring that they desire; in low-fertility populations, a couple’s desire for their children to have a specific sex composition could lead to parity-dependent gender-preferential treatment of their offspring (e.g., Jayachandran, Citation2017). Child sex ratios also tend to rise in areas with a strong son preference and declining fertility (Basu, Citation1999; Das Gupta & Mari Bhat, Citation1997; Park & Cho, Citation1995).Footnote15
Second, we distinguish between urban and rural regions on the grounds that urban areas (particularly those that are industrialised) offer more female labour opportunities and give women more socially valued roles, which may, in turn, increase the relative value of girls, and thus reduce the odds of gender discrimination and post-natal neglect (Evans, Citation2019; Johansson, Citation1984). Furthermore, child sex ratios may also be lower in cities due the urban health penalty, which had a greater impact on boys, at least until the public health interventions of the late 19th and early 20th centuries (Woods, Citation2003; also Banister, Citation2004).
Third, given that the sex-selective undercounting of children may result in abnormally high (or low) sex ratios even in the absence of any preferential treatment by parents (Szołtysek et al., Citation2022), we include several proxies for the potential impact of census quality and under-registration across our data.Footnote16 In this regard, we control for the possibility that infants were under-registered across our populations,Footnote17 and consider the female disadvantage in age heaping among the adult population as a proxy for a more general gender bias in census registration. Whereas at older ages, such a registration bias would result in higher levels of age heaping among women than among men; in the lower age groups (e.g., 0–4), it could lead to female-specific under-registration. Furthermore, terrain ruggedness (Wilson et al., Citation2007) was considered in order to capture the difficulties that the census-takers would have faced when conducting the surveys in unfavourable geographic locations, which might have affected the accuracy of the counts.
Fourth, we also control for the effects of geographical characteristics on ecological endowments, and the general features of agrarian regimes, by including the share of the land that is cropland, along with the suitability of the land for agricultural use. In the literature on sex ratios, the agrarian ecology argument takes different forms, but it generally serves to explain how different agricultural practices affect the prevalence of different norms about the role of women in society, which can lead to male-biased child sex ratios, especially if they result in a preference for males (Boserup, Citation1970; Alesina et al., Citation2018; Carranza, Citation2014; Grogan, Citation2015; also Bardhan, Citation1974). While this literature is very heterogenous, one of its most influential strands posits that historical resource scarcities, as measured by the historical availability of arable land, tend to be negatively associated with gender equality and positive female reproductive health outcomes, and may result in male-skewed sex ratios (Jha & Sarangi, Citation2020; Hazarika et al., Citation2019; cf., Grogan, Citation2015).
Fifth, we consider the possibility that in isolated areas, where opportunities for females to engage in income-generating activities outside the family domain were scarce, life-sustaining resources (food and/or care at the household level) were disproportionally allocated to male children, because the returns to this investment were perceived to be greater than the returns to a comparable investment in females (Kishor, Citation1993; Rosenzweig & Schultz, Citation1982; Rahman & Rao, Citation2004; Pande & Astone, Citation2007; also Cain, Citation1993). In order to account for the relative remoteness of our regions and the intensity of possible interactions between populations at different locations, we derived a ‘population potential’ covariate (see, Stewart & Warntz, Citation1958) that provides information on whether a specific region was situated close to important population centres of Europe, or was instead in a peripheral, sparsely populated area.
Finally, given that we are analysing spatial data, it is likely that our regressions are influenced by spatial autocorrelation, which might bias both the coefficient estimates and the standard errors (Bivand, Hauke et al., Citation2013; Bivand, Pebesma, et al., Citation2013). Therefore, we have assessed whether the model residuals are affected by this issue by computing the Moran’s I index.Footnote18
4. Results
4.1. The PI-sex ratios relationship
reports the results of the main regression model, which links the PI and the relative number of boys while controlling for the wide range of potential confounders explained above. Column (2) takes into account the demographic dimensions and the variables capturing the quality of the census (as implemented in Szołtysek et al., Citation2022). Column (3) adds the remaining controls, while distinguishing between urban/rural locations and the influence of neighbouring locations, and including dimensions related to land productivity and the prevalence of cropland. The positive relationship between the PI and the relative number of boys is robust to these different specifications. Replicating this analysis using other age groups (0, 1–5, and 5–9) reinforces this picture (columns 4–6). Although the coefficient on the PI becomes statistically insignificant in the 1–5 age group, it is even higher when we analyse the 0–1 and 5–9 age groups. Although the large coefficient shown for infants might be subject to registration issues, older children aged 5–9 were arguably less prone to these concerns, which lends further support to the claim that girls were more vulnerable in more patriarchal locations. Although the control variables are not our immediate focus, it is worth mentioning that most of their effects are found to be in line with the theoretical expectations described in section 3 above (full results are reported in in the appendix).Footnote19
Table 2. Patriarchy Index and child sex ratios.
However, the UK locations have a disproportionate weight in our sample, both in terms of their relative numbers and the sizes of their respective samples (91 out of 316 regions; full-count populations). This imbalance can bias our results, particularly given that the UK regions tend to have relatively low child sex ratios and patriarchy values. Moreover, as industrialisation was already well advanced in these locations, it is plausible to question whether these populations truly reflected the ‘traditional’ social structures upon which the concept of patriarchy is based (e.g., Schürer et al., Citation2018). As the modernisation of social relations was underway and work was increasingly separated from domestic life, the role of the family as a unit of production and consumption – and, thus, of property – in cementing family ties might have been significantly weakened in Great Britain during our study period (cf., Wolf, Citation2005).Footnote20 If the British data do not reflect the conditions under which patriarchal rigidities could flourish, they may have biased our results by introducing artefactual relationships to our overall analysis. Thus, in (panel A), the analysis is replicated while excluding the locations in England, Wales, and Scotland.
Table 3. Patriarchy Index and child sex ratios, restricted samples.
The results clearly show that the relationship between the PI and the child sex ratios is stronger, regardless of the age group examined. Similar results are obtained if, instead of excluding the UK locations, we run the analysis with no prior weights in terms of sample sizes, so that each region is treated exactly the same (in order to reduce the randomness associated with sex ratios obtained from small samples, we exclude regions with fewer than 1,000 children; see, in the appendixFootnote21). Likewise, as the role of patriarchy is likely to be less important in urban areas, analysing all of the locations together may obscure the link studied here. Focusing the analysis on the rural locations also yields larger (and more precisely estimated) coefficients (, Panel B),Footnote22 which further supports our assumption that regions with higher levels of patriarchy had a disproportionate number of boys. More specifically, these models show that a 10-point increase in patriarchy is associated with three more boys (per hundred girls), which is a sizeable effect. This estimate mirrors the effect of a coefficient on patriarchy of 0.003, which is a conservative approach given that it is generally around 0.003–0.004 (columns 4, 6, and 8 in ), and it can be much higher (column 2).
As evidenced by the reported Moran’s I value, our results are influenced by spatial autocorrelation, which may affect the accuracy of the coefficient estimates, the standard errors, and the model residuals. In order to mitigate these problems, we have re-estimated our main model using Eigenvector Spatial Filtering (Thayn, Citation2017). This approach removes the spatial dependence in the error of the model by choosing a set of vectors that represents the spatial autocorrelation present in the residuals and adding them to the model (Bivand, Hauke et al., Citation2013; Bivand & Piras, Citation2015),Footnote23 while effectively controlling for unobserved factors that are common across neighbouring locations. Accounting for spatial autocorrelation using this procedure hardly alters our baseline results (see, in the appendix).Footnote24 Despite the inclusion of a parsimonious subset of significant spatial eigenvectors in the model, the estimated coefficient for the PI remains unchanged, which provides further evidence that the link between patriarchy and child sex ratios is robust to different specifications.
4.2. Exploring the mechanisms behind the Patriarchy Index
As we mentioned in section 3.2, the Patriarchy Index is a composite measure constructed using 10 variables that capture different aspects that influence family organisation, which can, in turn, be aggregated into four main subindexes: domination of men over women, generational domination, patrilocality, and son preference (Gruber & Szołtysek, Citation2016, pp. 152–154). It is plausible to hypothesise that these dimensions influenced how parents treated their sons and daughters in different ways (cf., Bose, Citation2015). For instance, the custom of patrilocal residence has played a crucial role in explaining the ‘missing women’ phenomenon in various parts of Asia (e.g., Ebenstein, Citation2014; also Grogan, Citation2018, p. 2013). Similarly, the European Marriage Pattern (henceforth: EMP; that is, a high female age at marriage, a high percentage of singles, and the prevalence of neo-local nuclear households) has long been linked to higher levels of female agency and the comparatively favourable status enjoyed by women in historical Europe (De Moor & Van Zanden, Citation2010; Lynch, Citation2011; Van Zanden et al., Citation2019; also Kok, Citation2017). In particular, it has been posited that female marital behaviour (such as the age at marriage or the spousal age gap) is especially important in determining women’s bargaining power, which, in turn, affects the health and economic welfare of women and female children (Kok, Citation2017, pp. 36–37; also Poska, Citation2013). However, this view has been contested by Dennison and Ogilvie (Citation2014), who argued that there is little evidence linking the EMP with improved female autonomy. The wealth of information contained in the Patriarchy Index, as well as the extended coverage of the NAPP/Mosaic data, allow us to contribute to this debate from a different perspective. Therefore, in this section, we attempt to determine which dimensions of the PI are more important for explaining the CSRs across our samples, and thus play a critical role in gender discrimination early in life.
Accordingly, we replicate the previous analysis while focusing on the links between the components of the PI and the CSRs (). Columns (1) to (4) test the relationship between individual subindexes and child sex ratios (aged 0–4) separately, whereas column (5) considers the four dimensions simultaneously (all of these specifications include the full set of controls as employed in above). The results mostly conform to our expectations. The male domination and patrilocality dimensions are shown to be positively related to child sex ratios. These links hold when the model considers all four subindexes jointly, and are robust to using sex ratios for other age groups as dependent variables (columns 6–8). Likewise, we find that the dimension that explicitly captures son preference, measured as the importance of having a boy as the last child, is positively associated with child sex ratios for the 5–9 age group, and this observation is further strengthened by the fact that, as we noted above, registration issues are less of a concern when examining older children. However, the power of the older generation is shown to be negatively associated with child sex ratios. As we will discuss later, this result is unexpected, and suggests that some dimensions of household formation systems, such as neo-locality, may have an ambiguous relationship with gender equity.
Table 4. Dimensions of patriarchy and child sex ratios.
Lastly, presents the results of disaggregating the PI into its 10 raw components. As in the previous exercise, the first columns include only one component at a time, while the last column (column 11) includes all these dimensions simultaneously. Patrilocality and the prevalence of having a boy as the last child are found to have the strongest associations with the child sex ratios, which is in line with the theoretical expectations discussed above. This empirical finding confirms that the role of patrilocal residence in explaining the ‘missing women’ phenomenon in various parts of Asia (e.g., Ebenstein, Citation2014) also holds in the European historical setting. Also as expected, we find that both the relative importance of young brides and the share of wives who are older than their husbands are significantly related to male-skewed sex ratios. Taken together, the importance of these variables is similar to that of patrilocality and explicit son preference, which indicates that female marital behaviour heavily shaped women’s bargaining power, and how families treated their male and female children. The proportion of young females living as non-kin, as well the share of the aged residing in a household headed by a younger generation are both found to have a theoretically plausible association with CSRs when they are entered one at a time (columns 4–5), but their effects disappear when they are assessed along with the other components.
Table 5. Components of the Patriarchy Index and child sex ratios.
It is, however, more challenging to rationalise the mechanisms behind the significant coefficients found for the importance of the female heads, neolocality, lateral relatives, or elderly living alone components. Let us consider the case of neolocality, which is commonly regarded as a crucial element of the EMP (De Moor & Van Zanden, Citation2010; Van Zanden et al., Citation2019). Contrary to expectations, our results suggest that the locations where this household formation trait prevailed actually exhibited higher child sex ratios. This finding is important in that it qualifies the gender-progressive role of neolocality, thus strengthening arguments others have made that the features of the EMP (to which the former is customarily included) did not automatically translate into a more girl-friendly environment (Dennison & Ogilvie, Citation2014; cf., Lee et al., Citation2004). It should suffice to note that neolocality clearly meant something very different in southern Italy, Romania or Spain where it generally coincided with early female marriage and low proportions never marrying; while in Britain and Denmark it denoted settings with late female marriage age and high celibacy rates. It is also useful to bear in mind that both Southern Italy and parts of Spain studied by other scholars using other data exhibited highly unequal gender structures, despite being dominated by nuclear households (Barbagli, Citation1991; Marco-Gracia & Beltrán Tapia, Citation2021; Rowland, Citation2).
It should, however, be stressed that the coefficients of these variables are smaller, and therefore exert a weaker influence on child sex ratios. Moreover, we should be cautious in interpreting the effects of all these factors simultaneously due to the large number of variables included in this model, as well as the potential relationships between them, which can make ceteris paribus interpretations difficult. Nonetheless, as the results are similar if the child sex ratios are computed using other age groups (0–1, 1–5, and 5–9; see, in the appendix), it appears that these familial arrangements are indeed capturing relevant dimensions that affected how parents treated their sons and daughters.
5. Discussion and Conclusion
The results of the analysis reported here support the claim that there is a statistically and economically significant association between child sex ratios and a composite measure of patriarchal family organisation in the past (the Patriarchy Index), when the former captures cumulative female excess mortality during infancy and childhood, and therefore measures the impact of gender discrimination early in life. We found that regions with higher PI values had higher child sex ratios. We also provided evidence that this link is robust to the inclusion of other relevant covariates by using different age groups to compute sex ratios and alternative model specifications, including stringent tests for spatial dependence and various data permutations. Furthermore, we examined the relationship between the child sex ratios and the components of the Patriarchy Index, and found substantial variation in their relative impact. Thus, we showed that patrilocal norms and a direct measure of son preference, the prevalence of having a boy as the last child, are strongly correlated with higher sex ratios. Similarly, an indirect measure of female age at marriage and the spousal age gap was also found to have an independent relationship with our measure of female neglect. Although the correlations exhibited by other dimensions of the Patriarchy Index are difficult to interpret, taken together, our results show that family-driven age- and gender-related inequalities, as captured by the PI, are relevant for understanding variation in child sex ratios in historical populations of Europe, and perhaps of western Eurasia.
A substantive interpretation of our results points to the existence of a long-neglected link between hierarchical family organisation and gender discrimination in infancy and childhood in historical European populations, and suggests that this important nexus merits further investigation. Our findings clearly show that very much like in Asia (e.g., Kishor, Citation1993; Arokiasamy & Goli, Citation2012; also Dong, Citation2016), patriarchy played an important role in shaping the sex balance among children in historical Europe. This finding is important, especially given that one of the foundational differences between European and non-European forms of patriarchy was that the latter were often institutionalised and strengthened by potential sanctions by higher (state and/or religious) authorities (Moghadam, Citation2004; Wolf, Citation2005). This argument would suggest that whatever patriarchal bias existed across most of historical Europe, it may have been a different type of patriarchy than that observed in Asia; most crucially, it would have been a ‘weaker’ form of patriarchal pressure than the form in Asia, where patriarchy was fully enforced by state laws. Our finding that Europe’s supposedly milder forms of patriarchy are still significant predictors of male-skewed sex ratios among children does not align well with this view, and, indeed, it opens up entirely new ways of thinking about how historical family organisation affected developmental outcomes.Footnote25 Noteworthy, a recent work of Singh et al. (Citation2021), which follows our methodology with some modifications, has identified a strong association between the India Patriarchy Index and the excess female mortality under age five across 640 Indian districts, controlling for a number of socio-economic, demographic, and residence related characteristics (Singh, personal communication). Further research is nonetheless needed to compare the type of patriarchal structures existing in Europe and Asia, as well as their potential effects in a wide range of socio-economic and demographic dimensions.
In addition, the effects of the PI on the unbalanced sex ratios across our data were not necessarily small, either in relative or in absolute terms. While it is true that the effects of patriarchy were mitigated to some extent by demographic, administrative (census quality), and agro-ecological features, even after controlling these factors, these effects remained sizeable. Specifically, we found that a 10-point increase in the PI (corresponding to a shift from central Danish areas to rural areas south of St. Petersburg in Russia) was associated with almost three more boys per 100 girls under age five. A shift from the southern part of the Zurich canton to Albanian highland tribal areas (a 20-point increase in the PI) was associated with six more boys per 100 girls in that age-group. Even allowing for a certain degree of uncertainty in our computations, these estimates are quantitatively important.
It should, however, be noted that our results are based on populations measured at different points in time. Like the rich historiographical tradition our approach was based on (Hajnal, Citation1982; Laslett, Citation1977; also Dennison & Ogilvie, Citation2014), we faced some obvious challenges: namely, that an ideal data structure that includes cross-sectional data from around the same point in time, or continuous time-series for all populations in our database, does not yet exist, and is unlikely to become available in the future. However, it is often tacitly assumed by the doyens of comparative family history that the family behaviours upon which the Patriarchy Index is built represent ‘deep’ cultural layers that move slowly over time (e.g., Reher, Citation1998; also Schürer et al., Citation2018). The approach taken in this paper is further reinforced by Therborn’s (Citation2004, pp. 23–24) observation that European patriarchy was not seriously weakened until the 1960s (also Kok, Citation2017, p. 41), as well as by the wealth of feminist scholarship pointing out the longue durée of ‘patriarchal equilibrium’ (Abraham, Citation2019; Bennett, Citation2006; Folbre, Citation2021). Moreover, it should be noted that our models controlled for a number of strongly time-dependent demographic (CWR; the onset of fertility decline) and census quality (e.g., modern vs pre-modern) measures, and that the absolute majority of our regional populations represent pre-transitional demographic regimes.
Still, the findings presented in this paper raise a number of additional issues, which suggests that further research may be needed to fully substantiate the results obtained here. First, our sample of 316 locations between 1700 and 1926 is not fully representative of the variation in family systems and potential female neglect in historical Europe. The lack of information on Southern Europe is especially problematic, given that previous research has shown that gender discrimination early in life may have been especially acute in that region (Manfredini et al., Citation2016; Beltrán Tapia & Gallego-Martínez, Citation2017; Marco-Gracia & Beltrán Tapia, Citation2021; Beltrán Tapia & Raftakis, Citation2021). Moreover, in addition to the limitations related to the number and the spatial distribution of the regions studied, the sample sizes of some of these locations were relatively small, which increases the possibility that random noise was contaminating these results, despite our efforts to mitigate this concern.
Second, our empirical exercise may suffer from the presence of omitted variables related to both patriarchy and child sex ratios. Although the results are robust to the inclusion of a large set of potential confounders, the choice of control variables was limited by the available information. We should also not ignore potential hermeneutic limits of some of our contextual measures. While we think the PI serves well its intended purpose of measuring comparatively the intensity of family-based sex- and age-related inequalities across populations, our agro-ecological variables are rather crude and leave little scope for differentiating the effects of patriarchal regimes based on different subsistence means (intensive agriculture vs pastoralism and/or cattle breeding), which may ultimately influence how the objective patriarchal structures affected female health and survival.Footnote26 Given the wide range of regions and periods covered, the varying accuracy of these variables might also play a role. Clearly, further efforts in this area are contingent on having more specific data on historical (place-specific) labour-force participation by gender. Such information is, however, unlikely to be available at the large-scale approach adopted in this paper. Similarly, it would be interesting to include more demographic and socio-economic controls, though similar data acquisition challenges might apply here as well.
In addition, as the PI captures a multidimensional phenomenon, it is associated with a wide range of socio-demographic and cultural dimensions (cf. Dermineur, Citation2018). Accordingly, as many of the cultural and institutional traits that may influence unbalanced sex ratios are likely to influence patriarchy as well, there may be some endogeneity issues in the models.
Lastly, we should be aware of the risk of ecological fallacy that was potentially inherent in this endeavour. Although the underlying incentives affecting family behaviour ultimately flowed from demographic and socio-economic structures, the decisions taken to act on a preference for sons occurred at the level of the individual woman, the male patriarch, or, perhaps, the conjugal couple and their household. While we showed that more patriarchal regions were more likely to be associated with elevated sex ratios, we could not be sure whether the parents living in households based on a patriarchal hierarchy were more inclined to engage in preferential treatment of their offspring than the parents living in households with a more equal structure.
As this is the first study that has explored the link between patriarchal forms of family organisation and the variation in child sex ratios in historical Europe, these results should be taken as a first step towards gaining a better understanding of these issues. As well as macro-comparative approaches and case studies focusing on particular regions, qualitative evidence on how patriarchy translated into different forms of gender discrimination within households is needed. Nonetheless, the results of this research suggest that the kinds of patriarchal features that promote gender discrimination during infancy and childhood in developing countries today also played a role in exacerbating female neglect in historical Europe, which underlines the potential policy implications of this research agenda.
Disclosure statement
No potential conflict of interest was reported by the author(s).
Additional information
Funding
Notes
1. Bechtold (Citation2006) used a simple set of economic variables, notably measures related to industrialisation, to explain the variation in child sex ratios across French departments in the 19th century. Beltrán Tapia and Gallego-Martínez (Citation2020) modelled the variation in infant and child sex ratios in 19th-century Spain as a function of a number of economic, social, and environmental factors, of which only one variable represented a rather crude account of prevailing family patterns. In the nearly pan-European study of child sex ratios based on 19th-century census returns, Beltrán Tapia (Citation2019) used variables pertaining to geography, climate, and population density to explain the variation in the dependent variable, but did not include any measure of family domain. Beltrán Tapia and Raftakis (Citation2021) included in their regressions of child sex ratios in Greece around 1880 a province-level classification of family organisation into cultural ideal family types.
2. It should be noted that patrilineal kinship systems are the most common traditional systems across Europe. However, most of these societies offer some flexibility in the actual practice of inheritance and residence rules, while only a few are rigidly patrilineal, as illustrated by historical cases in northern Italy, France, Albania, and Latvia (Wheaton, Citation1975).
3. While most patriarchal settings are indeed characterised by a son preference, there are others, such as those in some parts of Africa, that have no notable son preference, but have other practices that appear to be detrimental to women, such as genital cutting (e.g., Rossi & Rouanet, Citation2015; cf., Tandrayen-Ragoobur, Citation2021).
4. In order to enter the database, all listings (especially those from the Mosaic collection) had to pass stringent data content and structure evaluations (see, Szołtysek & Gruber, Citation2016).
5. In order to account for the sex proportions of all children of a certain age, we include not just family households, but also domestic units representing various kinds of institutions (poor houses, manor houses, houses of farmhands).
6. In choosing the NAPP data, we gave preference to the oldest available censuses for Iceland, Denmark, Norway (18th to early 19th centuries), and England (with Wales) (1851); whereas the earliest NAPP data for Sweden came from the late 19th century (1880). The data for Scotland came from 1881 instead of 1851, because for the latter census, it was impossible to derive infant mortality estimates from around the census date. For all NAPP data, including for Great Britain, full-count populations were used. All British data came from the censuses provided to NAPP/IPUMS-I by the I-CeM project: https://icem.data-archive.ac.uk/#step1.
7. No significant biases of this kind have been identified for other explanatory variables. For the likely impact of the sample size on the CSRs values, see discussion in section 3.4. That letter section also clarifies why the variation in the avaliable data size would have only negligible impact on the main findings of this paper.
8. This new measure is strongly and significantly correlated with both the earlier indicator of elderly living with married daughters (r = −.702), and the patrilocality measure suggested by Guilmoto (2012, p.42; proportion of male children among married children residing with their parents) (r = .615). Altogether, the new PI is nearly perfectly correlated with its original 2016 predecessor (r = .922).
9. We carried out a principal component analysis (PCA) to evaluate whether our ten indicators tap into one single component, in our case the notion of patriarchy. The eigenvalue for the first component was 4.99, well above 1, and thus justyfying the construction of a single measure. The internal consistency of the Index is high (Cronbach’s alpha = 0.85; 95% CI [0.83, 0.87]).
10. The PI has a strong, negative, and significant relationship with the share of female servants and the proportion of nuclear households in the population of a region; but a strong positive association with the share of multiple-family households (2+ conjugal family units living together).
11. In a companion paper, we have estimated the mean predicted value of the CSR across the present dataset – i.e. after accounting for random variation, infant mortality differentials, and faulty enumeration, to be 98.53 (SD = 4.41) (see, Szołtysek et al., Citation2022, esp. ft. 31).
12. Apparently, next to a considerable pool of regions with suspiciously elevated CSRs, some incidences wherein the opposite extreme is manifested can also be observed. These regions (54 altogether), display CSRs below 94 potentially indicating a serious scarcity of boys. To ascertain whether this indeed reflects a sort of ‘reversed’ gender bias, or whether it is caused by other unobserved factors is beyond the scope of this paper. It should be noted, however, that in the case of the British regions – which constitute a significant part of the discussed group, structural factors related to infant mortality differentials and census quality largely explain these low levels of CSRs (see, Szołtysek et al., Citation2022), esp. in the online supplemental material). See also discussion related to in the main text above.
13. Considering other age groups (0, 0–4, 1–5, and 5–9) can mitigate the potential limitations of particular sex ratios in the analysis. We should also note that for modelling purposes, we prefer to use the proportion of males as a dependent variable because of its statistical properties (unlike sex ratios sensu stricto, its distribution is symmetrical and follows a well-behaved distribution). Assuming that the sex of an individual is a random draw, the proportion of males (or females) follows a binomial distribution that can be approximated by a normal distribution (see, Wilson & Hardy, Citation2002; also Garenne, Citation2008).
14. Note that the effects of infant mortality are likely to include the role of climatic factors that may explain part of the variation in CSRs through their effects on the disease environment (Beltrán Tapia, Citation2019; Beltrán Tapia & Gallego-Martínez, Citation2020).
15. Banister (Citation2004, p. 38) argued that rather than declining or low fertility alone causing a dearth of girls in Asia, it is the underlying culturally-motivated son preference that is decisive in whether a society actually embarks on life-threatening discrimination against girls in the context of changing fertility (also Den Boer & Hudson, Citation2017, pp. 120–121).
16. Since the classification of the census quality relies heavily on its temporality (traditional, pre-modern, modern; see the appendix), it partially includes the potential effects of time in our pooled cross-sectional data. As this results in the redundancy of the explicit time variable in the models, this variable has been omitted.
17. Note that there are censuses in our collection that, by definition, did not assign any children to the <1 age group.
18. The Moran’s I computes the correlation between the value of a particular variable y in region i, and the value of the (weighted) mean of y in neighbouring regions j (the five nearest neighbours were considered).
19. Other things being equal, infant mortality rates and population potential are significantly associated with lower CSRs, while our measures of gross fertility, the onset of demographic transition, rurality, terrain ruggedness, and croplands are significant positive predictors of more unbalanced sex ratios across our data.
20. Note that the sweeping modernisation trends in mid-19th century Great Britain were not necessarily accompanied by demographic modernisation, as fertility rates remained high.
21. As with previous exercises, the results for infants are more noisy, perhaps due to registration issues.
22. We have considered the locations where all of the population is rural. However, relaxing this condition (proportion rural> = 0.8) or focusing on locations smaller than 25,000 inhabitants provides similar results. Although these specifications suffer from overdispersion, the results hardly change if the analysis is replicated using a quasibinomial model that corrects for these issues (see, in the Appendix).
23. This is implemented by the ME function present in the spatialreg R package (Bivand, Pebesma et al., Citation2013; Bivand & Piras, Citation2015).
24. Given that the raw results for the 0–1 age group do not suffer from spatial autocorrelation (Moran’s I = 0.005), this robustness test only applies to the 0–4, 1–5, and 5–9 age groups.
25. Notably, Wolf (Citation2005) mentions Russia as having similar forms of state patriarchy as those in China.
26. Consider two examples from our dataset: Russian patriarchy based on agriculture with highly skewed sex ratios, and Polessyan-Belarusian patriarchy based almost solely on cattle breeding with much more balanced CSRs.
References
- Abraham, K. (2019). Persisting patriarchy: Intersectionalities, negotiations, subversions (Palgrave Macmillan).
- Agnihotri, S. (1996). Juvenile sex ratios in India: A disaggregated analysis. Economic and Political Weekly, 31(52), 3369–3382. http://www.jstor.org/stable/4404938
- Alesina, A., Giuliano, P., & Nunn, N. (2018). Traditional agricultural practices and the sex ratio today. PLoS ONE 13(1): e0190510. https://doi.org/10.1371/journal.pone.0190510
- Alter, G., Manfredini, M., & Nystedt, P. (2004). Gender Differences in Mortality. Pp. 327–358 in Life under pressure: Mortality and living standards in Europe and Asia, 1700–1900, (Eds.) T. Bengtsson, C. Campbell, & J. Z. Lee. MIT Press.
- Arnold, F. (1997). Gender preferences for children. Demographic and Health Surveys. Comparative Studies, 23, 1–56. http://dhsprogram.com/pubs/pdf/CS23/CS23.pdf
- Arokiasamy, P., & Goli, S. (2012). Explaining the skewed child sex ratio in rural India: Revisiting the landholding-patriarchy hypothesis. Economic and Political Weekly, 47(42), 85–94. https://www.jstor.org/stable/41720276
- Attane, I., & Guilmoto, C. Z. (Eds). (2007). Watering the neighbor’s garden: The growing demographic female deficit in Asia. CICRED.
- Banister, J. (2004). Shortage of girls in China today. Journal of Population Research, 21, 19–45. 1 https://doi.org/10.1007/BF03032209
- Barbagli, M. (1991). Three household formation systems in eighteenth- and Nineteenth-Century Italy. In D. I. Kertzer & R. P. Saller (Eds.) The family in Italy from Antiquity to the present, pp. 255–269. Yale University Press.
- Bardhan, P. K. (1974). On life and death questions. Economic and Political Weekly, 9(32–34), 1293–1303. https://www.jstor.org/stable/4363909
- Basu, A. M. (1999). fertility decline and increasing gender imbalance in india, including a possible South Indian turnaround. Development and Change, 30, 237–263. 2 https://doi.org/10.1111/1467-7660.00116
- Basu, A., & Das Gupta, M. (2001). Family systems and the preferred sex of children. In N. J. Smelser & B. Baltes (eds.), International Encyclopaedia of the Social and Behavioral Sciences (pp. 8–5350). Pergamon.
- Basu, D., & Jong, R. D. (2010). Son targeting fertility behavior: Some consequences and determinants, Demography, 47(2), 521–536. https://doi.org/10.1353/dem.0.0110
- Baten, J., & Murray, J. E. (2000). Heights of men and women in 19th-Century bavaria: Economic, nutritional, and disease influences. Explorations in Economic History, 37(4), 351–369. https://doi.org/10.1006/exeh.2000.0743
- Bechtold, B. H. (2001). Infanticide in 19th century France: A quantitative interpretation. Review of Radical Political Economics, 33(2), 165–187. h ttps://d oi.o rg/1 0.1177%2F04 8661 340 103 300 202
- Bechtold, B. H. (2006). The changing value of female offspring in 19th-century France: Evidence for secondary ratios. In Killing infants: Studies in the worldwide practice of infanticide, (Eds.) B. H. Bechtold & D. C. Graves, 315–335. Edwin Mellen Press.
- Beltrán Tapia, F. J. (2019). Sex ratios and missing girls in late-19th-century Europe. EHES Working Paper 160.
- Beltrán Tapia, F., & Gallego-Martínez, D. (2017). Where are the missing girls? Gender discrimination in 19th-century Spain. Explorations in Economic History, 66, 117–126. https://doi.org/10.1016/j.eeh.2017.08.004
- Beltrán Tapia, F. J., & Gallego-Martínez, D. (2020). What explains the missing girls in 19th-century Spain? Economic History Review, 73(1), 59–77. https://doi.org/10.1111/ehr.12772
- Beltrán Tapia, F. J., & Marco-Gracia, F. J. (2021). Death, sex and fertility: Female infanticide in rural Spain, 1750-1950. European Review of Economic History, heab023. https://doi.org/10.1093/ereh/heab023
- Beltrán Tapia, F. J., & Raftakis, M. (2021). Sex ratios and gender discrimination in Modern Greece, Population Studies. https://doi.org/10.1080/00324728.2021.1923787 1–18
- Bennett, J. (2006). History matters: patriarchy and the challenge of Feminism. University of Pennsylvania Press.
- Bhalotra, S., Chakravarty, A., & Gulesci, S. (2020). The price of gold: Dowry and death in India. Journal of Development Economics, 143. https://doi.org/10.1016/j.jdeveco.2019.102413
- Bhaskar, V., & Bishnupriya, G. (2007). India's missing girls: Biology, customs, and economic development. Oxford Review of Economic Policy, 23(2), 221–238.
- Bivand, R. S., Hauke, J., & Kossowski, T. (2013). Computing the Jacobian in Gaussian spatial autoregressive models: An illustrated comparison of available methods. Geographical Analysis, 45(2),150–179. https://doi.org/10.1111/gean.12008
- Bivand, R. S., Pebesma, E., & Gomez-Rubio, V. (2013). Applied spatial data analysis with R (2nd edition). Springer, NY. http://www.asdar-book.org/
- Bivand, R. S., & Piras, G. (2015). Comparing implementations of estimation methods for spatial econometrics. Journal of Statistical Software, 63(18), 1–36. https://doi.org/10.18637/jss.v063.i18
- Bose, C. E. (2015). Patterns of global gender inequalities and regional gender regimes. Gender & Society, 29(6), 767–791. https://doi.org/10.1177/0891243215607849.
- Boserup, E. (1970). Woman’s role in economic development. George Allen &. Unwin.
- Cai, Y., & Lavely, W. (2007). Child sex ratios and their regional variation in China. In Transition and challenge: China’s population at the beginning of the 21st century, (Eds.) Z. Zhongwei & F. Guo, 108–123. OUP.
- Cain, M. (1993). Patriarchal structure and demographic change. In N. Federici, K. O. Mason, & S. Sogner (Eds.). Women’s position and demographic change (pp. 43–60) Clarendon Press.
- Carmichael, S. G., & Rijpma, A. (2017). Measuring agency. In J. L. van Zanden, A. Rijpma, & J. Kok (eds.), Agency, gender and economic development in the world economy, 1850-2000. Testing the sen hypothesis (Routledge pp. 51–72.
- Carranza, E. (2014). Soil endowments, female labor force participation, and the demographic deficit of Women in India. American Economic Journal. Applied Economics, 6(4), 197–225. https://doi.org/10.2307/43189527
- Chao, F., Gerland, P., Cook, A. R., & Alkema, L. (2019). Systematic assessment of the sex ratio at birth for all countries and estimation of national imbalances and regional reference levels. Proceedings of the National Academy of Sciences, 116(19),9303–9311. https://doi.org/10.1073/pnas.1812593116
- Coale, A., Anderson, B., & Härm, E . (1979). Human fertility in Russia since the 19th century. Princeton University Press.
- Coale, A. J., & Watkins, S. C. (Eds.) (1986). The decline of fertility in Europe. Princeton University Press.
- Das Gupta, M. (1987). Selective discrimination against female children in rural Punjab, India. Population and Development Review, 13(1), 77–100 https://doi.org/10.2307/1972121
- Das Gupta, M. (2010). Family systems, political systems and Asia’s ‘missing girls’. Asian Population Studies, 6(2), 123–152 https://doi.org/10.1080/17441730.2010.494437
- Das Gupta, M., & Mari Bhat, P. N. (1997). Fertility Decline and increased manifestation of sex bias in India. Population Studies, 51(3), 307–315. https://doi.org/10.1080/0032472031000150076
- Das Gupta, M., Zhenghua, J., Bohua, L., Zhenming, Z., Chung, X., & Hwa-Ok, B. (2003). Why is son preference so persistent in East and South Asia? A cross-country study of China, India and the republic of Korea. Journal of Development Studies, 40(2), 153–187. https://doi.org/10.1080/00220380412331293807
- De Moor, T., & Van Zanden, J. L. (2010). Girl power: The European marriage pattern and labour markets in the north sea region in the late medieval and early modern period 1. The Economic History Review, 63, 1–33. 1 https://doi.org/10.1111/j.1468-0289.2009.00483.x
- Den Boer, A. M., & Hudson, V. M. (2006). Sex-selective infanticide and the “missing females” in China and India. In Bechtold, B. H., & Graves, D. C. (Eds.) Killing Infants: Studies in the worldwide practice of infanticide (pp. 337-371). Edwin Mellen Press.
- Den Boer, A. M., & Hudson, V. M. (2017). Patrilineality, Son preference, and sex selection in South Korea and vietnam. Population and Development Review, 43(1), 119–147. https://doi.org/10.1111/padr.12041
- Dennison, T. K., & Ogilvie, S. (2014). Does the European marriage pattern explain economic growth? The Journal of Economic History, 74, 651–693. 3 https://doi.org/10.1017/S0022050714000564
- Dermineur, E. (2018). The anatomy of patriarchy in early modern France. In E. Dermineur, Å. Sjögren Karlsson, & V. Langum, (Eds.) Revisiting gender in European History 1400-1800 (pp. 10–28). Routledge.
- Derosas, R. (2012). Suspicious deaths: Household composition, infant neglect, and child care in nineteenth-century Venice. Annales de démographie historique, 123(1),95–126. https://doi.org/10.3917/adh.123.0095
- Derosas, R., & Tsuya, N. O. (2010). Child control as a reproductive strategy. In Tsuya N. O., Wang, F., Alter, G., & Lee, J. Z. (Eds.) Prudence and pressure: Reproduction and human agency in Europe and Asia, 1700–1900 (pp.129–155). Cambridge University Press.
- Dilli, S., Carmichael, S. G., & Rijpma, A. (2019). Introducing the historical gender equality index. Feminist Economics, 25(1), 31–57. https://doi.org/10.1080/13545701.2018.1442582
- Dong, H. (2016). Patriarchy, family system and kin effects on individual demographic behavior throughout the life course: East Asia, 1678-1945. PhD Thesis in Social Science, HKUST.
- Dyson, T., & Moore, M. (1983). On kinship structure, female autonomy, and demographic behavior in India. Population and Development Review, 9(1), 35–60. https://doi.org/10.2307/1972894
- Ebenstein, A. (2014). Patrilocality and missing Women. Hebrew University of Jerusalem, Department of Economics. https://ssrn.com/abstract=2422090
- Ehmer, J. (2021). A historical perspective on family change in Europe. In N. F. Schneider & M. Kreyenfeld (Eds.) Research handbook on the sociology of the family. Pp. 143–161. Elgar Online.
- Evans, A. (2019). How cities Erode gender inequality: A new theory and evidence from Cambodia, Gender & Society, 33(6),961–984. https://doi.org/10.1177/0891243219865510
- Falkingham, J., & Gjonça, A. (2001). Fertility transition in Communist Albania, 1950-90. Population Studies, 55(3),309–318. https://doi.org/10.1080/00324720127699
- Folbre, N. (2021). Rise and decline of patriarchal systems. Verso.
- Garenne, M. (2008). Heterogeneity in the sex ratio at birth in European populations. Genus, 64(3–4), 99–108. https://www.jstor.org/stable/41430853
- Goody, J. (1975). Production and reproduction: A comparative study of the domestic domain. Cambridge University Press.
- Greenhalgh, S. (2013). Patriarchal demographics? China’s sex ratio reconsidered. Population and Development Review, 38(s1), 130–149. https://doi.org/10.1111/j.1728-4457.2013.00556.x
- Grogan, L. A. (2015). Geology, household formation rules and the demand for sons in vietnam. University of Guelph, Department of Economics. https://ssrn.com/abstract=2563597
- Grogan, L. A. (2018). Strategic fertility behaviour, early childhood human capital investments and gender roles in Albania. University of Guelph, Department of Economics. https://ssrn.com/abstract=2615504
- Gruber, S., & Szołtysek, M. (2016). The patriarchy index: A comparative study of power relations across historical Europe. The History of the Family, 21(2), 133–174. https://doi.org/10.1080/1081602X.2014.1001769
- Guilmoto, C. Z. (2009). The sex ratio transition in Asia. Population and Development Review, 35, 519–549. 3 https://doi.org/10.1111/j.1728-4457.2009.00295.x
- Guilmoto, C. Z. (2012). Son preference, sex selection, and kinship in vietnam. Population and Development Review, 38(1),31–54. https://doi.org/10.1111/j.1728-4457.2012.00471.x
- Guilmoto, C. Z., & Oliveau, S. (2007). Sex ratio imbalances among Children at micro-level: China and India compared. Population Association of America 2007 Annual Meeting, Mar 2007, New York, United States. HAL Open Science. https://halshs.archives-ouvertes.fr/halshs-00296636
- Hajnal, J. (1982). Two kinds of preindustrial household formation system, Population and Development Review, 8, 449–494. 3 https://doi.org/10.2307/1972376
- Halpern, J. M., Kaser, K., & Wagner, R. A. (1996). Patriarchy in the Balkans: Temporal and cross-cultural approaches. The History of the Family, 1(4), 425–442. https://doi.org/10.1016/S1081-602X(96)90011-1
- Hanlon, G. (2016). Routine infanticide in the West 1500-1800. History Compass, 14(11),535–548. https://doi.org/10.1111/hic3.12361
- Hazarika, G., Jha, C. K., & Sarangi, S. (2019). Ancestral ecological endowments and missing women. Journal of Population Economy, 32, 1101–1123. 4 https://doi.org/10.1007/s00148-018-0723-y
- Henry, L. (1968). The Verification of data in historical demography. Population Studies, 22(1), 61–81. https://doi.org/10.1080/00324728.1968.10405526
- Higgs, E., Jones, C., Schürer, K., & Wilkinson, A. 2013. Integrated Census Microdata (I-CeM) Guide. University of Essex, Department of History. https://www.nappdata.org/napp/resources/enum_materials_pdf/sample_design_gb1851a.pdf (Accessed: 22 June 2020)
- Hijmans, R. J. (2020). raster: geographic data analysis and modeling. R package version 3.3-13.https://CRAN.R-project.org/package=raster
- Horrell, S., & Oxley, D. (2016). Gender bias in nineteenth-century England: Evidence from factory children. Economics and Human Biology, 22, 47–64. https://doi.org/10.1016/j.ehb.2016.03.006
- Jayachandran, S. (2015). The roots of gender inequality in developing countries. Annual Review of Economics, 7(1),63–88. https://doi.org/10.1146/annurev-economics-080614-115404
- Jayachandran, S. (2017). Fertility decline and missing women. American Economic Journal. Applied Economics, 9(1),118–139. https://doi.org/10.1257/app.20150576.
- Jha, C. K., & Sarangi, S. (2020). Arable land in antiquity explains modern gender inequality. Munich Personal RePEc Archive. https://mpra.ub.uni-muenchen.de/104336/MPRA Paper No. 104336
- Johansson, S. R. (1984). Deferred infanticide: Excess female mortality during childhood. In Infanticide: Comparative and Evolutionary Perspectives, (Eds.) G. Hausfater & S. B. Hrdy, pp.463–485. Aldine.
- Johansson, S., & Nygren, O. (1991). The missing girls of China: A new demographic account. Population and Development Review, 17(1), 35–51 https://doi.org/10.2307/1972351
- Kandiyoti, D. (1988). Bargaining with patriarchy. Gender and Society, 2(3), 274–290. https://doi.org/10.1177/089124388002003004
- Kaplan, M. A. (1985) (Ed.). The marriage Bargain: Women and dowries in European history. Harrington Press.
- Kishor, S. (1993). ”May God Give Sons to All”: gender and child mortality in India. American Sociological Review, 58(2), 247–265. https://doi.org/10.2307/2095969
- Klasen, S., & Wink, C. (2003). “Missing women”: Revisiting the debate. Feminist Economics, 9(2–3): 263–299. https://doi.org/10.1080/1354570022000077999
- Knodel, J., & De Vos, S. (1980). Preferences for the sex of offspring and demographic behavior in eighteenth- and nineteenth-century Germany: An examination of evidence from village Genealogies. Journal of Family History, 5(2),145–166. https://doi.org/10.1177/036319908000500202
- Kok, J. (2017). Women’s agency in historical family systems. In J. L. Van Zanden, A. Rijpma, & J. Kok (Eds.) Agency, gender, and economic development in the world economy 1850-2000: testing the Sen hypothesis (pp. 10–50). Routledge.
- Kolk, M. (2011). Deliberate birth spacing in nineteenth century northern Sweden. European Journal of Population, 27(3), 337–359. https://doi.org/10.1007/s10680-011-9228-z
- Laslett, P. (1977). Characteristics of the Western family considered over time, In P. Laslett, (Ed.), Family life and illicit love in earlier generations. Essays in historical sociology. Cambridge University Press, pp. 12–49.
- Lee, J. Z., Campbell, C., & Bengtsson, T. (2004). Agency and demography: Eurasian comparisons of life under pressure.In Bengtsson, T., Campbell, C., & Lee, J. Z. (Eds.) Life under pressure: Mortality and living standards in Europe and Asia, 1700-1900 (pp. 431–440). MIT Press.
- Lee, J. Z., & Wang, F. (1999). One quarter of humanity: Malthusian mythology and Chinese realities, 1700–2000. Harvard University Press.
- Lee, J. Z., Wang, F., & Campbell, C. (1994). Infant and child mortality among the qing nobility: Implications for two types of positive check. Population Studies, 48:3, 395–411 3 https://doi.org/10.1080/0032472031000147936
- Levi, L. (1854). Resume of the statistical congress, held at brussels, september 11th, 1853, for the Purpose of introducing unity in the statistical documents of all countries. Journal of the Statistical Society of London, 17(1), 1–14. https://doi.org/10.2307/2338350
- Li, S., Wei, Y., Jiang, Q., & Feldman, M. W. (2007). Imbalanced sex ratio at birth and female child survival in China: Issues and prospects. In I. Attane & C. Z. Guilmoto, (Eds.) watering the neighbor’s garden: The growing demographic female deficit in Asia (pp. 25–48). Committee for International Cooperation in National Research in Demography.
- Lynch, K. A. (2011). Why weren’t (many) European women “missing”? History of the Family, 16, 250–266. 3 https://doi.org/10.1016/j.hisfam.2011.02.001
- Malhotra, A., Vanneman, R., & Kishor, S. (1995). Fertility, dimensions of patriarchy, and development in India. Population and Development Review, 21(2), 281–305. https://doi.org/10.2307/2137495
- Manfredini M., Breschi, M., & Fornasin, A . (2017). Mortality differentials by gender in the first years of life: the effect of household structure in casalguidi, 1819-1859. Essays in Economic & Business History, 35(1), 291–314. https://www.ebhsoc.org/journal/index.php/ebhs/article/view/45/34
- Manfredini, M., Breschi, M., & Fornasin, A. (2016). Son preference in a sharecropping society: Gender composition of children and reproduction in a pre-transitional Italian community. Population, 4(4),641–658. https://www.jstor.org/stable/26383269
- Marco-Gracia, F. J., & Beltrán Tapia, F. J. (2021). Son preference, gender discrimination, and missing girls in rural Spain, 1750–1950. Population and Development Review. 47 3 665–689 https://doi.org/10.1111/padr.12406
- Mason, K. O. (1997). Explaining fertility transitions. Demography, 34, 443–454. 4 https://doi.org/10.2307/3038299
- McNay, K., Humphries, J., & Klasen, S. (2005). Excess female mortality in nineteenth-century England and Wales. Social Science History, 29(4),649–681. https://doi.org/10.1017/S0145553200013341
- Miller, B. D. (1989). Changing patterns of juvenile sex ratios in rural India: 1961 to 1971. Economic and Political Weekly, 24(22), 1229–1236. https://www.jstor.org/stable/4394899
- Miller, B. D. (2001). Female-selective abortion in Asia: Patterns, policies, and debates. American Anthropologist, 103(4), 1083–1095. https://doi.org/10.1525/aa.2001.103.4.1083
- Mitterauer, M. 1981. Komplexe Familienformen in sozialhistorischer Sicht. Ethnologia Europaea, 12, 47–86. 1 https://doi.org/10.16995/ee.1861
- Moghadam, V. (2004). Patriarchy in transition: Women and the changing family in the middle east. Journal of Comparative Family Studies, 35(2), 137–162 https://doi.org/10.3138/jcfs.35.2.137
- Pande, R., & Astone, N. (2007). Explaining son preference in rural India: The independent role of structural versus individual factors. Population Research and Policy Review, 26(1), 1–29. https://doi.org/10.1007/s11113-006-9017-2
- Park, C. B., & Cho, N.-H. (1995). Consequences of son preference in a low-fertility society: Imbalance of the sex ratio at birth in Korea. Population and Development Review, 21, 59–84. 1 https://doi.org/10.2307/2137413
- Poska, A. (2013). Upending patriarchy: Rethinking marriage and family in early modern Europe. In The ashgate research companion to women and gender in early modern Europe, (Eds.) A. M. Poska, J. Couchman, & K. McIver, 195. Ashgate Press.
- Quanbao, J., Shuzhuo, L., & Marcus, W. F. (2011). Demographic consequences of gender discrimination in China: Simulation analysis of policy options. Population Research and Policy Review, 30(4), 619–638. https://doi.org/10.1007/s11113-011-9203-8
- Rahman, L., & Rao, V. (2004). the determinants of gender equity in India: Examining dyson and moore’s thesis with new data. Population and Development Review, 30, 239–268. 2 https://doi.org/10.1111/j.1728-4457.2004.012_1.x
- Ramankutty, N., Foley, J. A., Norman, J., & McSweeney, K. (2002). The global distribution of cultivable lands: Current patterns and sensitivity to possible climate change. Global Ecology and Biogeography, 11, 377–392. 5 https://doi.org/10.1046/j.1466-822x.2002.00294.x
- Reher, D. S. (1998). Family ties in Western Europe: Persistent contrasts. Population and Development Review, 4(2), 203–234. https://doi.org/10.2307/2807972
- Rosenzweig, M. R., & Schultz, T. P. (1982). Market opportunities, genetic endowments, and intrafamily resource distribution: Child survival in rural India. American Economic Review, 72(4), 803–815. http://www.jstor.org/stable/1810018?origin=JSTOR-pdf
- Rossi, P., & Rouanet, L. (2015). Gender preferences in Africa: A comparative analysis of fertility choices. World Development, 7, 326–345.https://doi.org/10.1016/j.worlddev.2015.03.010
- Rowland, R. (2002). Household and family in the Iberian Peninsula, Portuguese Journal of Social Science, 1(1), 62–75. https://doi.org/10.1386/pjss.1.1.62
- Ruggles, S., Roberts, E., Sarkar, S., & Sobek, M. (2011). The North Atlantic population project: Progress and prospects. Historical Methods, 44, 1–6. 1 https://doi.org/10.1080/01615440.2010.515377
- Sandström, G., & Vikström, L. (2015). Sex preference for children in German villages during the fertility transition. Population Studies, 69(1), 57–71. https://doi.org/10.1080/00324728.2014.994667
- Scalone, F., & Dribe, M. (2017). Testing child-woman ratios and the own-children method on the 1900 Sweden census: Examples of indirect fertility estimates by socioeconomic status in a historical population. Historical Methods: A Journal of Quantitative and Interdisciplinary History, 50(1), 16–29. DOI: 10.1080/01615440.2016.1219687
- Schürer, K., Garret, E. M., Hannaliis, J., & Reid, A. (2018). Household and family structure in England and Wales (1851–1911): Continuities and change. Continuity and Change, 33, 365–411. 3 https://doi.org/10.1017/S0268416018000243
- Sen, A. (1983). Economics and the Family. Asian Development Review, 1(2),14–21.
- Singh, A., Chokhandre, P., Singh, A., Barker, K., Kumar, K., McDougal, L., James, K. S., & Raj, A., (2021). Development of India patriarchy index: Validation and testing of temporal and Spatial patterning. Social Indicators Research, 159, 351–377. 1 https://doi.org/10.1007/s11205-021-02752-1
- Skinner, G. W. (1997). Family systems and demographic processes. In D. I. Kertzer & T. Fricke (Eds.), Anthropological demography: Toward a new synthesis (pp. 53–95). University of Chicago Press.
- Smuts, B. (1995). The evolutionary origins of patriarchy. Human Nature, 6(1), 1–32. https://doi.org/10.1007/BF02734133
- Solati, F. (2017). Women, work, and patriarchy in the middle east and North Africa. Palgrave.
- Spoorenberg, T. (2007). Quality of age reporting: Extension and application of the modified whipple’s index. Population-E, 62(4), 729–742. https://doi.org/10.3917/pope.704.0729
- Spoorenberg, T. (2016). On the masculinization of population: The contribution of demographic development ‒ A look at sex ratios in Sweden over 250 years. Demographic Research, 34(37), 1053‒1062. https://doi.org/10.4054/DemRes.2016.34.37
- Stewart, J. Q., & Warntz, W. (1958). Macrogeography and social science. Geographical Review, 48, 167–184. 2 https://doi.org/10.2307/212129
- Szołtysek, M. (2015a). Households and family systems in early modern Europe. In book: The oxford handbook of early modern european history, 1350-1750, volume i: peoples and place. Oxford University Press, H. Scott,(Ed.) pp.313–341
- Szołtysek, M. (2015b). Rethinking East-central Europe: Family systems and co-residence in the Polish-Lithuanian Commonwealth (2 vols). Peter Lang.
- Szołtysek, M., & Gruber, S. (2014). Living arrangements of the elderly in two Eastern European joint-family societies: Poland-Lithuania around 1800 and Albania in 1918. The Hungarian Historical Review, 3(1), 61–100. https://www.jstor.org/stable/43265191
- Szołtysek, M., & Gruber, S. (2016). Mosaic: Recovering surviving census records and reconstructing the familial history of Europe. The History of the Family, 21(1), 38–60. https://doi.org/10.1080/1081602X.2015.1006655
- Szołtysek, M., Klüsener, S., Poniat, R., & Gruber, S. (2017). The patriarchy index: A new measure of Gender and generational inequalities in the past. Cross-Cultural Research, 51(3),228–262. https://doi.org/10.1177/1069397117697666
- Szołtysek, M., & Ogórek, B. (2020). How many household formation systems were there in historic Europe? A view across 256 regions using partitioning clustering methods. Historical Methods: A Journal of Quantitative and Interdisciplinary History, 53(1), 53–76. https://doi.org/10.1080/01615440.2019.1656591
- Szołtysek, M., Ogórek, B., Gruber, S., & Beltrán Tapia, F. J. (2022). Inferring “missing girls” from child sex ratios in historical census data. Historical Methods: A Journal of Quantitative and Interdisciplinary History, 1–24. Online First. https://doi.org/10.1080/01615440.2021.2014377
- Szołtysek, M., Ogórek, B., Poniat, R., & Gruber, S. (2020). Making a place for Space: A demographic spatial perspective on living arrangements among the elderly in historical Europe. European Journal of Population, 36, 85–117. 1 https://doi.org/10.1007/s10680-019-09520-5
- Szołtysek, M., & Poniat, R. (2018). Historical family systems and contemporary developmental outcomes: What is to be gained from the historical census microdata revolution? The History of the Family, 23(3),466–492. https://doi.org/10.1080/1081602X.2018.1477686
- Tandrayen-Ragoobur, V. (2021). Building the patriarchy index for sub-saharan africa: Perceptions and acceptance of violence matter most. In V. F. Bruey (Ed.), Patriarchy and Gender in Africa. Lexington Books.
- Thayn, J. B. (2017). Eigenvector spatial filtering and spatial Autoregression. In Encyclopedia of GIS [electronic resource], (Eds.) S. Shekhar, H. Xiong, & X. Zhou, 511–522 Springer.
- Therborn, G. (2004). Between sex and power: Family in the World, 1900-2000. London Routledge.
- Van Zanden, J. L., De Moor, T., & Carmichael, S. (2019). Capital women: The European marriage pattern, female empowerment and economic development in Western Europe 1300-1800. Oxford University Press.
- Verdon, M. (1998). Rethinking households: An atomistic perspective on European living arrangements. Routledge.
- Walby, S. (1990). Theorizing patriarchy. Basil Blackwell.
- Wheaton, R. (1975). Family and kinship in Western Europe: The problem of the joint family household. Journal of Interdisciplinary History, 5(4), 601–628. https://doi.org/10.2307/202861
- Wiesner-Hanks, M. (2018). Forum introduction: Reconsidering patriarchy in early modern Europe and the middle east. Gender & History, 30, 320–330. 2 https://doi.org/10.1111/1468-0424.12365
- Williamson, N. (1976). Sex preferences, sex control, and the status of women. Signs: Journal of Women in Culture and Society, 1(4), 847–862. https://doi.org/10.1086/493304
- Willigan, J. D., & Lynch, K. A. 1982. Sources and methods of historical demography. Academic Press.
- Wilson, K., & Hardy, I. (2002). Statistical analysis of sex ratios: An introduction. In Sex ratios: Concepts and research methods, (Ed.) I. Hardy, 48–92. Cambridge University Press.
- Wilson, M. F. J., O’Connell, B., Brown, C., Guinan, J. C., & Grehan, A. J. (2007). Multiscale terrain analysis of multibeam bathymetry data for habitat mapping on the continental slope. Marine Geodesy, 30(1‐2), 3–35. 1–2 https://doi.org/10.1080/01490410701295962
- Wolf, A. P. (2005). Europe and China: Two kinds of patriarchy. In T. Engelen & A. P. Wolf (Eds.), Marriage and the family in Eurasia. perspectives on the Hajnal hypothesis (pp. 215–241). Aksant.
- Woods, R. (2003). Urban-rural mortality differentials: An unresolved debate. Population and Development Review, 29(1), 29–46. https://doi.org/10.1111/j.1728-4457.2003.00029.x
- Worobec, C. (1995). Peasant Russia: family and community in the post-emancipation period. Northern Illinois University Press.
- Zarulli, V., Barthold Jones, J. A., Oksuzyan, A., Lindahl-Jacobsen, R., Christensen, K., & Vaupel, J. W. (2018). Women live longer than men even during severe famines and epidemics. Proceedings of the National Academy of Sciences 115(4):E832–E840. https://doi.org/10.1073/pnas.1701535115
Appendix
Infant Mortality Rates
The IMRs were derived from a novel dataset by Beltran Tapia et al. (2021) based on the available regional statistics and the voluminous secondary literature (section B in the supplemental online material). The IMR data correspond both geographically and temporally to the spatial units in our data for England, Wales, and Scotland; for Sweden; for most of the Flemish and Dutch data; as well as for parts of Denmark. For the remaining locations, collecting relevant data may have involved either bottom-up or top-down extrapolation of available information. Except for GB, Sweden, Norway, NL, and Belgium, as well as for some parts of Germany, the IMR data for the majority of locations could be found for dates only roughly approximating particular census dates, and most often for periods subsequent to the census. Finally, in some instances, our regions consisted of populations spread across administrative units with different values of infant mortality, which required averaging across multiple spatial units.
Child-woman ratio
CWR is a net (effective) fertility measure computed by dividing the number of children under the age of five by the number of women aged 15–49 (see, Willigan & Lynch, Citation1982; Scalone and Dribe Citation2017).
Fertility Onset
In order to assess whether the fertility trends in the particular populations in our database preceded the onset of a monotonic fertility decline, our regional data were matched (by means of a spatial joint) to the corresponding province-level estimates of the onset of the fertility decline derived from Coale and Watkins (Citation1986; for territories not covered by the Princeton data, such as Albania and Siberia, we used Falkingham and A. Coale & Anderson et al., Citation1979; Falkingham & Gjonça, Citation2001). A dummy variable was then created that indicated whether a given population at a specific census time belonged to a province that had or had not already experienced the onset of monotonic fertility decline (following Coale’s definition of the decline of fertility as measured by his Ig below 90% of a previous plateau).
Infants over children 0–4
This is the proportion of children under one year old over the 0–4 age group.
Census quality
Following the Statistical Congress of 1853 (Levi, Citation1854, esp. 5), we created dummy variables dividing our samples by the extent of control over the management of the census by trained personnel. We distinguished between ‘modern state censuses’ (29% of our regions; the reference category), which were carried out by ‘special agents, or enumerators’, and which had clearly formulated rules regarding the collection of information on a set of individual characteristics (place and date of birth, as well occupation); ‘pre-modern state censuses’ (44% of the regions), which were carried out by various sorts of clerical or semiclerical staff, but lacked the level of detail of more modern censuses (e.g., regarding the date or place of birth); and ‘other censuses’ (27%), which were all of the remaining listings, particularly various types of church lists of parishes or manorial-estate listings.
Ruggedness
To derive information on terrain ruggedness, we used the terrain ruggedness index (Wilson et al., Citation2007), while applying the focal function in the R library raster. Data were obtained from the GTOPO30 elevation raster dataset, which is a global digital elevation model with a horizontal grid spacing of 30 arcseconds.
F/M Age-heaping
This is a female-to-male ratio in age-heaping computed using the Total Modified Whipple’s Index (Wtot; see, Spoorenberg, Citation2007). Wtot considers preference for and avoidance of all 10 digits, rather than only those based on rounding one’s age on a number ending with a five or a zero, while retaining the linearity and rectangularity over a five-year age range and the 23–62 age interval principles of the original Whipple’s Index. Wtot has been shown to be most suitable for capturing digit preference in the NAPP data considered here (see, Szołtysek & Poniat, Citation2018).
Urban-rural
In Mosaic, regions were divided by default into rural and urban categories based on the information provided in the listings. For the NAPP data from Denmark, Norway, and Sweden, the official IPUMS-I rules were followed, which – as in Mosaic – identified rural populations based on the legal or administrative status of a settlement. Note that for Norway’s 1801 census we used the variable ‘TownNO’, and counted all people not living in one of the coded 26 towns as being rural. Accordingly, given that Iceland in 1703 had no city (and no information about urban or rural residence), it was treated as wholly rural. For the British censuses considered in this research, the IPUMS-I codes were followed, which defined households ‘as urban if they are located in a parish with a population density of more than 75 persons per acre’ (as in the Integrated Census Microdata Project that provided the British data for NAPP; see, Higgs et al., Citation2013, p. 176). While neither of the baseline definitions just mentioned prescribed that all of the individuals in such places must have been engaged in the primary sector, in the majority of the settlements identified in the Mosaic data, this was usually the case. Note that in order to ensure measurement comparability, all Mosaic and relevant NAPP data with dichotomous measures of rurality have been turned into proportions.
Population Potential
In deriving the population potential variable, we used global population count raster data obtained from the History Database of the Global Environment (HYDE), Version 3.2 (https://dataportaal.pbl.nl/downloads/HYDE/). These data were re-projected to a Lambert Azimuthal Equal Area projection. The population potential measure gives the population situated nearby more weight than the population further away (see, Stewart & Warntz, Citation1958). Thus, the locations surrounded by areas with high population numbers have a higher population potential than the locations surrounded by sparsely populated areas. We produced this measure using the stewart-command in the R-library SpatialPosition with the following specifications: span = 100, 000; b = 2; typefct = exponential. For the Mosaic dataset, we used the coordinates for each below-regional location to generate the population potential, and then used the population-weighted mean to obtain the values for each of Mosaic regions. For the NAPP regional data, we used as a coordinate the location of the raster point within the NAPP region that had the highest population density in 1800 according to the HYDE database, rather than taking the geographical or population-weighted centroids of the NAPP polygons, which might have been situated in sparsely populated subareas of these regions.
Land Suitability for Agriculture
We used the composite measure developed by Ramankutty et al. (Citation2002). For each grid cell of the raster data, this measures provides the probability that a particular grid cell may be cultivated by combining climate indicators (growing degree days and water availability) and soil indicators (the climatic characteristics are based on the mean-monthly climate conditions for the 1961–1990 period). The LSA index was extracted from the adequate raster files with use of the ‘extract’ function in the ‘raster’ R package (Hijmans, Citation2020). For each region in our database (district polygons for NAPP and residential points for Mosaic) a population-weighted centroid was derived first, and the value of the variables reflect the mean around that point. The buffer size was set to 50 km to better capture the local variation in environment, and to avoid the problem of missing data for Islands close to the coast. As land suitability is based on time-invariant measures of temperature and soil quality, its value does not depend on the time period of the Mosaic/NAPP data. Note that the land suitability for Gotland was assumed to be equal to the that for Kalmar, and that the land suitability for Shetland was assumed to be equal to that for Orkney.
Share croplands
We derived these data from the History Database of the Global Environment (HYDE 3.1 ; https://dataportaal.pbl.nl/downloads/HYDE/) following the same procedures as in the case of land suitability (above). However, given that the share of cropland from HYDE 3.1 is available for each decade after 1700, for each region in our collection, we used the raster for the date that is closest to the respective date of enumeration.
Table A1. Descriptive statistics.
Appendix
Table A2. Patriarchy and child sex ratios (full model results).
Appendix
Table A3. No prior weights (excluding locations with less than 1,000 children).
Appendix
Table A4. Quasibinomial model (accounting for overdispersion).
Appendix
Table A5. Spatial autocorrelation. Moran’s Eigenvectors.
Appendix
Table A6. The components of the PI and child sex ratios (different ages).