
ABSTRACT
The relationship between gender and mortality in nineteenth-century Europe has been highly debated. In particular, historians disagree about the manner and degree to which gender discrimination affected the mortality risk of the female population. This article contributes by examining the evidence of gendered mortality differences among children and adolescents in nineteenth-century Denmark. It makes use of both child sex ratios and mortality rates to explore the prevalence of excess female mortality. We show that the female mortality rate in Denmark was higher than that of males starting from around age four and lasting until adulthood, for the majority of the nineteenth century. This mortality gap, while initially narrow, was systematic and most pronounced in rural areas and during late adolescence. The gap was produced by a faster mortality decline among males. This pattern is clear both in time, as the gap widened during the nineteenth century, and during the life course, as the male mortality rate declined faster and reached lower levels during late childhood and early adolescence. While it is possible that various forms of gender discrimination slowed the mortality decline of females, the aggregated nature of the data limits our interpretation. However, by comparing the two mortality measures employed, we argue that in a low child-mortality setting such as Denmark, sex ratios are not always sensitive enough to measure excess female mortality in childhood. Further, since sex ratios primarily excel at measuring ‘hidden’ or unregistered mortality, they may be a suboptimal measure of mortality differences in the presence of a thorough and reliable vital registration system.
1. Introduction
Today in the Western world, females live longer than men and experience a lower risk of dying at all ages (Zarulli et al., Citation2021). This is not the case globally. In several parts of the world, but most notably in China and India, the female mortality risk is higher than males during large parts of the life course. We know this from population sex ratios, which show an over-representation of males in these areas, compared to an excess of women in the West (Bongaarts & Guilmoto, Citation2015). The skewed sex ratios indicate a gender difference in mortality risk, which is generally explained as an outcome of sex-selective abortions, as well as higher female mortality rates due to discrimination, and in some cases higher exposure to diseases (Arnold et al., Citation2002; Das Gupta, Citation2005; Sen, Citation1990). Some of the latter factors may have been present in pre-modern Europe, but it is still unclear when, where and how they shaped patterns of sex-specific mortality risks.
For the youngest age groups, it has been taken somewhat for granted that in the nineteenth century, practices of mortal discrimination against girls, such as lethal neglect and female infanticide, were phenomena mostly found in Asia. They were generally uncommon in Europe and certainly very rare in north-western Europe (Lynch, Citation2011). In recent years, however, a number of studies have used child sex ratios as a method to re-address the issue of gender differences in child mortality in nineteenth-century Europe. With this approach, the child sex ratio (number of males per 100 females in a given age group) is compared to the expected ‘neutral’ level, which is an estimate of what the ratio should be, given a certain infant mortality rate and no impact of discrimination on mortality risk. These studies have found abnormally high sex ratios among children, where an excess of boys indicates that gender discrimination could have impacted the mortality of girls. For now, however, these findings are limited to parts of Southern and Eastern Europe (Beltrán Tapia & Gallego-Martínez, Citation2017; Beltrán Tapia & Marco-Gracia, Citation2021; Beltrán Tapia & Raftakis, Citation2021).
This article contributes to the literature using evidence from nineteenth-century Denmark. The Danish population was small and predominantly rural (still below 2 million people in 1880) and had relatively low infant and early childhood mortality. Births and deaths were registered thoroughly in Denmark, which means that the issues of under registration, that often hamper sex ratio studies, are less likely to impact our analysis (Beltrán Tapia & Raftakis, Citation2021; Szołtysek et al., Citation2022). Further, a bevy of both individual-level and aggregated sources are preserved, digitized and available for analysis. In this context, as a low-mortality country and representative of the north-west European household formation system, Denmark makes for an interesting case. Thus, the aim of this article is to examine the evidence of excess female mortality in childhood and youth in nineteenth- and early twentieth-century Denmark. We take inspiration from the new insights offered by the literature on missing girls and thus combine the use of child sex ratios with age-specific mortality rates. This is based on a mixture of individual-level data and published statistical sources. While the analysis focuses on the nineteenth century, we do include earlier and later periods based on availability.
The first part of the article reviews the existing research on gender differences in mortality in the nineteenth century. The second part discusses the relevant historical context of nineteenth-century Denmark, concerning family types and the role of women, in a European perspective. The third part presents the data used in our analysis: the Danish historical published statistics and the Danish Demographic Database, from which child sex ratios have been calculated. The fourth part presents our results in the following order: sex ratios at birth, child sex ratios and mortality rates and ratios. Lastly, we discuss our main findings and their implications.
2. Measuring gender differences in mortality
2.1. Sex ratios in nineteenth-century Europe
The sex ratio approach to unravel and examine sex-specific mortality inequalities was popularized by Amartya Sen (Citation1990). In the absence of direct mortality data, Sen argued that the sex ratio of the living population could be indicative of sex-specific mortality inequalities at all ages if, for instance, there is a significant excess of males in a given population. The method proved viable for measuring excess female mortality for places and periods with less reliable mortality data. While Sen drew attention to the many causes of excess female mortality throughout the life course, Monica Das Gupta turned her attention towards ‘missing girls’, by employing sex ratios as a method to examine the specific relationship between gender discrimination and childhood mortality in Asia. Girls are said to have a biological survival advantage over boys in childhood, but Das Gupta (Citation2009) has argued that the opposite relationship prevails in settings with a strong son-preference, where certain forms of neglect lead to higher female child mortality.
The ‘female survival advantage’, a term describing the often-observed pattern of male excess mortality in utero and in infancy, is often thought of as a biological constant (Christensen et al., Citation2001), even though it is not thoroughly understood how biological, environmental and social factors work together to produce it. Still, it was the case almost everywhere in the nineteenth century that males died more in the first years of life and particularly in infancy (Drevenstedt et al., Citation2008). Thus, since we expect to find excess male mortality in early life, sex ratios showing a significant excess of live boys might indicate that social and cultural factors, such as gender discrimination, could have increased the mortality risk of girls.
A number of scholars have seen this as an opportunity to study macro-level sex differentials in child mortality in historical Europe using child sex ratios as a proxy for mortality. As stated above, the child sex ratio is calculated as the number of boys per 100 girls in a given age group (Beltrán Tapia & Gallego-Martínez, Citation2017; see also the introduction of this special issue). Since there are 5% more males born than females on average, most societies with very low early life mortality have a child sex ratio of 105–6 in the youngest age groups. However, sex ratios at birth and in childhood vary across different mortality regimes, so we cannot use the 105–6 benchmark in historical settings. Due to the female survival advantage in infancy, populations with high infant mortality levels will have fewer boys by nature. One solution involves calculating a theoretical ‘neutral’ sex ratio that takes into account the level of infant mortality, which can then serve as a baseline for analysis. This approach has proven useful in a number of cases from Southern and Eastern Europe, highlighting a significant excess of boys in several European regions during the nineteenth century (Szołtysek et al., Citation2022). These ‘high’ sex ratios can possibly be explained by increased infant and child mortality among girls, caused by infanticide or mortal neglect (Beltrán Tapia & Gallego‐Martínez, Citation2020).
This work shows how in the absence of mortality data, extreme sex ratios can be useful on their own or help complement mortality measures to uncover ‘hidden’ or unregistered mortality, as in the case of infanticide or sex-selective abortions. However, there is little research to indicate how sensitive they are to different levels of mortality. Does an absence of a high sex ratio mean that there were no gendered mortality differences? We aim to offer some insights into this question by comparing both measures in a setting with relatively low mortality.
2.2. Gender mortality differences in nineteenth-century Europe
It is important to note that the sex ratios of nineteenth-century Europe, and even the high ratios found in the recent scholarship, were rarely skewed as much towards boys as those in parts of Asia. In fact, in many European countries, the national-level sex ratios were rather balanced. Before the onset of the new generation of sex ratio analyses, Lynch (Citation2011) argued that there were key differences between Asia and historical Europe, particularly in household structure, marriage patterns and labour market opportunities, which resulted in fewer gender-specific forms of mortal neglect in Western Europe, when compared to Asian settings. To some extent, this prevented son-preference from negatively affecting the health of females.
It is interesting, then, that there is an extensive scholarly literature on excess female mortality in nineteenth-century Europe. Results from the Eurasia Project’s samples have shown that in all five study areas (China, Japan, Italy, Belgium and Sweden), females experienced a higher risk of dying than males, from late childhood until the end of their reproductive years, during most of the nineteenth century (Alter et al., Citation2004, p. 328). Similarly, Johansson (Citation1996), emphasized the presence of excess female mortality in England and Wales as well as in Meiji Japan. It tended to exist in age groups with relatively low mortality, and notably this pattern seems to have a spatial dimension too: Woods (Citation2000, p. 185) observed from England and Wales data that excess female mortality appears more often and is more pronounced in environments with comparatively low mortality.
While the causes of excess female mortality have been debated intensively for adult women, only a few scholars have focused on girls and young women. Tabutin and Willems (Citation1998) found that at ages 5–14, in the nineteenth century and up until the 1920s, girls had a higher risk of dying than boys in most of their observed European settings. This pattern was most pronounced in rural areas. Compared to the age group 5–14, there were larger variations in ages of 1 to 5; in some places, excess female mortality appeared at certain points in time but not in others. Furthermore, many places saw an increase in this mortality gap between girls and boys towards the end of the nineteenth century.
In broad terms, there are two lines of thought concerning the causes of excess female mortality. The first is concerned with the link between the perceived value of women and the deterioration of their health. In the family unit, a low perceived value of women and girls operated through a more or less systematic and intentional neglect, creating an unequal distribution of resources within the household (Horrell & Oxley, Citation2016; Humphries, Citation1991, p. 471; Klasen, Citation1998, pp. 462–463; McNay et al., Citation2005, p. 670). This could negatively affect the mortality risk of females (Alter et al., Citation2004, pp. 342–343). In particular, it has been argued that this form of discrimination either appeared or intensified during the modernization and commercialization of the agricultural economy during the late nineteenth century (Johansson, Citation1984). The second body of work hypothesizes that excess female mortality was caused by a purely biological increased susceptibility to infectious diseases, which was most marked during adolescence. As such, the female mortality disadvantage was not necessarily related to malnourishment and other socially or culturally induced health factors (Goldin & Lleras-Muney, Citation2019; Harris, Citation2008). Additionally, it has been argued that artificial compositional effects can mislead geographical comparisons. For example, Hinde (Citation2015) highlighted the influence of return migration on regional patterns, as young female migrants working in cities would return home if they fell ill and eventually die there.
2.3. Danish gender differences in mortality
Compared to the rest of Europe, the north-western part of the continent and especially Scandinavia had low early-life mortality in the nineteenth century. In Denmark, we know the national level infant mortality rate (IMR) starting in 1835, where it had a level of around 130–150 deaths per 1000 live births. The IMR remained steady until the onset of its decline around 1900 (Anne Løkke, Citation1998, p. 120). However, little attention has been paid to gender differences in mortality during childhood. Two studies of Danish population trends at the national level have observed that the published Danish nineteenth-century population statistics show a female mortality disadvantage from age 5 to 20 and 25 to 40 (Andersen, Citation1975; Andreev, Citation2002, p. 52). However, both ascribed it to puerperal fever and other ‘childbearing’ causes, which, for obvious reasons, is an invalid explanation for the youngest age groups. As such, there is a significant gap in the historical demographic literature concerning the relationship between gender and mortality in early life.
The nineteenth-century statisticians who published and analysed the vital statistics did, however, note an excess mortality for females in adolescence, as well as the fact that it was a rural phenomenon, and suggested possible causes. In the vital statistics for 1911–15, Jens Warming summarized the following: 1. For the 10–20 year old females, the most probable reason for excess mortality was the earlier and more radical bodily changes during puberty. 2. The deaths of rural females did not take place at town hospitals as often as the deaths of rural males, i.e. deaths of rural males were more often counted as town deaths. 3. Young women migrated to towns for work more frequently and at a younger age than men did. Warming assumed that girls in a healthy state migrated more frequently than their weaker peers and that young girls returned to their rural homes when dying, so their death counted as rural even if they acquired the illness in a town (ST 1901, 42–51). He did not explain why he expected puberty to be more lethal for girls in the countryside than in towns. However, the two other causes point to gender differences in the labour market and discriminative practices in access to care, which, more broadly taken, indicate that compositional effects are important when interpreting regional patterns of excess female mortality in Denmark.
In general, only a few studies have focused on the history of gender discrimination in Denmark at large. Most broad works on Danish history do not explicitly address gender inequality, but they often convey an implicit understanding that Danish women enjoyed significantly better conditions than their contemporaries in the rest of the world. In the nineteenth century, Danish women had for centuries had the right to consent to their own marriage, they were entitled to inherit from their parents and they could work outside the family household without losing their ‘honor’ (Bjørn, Citation1990; Feldbæk, Citation1990; Hvidt, Citation1990). Moreover, Danish rural society was an ideal exemplar of the Hajnal north-west European household formation system, in which women’s position in the household allowed more agency. Both groom and bride were around 30 years of age at marriage, and the fertile couple, not an aging patriarch, usually headed the household. Sons were not imperative for inheritance, since farmers with only daughters could transfer their farm to a daughter and a son-in-law (Hajnal, Citation1983; Johansen, Citation1975). From societal depictions in folklore, we know that several children of both sexes was preferred over only sons, but only sons were still preferred over only daughters (Møller, Citation1940). Further, Johansen (Citation1975) explored the prevalence of son-preference by looking at the sex ratio of last-born children in a sample of reconstructed parish registers, but he did not find an excess of boys.
Even though Danish women may have experienced comparatively better conditions than women elsewhere in the nineteenth century, their position in society was still inferior to that of men. For instance, until 1857, a daughter inherited half the amount that a son was entitled to (Arvelod, Citation1915), and the wages of unskilled women in the 1870s were only 40–50% those of unskilled men (S. Aage Hansen, Citation1972, p. 256). Until 1880, married women could not dispose of any money they earned by themselves (Jacobsen, Citation2007, p. 480), and until 1857, women needed a male guardian to manage their economic and legal affairs. Only widows were excepted from this Umyndighed, Citation1928). In general, there were many differences in upbringing, expectations and possibilities in life between men and women, which may not always have been discriminating, but which gave girls and women life courses that in many, if not all, aspects of life were very different from the life courses of males in the same household (B. K. Hansen, Citation2006; Rosenbeck, Citation1987).
3. Data and methods
Our study is based on census counts and vital statistics. We use the censuses in two formats: 1. The official publications of the censuses aggregated and printed as books, published regularly since the early nineteenth century, and 2. Data from The Danish Demographical Database (DDD), which features transcriptions of the original individual-level census information nationwide. The vital statistics were published in a manner similar to the aggregated censuses, and were based on parish registers. These were submitted by parish clergymen to the central administration in yearly reports, which were then aggregated for publication (Holck, Citation1901). As such, we draw on both aggregated and individual-level data for population sex ratios, but for mortality, we rely solely on aggregated data from the vital statistics.
Aggregated censuses and vital statistics were published in the book series Statistisk Tabelværk (ST)Footnote1 by a branch of the state administration, Statistisk Bureau, now Statistics Denmark (Danmarks Statistik). At the turn of the twentieth century, the statistical bureau published two impressive studies on the population history of nineteenth-century Denmark: A history of the Danish population statistics (Holck, Citation1901) and a demographic history of the population in the nineteenth century (Befolkningsforholdene Citation1905). The latter is a thoroughly-researched analysis of the long run trends in the nineteenth century population history of Denmark, built on all volumes of the Statistisk Tabelværk series, using both censuses and vital statistics. Befolkningsforholdene includes national level quinquennial data on deaths and mortality by age and sex, as well as decennial data on all births by sex from 1801 and stillbirths, live births and illegitimate births reported separately starting in 1840. When appropriate for this study, we have used the data from Befolkningsforholdene. For some analyses that require more detail, we have also supplemented these by transcribing specific tables from the original publications of the vital statistics (Statistisk Tabelværk [ST] Citation1882; Citation1886; Citation1903a; Citation1903b; Citation1908; 1913; Citation1919; Citation1924; Citation1928; Citation1934; Citation1944).
We consider the published statistics, and especially the vital statistics, very reliable, since the Danish system for registering live births nationwide was in place from 1645 and quite thorough already by the 18th century. Births were recorded at baptism, which had to take place eight days following the birth at the latest. Moreover, in order to combat what was seen as a high proportion of stillbirths, the central administration put into place a special system for reporting these, as they could neither be categorized as a baptism nor a burial. Instead, starting from 1802, midwives were required to report every stillbirth and infants who died within 24 hours after birth to the local clergyman, including a range of details on the nature and course of the birth, as well as the health and liveliness of the infant. If stillborn, the midwife listed whether the infant had died prior to, during or right after the birth as well as which remedies had been tried to bring the infant to life. The report was signed by the midwife, the clergyman, the father and two local women who had witnessed the birth. This close monitoring of stillbirths made attempts at infanticide very difficult, and moreover it is a guarantee that no live births went unregistered, as the midwife and parents were monitored and held responsible (A. Løkke, Citation2018, pp. 85–86).
As with live births, a system for the registration and reporting of all deaths was in place from 1645, when clergymen were obliged to keep parish registers containing baptisms, marriages and burials. From 1812, two identical parish registers were kept, and the clergymen made yearly reports to the central administration containing all burials, baptisms, confirmations and marriages, for both males and females, using a set of pre-printed forms (Johansen, Citation2002, p. 87). By 1832, due to a fear of ‘premature’ burials (the burial of a comatose person who was not actually dead), a new set of laws required that no corpse was to be buried before a physician (or in rural areas, two appointed laymen) had inspected it and issued a death certificate. From the complaints of contemporaries we can conclude that the coverage of the registration of deaths itself was not an issue. Rather, they focused on the poor quality of the reported causes of death (Johansen, Citation1999, pp. 156–57). Consequently, we should not expect a significant number of underreported deaths in Denmark, at least from the 1830s.
The individual-level census records are, as already mentioned, from the Danish Demographic Database (DDD; Clausen, Citation2015). This data has been continually transcribed by volunteers in a project that started in 1992, coordinated by the Danish National Archives. To date, it holds more than 20 million records, but not all censuses are yet fully transcribed. For the purposes of this article, we make use of the complete transcriptions of the censuses 1787, 1801, 1834, 1845, 1850, 1860, 1880 and 1901, accounting for 11.9 million records. These datasets have been re-processed and standardized by the Link-Lives project (Revuelta-Eugercios et al., Citation2021).
The two main variables for calculating sex ratios, age and sex, have required specific treatment. As with most early population counts, the Danish censuses did not include sex on the pre-printed census forms before 1870. For this reason, contemporary statisticians interpreted the sex based on first name, household position and other variables when aggregating the sources for the published statistics. In DDD, volunteers derived the sex in a similar fashion during transcription; however, since they were not explicitly required to do so, the coverage is incomplete. Overall, the coverage of the transcribed sex is 62% (58, 52, 74, 49, 39, 89% in the 1787, 1801, 1834, 1845, 1850, and 1860 censuses, respectively). In order to increase the coverage, a neural network (NN) was trained to predict the sex of a person, based on their name and position in household. The NN was trained using the samples where the transcribers had already interpreted the sex. Given that the transcriber had access to name, position in household, civil status, the contextual information of the household, and sometimes occupation and other relevant information, it was in the vast majority of cases a straightforward task to assign the correct sex. The training data consists of the sex from more than 4.6 million individuals and with no fewer than 480,000 for any given census. Based on the training data it was calculated how often a given name or household position is classified as male or female. This statistic was used to convert every name and household position into features, which the NN in turn could use to predict the sex. The results appear highly reliable, with a precision score of between 99.2% and 99.7% (Revuelta-Eugercios et al., Citation2022).Footnote2
The way age was reported changed in 1870 as well. Before then, individuals were asked for their age rounded up to their next birthday, but from 1870, they were asked to list their attained age. For a proper comparison between the pre- and post-1870 censuses, we adjusted the pre-1870 age data by subtracting 1 from the value. It is obvious that this does not solve the issue completely, and that even despite changing ways of reporting it, age is never a fully precise variable in nineteenth-century census data, as other work has shown (A’Hearn et al., Citation2022).
The results of our data treatment can be compared directly with the sex ratios in the nineteenth century published statistics, as the contemporary compilers faced the same issues. At the national level, the sex ratios should be roughly identical across both sources. Since the age groups reported in the statistical publications were not uniform across the years,Footnote3 we aggregated the individual-level censuses to the relevant group for each census year for proper comparison (see Appendix 1). In 1880 and 1901, where the sex was transcribed directly from the original source, the sex ratios are almost identical between the two sources. Both the transcribed and NN-estimated sex ratios are close to the statistics in 1850 and 1860, but 1845 shows more divergence. The wide age brackets used in the statistics in 1787–1834 makes comparison difficult, but the sex ratios in the individual-level data appear to be slightly off, except for at ages 1–10 in 1787 and 1801, where the NN-estimated sex ratio is similar to that in the published statistics. It is important to keep these patterns in mind during analysis. Based on this comparison, we decided to use the NN-estimated sex for the years where we do not have full information, due to its greater coverage in the data and resemblance with the sex ratios in the published statistics.
4. Results
4.1. Sex ratios at birth
Sex ratios at birth (SRB) help us to establish the differences early in life. For the period 1840–1900, the national average hovers at around 105 boys per 100 girls, which is the expected level for historical Western Europe. Legitimate and illegitimate births have very similar values, with larger sex ratio for illegitimate births in the beginning and towards the end of the period see . This pattern was driven mostly by the rural areas, as rural births accounted for 80 and 69% of the total number of births in 1840 and 1900, respectively. The rate of illegitimate births varied quite a bit throughout the period in the urban areas, with high sex ratios in some decades and low ratios in others. Here, the provincial towns and Copenhagen have been grouped together to increase sample size and, thus, the higher share of illegitimate births occurring in urban areas in 1900 was a result of the growth of Copenhagen. We should interpret these deviations in the illegitimate ratios with care, as births out of wedlock only corresponded to 11.6% of the total number of births.
Figure 1. Sex ratio at birth (number of male live births per 100 female) in Denmark 1840–1900 calculated by decade.
Given that some of the larger differences between illegitimate and legitimate births can be seen in all areas for the later period, we investigated possible geographical differences with data from the 1880s (Statistisk Tabelværk, Fjerde rk., litra A, No 7, Citation1893). We found that there was some variation between regions for illegitimate births, while there was none for children born within wedlock. The sex ratio at birth was slightly higher than average in Jutland and slightly lower on Zealand (which includes Copenhagen). On the Baltic island of Bornholm, the ratio was extremely high (120), but that is likely a result of random variation since there were only 398 illegitimate births there in the 1880s. Thus, at the national level and likely also regionally, there is no sign of consistently elevated sex ratios at birth – that is, significantly more boys that we would expect – in nineteenth-century Denmark. We do find examples of deviating numbers for illegitimate births, but from the data examined here it is unclear as to whether or not to attribute them to random variation.
4.2. Child sex ratios calculated from individual level census data
It is challenging to discern sex-specific mortality differences from sex ratios of live children in historical settings, as excess mortality in certain places or at specific points in time can distort the pattern, particularly if caused by a disease that affects boys more than girls or vice versa. In that regard, it is somewhat artificial to speak of a ‘neutral sex ratio’ – that is, the ratio we would expect given regular levels of mortality and without an influence of gender discrimination. Still, it is a necessary practice for us to be able to distinguish disproportionally high or low sex ratios, as done by Beltrán Tapia and Gallego-Martínez (Citation2017) for nineteenth-century Spain. We will replicate their approach in our analysis. It is worth repeating that most developed countries today exhibit sex ratios of approximately 105–106 at birth and in the youngest age groups. In nineteenth-century Europe, however, it would have been lower due to a higher IMR and the survival advantage of girls in the first few years of life. Based on a comparison of the IMR and mean sex ratios across Europe, and given the average pre-decline IMR of around 140, we would expect a neutral sex ratio of roughly 101–2 boys per 100 girls in Denmark in the second half of the nineteenth century.
The child sex ratio in the Danish censuses lay roughly at the expected level from the 1834 census onwards, as shows. Among the exceptions are the 10–14-year olds in 1834, where the ratio was slightly higher, and the 0-4-year olds in 1850, where the ratio was lower. The sex ratios of 0-4- and 5-9-year olds were lower in both 1787 and 1801. While we do not have data on the national level IMR prior to 1835, we suspect that these low ratios reflect a generally higher level of infant mortality. If that is the case, it is notable that that the sex ratio for early teens was quite high in 1787. Aside from this observation, however, we see no further evidence to indicate particularly high or low sex ratios in Denmark, although, as with all aggregates, it may conceal regional differences.
Figure 2. Child sex ratios (number of males per 100 females) in Denmark in different age groups in the eight censuses from 1787 to 1901. The dotted line shows the very rough estimate of a ‘neutral’ sex ratio at 101.5. The Danish Demographic Database and the Link-Lives project.
In examining sex ratios for smaller units, random noise becomes an important issue, especially if the sex ratio levels that we would consider abnormal are minor. Several studies have discussed how sex ratios vary depending on the sample size. In a sensitivity analysis, Guilmoto and Oliveau (Citation2008) conclude that with a theoretical sex ratio of 105 and a sample of 10,000 children, the 95% confidence interval of the sex ratio is 99.3–111. This is less of an issue at the national level, but one must be aware of the uncertainty when analysing differences between geographical areas that vary in size. In our case, the unit size is crucial when analysing sex ratio levels within Denmark. To increase our sample sizes, we merged the two youngest age groups into one group of children 0–9, as shown in . Further, we calculated sex ratios by county, the largest subnational unit in the lay administrative geography of nineteenth-century Denmark.Footnote4
Table 1. Descriptive statistics for the child sex ratio (ages 0–9) calculated for each of the Danish counties in the eight censuses from 1787 to 1901. Source: The Danish Demographic Database and the Link-Lives project.
Across the eight censuses from 1787 to 1901, the average sex ratio of children 0–9 in Denmark was 101.46 boys per 100 girls in rural parishes and 100.63 in towns (including Copenhagen). This most likely reflects the higher IMR in the urban areas, which would have decimated the number of boys (Anne Løkke, Citation1998, p. 120). In the rural areas, the sex ratio means in most counties did not deviate much from the national mean, which suggests that no county had abnormally high or low ratios across the entire period. Sorø had the highest max ratio of 106.67, but did not have the highest mean ratio. This may be explained by an influx of boys to Sorø Akademi and Herlufsholm, the two largest boarding schools in Denmark at the time, which were both located in this county and were expanded in the middle of the nineteenth century (Herlufsholms Opdragelsesanstalt og Skole, Citation1921; Sorø Akademi, Citation1926). The highest mean ratios are found in the handful of counties sitting between 102 and 103, but these are only slight deviations from the national mean. Despite decent sample sizes in the rural areas, some counties vary little while others vary more, as indicated by their standard deviation. It is not entirely clear what causes this difference. In the urban areas, it is much more difficult to discuss any patterns, since small sample sizes make the ratios more susceptible to random variation. This is the most likely explanation behind the very high and low ratios that we find here, and even if random variation is not the reason, the limited nature of the ratios does not allow for any further inspection.
In order to calculate sex ratios for narrower age groups, and while still escaping small sample sizes, we can work with even larger geographical units. For a more direct comparison with the aggregated mortality statistics (which is especially relevant for the sections to follow), we computed the child sex ratio for the whole of Denmark, separated into urban and rural areas, for five-year age ranges in all census years. The results are shown in . The sex ratios fluctuate in the 98–104 range during most of the period, and the most extreme outliers, especially in 1787, are found in the age group 10–14. There is a risk that migration is a more important factor at these ages, but based on the limited data on Danish migration that exists, we find it unlikely that young people migrated on their own before their confirmation around age 14 (B. K. B. K. Hansen, Citation2006, pp. 263–276). In the youngest age groups, the urban sex ratios vary more than the rural ones, and in general, it is difficult to spot a consistent pattern that could be indicative of gender differences in mortality. As we shall see, such differences were present in Denmark at this time, which means that the patterns presented here suggest that sex ratios may not be a good proxy for mortality in this case.
Figure 3. Child sex ratios in the eight Danish censuses, calculated for four age groups and for rural and urban parishes separately.The Danish Demographic Database and the Link-Lives project.
4.3. Sex-specific mortality rates
While in the previous section we did find high and low sex ratios in some census years and areas, there are no consistent or systematic patterns in the sex ratios over time or place that can be taken as evidence of systematic excess female mortality. However, given that it required aggregation over large units and that such data are susceptible to other factors, such as selective registration and migration, it is fruitful to complement the sex ratios with an analysis of mortality rates, as they may display differences too small to be captured by the method used above. shows the mortality sex ratio, in this case the male mortality rate expressed as a percentage of the female rate, over the period 1840–1940 for the ages between 0 and 25. Note that since we are dealing with mortality rates, the way we calculate the mortality sex ratio differs from the child sex ratios. In the nineteenth century, the national average mortality rate was roughly 10–15% higher among males in the 0 to 5 age group and close to even in ages 5 to 10, even though the female rate was slightly higher until 1900. Between ages 10 and 15, however, the female mortality rate was significantly higher than the male rate until the 1920s.
Figure 4. The male mortality rate (deaths per 10,000) as a percentage of the female rate, by period and age group 1840–1940. The year ranges reflect that the data was published by decade from 1840–1900, and for five year ranges from 1900–1940.
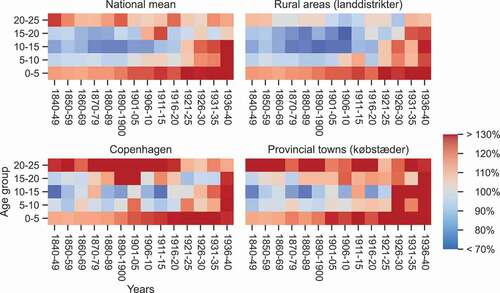
These results are noticeable when disaggregating the data for Copenhagen, provincial towns and rural areas. As mentioned earlier, the national aggregated figures tend to reflect the rural population due to its size. In this case, the disaggregation shows that the excess female mortality at ages 10–15 was even higher in the rural areas. In Copenhagen and the provincial towns, there were decades where the ratio was close to even, or where mortality was higher among males, perhaps due to environmental hazards that were specific to urban areas and affected males more. At ages 15 to 20 in the rural areas, the excess mortality of females was less pronounced, but still notably higher than males.
Past age 20, the male mortality rate in the towns rose dramatically and overtook the female rate, while the ratio in rural areas evened out. Heiberg, a physician writing in 1918 on the 1890s, ascribed this shift to the prevalence of alcoholism, suicides and accidents, which increased the male mortality rate in adulthood, but also a higher mortality from tuberculosis compared to women (Heiberg, Citation1918, p. 12). It is possible that urbanisation generally affected the health of males more than females. However, we find this shift in mortality at age 20 both in 1840, when Copenhagen was still a pre-industrial walled city, and in the 1880s, when the negative health effects from industrialisation were at their peak. In this case, then, it might seem that the negative effect of urbanisation is one of density rather than industry. What is not clear from the figure due to its scale is that the male excess mortality for the 20–25 year olds in Copenhagen fluctuated between 20 and 40% from 1840–1890 before increasing to 80% in 1895–1900 (Befolkningsforholdene, 128). As such, it could be a combination of both. Even then, we cannot rule out the possibility of gender-specific differences in migration altering the mortality rates, which we discuss below.
The relative differences, as evidenced in the mortality sex ratios, can be further examined when mortality rates are compared see . For the 5–10-year olds, the average mortality rate rose from the 1840s to the 1870s and then declined for the rest of the century. The initial short peak was likely related to the wars of 1848–50 and 1864, in which family life almost everywhere in Denmark was disrupted by the presence of troops. At the beginning and end of the study period, the lowest mortality rate was that of boys in rural areas, and in most decades, the highest rates for both sexes were found in the provincial towns, which were generally much smaller urban centres than Copenhagen. However, throughout the nineteenth century, rural girls consistently had a slightly higher mortality rate than boys. Moreover, in the early decades, girls in Copenhagen and provincial towns had the highest mortality rates, but in the 1860s, girls in the rural areas experienced the highest mortality of all groups.
Figure 5. Mortality rate (deaths per 10,000) by sex, age group, period and for rural and urban areas and the city of Copenhagen separately. The year ranges reflect that the data was published by decade from 1840–1900, and for five year ranges from 1900–1940.
Among the 10–15-year olds, the most striking finding is a continuation of the higher mortality risk for girls in rural areas. In fact, females in rural areas had the highest mortality of all until the 1880s, where an increase in the mortality rate for females in the towns caused the two groups to level. Anne Løkke (Citation1998, p. 121) has shown that the IMR for provincial towns plateaued in the 1870s and then rose in a similar fashion in the 1880s, which suggests that a general negative effect of urbanisation affected both infants and 10–15 year old females. However, since the category of ‘provincial towns’ represents a quite diverse selection of smaller towns, we should be careful when interpreting this increase in mortality as a straightforward consequence of urbanisation.
The rural 10–15 year old females experienced a slight mortality peak in the 1860s, but afterwards the gap between males and females widened until the 1890s; not due to a rise in female mortality, but to a slightly faster decline in male mortality. In Copenhagen and other towns, the gender gap narrowed in the 1850s and 1860s, but widened again in the decades that followed. By the end of the period, the lowest mortality rate was that of Copenhagen males. What seems to hint at is made clearer in ; namely, that in urban areas, the gender mortality gap fluctuated and reversed throughout the second half of the nineteenth century. While the pattern for 15–20 year olds is similar to ages 10–15 in the rural areas and to some extent in Copenhagen, it diverged somewhat in the towns. The male mortality rate was higher than the female rate from the 1870s onwards, suggesting perhaps that the negative effects of urbanisation, which seem to have affected adolescents in the provincial towns more than in Copenhagen, had a higher impact on males at the cusp of adulthood. In general, the higher mortality rates in the provincial towns compared to Copenhagen may indicate that investments in sanitary infrastructure, which happened earlier in Copenhagen (Knudsen, Citation1988), had an immediate effect.
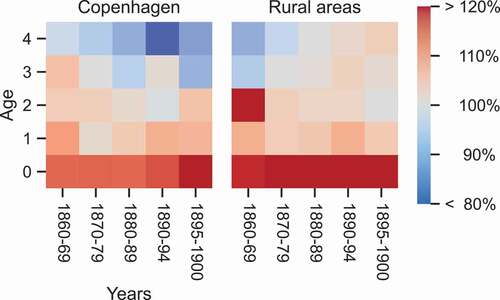
The main emphasis from our findings is that we see a range of ages from 5 to 20 where the female mortality rate was consistently higher than the male rate at the national level, lasting roughly until the turn of the century for ages 5–10 and the 1920s for the older age groups. Throughout the nineteenth century, excess female mortality was constant in the rural areas at ages 5 to 20. Some of the statistical publications allow us to further disaggregate the 0–5 age group, which can help us trace the age at which the gender gap in mortality began see . This shows that the age at which excess mortality shifted from boys to girls varied across time and place. In Copenhagen, starting at age four, the female mortality rate was consistently higher than the male rate throughout the period 1860–1900. In the 1880s and 1890s, it overtook the male rate as early as age three. In rural areas, excess female mortality began at age three in the 1860s and age four in the 1870s. However, for the rest of the century, it did not happen before age five, and we do not have data to disaggregate the later age groups (Befolkningsforholdene, 134). Since the excess female mortality at ages 5–10 was still present in these later decades, as we saw in , it means that the shift from male to excess female mortality must have happened more suddenly at a later age. Further, the pattern in this figure might also indicate that males benefitted earlier than females from the mortality decline in the urban centre of Copenhagen.
Figure 6. The male mortality rate (deaths per 10,000) as a percentage of the female rate, by period and age 1860–1900, for Copenhagen and rural areas separately. The year ranges reflect that the data was published by decade from 1860–90, and for five year ranges from 1890–1900.
For the period 1895–1900, the Tabelværk contains sex-specific mortality rates for all ages, which gives a more fine-grained glimpse of the shifts in excess mortality. These rates are shown in , where it is clear that the mortality gap, which started around age four, did not develop linearly from that point onwards. In these five years, the male and female rates follow each other closely until age eight, where the female rate plateaus, while the male rate declines further. As such, the mortality gap we observe in adolescence was not shaped continually, but rather by a sharp divergence in the sex-specific mortality rates, happening during a narrow span of ages in late childhood. The figure also illustrates that while the female rate rose somewhat linearly starting at 14, the mortality rate for males developed more dramatically with a sharp increase from age 14/15, peaking at age 21, followed by a mild decline throughout the twenties. Overall, while our findings on excess female mortality are generally on par with research from other European countries showing patterns of higher mortality among young women, this early onset in Denmark is, to our knowledge, a rare finding. We can infer that the pattern found in 1895–1900, where the female and male rates were closely aligned until a divergence at age eight, seems to have differed from that earlier in the nineteenth century, where the divergence happened earlier, but at a slower pace.
Figure 7. Mortality rate (deaths per 100,000) by sex and age in Denmark 1895–1900.
5. Discussion and concluding remarks
This article has sought to describe the levels of excess female mortality in childhood and adolescence in nineteenth-century Denmark. It approaches the issue by using several different measures: sex ratio at birth, child sex ratio (at different ages) and age-specific mortality rates. It demonstrates that while the sex ratio measures do not seem to indicate significant gender differences in mortality, the mortality rates reveal consistently higher levels of female mortality starting at age three to five and lasting until adulthood.
At the national level, the sex ratios of nineteenth-century Denmark were mostly in line with what we would expect. At ages 0–4 and 5–9, the sex ratio lay close to 101–102, which we have assumed to be a ‘neutral’ ratio given the IMR in the second half of the nineteenth century. These aggregated figures could very well conceal abnormally high ratios in different parts of the population, but the issue with Denmark is its small size: below the county level, the random variability of the sex ratio measure does not allow us to distinguish between the high sex ratios caused by mortality differences, and those caused by random variation. However, we can conclude that there was no general trend of high sex ratios in Denmark throughout the nineteenth century nor at the rural/urban or county level.
The strength of the sex ratio measure lies in the ready availability of population counts in contrast to mortality figures and the fact that it represents factual accounts; underreported deaths will reveal themselves in the ratio if there are enough of them. However, there is little reason to think that underreporting was an issue in nineteenth-century Denmark, either in birth records, censuses, or in records reporting death. However, while Danish girls were generally not ‘missing’ according to the sex ratios, our survey of the mortality data shows that mortality differentials were present.
Denmark had consistent levels of excess female mortality in childhood and adolescence from 1840, and possibly earlier, until the early 20th century. This was especially consistent in rural areas. Excess female mortality was common among adolescents in nineteenth-century Europe (Alter et al., Citation2004), especially in low-mortality areas (Woods, Citation2000), but it is rare to find it as early in the life course as we have in Denmark. The gender mortality gap was narrow, though systematically present, below the age of ten. When the gap widened around age ten, it was due to a slower, and at times almost stagnant, mortality decline for females compared to that of males in rural areas. The data discussed here cannot tell us anything about the reasons behind this gap. However, whatever factors led to the low mortality of rural males in late childhood and adolescence did not benefit females to the same extent.
Our empirical findings help us draw some wider conclusions. The hypothesis that excess mortality of young females had roots in a natural susceptibility to disease alone seems implausible as the sole cause in the case of Denmark, since the female mortality rate was highest in rural areas where disease exposure was low. Rather, it may be that other a number of other factors had a stronger impact. First, if household bargaining disadvantaged women in rural areas in particular, this burden could have led to a higher mortality risk due to lower resistance. As in other European countries, much of the work that women performed in rural households became industrialized in Denmark in the second half of the nineteenth century: dairy and textile production as well as brewing (Mørch, Citation1982). If this sparked the onset of gender discrimination, as Johansson has suggested based on the case of Sweden, it could explain the slower mortality decline of rural females in Denmark. In Sweden, excess female mortality below age 20 only appeared in the latter half of the century (Fridlizius, Citation1988; Johansson, Citation1984). However, in the Danish rural areas it existed already in the 1840s, which may indicate either that discrimination was a factor early on or that it had other causes.
Second, migration could have affected the rural excess female mortality in several ways. If women migrated earlier and more often than men, perhaps as a consequence of poor rural labour conditions, and if the female migrants were healthier than those who stayed, the presence of more frail women than men in rural areas could blur the picture. Further, migration could feature as a compositional effect, as we must consider the possibility of return migration inflating the female mortality rate to some extent. If migrant women in towns caught tuberculosis or some other disease, there was rarely any other option than for them to travel back home. Since mortality was already low for adolescents, both in rural and urban areas, even a modest number of migrants could alter the mortality sex ratio. While this might explain the excess female mortality of 15–19 year olds, and the increase in the mortality gap in the second half of the nineteenth century, it is difficult to think that return migration caused the gap at ages 5–15. As such, we find that it would be fruitful to further explore the impact of discrimination.
While other, more fine-grained sources of data are required to tease apart the role of different causal factors, our findings on their own offer new evidence for Denmark, which contribute both to the scholarship on gender differences in demographic behaviour and health disparities in a relatively unexplored low mortality setting. Moreover, by comparing different approaches, it has also shed light on the limitations of the sex ratios approach to capture gender-specific mortality gaps. Sex ratios can capture high-impact practices of female neglect in general or relatively low differences in high mortality regimes. However, the Danish case provides evidence that either they may not be well suited to detect excess female mortality in low mortality settings or that the indicator has higher precision than recall. As far as we know, this is the first article to highlight this finding in a nineteenth-century context, so it opens the question for further scholarship comparing mortality and sex ratio estimations in a wider variety of settings.
Supplemental Material
Download Zip (18.3 KB)Acknowledgments
We would like to thank the editors of this special issue as well as the anonymous referees for their excellent comments on the manuscript, which helped us improve it. Further, we thank the audiences from the Missing Girls in Historical Europe seminar series and the ESSHC, where early versions of this work was presented.
Disclosure statement
No potential conflict of interest was reported by the author(s).
Supplementary material
Supplemental data for this article can be accessed online at https://doi.org/10.1080/1081602X.2022.2083001
Additional information
Funding
Notes
1. Abbreviated in the citations as ST followed by the relevant publication years. For a list of all published censuses and full vital statistics from the nineteenth century, see, Befolkningsforholdene (Citation1905), 182.
2. The only exception was the census of 1850, which had a precision of 97.4%. However, upon manual inspection of the part where the NN seems to be predicting incorrectly, it is clear that almost all cases are actually corrections to a wrongly transcribed sex (which we believe to be typos). Thus, the (relatively) poor precision of 1850 seems more likely to be an indication of the prevalence of slightly more transcription errors in this census.
3. In the earliest censuses, the population counts of children by sex were reported in two large age groups: 0–10 and 11–20. From 1845, the groups were disaggregated into 1–3, 3–5 and so forth. Only from 1880 was the count for each single age reported. See Appendix 1.
4. The Danish counties changed and varied in size during the period 1787–1901. However, the geography of the Danish Demographic Database was originally standardized according to the counties that existed in 1940. In practice, then, since parishes have become more stable, in every census each parish has been placed in its 1940 county. This is problematic for a number of reasons, but in this case, it means we are comparing the same geographical units throughout the entire period.
References
- A’Hearn, B., Delfino, A., & Nuvolari, A. (2022). Rethinking age heaping: A cautionary tale from nineteenth-century Italy. The Economic History Review, 75(1), 111–137. https://doi.org/10.1111/ehr.13087
- Alter, G., Manfredini, M., & Nystedt, P. (2004). Gender differences in mortality. In J. Z. Lee, T. Bengtsson, & G. Alter (Eds.), Life under pressure. mortality and living standards in Europe and Asia, 1700-1900 (pp. 327–358). MIT Press.
- Andersen, O. (1975). Regional mortality differences in Denmark around the middle of the 19th century. University of Copenhagen. Theses from the Institute of Statistics 29
- Andreev, K. (2002). Evolution of the Danish population from 1835 to 2000. Odense University Press.
- Arnold, F., Kishor, S., & Roy, T. K. (2002). Sex-Selective abortions in India. Population and Development Review, 28(4), 759–785. https://doi.org/10.1111/j.1728-4457.2002.00759.x
- Arvelod. (1915). C. Blangstrup. (Ed.), Salmonsens Konversations Leksikon, vol. II: Arbejderhaver—Benzol. (2nded., pp. 185). J.H. Schultz.
- Befolkningsforholdene i Danmark i det 19. Aarhundrede [The Population of Denmark in the Nineteenth Century]. (1905). Statens Statistiske Bureau.
- Beltrán Tapia, F. J., & Gallego-Martínez, D. (2017). Where are the missing girls? Gender discrimination in 19th-century Spain. Explorations in Economic History, 66, 117–126. https://doi.org/10.1016/j.eeh.2017.08.004
- Beltrán Tapia, F. J., & Gallego‐Martínez, D. (2020). What explains the missing girls in nineteenth‐century Spain? Economic History Review, 73(1), 59–77. https://doi.org/10.1111/ehr.12772
- Beltrán Tapia, F. J., & Marco-Gracia, F. J. (2021). Death, sex, and fertility: Female infanticide in rural Spain, 1750–1950. European Review of Economic History, 26(2) , https://doi.org/10.1093/ereh/heab023
- Beltrán Tapia, F. J., & Raftakis, M. (2021). Sex ratios and gender discrimination in modern Greece. Population Studies, 1–18. Advance online publication. https://doi.org/10.1080/00324728.2021.1923787
- Bjørn, C. (1990). Fra reaktion til grundlov. 1800-1850 [From Reactionary to Constitution. 1800-1850]. Gyldendals Bogklub & Politikens Forlag.
- Bongaarts, J., & Guilmoto, C. Z. (2015). How many more missing women? Excess female mortality and prenatal sex selection, 1970–2050. Population and Development Review, 41(2), 241–269. https://doi.org/10.1111/j.1728-4457.2015.00046.x
- Christensen, K., Orstavik, K. H., & Vaupel, J. W. (2001). The X chromosome and the female survival advantage: An example of the intersection between genetics, epidemiology and demography. Annals of the New York Academy of Sciences, 954(1), 175–183. https://doi.org/10.1111/j.1749-6632.2001.tb02752.x
- Clausen, N. F. (2015). The danish demographic database—principles and methods for cleaning and standardisation of data. In G. Bloothooft, P. Christen, K. Mandemakers, & M. Schraagen (Eds.), Population reconstruction (pp. 3–22). Springer International Publishing.
- Das Gupta, M. (2005). Explaining Asia’s “Missing Women”: A new look at the data. Population and Development Review, 31(3), 529–535. https://doi.org/10.1111/j.1728-4457.2005.00082.x
- Das Gupta, M. (2009). Family Systems, Political Systems, And Asia’s “Missing Girls”: The Construction Of Son Preference And Its Unraveling ( No. 5148; Policy Research Working Paper). World Bank.
- Drevenstedt, G. L., Crimmins, E. M., Vasunilashorn, S., & Finch, C. E. (2008). The rise and fall of excess male infant mortality. Proceedings of the National Academy of Sciences, 105(13), 5016–5021. https://doi.org/10.1073/pnas.0800221105
- Feldbæk, O. (1990). Den lange fred. 1700-1800 [The Long Peace. 1700-1800]. Gyldendals Bogklub & Politikens Forlag.
- Fridlizius, G. (1988). Sex-differential mortality and socio economic change. Sweden 1750-1910. In A. Brändström & L.-G. Tedebrand (Eds.), Society, health, and population during the demographic transition (pp. 237–272). Almqvist and Wiksell International.
- Goldin, C., & Lleras-Muney, A. (2019). XX > XY?: The changing female advantage in life expectancy. Journal of Health Economics, 67, 1–14. https://doi.org/10.1016/j.jhealeco.2019.102224
- Guilmoto, C., & Oliveau, S. (2008). Sex ratio imbalances among children at micro-level: China and India compared. Population association of America 2007 annual meeting, 1–18.
- Hajnal, J. (1983). Two kinds of pre-industrial household formation system. In R. Wall (Ed.), Family forms in historic Europe (pp. 65–104). Cambridge University Press.
- Hansen, S. A. (1972). Økonomisk vækst i Danmark [Economic Growth in Denmark] (Vol. 2). Akademisk Forlag.
- Hansen, B. K. (2006). Familie- og arbejdsliv på landet ca. 1870 - 1900: En undersøgelse af ægteskabsdannelse, familieforøgelse og arbejdsliv med særlig henblik på ændringerne i kvindernes arbejde [Family and Work Life in the Countryside ca. 1870-1900], Landbohistorisk Selskab.
- Harris, B. (2008). Gender, health, and welfare in England and Wales since industrialisation. Research in Economic History, 26, 157–204. http://doi.org/10.1016/S0363-3268
- Heiberg, P. (1918). Dødeligheden og Dødsaarsagerne i Danmark i de 2 Tiaar 1890-1899 og 1900-1909 i Aldersklasserne 15-74 Aar [Mortality and Causes of Death in Denmark in the Decades 1890-99 and 1900-1909 at Ages 15-74]. Bibliotek for Læger.
- Herlufsholms Opdragelsesanstalt og Skole. (1921). C. Blangstrup. (Ed.), Salmonsens Konversations Leksikon, vol. XI: Hasselmus—Hven. (2nded., pp. 319–320). J.H. Schultz.
- Hinde, A. (2015). Sex differentials in phthisis mortality in England and Wales, 1861–1870. The History of the Family, 20(3), 366–390. https://doi.org/10.1080/1081602X.2015.1051077
- Holck, A. (1901). Dansk Statistiks Historie 1800-1850 særlig med Hensyn til den officielle Statistiks Udvikling [The History of Statistics in Denmark 1800-1850]. Bianco Lunos Bogtrykkeri.
- Horrell, S., & Oxley, D. (2016). Gender bias in nineteenth-century England: Evidence from factory children. Economics & Human Biology, 22, 47–64. https://doi.org/10.1016/j.ehb.2016.03.006
- Humphries, J. (1991). “Bread and a pennyworth of treacle”: Excess female mortality in England in the 1840s. Cambridge Journal of Economics, 15(4), 451–473. https://doi.org/10.1093/oxfordjournals.cje.a035183
- Hvidt, K. (1990). Det folkelige gennembrud og dets mænd. 1850-1900 [The Public Breakthrough and its Men]. Gyldendals Bogklub & Politikens Forlag.
- Jacobsen, A. F. (2007). Husbondret: Rettighedskulturer i Danmark 1750-1920[Cultures of Rights in Denmark 1750-1920]. Museum Tusculanum.
- Johansen, H. C. (1975). Befolkningsudvikling og familiestruktur i det 18. Århundrede [Population Development and Family Structure in the Seventeenth Century]. Odense University Press.
- Johansen, H. C. (1999). The development of reporting systems for causes of deaths in Denmark. Journal of the History of Medicine and Allied Sciences, 54(2), 154–166. https://doi.org/10.1093/jhmas/54.2.154
- Johansen, H. C. (2002). Danish population history 1600-1939. University Press of Southern Denmark.
- Johansson, S. R. (1984). Deferred infanticide: Excess female mortality during chilhood. In G. Hausfater & S. B. Hrdy (Eds.), Infanticide: Comparative and evolutionary perspectives, Aldine, New York, 463–48.
- Johansson, S. R. (1996). Excess female mortality. Constructing survival during development in Meiji Japan and Victorian England. In A. Digby & J. Stewart (Eds.), Gender, health and welfare (pp. 32–66). Routledge.
- Klasen, S. (1998). Marriage, bargaining, and intrahousehold resource allocation: Excess female mortality among adults during early German development, 1740-1860. The Journal of Economic History, 58(2), 432–467. https://doi.org/10.1017/S002205070002057X
- Knudsen, T. (1988). Storbyen støbes: København mellem kaos og byplan 1840-1917 [The Making of a Metropolis. Urban Development in Copenhagen 1840-1917]. Akademisk Forlag.
- Løkke, A. (1998). Døden i barndommen: Spædbørnsdødelighed og moderniseringsprocesser i Danmark 1800 til 1920 [Death in Childhood. Infant Mortality and Modernization in Denmark 1800-1920]. Gyldendal.
- Løkke, A. (2018). Statistical, legal, religious and medical definitions of stillborn infants in Denmark 1683-2012. In C. Rollet, G. Clavandier, N. S. Pranchère, P. Charrier, & V. Gourdon (Eds.), Morts avant de naître: La mort périnatale = Dead before being born: About perinatal death (pp. 83–98). Presses universitaires François Rabelais.
- Lynch, K. A. (2011). Why weren’t (many) European women ‘missing’? The History of the Family, 16(3), 250–266. https://doi.org/10.1016/j.hisfam.2011.02.001
- McNay, K., Humphries, J., & Klasen, S. (2005). Excess female mortality in nineteenth-century England and wales: A regional analysis. Social Science History, 29(4), 649–681. https://doi.org/10.1017/S0145553200013341
- Møller, J. S. (1940). Moder og Barn i dansk Folkeoverlevering: Fra Svangerskab til Daab og Kirkegang [Mother and Child in Danish Folklore]. Munksgaard.
- Mørch, S. (1982). Den ny Danmarks historie 1880-1960 [The New History of Denmark 1880-1960], Gyldendals Bogklub.
- Revuelta-Eugercios, B. A., Robinson, O., & Løkke, A. (2021). Link-Lives, historical big data: Reconstructing millions of life courses from archival records using domain experts and machine learning. Proceedings of linked archives international workshop 2021 co-located with 25th international conference on Theory and Practice of Digital Libraries (TPDL 2021), 135–143.
- Revuelta-Eugercios, B. A., Mathiesen, N. R., Thomsen, A. R., & Robinson, O. (2022). Link-Lives user manual v.1. Danish National Archives.
- Rosenbeck, B. (1987). Kvindekøn: Den moderne kvindeligheds historie 1880-1980 [the History of Modern Femininity 1880-1980]. Gyldendal.
- Sen, A. (1990). More than 100 million women are missing. The New York Review of Books, December. https://www.nybooks.com/articles/1990/12/20/more-than-100-million-women-are-missing/.
- Sorø Akademi, S. (1926). In C. Blangstrup. (Ed.), Salmonsens Konversations Leksikon, vol. XXI: Schinopsis—Spektrum (2nd ed., pp. 967–968). J.H. Schultz.
- ST (1835). Statistisk Tabelværk, Ældste rk., No 1. En tabellarisk Fremstilling af Folkemængden i Danmark den 18. Februar 1834, en summarisk Oversigt over samme Folkemængde den 1ste Februar 1801 og Tabeller over Antallet af Ægtevielser, Fødsler og Dødsfald i Danmark, i Aarene 1801 til 1833. København: Statens Statistiske Bureau, Bianco Luno & Schneider.
- ST (1850). Statistisk Tabelværk, Ny rk., No 1. En detailleret Fremstilling af Folkemængden i Danmark i Aaret 1850, samt af Ægteskaberne, Födslerne og Dödsfaldene sammesteds i Aarene 1845-1849. København: Statens Statistiske Bureau, Hofbogtrykker Bianco Luno.
- ST (1863). Statistisk Tabelværk, Tredie rk., No 1 Tabeller over Folkemængden i Kongeriget Danmark, Hertugdömmet Slesvig, Hertugdömmet Holsteen og Hertugdömmet Lauenborg, efter Alder, Kjön og ægteskabelig Stilling samt efter Næringsvei og Stilling den 1ste Februar 1860. København: Statens Statistiske Bureau, Bianco Lunos Bogtrykkeri.
- ST (1882). Statistisk Tabelværk, Fjerde rk., litra A, No 2. Vielser, Fødsler Og Dødsfald i Aarene 1875-1879 Samt Dødsaarsagerne i Aarene 1876-1879. København: Statens Statistiske Bureau, Bianco Lunos Kgl. Hof-Bogtrykkeri.
- ST (1883). Statistisk Tabelværk, Fjerde rk., litra A, No 3. Folkemængden i Kongeriget Danmark den 1ste Februar 1880. København: Statens Statistiske Bureau, Bianco Lunos Kgl. Hof-Bogtrykkeri.
- ST (1886). Statistisk Tabelværk, Fjerde rk., litra A, No 5. Vielser, Fødsler Og Dødsfald i Aarene 1880-84. København: Statens Statistiske Bureau, Bianco Lunos Kgl. Hof-Bogtrykkeri.
- ST (1893). Statistisk Tabelværk, Fjerde rk., litra A, No 7. Vielser, Fødsler Og Dødsfald i Aarene 1885-89. København: Statens Statistiske Bureau, Bianco Lunos Kgl. Hof-Bogtrykkeri.
- ST (1903a). Statistisk Tabelværk, Femte rk., litra A, No 2. Ægteskaber, Fødte Og Døde i Aarene 1895-1900. København: Statens Statistiske Bureau, Bianco Lunos Bogtrykkeri.
- ST (1903b). Statistisk Tabelværk, Femte rk., litra A, No 3. Folketællingen i Kongeriget Danmark den 1. Februar 1901, første Del. København: Statens Statistiske Bureau, Bianco Lunos Bogtrykkeri.
- ST (1908). Statistisk Tabelværk, Femte rk., litra A, No 6. Ægteskaber, Fødte Og Døde i Aarene 1901-05. København: Statens Statistiske Bureau, Bianco Lunos Bogtrykkeri.
- ST (1913). Statistisk Tabelværk, Femte rk., litra A, No 8. Ægteskaber, Fødte Og Døde i Aarene 1906-10. København: Statens Statistiske Bureau, Bianco Lunos Bogtrykkeri.
- ST (1919). Statistisk Tabelværk, Femte rk., litra A, No 13. Ægteskaber, Fødte Og Døde i Aarene 1911-15. København: Statens Statistiske Departement, Bianco Lunos Bogtrykkeri.
- ST (1924). Statistisk Tabelværk, Femte rk., litra A, No 15. Ægteskaber, Fødte Og Døde i Aarene 1916-20. København: Statens Statistiske Departement, H. H. Thieles Bogtrykkeri.
- ST (1928). Statistisk Tabelværk, Femte rk., litra A, No 17. Ægteskaber, Fødte Og Døde i Aarene 1921-25. København: Statens Statistiske Departement, Bianco Lunos Bogtrykkeri.
- ST (1934). Statistisk Tabelværk, Femte rk., litra A, No 19. Ægteskaber, Fødte Og Døde i Aarene 1926-30. København: Statens Statistiske Departement, Bianco Lunos Bogtrykkeri.
- ST (1944). Statistisk Tabelværk, Femte rk., litra A, No 22. Folketællingen den 5. November 1940 Og Befolkningens Bevægelser 1931-40. København: Statens Statistiske Departement, Bianco Lunos Bogtrykkeri.
- Tabeller over Folkemængden i Kongeriget Danmark inddelt efter Kiøn, Alder, gift, ugift eller Enke-Stand og Næringsveje efter Optælningen den 1ste Jul: 1787. (n.d.).
- Tabutin, D., & Willems, M. (1998). Differential mortality by sex from birth to adolescence: The historical experience of the West (1750– 1930). In Too young to die: Genes or gender? (pp. 17–52). United Nations, Department of Economicand Social Affairs, Population Division. United Nations.
- Umyndighed. (1928). In C. Blangstrup. (Ed.), Salmonsens Konversations Leksikon, vol. XXIV: Tyskland—Vertere. (2nded.,pp. 243–248). J.H. Schultz.
- Woods, R. (2000). The demography of Victorian England and wales. Cambridge University Press.
- Zarulli, V., Kashnitsky, I., & Vaupel, J. W. (2021). Death rates at specific life stages mold the sex gap in life expectancy. Proceedings of the National Academy of Sciences, 118(20), 1–4. https://doi.org/10.1073/pnas.2010588118
Appendix
Appendix 1. Comparison of child sex ratios in the published statistics and in the individual-level data (transcribed and neural network-estimated sex separately). Source: ST Citation1835; Citation1850; Citation1863; Citation1883; Citation1903a and Tabeller over Folkemængden i Kongeriget Danmark inddelt efter Kiøn, Alder, gift, ugift eller Enke-Stand og Næringsveje efter Optælningen den 1ste Jul: Citation1787.