
Abstract
Despite being a critical emergent literacy skill and an indicator of risk for later reading difficulties, relatively little is known about how alphabet knowledge develops over time. This study utilized a person-centered approach and longitudinal sample of 998 preschool-aged children (M = 56.50 months old) to examine patterns in letter name and letter-sound knowledge development, associations with child, home/family, and classroom factors, and kindergarten readiness outcomes. Results indicated three profiles: children demonstrating initially High knowledge and little growth before mastery, children demonstrating initially low knowledge but Growing trajectories toward mastery, and children demonstrating initially low knowledge whose growth was substantially Delayed. Multiple factors distinguished the High profile but few distinguished the Growing versus Delayed profiles; all differed in kindergarten readiness. Implications concerning risk, resiliency, and assessment/instruction are discussed.
Introduction
Alphabet knowledge is a necessary component of emergent literacy development and refers to children’s knowledge of letter forms, names, and corresponding sounds (Piasta & Wagner, Citation2010). As such, alphabet knowledge is one of the best predictors of children’s later reading and spelling abilities (National Early Literacy Panel, Citation2008; Schatschneider, Fletcher, Francis, Carlson, & Foorman, Citation2004). In turn, alphabet knowledge is an important early indicator of risk: Children with low alphabet knowledge are considered less “ready” for school (Foster & Miller, Citation2007) and tend to fall further behind their peers in reading acquisition, leading to gaps in spelling, reading, vocabulary, and comprehension skills (L. M. Phillips, Norris, & Osmond, & Maynard, Citation2002; Torgesen & Mathes, Citation2002). Yet, relatively little is known about how alphabet knowledge develops, in terms of growth over time, and how rate of growth may be associated with other factors pertaining to academic risk or resilience. The purpose of our study was to investigate profiles of young children’s alphabet knowledge growth using a person-centered approach and, subsequently, identify characteristics associated with alphabet knowledge profiles as well as associations between profile membership and kindergarten readiness.
Importance and early acquisition of alphabet knowledge
Children begin developing emergent literacy skills, including alphabet knowledge, prior to formal school entry. In alphabetic languages like English, alphabet knowledge is fundamental for mapping print to speech. Children in initial stages of reading often rely on letter names to match letters with corresponding sounds, and children in later stages of reading continue to use alphabet knowledge, along with knowledge of more complex orthographic patterns, to decode and recognize words (Ehri, Citation1987). Similarly, spelling and writing development is contingent on children’s growing understanding of letters and corresponding sounds.
Extant research suggests some developmental patterns in children’s acquisition of alphabet knowledge. For example, U.S. children tend to acquire letter names prior to letter sounds (Ellefson, Treiman, & Kessler, Citation2009). Moreover, some letters tend to be acquired earlier in children’s development than others, such that there is a relative sequence in letter name and sound learning that children often follow (Drouin, Horner, & Sondergeld, Citation2012; B. M. Phillips, Piasta, Anthony, Lonigan, & Francis, Citation2012; Piasta, Phillips, Williams, Bowles, & Anthony, Citation2016). For letter names, children typically learn the first letter of their own names prior to other letters (Justice, Pence, Bowles, & Wiggins, Citation2006; B. M. Phillips et al., Citation2012). For letter sounds, letters whose names include their corresponding sounds (e.g., B, F, S) tend to be acquired prior to those that do not (e.g., H, W, Y; Treiman, Tincoff, Rodriguez, Mouzaki, & Francis, Citation1998). The order of letters in the alphabet (Justice et al., Citation2006; McBride-Chang, Citation1999), distinctive features of letter shapes (Pence Turnbull, Bowles, Skibbe, Justice, & Wiggins, Citation2010; Treiman, Kessler, & Pollo, Citation2006), and number of sounds related to each letter (Evans, Bell, Shaw, Moretti, & Page, Citation2006) are also associated with children’s alphabet knowledge acquisition.
Increased recognition of the importance of alphabet knowledge, coupled with greater understanding of the developmental processes through which children acquire such knowledge, has heightened attention to fostering alphabet knowledge development. Alphabet knowledge is integrated into state, Head Start, and other early learning guidelines (National Association for the Education of Young Children, Citation2011; Piasta, Petscher, & Justice, Citation2012; U.S. Department of Health & Human Services, Citation2003), considered a key component of early literacy and kindergarten readiness assessments (American Institutes for Research, Citation2004; Lonigan, Allan, & Lerner, Citation2011), and included in the Common Core State Standards (National Governors Association Center for Best Practices & Council of Chief State School Officers, Citation2010). These efforts are meant to promote alphabet knowledge development during early childhood given empirical evidence suggesting that children are most successful when they enter kindergarten already knowing 18 uppercase and 15 lowercase letters (Piasta et al., Citation2012). Moreover, such efforts are meant to address individual differences in alphabet knowledge, given evidence that children’s levels of alphabet knowledge vary according to demographic characteristics (e.g., age, socioeconomic status [SES], race, ethnicity; Denton & West, Citation2002; Drouin et al., Citation2012; Strang & Piasta, Citation2016), family and home experiences (e.g., family reading history, home literacy environment; Burgess, Citation2011; Torppa, Poikkeus, Laakso, Eklund, & Lyytinen, 2006), and educational experiences, such as the early literacy supports provided in early childhood classrooms (e.g., Guo, Piasta, Justice, & Kaderavek, Citation2010; Mashburn et al., Citation2008).
Alphabet knowledge growth
As reviewed above, research to date has mainly examined individual differences in children’s levels of alphabet knowledge, associations with later academic outcomes, and properties that make certain letters more or less likely to be acquired. This body of research has also identified predictors of children’s alphabet knowledge at static points in time and, increasingly, how educational practices may affect alphabet knowledge learning (e.g., Guo, Justice, Kaderavek, & McGinty, Citation2012; Piasta, Purpura, & Wagner, Citation2010; Sunde, Furnes, & Lundetrae, Citation2020; see also Piasta & Wagner, Citation2010 for review). Notably, even the latter research, which focuses on alphabet knowledge change as a function of instruction, has typically modeled levels of alphabet knowledge at outcome or, occasionally, gain between two-time points (cf. Roberts, Vadasy, & Sanders, Citation2018). Much less is known about how children grow in their alphabet knowledge, despite recent arguments that consideration of growth trajectories provides unique insights into children’s development and factors related to developmental patterns (Bornstein, Hahn, & Putnick, Citation2016).
To our knowledge, young children’s alphabet knowledge growth has been modeled in only three studies (Roberts et al., Citation2018; Strang & Piasta, Citation2016; Torppa et al. Citation2006); one additional study (Diamond & Baroody, Citation2013) considered growth in “alphabetic skills” but measured this construct in a way that confounded alphabet knowledge with word recognition and decoding skills, and another (Heilmann, Moyle, & Rueden, Citation2018) characterized children into low versus high alphabet knowledge growth but operationalized “growth” as whether or not children who knew few letters at the beginning of the year met letter name benchmarks by spring. Roberts et al. (Citation2018) examined children’s alphabet knowledge growth over a period of approximately 3 months as a function of different types of alphabet instruction. Strang and Piasta (Citation2016) used growth curve analyses to examine the letter name and sound development of children enrolled in a high-quality preschool program across one academic year and determine whether growth differed by family SES. Results showed SES-related gaps in children’s alphabet knowledge but that rates of alphabet knowledge growth did not differ by family SES.
Torppa et al. (Citation2006) used trajectory analysis to examine patterns of alphabet knowledge growth of Finnish children with and without family risk for dyslexia. They assessed letter name knowledge as it developed from when children were aged 4.5–6.5 years and found three distinct groups of children: those who exhibited initially low letter name knowledge and limited growth over time (39%), those who exhibited initially low knowledge but substantial growth (34%), and those who exhibited initially high knowledge which left little room for additional growth (27%). Importantly, group membership, and thus both level and rate of growth, significantly predicted children’s first grade reading performance. Children showing limited alphabet knowledge growth scored the lowest on measures of reading fluency and comprehension, and children showing substantial growth scored significantly higher than this group but significantly lower than children within initially high letter knowledge. Moreover, over half of the children in the limited-growth group showed substantial delays (more than a standard deviation below the mean) in first-grade reading skills. These results highlight the importance not only of considering rate of growth to understand children’s alphabet knowledge development but also using a person-centered analytic approach.
Unlike typical regression-based statistical approaches used to examine the extent to which higher or lower scores on a set of predictor variables are associated with an outcome, a person-centered analytic approach examines whether distinct groups of individuals exist across a set of predictor variables. Groups are identified based on both the value, meaning how high or low a particular person scored on each predictor, and the covariance between predictors, or how they are correlated with one another. These analyses are sometimes called latent class or profile analyses (Logan & Pentimonti, Citation2016). Across the field of early childhood, a person-centered latent class analytic approach has helped to identify and prioritize the particular needs of various groups of children considered at risk for academic difficulties and provide corresponding educational supports (Bulotsky-Shearer, Bell, & Dominguez, Citation2012; Chien et al., Citation2010; Denham et al., Citation2012; Ozernov-Palchik et al., Citation2017). As an example, Ozernov-Palchik et al. (Citation2017) examined five component skills of reading in a sample of kindergarten children. Rather than examining how each of those five component skills predicted later reading ability, these authors used latent class analysis to identify six distinct profiles of early reading skills. These included children who scored high on all component skills or low on all component skills, but also identified unique profiles, such as a “Phonological Awareness Risk” group, in which children had average scores on most components but extremely low scores on phonological awareness items. Ozernov-Palchik et al. used these six profiles, rather than the five component skills, to predict later reading outcomes, with associated implications for early identification and prevention of reading difficulties. This example illustrates how a person-centered approach can be used to identify different groups of people, based on their responses to a set of measures.
A person-centered approach can be combined with modeling growth as the outcome to further identify groups of children who share similar developmental patterns or profiles (i.e., latent growth mixture modeling). Application of this approach to children’s alphabet knowledge affords opportunities, similar to Torppa et al. (2006), to examine profiles of U.S. children’s letter name and sound development and determine the extent to which these depend on level and/or rate of growth. There are two primary alternative methods for such person-centered approaches: the growth mixture model (GMM) and the latent class growth analysis. Although the latter is less technologically difficult to fit, it also restricts all individual growth trajectories within a class to be the same (Nagin, Citation1999). In this study, we applied the latent GMM approach, also used by Torppa et al. (2006), as this approach allows for heterogeneity within the variance and covariance matrices. In doing so, we have the potential to understand whether further study of alphabet knowledge should consider profiles of development, rather than simply levels of knowledge, and whether both level and growth may be necessary for understanding risk for reading difficulties.
In addition, the person-centered approach affords opportunities to examine factors predictive of alphabet knowledge profiles. Such factors may place children at risk for less optimal alphabet knowledge development, and, in turn, less ready for kindergarten or more likely to experience later reading difficulties (Foster & Miller, Citation2007; Torgesen & Mathes, Citation2002). Alternatively, these may represent malleable home or classroom factors that could promote resilience and be used to inform efforts to promote compensatory effects (Sameroff & Chandler, Citation1975) and improve kindergarten readiness such that later reading gaps are reduced.
Factors associated with children’s alphabet knowledge
Research has identified numerous factors related to individual differences in children’s alphabet knowledge levels, which might also differentiate profiles of alphabet knowledge growth. These include characteristics of the individual child, the home, and the classroom, consistent with a bioecological model of development (Bronfenbrenner & Morris, Citation2007).
Child factors
Age, SES, race, and ethnicity are important to consider when examining children’s alphabet knowledge. Alphabet knowledge is a finite skill in which young children exhibit individual differences but typically master by first grade (Denton & West, Citation2002; McBride-Chang, Citation1999). Therefore, given the speed with which alphabet knowledge has the potential to grow, one could expect to see clear and substantial differences in knowledge over a short period of time based on age. Unsurprisingly, older children typically display higher levels of alphabet knowledge than their younger peers (Drouin et al., Citation2012; Heilmann et al., Citation2018).
SES, as measured by family income or maternal education, is also associated with children’s alphabet knowledge (Denton & West, Citation2002; Dodd & Carr, Citation2003; Hecht, Burgess, Torgesen, Wagner, & Rashotte, Citation2000). Extensive evidence shows that children of lower SES tend to arrive at school with lower levels of alphabet knowledge than their more advantaged peers, even at preschool entry (Snowling, Gallagher, & Frith, Citation2003; Strang & Piasta, Citation2016). Furthermore, SES accounts for unique variance in children’s alphabet knowledge (Dodd & Carr, Citation2003). Thus, SES is a potentially significant predictor of children’s initial alphabet knowledge and, potentially, subsequent growth (cf. Strang & Piasta, Citation2016).
Finally, a child’s race and ethnicity may be related to the types of activities that are likely to occur in the home and therefore their alphabet knowledge acquisition. For instance, evidence suggests that Black and Hispanic parents are less likely than White parents to read with their children (Bradley, Corwyn, McAdoo, & García Coll, Citation2001; B. M. Phillips & Lonigan, Citation2009). In general, race and ethnicity are significant predictors of young children’s reading achievement with White, non-Hispanic/Latinx children often exhibiting higher achievement than children of other racial or ethnic backgrounds (Chien et al., Citation2010; Fryer & Levitt, Citation2002); the same pattern holds when considering children’s alphabet knowledge (Denton & West, Citation2002).
Home and family factors
The home literacy environment is associated with children’s emergent literacy skills including alphabet knowledge (Farver, Xu, Lonigan, & Eppe, Citation2013; Kim, Im, & Kwon, Citation2015). Shared storybook reading experiences, the presence of varied reading materials, library membership, and parents’ intentional teaching of letter names and letter sounds are influential factors in emergent literacy development (Burgess, Citation2011; Evans, Shaw, & Bell, Citation2000; Sénéchal, Citation2006). Moreover, children’s letter name knowledge is often an indicator of the quality of the home literacy environment that they experienced (Hecht et al., Citation2000).
A family history of reading and/or language difficulties is another home influence that may affect children’s alphabet knowledge development. For example, children who have an immediate family member with dyslexia are at greater risk for reading difficulties given the hereditary nature of reading disabilities (Snowling et al., Citation2003; Torppa et al., 2006), and many children with dyslexia exhibit weaknesses in alphabet knowledge (Carroll, Solity, & Shapiro, Citation2016; Moll et al., Citation2016). Moreover, early alphabet knowledge is a particularly strong predictor of later reading difficulties, especially among children who have a family history of reading and/or language difficulties (Moll et al., Citation2016; Thompson et al., Citation2015).
Classroom factors
The classroom context provides an opportunity to foster children’s alphabet knowledge through the quality of the physical literacy environment, quality of instructional opportunities, and amount of alphabet instruction. Current research shows that early literacy learning opportunities vary considerably among classrooms and children (Pelatti, Piasta, Justice, & O’Connell, Citation2014). Moreover, research shows positive associations between the quality of the physical literacy environment and children’s print and alphabet knowledge outcomes (Guo et al., Citation2010, Citation2012), as well as between the quality and quantity of instruction and gains in children’s alphabet knowledge (Chien et al., Citation2010; Connor, Morrison, & Slominski, Citation2006; Mashburn et al., Citation2008). Therefore, classroom factors are potentially important to examine in relation to children’s alphabet knowledge growth.
This study
This study extends existing literature by using GMM to describe and characterize U.S. children’s development of alphabet knowledge. Specifically, this study addressed four aims. First, we examined profiles of young children’s letter name and letter sound knowledge development over approximately 14 months. Based on earlier research findings, albeit specific to letter name knowledge (Torppa et al., 2006), we anticipated finding three distinct profiles that differed in initial level and growth across this time period. Second, we examined the extent to which profiles of letter name and letter sound knowledge were similar for individual children. Evidence indicates strong associations between levels of letter name and letter- sound knowledge (McBride-Chang, Citation1999) but that mastery of letter name knowledge tends to precede letter sound knowledge for children in the USA (Drouin et al., Citation2012); thus, we predicted that, for the same individual child, initial levels and growth of letter name and letter sound knowledge would be interrelated but that letter sound development might lag behind that for letter names. Third, we examined characteristics potentially associated with profiles of alphabet knowledge growth, including both child-specific factors (i.e., age, race, ethnicity, family income, maternal education, family risk for reading difficulties, and home literacy environment) and classroom characteristics (i.e., quality of the classroom literacy environment, quality of instructional support, and amount of alphabet instruction). Based on the extant literature, we expected finding associations with child, home/family, and classroom factors. Finally, we examined whether profiles of alphabetic knowledge were predictive of children’s kindergarten readiness. Given the importance of alphabet knowledge to later reading skills (Ehri, Citation1987; National Early Literacy Panel, Citation2008), we predicted that children in profiles with higher initial levels and higher rates of growth would have higher readiness scores at kindergarten entry.
Method
Participants
Data for this study were drawn from a larger project (Piasta et al., Citation2017, Citation2020) that followed preschool-aged children’s emergent literacy skill development over an approximately 14-month period. Early childhood educators located throughout one midwestern U.S. state were invited to participate, and we randomly selected up to five eligible preschool-aged children per educator to contribute data to the project. Eligibility criteria included parental consent, ability to proficiently speak and understand English, and no profound disabilities.
This study involved the 998 children (50% female), located in 250 early childhood classrooms, participating in the final two cohorts of the larger project (2012–2013 or 2013–2014) for whom alphabet knowledge data were available. On average, children were 56.50 months old (SD = 4.84). Most were White (72%) and non-Hispanic/Latinx (95%); 21% were Black, and 7% were from other or mixed racial backgrounds. Children’s SES varied. Maternal education levels included a high school diploma or less (28%), some college but no degree (28%), bachelor’s or associate’s degree (30%), or an advanced degree (14%). Annual family income ranged from less than $5000 to more than $85,000, with 36% of families earning between $0 and $25,000 annually, 27% earning between $25,001 and $50,000, 13% earning between $50,001 and $75,000, and 24% earning more than $75,001. Children were enrolled in early childhood classrooms affiliated with private childcare/preschool centers (31%), public school systems (60%), and home/family-based childcare (9%); some classrooms were also affiliated with federal Head Start programs (24%). Classrooms were located in rural (35%), urban (28%), and suburban (37%) areas.
Procedures
Upon project enrollment in the fall of the academic year, children’s caregivers completed questionnaires to report demographic and background information. Research staff directly assessed children’s letter name and letter sound knowledge in the fall (Time 1; T1) and spring (Time 2; T2) of the academic year during which children initially participated (i.e., preschool year) as well as in the fall of the subsequent academic year (Time 3; T3), when some children remained in preschool and others had matriculated to kindergarten. Most data were collected within a 2-month span, with some variability around this, such that the time interval from T1 to T3 was 10–14 months for 89% of children. Research staff administered assessments individually to each child in a quiet location at their early childhood program or elementary school; before beginning data collection, all staff completed training on each assessment, passed a quiz concerning assessment content, administration, and scoring, and were observed during a practice administration. In addition to these assessments administered by research staff, we collected state kindergarten readiness data for the subsample of children who matriculated to public kindergarten classrooms in the fall of 2013; kindergarten readiness data were unavailable for those who matriculated to kindergarten in the fall of 2014 because the state began using a new kindergarten assessment and declined to share data that year.
Research staff also collected data concerning the early childhood classroom environments that these children experienced. We conducted one videotaped classroom observation per classroom in both the fall and spring of children’s initial year of participation (i.e., preschool). These observations were scheduled at the classroom educator’s convenience, lasted the duration of instructional time as defined by the educator (M = 1 h 19 min, SD = 17 min), and were representative of a typical instructional day as rated by the educator (M = 4.22, SD = 1.02 on a 5-point scale; 1 = “not typical at all” and 5 = “very typical”). We coded these observations as described below.
Measures
Letter name and letter sound knowledge
We assessed children’s letter name knowledge using the uppercase and lowercase letter recognition subtests of the Phonological Awareness Literacy Screening for Preschool (Invernizzi, Sullivan, Meier, & Swank, Citation2004). Children are presented with all 26 letters, first in uppercase and then in lowercase, in a fixed, random order and asked to name each letter. Children receive one point for each correct response (max = 52). Internal consistency (α) was 0.98 in this sample.
We assessed children’s letter sound knowledge using the letter sound short forms (Piasta, Farley, Phillips, Anthony, & Bowles, Citation2018; Piasta et al., Citation2016). As described in prior work, this assessment was rigorously developed using item response theory (IRT) and includes four different assessment forms. All forms are equated on difficulty and exhibit high reliability based on IRT analyses; scores correlate at 0.85 with the Letter Sounds subtest of the Phonological Awareness Literacy Screening for Preschool. Children are presented with six letters, depicted in both uppercase and lowercase, in a fixed, random order, and asked to provide the sound that corresponds to each letter. Any sound commonly associated with a letter is considered correct, and children receive one point for each correct response. Raw scores are converted to a scale of 0–26 (see Piasta et al., Citation2018). In this study, children completed one of four randomly selected short forms at each assessment point, and internal consistency (α) ranged from 0.83 to 0.89 across forms.
Demographic information and family risk
Children’s demographic information, including age, race, ethnicity, maternal education level, and annual family income were reported by their caregivers via questionnaire in the fall of children’s initial year of participation. Notably, children’s race was dichotomized into minority versus non-minority status, given that the majority were White. Maternal education data were grouped into four discrete categories: high school diploma or less, some college but no degree, associates or bachelor’s degree, or an advanced degree. Family income was reported in $5000 increments, from $5000 or less to $85,001 or more; for analysis, increments were considered as a continuous, ratio scale. Caregivers also reported whether either of the child’s biological parents had a history of reading and/or language difficulties. Similar to previous studies (Gallagher, Frith, & Snowling, Citation2000; Scarborough, Citation1990), children whose parents responded positively to these items were considered to be at family risk for reading difficulties.
Home literacy environment
CChildren’s caregivers also completed Griffin and Morrison’s (1997) Home Literacy Environment scale in the fall of children’s initial year of participation. The scale was adapted slightly to provide more response options (e.g., increasing the range for number of books in the home). Caregivers respond to nine items concerning whether a family member holds a library card, the number of newspaper and magazine subscriptions and books in the home, and frequency of television watching and reading activities. The composite score is the sum of endorsed items (prorated based on the response scale), with the television-watching item reverse coded. The Home Literacy Environment scale correlates with children’s early language and literacy skills (Griffin & Morrison, Citation1997); internal consistency (α) was 0.67 in the current sample.
Classroom alphabet learning opportunities
Research staff used an adaptation of the Individualizing Student Instruction coding scheme (see Pelatti et al., Citation2014) to determine the amount of alphabet learning opportunities during the videotaped fall and spring classroom observations. Research staff coded the number of minutes that each individual child experienced opportunities to learn about letter names and/or letter sounds. Any activity lasting at least 15 s was coded, regardless of grouping (e.g., whole class, small group, and individual child) and whether the activity was teacher- or child-initiated. Amounts were averaged across the fall and spring observations to estimate children’s alphabet learning opportunities on a typical day. Prior to coding, research staff completed rigorous training that included viewing a training video, scoring at least 80% correct on four quizzes testing knowledge regarding coding content, multiple opportunities to code with and receive feedback from a master coder, and achieving initial reliability levels of at least 0.70 across three master-coded videos as measured by two-way random, agreement, single-measures intraclass correlations (ICCs; Hallgren, Citation2012). During coding, research staff double-coded randomly selected 20 min video segments for 20% of observations; the ICC for coding of alphabet learning opportunities was 0.96 indicating that most of the variance was due to differences across classrooms rather than differences in coder.
Classroom literacy environment
Research staff used the Classroom Literacy Observation Profile (CLOP; McGinty & Sofka, Citation2009) to code the quality of the physical classroom literacy environment live during fall and spring observations. Similar to other classroom literacy environment measures, the CLOP measures the availability and use of literacy-related materials (e.g., books and library area and writing center), environmental print (e.g., alphabet charts and labels), and literacy-related technology (e.g., computer software and listening center) in the classroom. Items are rated with respect to presence or frequency. These scores are converted to a scale of 0–1 for each item and summed for each observation (maximum = 23) with higher scores representing higher quality classroom literacy environments (internal consistency = 0.80). Fall and spring scores were averaged. Prior to completing the CLOP, research staff was required to demonstrate greater than 90% agreement on each CLOP item on three consecutive administrations with a master observer.
Classroom instructional quality
Research staff coded the general quality of classroom instruction from videos of fall and spring observations using the instructional support domain of the Classroom Assessment Scoring System-PreK version (CLASS; Pianta, La Paro, & Hamre, Citation2006). Observations were parsed into 20 min segments, and three segments were randomly selected and coded for each observation. Instructional support was coded per the CLASS manual, using a scale of 1 (poor quality) to 7 (high quality). The scale captures educators’ provision of rich language modeling, opportunities for concept development, and instructional feedback. Fall and spring scores were averaged to reflect instructional quality on a typical day. Prior to coding, research staff completed a CLASS workshop led by a certified CLASS trainer and met the initial reliability standards set by CLASS developers. During coding, coders exhibited 91% agreement for the instructional support dimension on the 20% of video segments that were randomly selected for double coding.
Kindergarten readiness
For children in the 2012–2013 cohort who matriculated into public kindergarten classrooms (n = 204), kindergarten readiness was assessed via the state’s Kindergarten Readiness Assessment-Literacy (KRAL). The KRAL focuses exclusively on language and literacy skills and was administered in the fall by children’s kindergarten teachers. Children respond to items assessing their ability to respond to when and why questions, repeat sentences, identify letters, produce rhymes, and identify alliteration. Scores are totaled and can range from 0 to 29. KRAL scores are positively associated with third-grade reading achievement (r = 0.47; Logan, Justice, & Pentimonti, Citation2014), and the technical report indicates internal consistency of 0.84 and adequate item-fit statistics (American Institutes for Research, Citation2004).
Results
provides descriptive information for all study variables. Notably, children’s alphabet knowledge increased over time, exhibiting negative skew by T3. Below, we present the analyses and results for each of our four research aims. We first estimated preliminary multilevel latent growth curve analyses to identify the shape of growth in children’s alphabet skills and determine the extent of shared variance due to the nesting of children with classrooms. Next, we used growth mixture modeling to identify profiles of growth in children’s letter name and letter sound knowledge. We subsequently extracted individual children’s profile memberships from the GMMs and cross-tabulated these to examine similarities between letter name and letter sound knowledge growth. We then used multilevel multinomial logistic regression to determine whether profile membership could be predicted by child, home/family, and classroom characteristics. Finally, we used multilevel regression analyses to predict children’s kindergarten readiness from profile membership. All code used to run analyses is available from the second author upon request.
Table 1. Descriptive statistics for the full sample and by profile.
Profiles of children’s letter name and letter sound knowledge growth
To address the first aim of the study, we used Mplus software (L. K. Muthén & Muthén, Citation1998–2012) and restricted maximum likelihood estimation to examine profiles of children’s alphabet knowledge growth. We first conducted preliminary multilevel growth curve analyses, nesting children with classrooms and modeling growth from T1 to T3 in separate letter name and letter sound knowledge models. These analyses, centered at T1, established children’s baseline knowledge (intercepts = 26.31 and 8.55, for letter name and sound knowledge, respectively) and that children exhibited significant linear growth over time (slopes = 8.16 and 4.15; all ps < .001). These analyses also indicated significant shared classroom variance in both intercepts (ICCs = 0.22 and 0.15) and slopes (ICCs = 0.21 and 0.23). We thus validated that growth in these skills does occur and that nesting children within classrooms are necessary.
Next, we examined profiles of children’s letter name and letter sound knowledge growth by conducting a series of multilevel GMMs (B. Muthén, Citation2004; see Appendix for sample code). These modeled children’s letter name and letter sound knowledge growth over time, mirroring the preliminary growth analyses, but also determined whether children exhibited profiles based on growth parameters (i.e., level and slope). In these exploratory models, we simultaneously considered several indicators to determine the number of profiles that should be retained for each outcome, including model fit, parsimony, conceptual interpretation, and average posterior probability (Nylund, Asparouhov, & Muthén, Citation2007). The total number of initial stage random starts was increased to 500, and the number of final stage optimization was 20 (see Appendix).
Model fit indices are presented in . To select the number of profiles to retain, we first examined the Bayesian Information Criterion for improved model fit (i.e., smaller number; Kass & Raftery, Citation1995). Although there is a large difference between models with 1 versus 2 and 2 versus 3 profiles, the reductions were smaller particularly when comparing models with 4 versus 5 profiles; this supports selection of the models with either 3 or 4 profiles. Results of likelihood ratio tests, which indicate whether the model with the specified number of profiles fits significantly better than a model with one fewer profile (Lo, Mendell, & Rubin, Citation2001), supported retaining 4 profiles for both letter name and letter sound knowledge; the 5-profile models did not fit significantly better than the 4-profile models. Entropy was larger than .80 and therefore adequate for all examined models (Nylund et al., Citation2007). Next, we considered the interpretive meaning of identified profiles (Nylund et al., Citation2007). The model with 4 profiles included two groups of children with highly similar growth patterns, only distinguished by a small difference between growth rates, and was not conceptually distinct from the 3-profile solution. When this is the case, best practice suggests that we choose the model with fewer profiles (Logan & Pentimonti, Citation2016). Finally, we checked the average posterior probabilities for the 3-profile model, which indicate the probability that children within an assigned profile belong to that particular profile (Nylund et al., Citation2007). These were high for both letter name knowledge (range = 0.89–0.97) and letter sound knowledge (range = 0.88–0.94), suggesting an adequate fit to the data. Thus, full consideration of all indicators suggested that the 3-profile model was parsimonious and sufficient to represent the underlying structure of the data for both letter name and sound knowledge. Notably, given methodological research suggesting that GMMs often result in a three-profile solution when outcomes are non-normally distributed and linear growth is assumed (Bauer & Curran, Citation2003), we also tested whether results would differ when allowing for non-linear growth. The findings were the same when estimating freed-loading growth models, and we present results from the linear 3-profile models for the sake of parsimony.
Table 2. Model fit information for candidate growth mixture models of letter name and sound knowledge.
displays profiles of children’s alphabet knowledge growth. The results for letter name and letter sound knowledge were similar, in that each indicated profiles characterized as High (comprising 50 and 33% of the sample, respectively), Growing (34 and 41%), and Delayed (16 and 25%). In the High profile, children exhibited initially high levels of alphabet knowledge (letter name intercept = 43.17; letter sound intercept = 18.73); because these children were close to mastering letter names and sounds, they showed little to no growth as evidenced by small slope values (letter name slope = 3.37; letter sound slope = 1.72). In the Growing profile, children exhibited initially low levels of knowledge but rapid growth over time (intercept = 12.50, slope = 16.17 for letter name knowledge; intercept = 3.91, slope = 8.11 for letter sound knowledge). In the Delayed profile, children also exhibited initially low levels of knowledge but minimal growth over time (intercept = 5.73, slope = 4.82 for letter name knowledge; intercept = 3.72, slope = 0.84 for letter sound knowledge).
Figure 1. Observed profiles (High, Growing, and Delayed) of letter name knowledge (top; maximum score = 52) and letter sound knowledge (bottom; maximum score = 26). T1: Time 1; T2: Time 2; T3: Time 3.
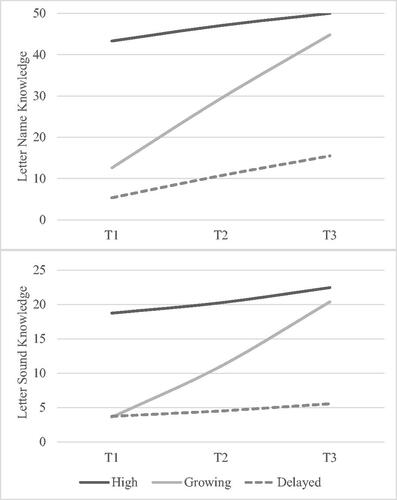
To statistically compare levels of alphabet knowledge across profiles, we estimated pairwise comparisons in HLM7 (Raudenbush, Bryk, Cheong, Congdon, & Du Toit, Citation2004), using a Bonferroni correction to control the Type I error rate. We also calculated Cohen’s d effect sizes to contextualize differences among profiles; d was calculated as the mean difference between two profiles divided by the standard deviation of the full sample, with values of 0.40 considered moderate and greater than 0.80 considered large. At T1, children in the High profile scored significantly higher than children in the other two profiles (d = 1.68–2.07; ps < .001). Children in the Growing and Delayed profiles were more similar to one another, with a small but significant difference between profiles for letter name knowledge (d = 0.39, p < .001), and no difference for letter sound knowledge (d = 0.01, p = .988). At T3, children in the High profile continued to score significantly higher than those in the Delayed profile (ds > 2.0, ps < 0.001) but exhibited only small-to-moderate differences when compared to those in the Growing profile (d = 0.41 and 0.27 for letter name and letter sound knowledge, respectively; ps < .001). Children in the Growing profile also scored significantly higher than those in the Delayed profile for both letter name and letter sound knowledge, with large effect sizes (d = 2.29 and 1.97; ps < .001).
Alignment of letter name and letter sound knowledge profile membership
To address the second aim of the study concerning the extent to which the profiles of letter name and letter sound knowledge were similar for individual children, we first extracted children’s profile membership from the GMMs. We cross-tabulated individual children’s membership in the three-letter name knowledge profiles with their membership in the three letter sound knowledge profiles. This is depicted in , with the numbers on the diagonal indicating children who were in the same profile for both alphabet knowledge outcomes. A chi-square test confirmed that the two profile memberships were related, χ2 (4) = 641.20, p < .001. Most children (69%) were classified in the same profile for both outcomes. Moreover, when children belonged to different profiles, most were classified in more advanced profiles of letter name knowledge than letter sound knowledge (27%), with only 5% showing the reverse pattern.
Table 3. Cross-tabulation of letter name and letter sound knowledge profiles.
Predicting alphabet knowledge growth profiles
The third aim was to examine whether child, home/family, and classroom characteristics predicted children’s alphabet knowledge profile membership (descriptive statistics in ). As demonstrated in , there was substantial missing data for the child, home/family, and classroom characteristics. Given that missingness was systematically related to other variables in the dataset (i.e., could be considered missing at random), we imputed 15 datasets using the multiple imputation procedure (ProcMI) in SAS version 9.4. Imputation included all variables of interest in this study (see ) plus additional variables documented as related to missingness and/or children’s outcomes in previous analyses of the dataset (i.e., program affiliation with Head Start; whether an early childhood special education program; program location [urban, suburban, rural]; early childhood educators’ years of teaching experience, education levels, and certification; child sex; Piasta et al., Citation2020). We then modeled children’s profile membership, extracted from the GMMs, as a categorical outcome using multilevel multinomial logistic regression via the GLMMIX procedure in SAS. We used both univariate and multivariable approaches to examine the extent to which characteristics independently (univariate approach; predictors entered separately into models) and uniquely (multivariable approach; predictors entered simultaneously into models) predicted children’s profile membership. To account for the multiple contrasts comparing High, Delayed, and Growing profiles, we applied a Bonferroni correction to control the Type I error rate. shows results, pooled across imputed datasets, by displaying the odds ratios for each significant predictor; these represent the differential odds of being in one profile versus another. Odds ratios greater than one indicate that increases in the predictor increase the likelihood of being in a given profile relative to the reference profile; odds ratios less than one indicate that increases in the predictor increase the likelihood of being in the reference profile.
Table 4. Significant odds ratios for multinomial logistic regression models predicting letter name and letter sound knowledge profiles from child, home/family, and classroom characteristics.
With the exception of race, most characteristics predicted profile membership when considered independently; fewer characteristics uniquely predicted profile membership. Notably, the majority of characteristics differentiated children in the High profile from those in the Growing or Delayed profiles. For both letter name and sound knowledge, children in the High profiles tended to be older, have higher family incomes and greater levels of maternal education, have less family risk for reading difficulties, and experience better home literacy environments. In multivariable models, age continued to differentiate the High profiles for both outcomes, but family income differentiated High profiles only for letter name knowledge, maternal education differentiated High profiles only for letter sound knowledge, family risk differentiated only High versus Delayed profiles for letter sound knowledge, and home literacy environment differentiated only High versus Delayed profiles for letter name knowledge. Classroom characteristics also differentiated High versus Growing and Delayed profiles. In both univariate and multivariable models, children in the High profile experienced more classroom alphabet learning opportunities compared to those in the Delayed profile for letter name knowledge and compared to those in the Growing profile for letter sound knowledge. Children in the High profile also experienced lower quality classroom literacy environments but higher classroom instructional quality than those in the Growing profile for letter name and sound knowledge, respectively; these results held only in univariate models.
Few characteristics differentiated the Growing versus Delayed profiles. For letter name knowledge, children in the Growing profile experienced better home literacy environments than those in the Delayed profile in the univariate model only. For letter sound knowledge, children in the Growing profile were less likely to be Hispanic/Latinx than those in the Delayed profile. None of the classroom characteristics differentiated between Growing and Delayed profiles.
Prediction of kindergarten readiness
The final aim was to examine whether alphabet knowledge profile membership predicted children’s kindergarten readiness (see descriptive data in ). Because these data were available for only a subset of the sample, we first compared children for whom we did and did not have kindergarten readiness data on all variables listed in . In total, 664 children were included, nested within 232 classrooms. In general, the subset of children for whom kindergarten readiness data were available was similar to the larger sample, with the exception that children matriculating to public kindergarten classrooms tended to be older, t(970) = 3.10, p < .001, and experience lower instructional quality in their preschool classrooms, t(982) = −5.86, p < .001.
Next, we conducted two multilevel regression analyses predicting kindergarten readiness from profile membership, analyzing letter name, and letter sound knowledge profiles separately. Variance components indicated that significant variance in kindergarten readiness was attributable to their preschool classroom (ICC = 0.24, p = .005). For letter name and letter sound knowledge, children in the High profiles had significantly higher kindergarten readiness than those in the Delayed or Growing profiles (ds = 0.73–1.62), and children in the Growing profile had significantly higher kindergarten readiness than those in the Delayed profile (ds = 0.62–0.83, all ps < .001).
Discussion
This study adds to extant work concerning U.S. children’s alphabet knowledge development as a key and critical aspect of early literacy. Major contributions of this work include a focus on growth over time for both letter name and letter sound knowledge, use of a person-centered approach to identify common developmental patterns, and consideration of a wide variety of child, home/family, and classroom factors that may promote resiliency or increase risk. We discuss key findings and implications below.
Developmental patterns in alphabet knowledge growth
As hypothesized, we found that children exhibited common patterns in their alphabet knowledge development that depended both on level of knowledge and rate of growth over time. Specifically, we found three distinct profiles of alphabet knowledge development: High, Growing, and Delayed. Children in the High profile exhibited initially high levels of knowledge and thus little growth before mastery. Children in the Growing profile exhibited significantly lower initial levels of knowledge but substantial growth over time, such that they were catching up to their High peers. Children in the Delayed profile also exhibited initially lower levels of knowledge but did not make much progress over time; these children are likely to be at risk for reading difficulties, continuing to score more than 1.5 (letter sound knowledge) to 2 (letter name knowledge) SDs below the sample mean despite more than a year of schooling. These findings replicate those reported by Torppa et al. (2006; see also Heilmann et al., Citation2018) for letter name knowledge and expand those results to demonstrate profiles for letter sound knowledge as well. Children’s letter sound knowledge development followed identical developmental patterns, with the same High, Growing, and Delayed profiles, and children typically exhibited either similar patterns for both letter name and letter sound knowledge or had more advanced letter name knowledge development. These findings also align with prior work showing moderate-to-strong correlations between letter name and letter sound knowledge, with letter names often mastered first by U.S. children (Drouin et al., Citation2012; Ellefson et al., Citation2009; McBride-Chang, Citation1999).
The contribution of this study to the field was afforded by consideration of growth over time along with use of a person-centered approach to identify developmental patterns. With few exceptions, such as the work by Torppa et al. (2006), most studies to date have considered individual or group differences in alphabet knowledge at static points in time (e.g., Denton & West, Citation2002; Evans et al., Citation2006; Hecht et al., Citation2000; Treiman et al., Citation1998). These studies have substantially increased our understanding concerning children’s acquisition of alphabet knowledge. However, the nature of alphabet knowledge, as a skill that is typically mastered prior to first grade (Denton & West, Citation2002), can present methodological challenges. Floor or ceiling effects may limit the variance in alphabet knowledge levels at any given point in time and restrict the analyses that may be conducted or the accuracy of conclusions that can be drawn about a particular sample of children; consideration of growth in addition to level can help overcome these issues. One limitation of current growth mixture modeling approaches to note, however, is the inability to incorporate exact time metrics into analyses; the ability to account for specific measurement occasions for individual children may improve precision in future models.
This study shows that considering only levels of knowledge at particular points in time may mask important differences among children and thereby highlights the unique insights provided by considering children’s developmental trajectories (see also Bornstein et al., Citation2016). In a previous study by Heilmann et al. (Citation2018), for example, many children did not meet the benchmark of knowing 10 letter names at the start of the year. However, within this larger group of children, some proceeded to learn enough letter names such that they met the benchmark by the end of the year whereas others did not; these developmental differences were not initially apparent. Similarly, in this study, children in the Growing and Delayed profiles, as groups, did not differ in their initial letter sound knowledge, and the range of initial scores for children in these profiles overlapped for both letter name and letter sound knowledge (range = 0–29 and 1–12, respectively, for the Growing profile and range = 0–49 and 1–23 for the Delayed profile). Yet, the trajectories for children in these two profiles differed dramatically, with children in the Growing profile developing levels of alphabet knowledge that were increasingly similar to those in the High profile. As such, children in the Growing profile ultimately had significantly higher kindergarten readiness than those in the Delayed profile, which might not have been predicted based on initial scores. Likewise, although children in both the Growing and High profiles may have mastered all letter names and sounds by the final assessment point, their kindergarten readiness continued to differ substantially. These findings underscore the importance of considering children’s alphabet knowledge development over time rather than simply initial or end levels and imply that both level and growth rate should be considered in risk assessment.
Several implications for alphabet knowledge assessment and instruction follow from these findings. First, alphabet knowledge comprises a critical emergent literacy skill that is important for kindergarten readiness and later reading outcomes (Foster & Miller, Citation2007; National Early Literacy Panel, Citation2008) and, as such, should be included in emergent literacy screenings. This echoes similar calls in the literature (Lonigan et al., Citation2011; Piasta, Citation2014). Second, our results expand these calls to go beyond initial screenings and continue to monitor young children’s progress in alphabet knowledge development over time. This may be particularly important for children who exhibit initially low levels of alphabet knowledge, to distinguish those whose subsequent growth suggests a positive trajectory toward mastery versus those who do not (Heilmann et al., Citation2018). Children in the latter group are most likely to constitute those at highest risk for later reading difficulties, although this assumption requires further longitudinal study to establish which of these children actually experienced difficulties with conventional reading. Finally, both screening and progress monitoring should inform alphabet instruction, with such instruction differentiated to meet individual learning needs (Piasta, Citation2014). Consistent with multi-tier systems of supports and response-to-intervention approaches (Greenwood et al., Citation2014), children with initially low alphabet knowledge who show little growth may require increasingly intensive instruction to support their literacy learning and mitigate later reading difficulties that may arise.
Factors related to risk and resiliency
Findings in this study often paralleled prior work concerning risk factors for lower alphabet knowledge. For example, compared to children in the Growing or Delayed profiles, those in the High profile tended to come from higher SES backgrounds and better home literacy environments (Hecht et al., Citation2000). These children were also significantly less likely to have parents with a history of a reading difficulty (Torppa et al., 2006). Yet, in contrast to previous findings concerning racial and ethnic differences in early literacy skills (Chien et al., Citation2010; Fryer & Levitt, Citation2002) including alphabet knowledge (Denton & West, Citation2002), the current results showed no racial differences and limited differences by ethnicity. This disparity from earlier findings may be due to differing methodologies (e.g., person-centered versus group-differences approaches) or, in the case of multivariable results, accounting for other factors, such as SES and home literacy environment. The latter can be confounded with race and ethnicity (e.g., B. M. Phillips & Lonigan, Citation2009) but likely are more proximally related to children’s literacy development, including their alphabet knowledge development. Given that the sample was predominantly White, non-Hispanic/Latinx, replication with a more diverse sample is desirable.
Factors distinguishing the Growing and Delayed profiles may signal resiliency, but we identified few such factors in this study. Only home literacy environment differentiated letter name knowledge profiles, with children in the Growing profile experiencing a more supportive home literacy environment and, conversely, those in the Delayed profile experiencing a less supportive home literacy environment. One interpretation of these results is that the home literacy environment facilitated children’s letter name learning over time. However, disentagling home literacy environment as a cause or merely a correlate of children’s letter name trajectories requires additional study. For letter sound knowledge, only ethnicity consistently differentiated the Growing and Delayed profiles and, as noted above, given the sample, these results warrant further replication.
Results for classroom factors were somewhat unexpected. Children in the High profile, who were close to mastery and required the least support for alphabet knowledge development, tended to experience higher quantity and quality of learning opportunities, despite physical literacy environments in their classrooms that were of slightly lower quality. Furthermore, classroom factors did not distinguish the Growing versus Delayed profiles; although children in the former profile showed substantial alphabet knowledge growth, their instruction and classroom experiences did not differ from those experienced by children who did not exhibit such growth. These findings may be interpreted in a number of ways. It could be that the instruction provided was insufficient to markedly affect alphabet knowledge development (as evidenced by the limited alphabet learning opportunities and low instructional quality) or that the difference in classroom factors for children in the High profile represents a selection artifact, with children from higher SES backgrounds enrolled in higher quality early childhood programming (Chien et al., Citation2010; Pianta et al., Citation2005). Alternatively, it could be that children in the High profile elicited more alphabet learning opportunities from their educators, who are responding to their knowledge of and interest in the alphabet, or that children in the Delayed profile, in particular, required more intensive instruction to demonstrate growth (Greenwood et al., Citation2014). Finally, it could be that the procedures and measures used in this study did not adequately capture aspects of classroom instruction that facilitate alphabet knowledge development and that would differentiate the Growing and Delayed profiles. Validly measuring aspects of classroom practices that are important for young children’s learning continues to be a challenge for the field, and many current measures show only modest associations with children’s outcomes (Burchinal, Citation2018).
Conclusion
In conclusion, U.S. children tend to follow one of three patterns of alphabet knowledge development. These patterns have consequences for children’s subsequent kindergarten readiness and, potentially, their risk for later reading difficulties. Future research should continue to examine factors contributing to the alphabet knowledge growth of children who exhibit positive trajectories, despite low levels of initial knowledge, to determine how acquisition of this critical emergent literacy skill may be best supported.
Acknowledgement
This research would not have been possible without collaboration from Ann A. O'Connell, the Early Childhood Quality Network including Dennis Sykes, Sharon Sullivan, Kathryn Rider, and Melissa Ross, the Ohio Department of Education's Office of Early Learning and School Readiness, Rongfang Jia, and the research staff members responsible for coordinating and executing data collection activities. We also express deep appreciation for the early childhood professionals involved, as well as the children and families who participated. The opinions expressed are those of the authors and do not necessarily represent the views of the Institute of Education Sciences, U.S. Department of Education, Early Childhood Quality Network, or Ohio Department of Education.
Disclosure statement
No potential conflict of interest was reported by the authors.
Additional information
Funding
References
- American Institutes for Research. (2004). Kindergarten entry-level literacy instrument field-test technical report. Columbus, OH: Author.
- Bauer, D. J., & Curran, P. J. (2003). Distributional assumptions of growth mixture models: Implications for overextraction of latent trajectory classes. Psychological Methods, 8(3), 338–363. doi:https://doi.org/10.1037/1082-989X.8.3.338
- Bornstein, M. H., Hahn, C. S., & Putnick, D. L. (2016). Long-term stability of core language skill in children with contrasting language skills. Developmental Psychology, 52(5), 704–716. doi:https://doi.org/10.1037/dev0000111
- Bradley, R. H., Corwyn, R. F., McAdoo, H. P., & Coll, C. G. (2001). The home environments of children in the United States part i: Variations by age, ethnicity, and poverty status. Child Development, 72(6), 1844–1867. doi:https://doi.org/10.1111/1467-8624.t01-1-00382
- Bronfenbrenner, U., & Morris, P. A. (2007). The bioecological model of human development. In R. M. Lerner & W. Damon (Eds.), Handbook of child psychology (6th ed., Vol. 1, pp. 793–828). Hoboken, NJ: John Wiley & Sons.
- Bulotsky-Shearer, R. J., Bell, E. R., & Dominguez, X. (2012). Latent profiles of problem behavior within learning, peer, and teacher contexts: Identifying subgroups of children at academic risk across the preschool year. Journal of School Psychology, 50(6), 775–798. doi:https://doi.org/10.1016/j.jsp.2012.08.001
- Burchinal, M. (2018). Measuring early care and education quality. Child Development Perspectives, 12(1), 3–9. doi:https://doi.org/10.1111/cdep.12260
- Burgess, S. R. (2011). Home literacy environments provided to very young children. Early Child Development and Care, 181(4), 445–462. doi:https://doi.org/10.1080/03004430903450384
- Carroll, J. M., Solity, J., & Shapiro, L. R. (2016). Predicting dyslexia using prereading skills: The role of sensorimotor and cognitive abilities. Journal of Child Psychology and Psychiatry, and Allied Disciplines, 57(6), 750–758. doi:https://doi.org/10.1111/jcpp.12488
- Celeux, G., & Soromenho, G. (1996). An entropy criterion for assessing the number of clusters in a mixture model. Journal of Classification, 13(2), 195–212. doi:https://doi.org/10.1007/BF01246098
- Chien, N. C., Howes, C., Burchinal, M., Pianta, R. C., Ritchie, S., Bryant, D. M., … Barbarin, O. A. (2010). Children’s classroom engagement and school readiness gains in prekindergarten. Child Development, 81(5), 1534–1549. doi:https://doi.org/10.1111/j.1467-8624.2010.01490.x
- Connor, C. M., Morrison, F. J., & Slominski, L. (2006). Preschool instruction and children’s literacy skill growth. Journal of Educational Psychology, 98(4), 665–689. doi:https://doi.org/10.1037/0022-0663.98.4.665
- Denham, S. A., Bassett, H., Mincic, M., Kalb, S., Way, E., Wyatt, T., & Segal, Y. (2012). Social-emotional learning profiles of preschoolers’ early school success: A person-centered approach. Learning and Individual Differences, 22(2), 178–189. doi:https://doi.org/10.1016/j.lindif.2011.05.001
- Denton, K., & West, J. (2002). Children’s reading and mathematics achievement in kindergarten and first grade. Education Statistics Quarterly, 4, 19–26.
- Diamond, K. E., & Baroody, A. E. (2013). Associations among name writing and alphabetic skills in prekindergarten and kindergarten children at risk of school failure. Journal of Early Intervention, 35(1), 20–39. doi:https://doi.org/10.1177/1053815113499611
- Dodd, B., & Carr, A. (2003). Young children’s letter-sound knowledge. Language, Speech, & Hearing Services in Schools, 34, 128–137. doi:https://doi.org/10.1044/0161-1461(2003/011)
- Drouin, M., Horner, S. L., & Sondergeld, T. A. (2012). Alphabet knowledge in preschool: A Rasch model analysis. Early Childhood Research Quarterly, 27(3), 543–554. doi:https://doi.org/10.1016/j.ecresq.2011.12.008
- Ehri, L. C. (1987). Learning to read and spell words. Journal of Reading Behavior, 19(1), 5–31. doi:https://doi.org/10.1080/10862968709547585
- Ellefson, M., Treiman, R., & Kessler, B. (2009). Learning to label letters by sounds or names: A comparison of England and the United States. Journal of Experimental Child Psychology, 102(3), 323–341. doi:https://doi.org/10.1016/j.jecp.2008.05.008
- Evans, M. A., Bell, M., Shaw, D., Moretti, S., & Page, J. (2006). Letter names, letter sounds and phonological awareness: An examination of kindergarten children across letters and of letters across children. Reading and Writing, 19(9), 959–989. doi:https://doi.org/10.1007/s11145-006-9026-x
- Evans, M. A., Shaw, D., & Bell, M. (2000). Home literacy activities and their influence on early literacy skills. Canadian Journal of Experimental Psychology, 54(2), 65–75. doi:https://doi.org/10.1037/h0087330
- Farver, J. A. M., Xu, Y., Lonigan, C. J., & Eppe, S. (2013). The home literacy environment and Latino Head Start children’s emergent literacy skills. Developmental Psychology, 49(4), 775–791. doi:https://doi.org/10.1037/a0028766
- Foster, W. A., & Miller, M. (2007). Development of the literacy achievement gap: A longitudinal study of kindergarten through third grade. Language, Speech, and Hearing Services in Schools, 38(3), 173–181. doi:https://doi.org/10.1044/0161-1461(2007/018)
- Fryer, R. G., & Levitt, S. D. (2002). Understanding the Black-White test score gap in the first two years of school. National Bureau of Economic Research Working Paper Series. (NBER-WP-8975). Cambridge, MA: National Bureau of Economic Research.
- Gallagher, A., Frith, U., & Snowling, M. J. (2000). Precursors of literacy delay among children at genetic risk of dyslexia. Journal of Child Psychology and Psychiatry, 41(2), 203–213. doi:https://doi.org/10.1017/S0021963099005284
- Greenwood, C. R., Carta, J. J., Goldstein, H., Kaminski, R. A., McConnell, S. R., & Atwater, J. (2014). The center for response to intervention in early childhood: Developing evidence-based tools for a multi-tier approach to preschool language and early literacy instruction. Journal of Early Intervention, 36(4), 246–262. doi:https://doi.org/10.1177/1053815115581209
- Griffin, E. A., & Morrison, F. J. (1997). The unique contribution of home literacy environment to differences in early literacy skills. Early Child Development & Care, 127, 233–243. doi:https://doi.org/10.1080/0300443971270119
- Guo, Y., Justice, L. M., Kaderavek, J. N., & McGinty, A. (2012). The literacy environment of preschool classrooms: Contributions to children's emergent literacy growth. Journal of Research in Reading, 35(3), 308–327. doi:https://doi.org/10.1111/j.1467-9817.2010.01467.x
- Guo, Y., Piasta, S. B., Justice, L. M., & Kaderavek, J. N. (2010). Relations among preschool teachers’ self-efficacy, classroom quality, and children’s language and literacy gains. Teaching and Teacher Education, 26(4), 1094–1103. doi:https://doi.org/10.1016/j.tate.2009.11.005
- Hallgren, K. A. (2012). Computing inter-rater reliability for observational data: An overview and tutorial. Tutorials in Quantitative Methods for Psychology, 8(1), 23–24. doi:https://doi.org/10.20982/tqmp.08.1.p023
- Hecht, S. A., Burgess, S. R., Torgesen, J. K., Wagner, R. K., & Rashotte, C. A. (2000). Explaining social class differences in growth of reading skills from beginning kindergarten through fourth-grade: The role of phonological awareness, rate of access, and print knowledge. Reading & Writing, 12, 99–127.
- Heilmann, J. J., Moyle, M. J., & Rueden, A. M. (2018). Using alphabet knowledge to track the emergent literacy skills of children in Head Start. Topics in Early Childhood Special Education, 38(2), 118–128. doi:https://doi.org/10.1177/0271121418766636
- Invernizzi, M. A., Sullivan, A., Meier, J. D., & Swank, L. (2004). Phonological awareness literacy screening for preschool. Charlottesville, VA: University of Virginia.
- Justice, L. M., Pence, K., Bowles, R. B., & Wiggins, A. (2006). An investigation of four hypotheses concerning the order by which 4-year-old children learn the alphabet letters. Early Childhood Research Quarterly, 21(3), 374–389. doi:https://doi.org/10.1016/j.ecresq.2006.07.010
- Kass, R. E., & Raftery, A. E. (1995). Bayes factors. Journal of the American Statistical Association, 90(430), 773–795. doi:https://doi.org/10.1080/01621459.1995.10476572
- Kim, S., Im, H., & Kwon, K. A. (2015). The role of home literacy environmnet in toddlerhood in development of vocabulary and decoding skills. Child & Youth Care Forum, 44(6), 835–852. doi:https://doi.org/10.1007/s10566-015-9309-y
- Lo, Y., Mendell, N., & Rubin, D. (2001). Testing the number of components in a normal mixture. Biometrika, 88(3), 767–778. doi:https://doi.org/10.1093/biomet/88.3.767
- Logan, J. A. R., Justice, L. M., & Pentimonti, J. M. (2014). Ready to read and school success: Kindergarten readiness and the third grade reading guarantee. Columbus, OH: Crane Center for Early Childhood Research and Policy, The Ohio State University.
- Logan, J. A. R., & Pentimonti, J. M. (2016). Introduction to latent class analysis for reading fluency research. In K. Cummings & Y. Petscher (Eds.), The fluency construct (pp. 309–332). New York, NY: Springer.
- Lonigan, C. J., Allan, N. P., & Lerner, M. D. (2011). Assessment of preschool early literacy skills: Linking children’s educational needs with empirically supported instructional activities. Psychology in the Schools, 48(5), 488–501. doi:https://doi.org/10.1002/pits.20569
- Mashburn, A. J., Pianta, R. C., Hamre, B. K., Downer, J. T., Barbarin, O. A., Bryant, D., … Howes, C. (2008). Measures of classroom quality in prekindergarten and children’s development of academic, language, and social skills. Child Development, 79(3), 732–749. doi:https://doi.org/10.1111/j.1467-8624.2008.01154.x
- McBride-Chang, C. (1999). The ABCs of the ABCs: The development of letter-name and letter-sound knowledge. Merrill-Palmer Quarterly, 45, 285–308.
- McGinty, A. S., & Sofka, A. E. (2009). Classroom literacy observation profile. Charlottesville, VA: University of Virginia.
- Moll, K., Thompson, P. A., Mikulajova, M., Jagercikova, Z., Kucharska, A., Franke, H., … Snowling, M. J. (2016). Precursors of reading difficulties in Czech and Slovak children at-risk of dyslexia. Dyslexia, 22(2), 120–136. doi:https://doi.org/10.1002/dys.1526
- Muthén, B. (2004). Growth mixture modeling and related techniques for longitudinal data. In D. Kaplan (Ed.), Handbook of quantitative methodology for the social sciences (pp. 345–368). Thousand Oaks, CA: Sage.
- Muthén, L. K., & Muthén, B. O. (1998–2012). Mplus (version 7.4). Los Angeles, CA: Author.
- Nagin, D. S. (1999). Analyzing developmental trajectories: A semiparametric, group-based approach. Psychological Methods, 4(2), 139–157. doi:https://doi.org/10.1037/1082-989X.4.2.139
- National Association for the Education of Young Children. (2011). All criteria document. Washington, DC: Author.
- National Early Literacy Panel. (2008). Developing early literacy. Washington, DC: National Institute for Literacy.
- National Governors Association Center for Best Practices, & Council of Chief State School Officers. (2010). Common core state standards for English language arts and literacy in history/social studies, science, and technical subjects. Washington, DC: Authors.
- Nylund, K. L., Asparouhov, T., & Muthén, B. O. (2007). Deciding on the number of classes in latent class analysis and growth mixture modeling: A Monte Carlo simulation study. Structural Equation Modeling: A Multidisciplinary Journal, 14(4), 535–569. doi:https://doi.org/10.1080/10705510701575396
- Ozernov-Palchik, O., Norton, E. S., Sideridis, G., Beach, S. D., Wolf, M., Gabrieli, J. D. E., & Gaab, N. (2017). Longitudinal stability of pre-reading skill profiles of kindergarten children: Implications for early screening and theories of reading. Developmental Science, 20(5), e12471. doi:https://doi.org/10.1111/desc.12471
- Pelatti, C. Y., Piasta, S. B., Justice, L. M., & O’Connell, A. (2014). Language- and literacy-learning opportunities in early childhood classrooms: Children’s typical experiences and within-classroom variability. Early Childhood Research Quarterly, 29(4), 445–456. doi:https://doi.org/10.1016/j.ecresq.2014.05.004
- Pence Turnbull, K. L., Bowles, R. P., Skibbe, L. E., Justice, L. M., & Wiggins, A. K. (2010). Theoretical explanations for preschoolers’ lowercase alphabet knowledge. Journal of Speech, Language, and Hearing Research, 53(6), 1757–1768. doi:https://doi.org/10.1044/1092-4388(2010/09-0093)
- Phillips, B. M., & Lonigan, C. J. (2009). Variations in the home literacy environment of preschool children: A cluster analytic approach. Scientific Studies of Reading: The Official Journal of the Society for the Scientific Study of Reading, 13(2), 146–174. doi:https://doi.org/10.1080/10888430902769533
- Phillips, B. M., Piasta, S. B., Anthony, J. L., Lonigan, C. J., & Francis, D. J. (2012). IRTs of the ABCs: Children’s letter name acquisition. Journal of School Psychology, 50(4), 461–481. doi:https://doi.org/10.1016/j.jsp.2012.05.002
- Phillips, L. M., Norris, S. P., Osmond, W. C., & Maynard, A. M. (2002). Relative reading achievement: A longitudinal study of 187 children from first through sixth grades. Journal of Educational Psychology, 94(1), 3–13. doi:https://doi.org/10.1037/0022-0663.94.1.3
- Pianta, R. C., Howes, C., Burchinal, M., Bryant, D., Clifford, R., Early, D., & Barbarin, O. (2005). Features of pre-kindergarten programs, classrooms, and teachers: Do they predict observed classroom quality and child-teacher interactions? Applied Developmental Science, 9(3), 144–159. doi:https://doi.org/10.1207/s1532480xads0903_2
- Pianta, R. C., La Paro, K. M., & Hamre, B. K. (2006). Classroom assessment scoring system: Pre-k. Charlottesville, VA: Center for Advanced Study of Teaching and Learning.
- Piasta, S. B. (2014). Moving to assessment-guided differentiated instruction to support young children's alphabet knowledge. The Reading Teacher, 68(3), 202–211. doi:https://doi.org/10.1002/trtr.1316
- Piasta, S. B., Farley, K. S., Phillips, B. M., Anthony, J. L., & Bowles, R. P. (2018). Assessment of young children’s letter-sound knowledge: Initial validity evidence for letter-sound short forms. Assessment for Effective Intervention, 43(4), 249–255. doi:https://doi.org/10.1177/1534508417737514
- Piasta, S. B., Petscher, Y., & Justice, L. M. (2012). How many letters should preschoolers in public programs know? The diagnostic efficiency of various preschool letter-naming benchmarks for predicting first-grade literacy achievement. Journal of Educational Psychology, 104(4), 945–958. doi:https://doi.org/10.1037/a0027757
- Piasta, S. B., Phillips, B. M., Williams, J. M., Bowles, R. P., & Anthony, J. L. (2016). Measuring young children’s alphabet knowledge: Development and validation of brief letter-sound knowledge assessments. The Elementary School Journal, 116(4), 523–548. doi:https://doi.org/10.1086/686222
- Piasta, S. B., Purpura, D. J., & Wagner, R. K. (2010). Fostering alphabet knowledge development: A comparison of two instructional approaches. Reading and Writing, 23(6), 607–626. doi:https://doi.org/10.1007/s11145-009-9174-x
- Piasta, S. B., & Wagner, R. K. (2010). Developing emergent literacy skills: A meta-analysis of alphabet learning and instruction. Reading Research Quarterly, 45(1), 8–38. doi:https://doi.org/10.1598/RRQ.45.1.2
- Piasta, S. B., Justice, L. M., O'Connell, A. A., Mauck, S. A., Weber-Mayrer, M., Schachter, R. E., Spear, C. F. (2017). Effectiveness of large-scale, state-sponsored language and literacy professional development on early childhood educator outcomes. Journal of Research on Educational Effectiveness, 10, 354–378. doi: https://doi.org/10.1080/19345747.2016.1270378
- Piasta, S. B., Farley, K. S., Mauck, S. A., Soto Ramirez, P., Schachter, R. E., O'Connell, A. A.,…Weber-Mayrer, M. (2020). At-scale, state-sponsored language and literacy professional development: Impacts on early childhood classroom practices and children's outcomes. Journal of Educational Psychology, 112, 329–343. doi: https://doi.org/10.1037/edu0000380
- Raudenbush, S. W., Bryk, A. S., Cheong, Y. F., Congdon, R., & Du Toit, M. (2004). Hlm6: Hierarchical linear and nonlinear modeling. Lincolnwood, IL: Scientific Software International.
- Roberts, T. A., Vadasy, P. F., & Sanders, E. A. (2018). Preschoolers’ alphabet learning: Letter name and sound instruction, cognitive processes, and English proficiency. Early Childhood Research Quarterly, 44, 257–274. doi:https://doi.org/10.1016/j.ecresq.2018.04.011
- Sameroff, A. J., & Chandler, M. J. (1975). Reproductive risk and the continuum of caretaker casualty (Vol. 4). Chicago, IL: University of Chicago Press.
- Scarborough, H. S. (1990). Very early language deficits in dyslexic children. Child Development, 61(6), 1728–1743. doi:https://doi.org/10.2307/1130834
- Schatschneider, C., Fletcher, J. M., Francis, D. J., Carlson, C. D., & Foorman, B. R. (2004). Kindergarten prediction of reading skills: A longitudinal comparative analysis. Journal of Educational Psychology, 96(2), 265–282. doi:https://doi.org/10.1037/0022-0663.96.2.265
- Sénéchal, M. (2006). Testing the home literacy model: Parent involvement in kindergarten is differentially related to grade 4 reading comprehension, fluency, spelling, and reading for pleasure. Scientific Studies of Reading, 10, 59–87. doi:https://doi.org/10.1207/s1532799xssr1001_4
- Snowling, M. J., Gallagher, A., & Frith, U. (2003). Family risk of dyslexia is continuous: Individual differences in the precursors of reading skill. Child Development, 74(2), 358–373. doi:https://doi.org/10.1111/1467-8624.7402003
- Strang, T. M., & Piasta, S. B. (2016). Socioeconomic differences in code-focused emergent literacy skills. Reading and Writing, 29(7), 1337–1362. doi:https://doi.org/10.1007/s11145-016-9639-7
- Sunde, K., Furnes, B., & Lundetrae, K. (2020). Does introducing the letters faster boost the development of children’s letter knowledge, word reading and spelling in the first year of school? Scientific Studies of Reading, 24(2), 118–141. doi:https://doi.org/10.1080/10888438.2019.1615491
- Thompson, P. A., Hulme, C., Nash, H. M., Gooch, D., Hayiou-Thomas, E., & Snowling, M. J. (2015). Developmental dyslexia: Predicting individual risk. Journal of Child Psychology and Psychiatry, 56(9), 976–987. doi:https://doi.org/10.1111/jcpp.12412
- Torgesen, J. K., & Mathes, P. (2002). Assessment and instruction in phonological awareness (2nd ed.). Tallahassee, FL: Florida State Department of Education.
- Torppa, M., Poikkeus, A. M., Laakso, M. L., Eklund, K., & Lyytinen, H. (2006). Predicting delayed letter knowledge development and its relation to grade 1 reading achievement among children with and without familial risk for dyslexia. Developmental Psychology, 42(6), 1128–1142. doi:https://doi.org/10.1037/0012-1649.42.6.1128
- Treiman, R., Kessler, B., & Pollo, T. C. (2006). Learning about the letter name subset of the vocabulary: Evidence from US and Brazilian preschoolers. Applied Psycholinguistics, 27(2), 211–227. doi:https://doi.org/10.1017/S0142716406060255
- Treiman, R., Tincoff, R., Rodriguez, K., Mouzaki, A., & Francis, D. J. (1998). The foundations of literacy: Learning the sounds of letters. Child Development, 69(6), 1524–1540. doi:https://doi.org/10.2307/1132130
- U.S. Department of Health and Human Services. (2003). The Head Start path to positive child outcomes. Washington, DC: Author.
Appendix
Mplus code for the final multilevel growth mixture model for the letter name knowledge outcome
Title: Latent class model for letter name PLN
DATA: FILE IS grow_update.dat;
FORMAT IS 8(F12.2);
VARIABLE:
NAMES ARE PLN1R2 PLN3R2 PLN4R2 LSP1ps LSP3ps LSP4ps
Childid Classid_fake;
USEVARIABLES ARE PLN1R2 PLN3R2 PLN4R2;
MISSING ARE BLANK;
IDVARIABLE IS CHILDID;
CLASSES = c(3);
CLUSTER IS Classid_fake;
ANALYSIS: type = twolevel mixture;start = 500 20;
MODEL: %within%
%overall%iw sw | PLN1R2@0 PLN3R2@1 PLN4R2@2;
%between%
%overall%ib sb | PLN1R2@0 PLN3R2@1 PLN4R2@2;
PLN1R2 - PLN4R2 @0;sb@0;c#1*1;
%c#1%
[ib*2 sb*1];
%c#2%
[ib sb];
%c#3%
[ib sb];
OUTPUT: SAMPSTAT RESIDUAL TECH11 TECH14;