
 ?Mathematical formulae have been encoded as MathML and are displayed in this HTML version using MathJax in order to improve their display. Uncheck the box to turn MathJax off. This feature requires Javascript. Click on a formula to zoom.
Abstract
The purpose of this research was to analyze the performance of pupils (N = 6,023) who took part in Reading Recovery (RR) in England on a decoding test, the Phonics Screening Check (PSC), administered at the end of Year 1 when children are approximately 5 to 6 years of age. The data cover two academic years (2015/2016 and 2016/2017) and include demographic information, pre- and post-intervention achievement test scores and PSC results. Descriptive statistics and linear regression modeling (using a linear spline specification for timing) were used. Results indicated that pupils who had an RR intervention before the PSC performed better than peers who had the intervention during or after the PSC. There was a positive and statistically significant increase in PSC performance among those whose RR intervention began earlier relative to the PSC.
Children who experience early literacy difficulties, without intervention, are likely to remain poor readers (Francis, Shaywitz, Stuebing, Shaywitz, & Fletcher, Citation1996; Juel, Citation1988; Stanovich, Citation1986). Early intervention can reduce later literacy difficulties (Gray, Goldsworthy, May, & Sirinides, Citation2017; National Institute for Literacy, Citation2008; Piasta, Citation2016). For children born into socio-economic disadvantage the effects of socio-economic variables (like family income) have a strong effect on language and literacy (Hartas, Citation2011). Thus, the need for early literacy intervention is particularly important for those experiencing literacy difficulties in disadvantaged circumstances.
Reading Recovery (RR) (Clay, Citation2001) is an early literacy intervention implemented worldwide. Participants are taught in one-to-one daily lessons for 12—20 weeks by an accredited RR teacher. The efficacy of RR has been extensively investigated (cf. D’Agostino & Harmey, 2016; Schwartz, Citation2005; Sirinides, Gray, & May, Citation2018). D’Agostino and Harmey found that the intervention was effective with an average effect size of d = .59. Commenting on this study, Shanahan (Citation2017) stated that ‘although critics have complained about various facets of RR, including its costs and long-term benefits, its immediate impact on learning seems to be beyond question’ (p. 509).
We suggest that a major critique of RR is the nature of phonics instruction in the intervention and the effect of it on decoding and associated skills (cf. Iversen & Tunmer, 1993). The purpose of this research, therefore, was to examine the performance of pupils who took part in RR on the phonics screening check (PSC) in England, a government mandated test of decoding used to monitor literacy progress in Year 1. We sought to estimate the effect of a child participating in RR and timing of the RR intervention, on their performance in the PSC.
The role of decoding in beginning reading
Decoding is integral to reading and involves a range of processes. Individual differences in this area have been causally linked with later reading difficulties (Torgesen et al., Citation1999). Children must be able to link knowledge about phonemes to graphemes, and given the irregularity of the English language, recognize, use, and apply information about orthographic representations in words (Grundin, Citation2018). Early difficulties in use and application of this knowledge can lead to later reading difficulties (Foorman et al., Citation1998). It is widely acknowledged that these component processes are foundational skills in learning to read (cf. Foorman et al., Citation2016). There is less agreement, however, about instruction and measurement of development in these processes.
Reading recovery and phonics instruction
RR is informed by literacy processing theory (Clay, Citation2001). Clay proposed that differential progress in literacy is “unlikely to be a blackout in one sector of the complex system requiring the installation of a single component” (p. 244). An instructional implication of this perspective is that phonics is one element of reading instruction and that children must be able to use this information discretely and in context (Lupker, Citation2005; Snowling & Hulme, Citation2012). McNaughton (Citation2002) suggested that there are four dimensions of phonics teaching ‘acts’, namely that instruction can range from implicit to explicit and are either text-free (isolated activities) or text-connected (embedded in real texts)) . This is an apt framework to describe the teaching of phonics within a RR lesson. Lessons involve familiar reading of 2 or 3 short books, the taking of a running record of text reading, discrete (text free) work on letter identification and phonics instruction, writing involving use of elkonin boxes for phonemic analysis, the introduction and reading of a new book.
The criticism that RR needs to offer explicit phonics instruction spans decades. For example, Iversen and Tunmer (1993) conducted a study comparing a group of pupils who received RR with a group who received a modified form of RR that included explicit ‘code instruction’ (p. 112). They found that even though both groups made similar progress those who received the modified programme made faster progress. Chapman, Tumner, and Prochnow (2000) suggested that the intervention did not help children overcome difficulties in phonological processing. Center, Wheldall, Freeman, Outhred, and McNaught (Citation1995) and Reynolds, Wheldall and Madelaine (Citation2010) suggested that the effects of the RR programme are not maintained and criticized the lack of explicit phonics instruction within the programme. Chapman and Tunmer (2018) suggested that greater attention should be paid to phonological processing and word level decoding skills within RR lessons.
In contrast, D’Agostino and Harmey (2016), in a meta-analysis of RR, investigated whether effects of RR varied by literacy domain tested. It was found that although effects were larger for measures of text reading (d = .84) than effects for measures of spelling (d = .70), phonological awareness (d = .58), and decoding (d = .45) effects on all literacy domains were positive. Holliman, Hurry, and Bodman (2016) found, in a study of children’s reading profiles on exit from RR, that the phonological processing skills of children successfully discontinued from the programme were within the average range. Nonetheless, given the ongoing critique of the teaching of phonics within RR (see Shanahan, Citation2020), the importance of decoding in beginning reading, and the investment costs of RR it is vital to continue to investigate whether participating in RR improves children’s performance in state mandated test of decoding.
Measuring decoding ability
Given its importance in reading, measuring decoding ability should give a reliable indication of early literacy difficulties. Iversen and Tunmer (1993) stated that pseudoword tests are useful tests of decoding because "it is impossible to read these words without using knowledge of phoneme-grapheme correspondence" (p. 114). Savage et al. (Citation2015) suggested, however, that pseudoword reading "may only be an index of decoding in beginning readers" (p. 821). Doty et al. (Citation2015) found that tests that measured a combination of real and pseudo-words compared to single tests of pseudo- or real word decoding, has the greatest predictive power in terms in terms of assessment of advanced phonics skills.
In 2012, the Department for Education (DfE) in England adopted the PSC for all Year 1 students. The PSC is a decoding test of 40 items (20 real words and 20 pseudo-words). Duff, Mengoni, Bailey, and Snowling (Citation2015) concluded that while the PSC was correlated with other measures of non-word reading and identified at-risk readers, teacher judgements were even more sensitive. In a subsequent study, Gilchrist and Snowling (Citation2018) found that the "positive predictive values of the PSC were low (0.31) compared with a standardized reading comprehension test" (p.97). Despite this, the PSC has been validated for and is in use in South Australia (Hordacre, Moretti, & Spoehr, Citation2017).
While the best way to examine the relationship between RR and phonics instruction would be through controlled experiments, we took advantage of the opportunity to examine the naturally occurring event of a large cohort of children who had RR being tested on a state mandated test of decoding. Despite issues with the PSC we wanted to use it in this study for three reasons. First, in England, particular weight is placed on the results and has been described as high stakes (Ellis & Moss, Citation2014). Second, tests like this are commonly used as universal screening instruments to identify at-risk students. Finally, given the controversy about phonics instruction in RR, it is important to know how RR pupils perform on the PSC. Hence, the purpose of this research was to analyze the performance of children who received RR on the PSC. We used variation in the timing of the RR intervention relative to the administration of the PSC, to identify the impact of having embarked on a course of RR further ahead of the PSC and hence, likely having received a greater dosage of RR before the PSC.
Method
Participants
Students selected for RR are identified as having the most literacy difficulties by a school team (typically involving class teachers, intervention teachers, and school management). This identification is supplemented by an evaluation of school data (the types of tests may vary according to geographical context). The RR teacher then screens all those experiencing the most difficulty using using the Observation Survey of Early Literacy Achievement (OSELA) (Clay, Citation2013)(typically the lowest achieving 20%, in terms of literacy achievement, of a cohort). In consultation with the school team, the intervention places are offered to those lowest. Usually, each teacher will work with four children on a one to one basis. In England, children typically start the intervention in September and new students enter the intervention on a rolling basis as another student completes the intervention. Data on the participants in this study, were entered by RR teachers into a website managed by the International Data Evaluation Center (IDEC) to monitor programme efficiency and effectiveness. These data included demographic and achievement data for 6,023 children in 585 schools in England who had completed RR in two academic years (2015/2016 and 2016/2017). Ethical clearance was sought and granted to use this dataset for analysis. Data for all children who had (a) complete entry and exit test data, (b) a PSC result, and (c) information about the dates of entry and exit to the programme were included (see ). Unsurprisingly, RR participants are academically weaker than the broader cohort taking the PSC: DfE (2017) statistics report that nationally 81% of pupils passed the PSC in 2017 with a mean of 33 and median of 37, compared to 53% in our sample with a mean of 27 and median of 31. 42% (n = 2530) of the sample were identified as economically disadvantaged, in England this would mean that the students were eligible for free school meals. The proportion of students who were summer born in the cohort was .36. We include this variable in our analysis because there is a pronounced effect of academic disadvantage for children born the summer months who start school in September thus making them the youngest in class (Sykes, Bell, & Rodeiro, 2009).
Table 1. Participant (N = 6,023) demographics and pre- and post-RR achievement data.
Context
RR in England is provided to children identified as the lowest-achieving in literacy aged around six (Year 1 or Year 2) by screening using the OSELA (Clay, Citation2013) by the RR teacher. RR primarily operates in areas of socio-economic disadvantage in that schools use funding like the pupil premium (targeted at economically disadvantaged children) to fund a RR teacher. Fidelity to the intervention is monitored through a system of ‘checks and balances’. First, teachers must be accredited, accreditation is maintained by attending continuing professional development (CPD and quality assurance visits to schools by RR Teacher Leaders. Second, RR Teacher Leaders are supported by a national leadership team based at an English university and they must also engage in CPD and receive quality assurance visits. Third, outcome data is reported at school, district, and national level where variation of outcome is monitored. Fifth, children are tested post-intervention by another member of school staff (a ‘link teacher’). The BAS III (Elliot & Smith, 2011) word reading test, an external measure is also used as pre- and post-intervention measure. So, while variation of implementation is inevitable there is a system of quality assurance that continually monitors and evaluates this variation.
There are two possible ‘exit’ outcomes following RR. Either the lessons are ‘discontinued’ meaning the child made satisfactory progress and is now reading and writing at a level comparable to his or her peers. The other outcome is ‘referral’, meaning the child made some progress but is not reading at an average level and is referred for further support (ongoing intervention, for example). We included both sets of children in the analysis.
Measures
Phonics screening check
The PSC is administered at the end of Year 1 (Standards and Testing Agency [STA], Citation2018), generally in the second week of June. Schools enter the data online. The PSC is administered individually (Standards and Testing Agency (STA), 2018). The STA (Citation2018) require the PSC is administered to all children unless ‘they have no understanding of grapheme-phoneme correspondences’ or cannot ‘speak confidently in English’ (p. 9).
The PSC consists of 40 items consisting of 20 real words and 20 pseudo-words. Pseudo-words are accompanied by a picture of an imaginary creature. The rationale is that this provides a context for the child to name the creature versus trying to match the pseudo-word to a word in their vocabulary (DfE, 2018). In terms of inter-rater reliability, the DfE (2011) reported a Cohen’s kappa value of .80. The pilot study demonstrated high levels of internal consistency with an alpha coefficient of .95 (DfE, 2011). The DfE (2011) outlined that fewer than 8% of children would be misclassified by the test, that is at risk of literacy difficulties when they are not or vice-versa. The DfE does not report on the predictive validity of the test.
BAS III
The BAS III (Elliot & Smith, 2011) is a single-word reading test that forms part of a battery of tests in the BAS 3 intelligence test standardized to UK norms. The scores derived from the measures of the BAS battery have good concurrent validity (Colman, Citation2015) and have demonstrated criterion validity (Educational Endowment Foundation, 2018) as it is co-normed with the York Assessment of Reading Comprehension. Once a child has been offered a place on the RR intervention, the BAS is administered prior to instruction starting, which varies according to the date the child commences instruction. The BAS is administered again at the end of the intervention, but this is not used as part of our analysis in this paper.
Osela
The OSELA (Clay, Citation2013) is an early literacy test comprising six tasks (word reading, word writing, letter identification, text reading (Running Record), concepts about print, and dictation) and has been standardized to UK norms (Holliman, Hurry, & Douetil, Citation2010). Construct validity has been demonstrated, it has moderate correlations with other literacy measures. Test-retest reliability and the internal consistency of the items in the battery have been established (Holliman et al., Citation2010). The OSELA is administered to the group of children in a class identified by their teacher as having the most difficulties with literacy. Within this group, the OSELA is carried out at a consistent time point, with those who score the lowest being prioritized for starting the RR intervention first (which is important for our evaluation design). Pupils are also tested again at the end of the intervention, but this is not used as part of our analysis in this paper.
Procedures
We restricted analysis to pupils who completed RR in years 1 and 2 in England,Footnote1 reporting on timing of start and end dates of RR, pre-intervention performance in the BAS (Elliot & Smith, 2011) word reading test, and performance in the PSC. We did not disaggregate our analysis based on children’s exit status based on concerns that discontinuation or referral may be affected by performance on the PSC, which could bias our estimates among those whose RR intervention spanned the administration of the PSC.
We used timing of the PSC relative to RR in weeks because of the rolling basis in which RR is offered in the European context. In England, children are offered places on RR on a rolling basis.In other words, as one child finishes the intervention another child takes the next place. In addition to this, programmes ‘carry over’ from the end of one academic year to the next. While we did have dates of programme completion, we chose to measure timing of RR relative to the PSC because adjusting for time of discontinuation would actually make things less clear cut.
We excluded individuals who started RR more than 40 weeks before, or more than 20 weeks after the date of the PSC, as only 143 pupils fall into this group. Including these data made the visualization of our data harder to interpret (although we checked and exclusion did not affect our findings). We conducted our analysis on pooled data (N = 6,023) from 2015-16 and 2016-17 but repeated it separately for each of these two academic years, which made no difference to our findings.
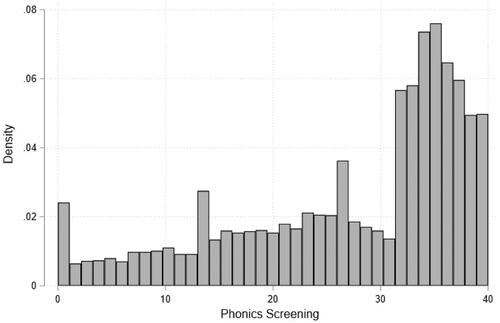
Because our sample was restricted to those who participated in an RR programme, which is targeted at those falling behind in reading, performance in the PSC is below the national average (M = 27, SD = 10.75), the median was 31 and the interquartile range was 15; we plotted the distribution in . The highly-skewed distribution of the PSC is well-known. Since 32 has historically been the passing score for the PSC, this suggests that teachers are giving children whose scores are close to, but below, the passing score the “benefit of the doubt” to a considerable degree. We acknowledge this has implications in terms of potential bias in teacher judgements but we see no reason why this would bias our estimates of the impact of RR upwards; if anything, the opposite is likely to be the case with this ‘ceiling effect’ attenuating an estimate of impact.Footnote2
Figure 1. Histogram of the distribution of the PSC in the sample (N = 6,023).
Descriptive statistics are reported in , overall and separately by the point at which pupils took the PSC relative to RR. This demonstrated two important facts. First, irrespective of exit status, pupils who had completed RR at the point they took the PSC (75% passed PSC, n = 2244) performed better than pupils who were still working through the intervention (45% passed PSC, n = 2947), who, in turn, performed better than pupils who had yet to start RR (19% passed PSC, n = 832) at the time of the PSC. Second, those who had completed RR before taking the PSC had lower prior attainment (measured by the BAS) when they started RR than those who were still working through RR when they took the PSC, with those who had yet to start RR at the time of the PSC having even higher prior attainment. The group that completed RR prior to the PSC had an average BAS raw score of 6 (word reading age 5 years and 4 months). The groups still in RR or yet to receive RR had average BAS raw scores of 9.1 or 10.4, respectively (both raw scores equate to a standardized reading age 5 years and 7 months).
Table 2. Means/proportions by timing of PSC relative to Start of RR (N = 6,023).
For the main modeling, rather than using this categorical distinction of when a pupil takes the PSC relative to the timing of their participation in RR, we used the more fine-grained approach of exploring the relationship between the numbers of weeks since an individual started the programme and taking the PSC. Among our sample, both the mean and the median number of weeks from start of programme to end of programme is 18 weeks, although it ranges from 2 to 35 weeks. The raw association between number of weeks since start of the programme and taking the PSC and performance on the PSC is explored below.
We sought to estimate the effect of participating in RR on performance in the PSC. We did this by using variation in the timing of starting RR relative to the timing of the PSC. We do not argue that this timing is entirely random, however we do argue that the way in which it is systematic is likely to attenuate our estimate of impact because those who are the weakest readers are likely to be targeted for the intervention first (this is borne out by the correlations in the data). It follows that, if there is no effect of RR, those who started earliest would perform worst on the PSC. Likewise, it follows that if there is a positive effect of RR, it would be attenuated in the unconditional association between timing of RR relative to the PSC and performance in the PSC by those starting earlier having lower prior attainment as measured by the BAS. With this in mind, our analysis attempted to understand the relationship after accounting for this nonrandom selection to bring us closer to a causal effect of the programme, while bearing in mind potential remaining biases. We did this in two main ways.
Graphical analysis
An intuitive and non-parametric way to understand the relationship between the time from starting RR to the PSC and performance in the PSC is graphically. We did this using binned scatter plots (e.g. Chetty et al., Citation2013) using the tool developed by Stepner (Citation2013), where the average of the dependent variable (performance on PSC) is plotted for equal sized groups of the independent variable (timing between starting RR and taking PSC). We also conducted this analysis for the relationship between prior attainment measured by BAS and weeks from RR start to the administration of the PSC to give a clear illustration of the relationship between attainment and timing of the intervention.
Regression modeling
If there were a positive effect of starting RR sooner, then we expected to see an upward trend in PSC performance associated with the number of weeks ahead of the PSC that RR was started (after controlling for confounding factors). However, there cannot be an effect of the number of weeks since the PSC that RR was started so there should be no trend in performance associated with starting RR after but closer to the time of PSC administration caused directly by this. As such, if there is such a trend then it must be driven by other confounding factors.
We explored the presence of such a trend using linear regression models including linear splines,Footnote3 which specifically model if there was a trend among this latter group and allowed us to estimate the net effect of one more week since starting RR after removing this trend.Footnote4 To do this, we estimated the following model:
where
is the score that individual
obtained in the PSC,
is the number of weeks from the start of individual
’s RR course to the PSC (including negative values for those who started RR after taking the PSC),
is the number of weeks from the start of individual
’s RR course to the PSC only among those who started RR before the PSC,
is a vector of control variables discussed further below, and
is an idiosyncratic error term. School-level cluster robust standard errors were calculated.
Linear regression allowed us to include additional control variables to check the robustness of the relationship to differences in other observable characteristics. We estimated sequential models in which we progressively added further controls. These are:
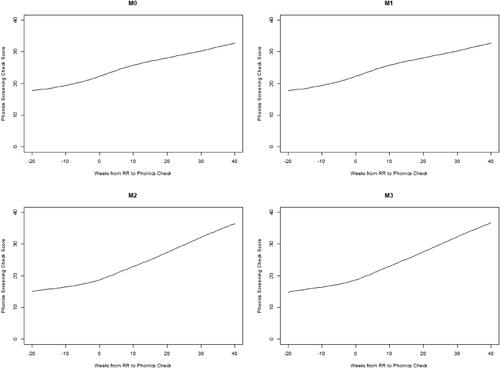
M0 included no additional controls. It allowed us to recover the raw change in performance in the PSC for each additional week between the start of RR and the PSC;
M1 added the battery of RR-specific pre-intervention tests (OSELA) (Clay, Citation2013) administered to the group of potential RR participants in a class in order to identify the order in which they will start RR (these have been standardized to mean 0 and standard deviation 1 to aid interpretation). As such, this model reported the change in performance in the PSC once we compared individuals with the same pre-RR attainment but who received different numbers of weeks of RR before the PSC
M2 added controls for Gender, Date of Birth, Pupil Language and whether pupil has ever been eligible for Free School Meals. This helps to rule out selection on these demographic factors driving our results.
M3 added prior attainment measured by the BAS (standardized to mean 0 and standard deviation 1 to aid interpretation) at the point of starting RR. This adds the additional robustness of controlling for a non-RR baseline ability measure but, since the BAS is carried out is at the point of starting the intervention, it is variable and, hence, there potential countervailing concerns that this could theoretically be confounded with our treatment measure. On balance, we judge its inclusion is preferable to doing a less good job of controlling for baseline attainment, but readers may prefer M2 as a result – in practice it made no significant difference to our findings.
Findings
The purpose of this research was to analyze the performance of pupils who had complete RR interventions on the PSC. We considered performance in the PSC by its timing relative to starting RR. The results provided us with an estimate of improved performance in the PSC for each additional week that has passed since starting the RR. It should be noted that this is not quite the same as additional performance from receiving an additional week of RR, because those who started the earliest are likely to have finished their course some time before the PSC occurs. Nevertheless, if RR has been successful they should get more out of classroom literacy instruction in these weeks than they would have in the absence of receiving the programme because they will no longer be lagging behind their classmates.
Graphical analysis
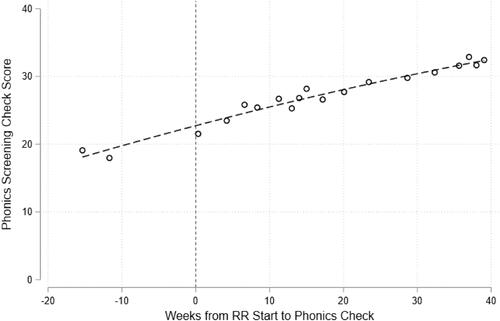
An initial plot of the relationship between the length of time between starting RR and doing the PSC (see ) demonstrated a positive correlation.
Figure 2. Binned scatter plot of the relationship between time from RR start to PSC performance.
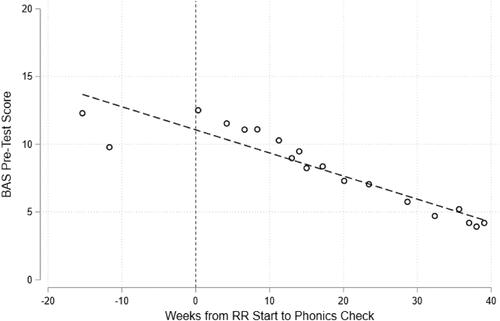
demonstrates that there was significant sorting on prior attainment measured by the BAS on when pupils start RR, with those most in need of the programme (captured by lower BAS scores) more likely to start RR earlier relative to the timing of the PSC. Therefore, to understand the relationship between RR timing and performance on the PSC we needed to consider the relationship after taking account of this sorting. To do so, we turned to regression modeling in order to carry out this adjustment.
Figure 3. Binned scatter plot of the relationship between time from RR start to PSC and prior attainment measured by BAS at start of RR.
Regression modeling
Since there cannot be an effect of an RR intervention after the PSC on PSC performance, there should be no trend in performance associated with starting RR after the PSC but closer to the time of the check. However, such a trend may exist because of unobserved sorting effects. Our regression models explicitly test for any such a trend and control for it in our estimates of the association between starting RR one week earlier before the PSC and performance on the PSC using a linear spline function. Regression coefficients from these models are reported in , with estimated conditional relationships implied by these models reported in . Given the presence of both “Weeks from start of RR to phonics (before only)” and “Weeks from start of RR to PSC (inc. after)” variables in these models, the latter effectively reports the expected change in the PSC from having started RR a week closer to the PSC after the PSC happened. Ideally, there should be no significant estimate here.
Figure 4. Conditional probability plots of performance in the PSC depending on timing from start of RR to PSC (weeks as linear spline).
Notes: Predicted probabilities derived from the linear regression models of the same name reported in . All other model covariates held constant at means. Extrapolated underlying trend in phonics check scores from pupils who started RR after the date of the phonics shows as a dotted line for comparison.
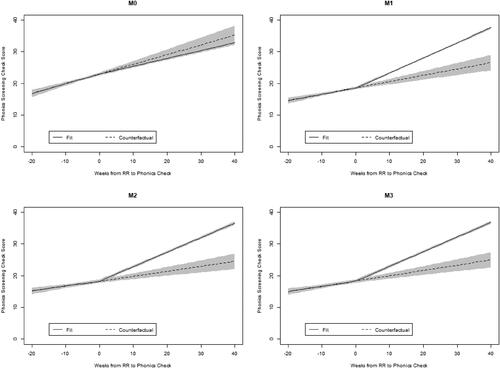
Table 3. Results from linear regression of performance in PSC (weeks as linear spline).
As discussed above, there should be no conditional association between time after the PSC to starting RR and performance on the check, because there is no logical causal pathway between the length of exposure to RR after the PSC and performance on the check. Unfortunately, in all models we found a positive and significant association, which is only mitigated slightly by the inclusion of control variables in M1-M3. This suggests the presence of unobserved sorting, at least partially driving the positive association between the number of weeks of RR an individual has received before the PSC and performance on the PSC we see in our graphical modeling. However, we use this estimate to remove this confounding upward trend from our estimate of the association between starting RR an additional week before the PSC and performance on the PSC.Footnote5 This estimate is captured by the coefficient in “Weeks from start of RR to phonics (before only)”. In our unconditional model (M0), the estimate on this coefficient is negative, but not statistically significant, implying a decrease in PSC performance for each additional week between start of RR and taking the PSC. However, as discussed in the descriptive analysis, the pupils with the weakest prior attainment start RR earlier. This is confirmed by the pre-intervention testing. This means that this selection on prior attainment may be driving the negative association. Indeed, once we controlled for prior attainment in M1, we estimated a positive and significant association between an additional week of RR before the PSC and performance on the PSC. This grew larger with the addition of individuals’ demographic characteristics (M2) and the BAS as an additional measure of baseline attainment (M3), suggesting an average increase of 1 point on the PSC for every additional 4 weeks ahead of the PSC an individual starts RR.
How large is this association? To contextualize it, we adjusted the estimate in two ways. First, we divided it by an estimate of the total unconditional sample standard deviation of the PSC (10.75), in order to transform it into a Cohen’s d effect size. Second, we multiplied it by the median length of an RR intervention, again based on our estimation sample (18 weeks). Having done this, we estimated an average length of RR intervention is associated with an improvement with an effect size of d = 0.50.
Robustness checks
Non-parametric regression modeling
Given the importance of choosing the correct functional form for the relationship between number of weeks from RR start to phonics screening check in the regression modeling, we used non-parametric regression (specifically generalized additive models, Hastie & Tibshirani, Citation1990) to test the appropriateness of our preferred linear spline fit. All other elements of the model were fit in the same way but the conditional relationship between number of weeks from the start of RR to the PSC and the performance on the PSC is fit with a smoothing function.
The results from this modeling strongly suggested that our linear spline specification fit the data extremely well, which also added to our confidence in our hypothesized ‘kink’ in the relationship at the point of the phonics screening check. Conditional probability plots from the linear regression models using linear splines and the generalized additive models are overlaid in showing the close fit. As such, we continue to use the linear regression models using linear splines as our preferred specification, since this allows intuitive reporting and significance testing of the differences in slopes either side of the linear spline kink.
Figure 5. Conditional probability plots of performance in PSC depending on timing from start of RR to PSC (weeks as linear spline).
Notes: Predicted probabilities derived from the linear regression models of the same name reported in . All other model covariates held constant at means. Extrapolated underlying trend in phonics check scores from pupils who started RR after the date of the phonics shows as a dotted line for comparison.
Discussion
The purpose of our study was to analyze the performance of pupils who received RR on the PSC. We used variation in timing of RR relative to the administration of the PSC to identify whether starting RR further ahead of the PSC, and therefore intervening earlier, is associated with improved performance on the PSC.
Pupils who receive RR prior to the PSC perform better on the PSC
Our analysis demonstrated that pupils who completed RR before the PSC performed better than those still working through the intervention who, in turn, performed better than those who had yet to start RR. Of those who had been identified as experiencing the most difficulties in literacy learning compared to their peers and completed RR early in Year 1. The profiles of each of the three groups were similar in terms of whether the pupils were eligible for free school meals (FSM) spoke English as an additional language, or gender. It also should be noted that nationally, 81% of all children pass the PSC while only 68% of children eligible for FSM pass the check (DfE, 2017). Our sample is restricted to children identified as experiencing most literacy difficulties, with 42% of this sample eligible for FSM. We also included in the analysis all children participating in RR so our sample includes children who were referred back to their schools for further support.
These differences in PSC performance were despite the fact that, in terms of prior literacy achievement, these three groups were different with the lowest attaining students receiving the intervention earliest. When we controlled for prior attainment at the beginning of RR using linear regression modeling, there was a strong, positive relationship between weeks since start of RR and performance on the PSC. However, this positive relationship was also evident when we looked at the relationship between the number of weeks since taking the PSC and starting an RR intervention, which should be an irrelevant timing difference. Using this as an estimate of unobserved sorting and controlling for it in our estimate of the effect of starting RR one additional week ahead of the PSC, we still estimate that an additional week since start of RR is associated with an improvement in performance on the PSC of between 0.296 and 0.169. We do not believe that our results can be explained by maturation effects since all pupils took the PSC at the same time, regardless of the relative timing of RR to the PSC. Whatever its limitations (cf. Glazzard, Citation2017) the PSC is similar to tests used to screen for literacy difficulties and is now being adopted in another country. In addition to this, it is, as Iversen and Tunmer (1993) argued for, a ‘purer’ assessment of decoding skills than the OSELA, skills that several researchers suggest RR does not adequately support (Center et al., Citation1995; Chapman & Tunmer, 2018). Our analysis suggests that there are positive effects of RR on decoding skills.
A related finding from this study is that RR teachers appear to be correctly identifying children who are the lowest in terms of literacy learning, as measured by the BAS. In all of our analyses, it was apparent that the children who started RR earlier had lower BAS scores at the start of the intervention. Second, it suggests those who had completed RR earlier in Year 1 were better able subsequently to profit from classroom instruction (Clay, Citation2016; Vellutino, Citation2010).
Limitations and future directions
To believe our findings are truly causal we need to assume that, once we have controlled for the observable differences in our models and for the association between number of weeks after the PSC individuals start RR, the dosage of RR individuals receives before completing the PSC is as good as randomly assigned. We acknowledge that this is unlikely to be strictly true.
Such sources of bias are likely to be working in both directions. If teachers are targeting the students they expect to perform worse on the PSC for RR first and our pre-intervention measures are only an imperfect measure of this, then this would tend to bias our results downwards. As such, controlling for a perfect proxy of how teachers are sorting would increase our estimated effects. More challenging is the possibility that both our measures of pre-intervention attainment and our estimate of the underlying time trend from the number of weeks post-PSC that an individual starts RR could be affected by pupils’ performance on the PSC itself. We think this would take the form of pupils who did unexpectedly poorly on the PSC being targeted for intervention soon afterwards and potentially negatively influencing teachers’ post-PSC pre-intervention attainment measures. This may have the effect of inflating the association we find between weeks of RR received before the PSC and PSC performance, particularly by attenuating the unobserved sorting effects we estimate from the post-PSC period. We do not think it is possible to deal with these challenges with the data available, however suggest future research that included independently collected baseline data at the start of the academic year.
As RR is offered on a ‘rolling’ basis in Europe, we had the somewhat confounding variable of the summer holidays to account for. The summer learning gap (Allington et al., Citation2010) is a phenomenon that has particularly deleterious effects for children with lowers levels of literacy (Turner & Tse, Citation2015). Included in the group of children who started RR after the PSC are children who had approximately six weeks gap in intervention. We conducted analysis with the extreme positions of either fully including or ignoring these gaps in our calculation of timings, which we argue places bounds on our analysis since the “correct” approach is probably somewhere between these two. We estimate a positive effect of RR either way, although its magnitude is reduced in the latter case.
Another factor that confounds the value of the findings of this study is the test itself. The utility of a decoding test like the PSC lies in that it is a relatively quick way of identifying underlying decoding difficulties. There are concerns about the validity and value of the PSC (Darnell, Solity, & Wall, Citation2017) but it is not dissimilar to other tests used to screen for literacy difficulties. While many are concerned about the high stakes nature of test (see Clarke & Glazzard, Citation2018), we argue that this critique relates to how the test results are used to inform policy on instruction and intervention. It must be acknowledged that the PSC only tests decoding (Davis, Citation2013) and is not a test of reading if one considers the purpose of reading is to derive meaning from text read (see Ellis & Moss, Citation2014). In addition to this, whether or not it has predictive validity has yet to be conclusively investigated (Gilchrist & Snowling, Citation2018).
We also do not know about the combination of instruction that the pupils in this study received but we suggest it would be fair to assume that the children entering RR had already experienced classroom instruction characterized by a systematic phonics programme given the emphasis on phonics in the English curriculum. Despite this, children who took the PSC before they had RR had obviously not responded to classroom instruction. We hypothesize that the students who complete RR earlier do go on to benefit from this classroom instruction. It would be worth examining how children differentially respond to different combinations of classroom instruction and intervention.
It should be noted also, that for the sake of this analysis, we did not disaggregate the data to examine if the proportions differed between those who were classified as discontinued or referred for further support by RR professionals. We are estimating the effect of RR on the PSC for children who have been considered for extra support (categorized as ‘referred’) as well as those who teachers have judged are functioning at an average level compared to their peers (categorized as ‘discontinued’). It might well be that children who were discontinued from the programme would achieve better results on the PSC and, conversely, that those who are referred would achieve lower results on the PSC. Given that there is no clear cut-score in terms of the decision to discontinue versus refer a child to their school the exit achievement profiles of these children would be variable (cf. Slavin et al., Citation2011). In addition, decisions to discontinue or refer could be affected by PSC performance among those still participating in RR when they take the PSC, which would bias our results if we attempted to disaggregate by these categories. Therefore, we argue that it was the correct approach for our analysis to ignore these differences, effectively treating them as part of normal variation in the delivery of RR. Such analysis certainly merits further investigation, particularly because early interventions should serve what Vellutino, Scanlon, Small, and Fanuele (Citation2006) would refer to as a ‘first-cut diagnostic’ in determining if reading difficulties are caused by inadequate instruction or cognitive difficulties (p. 166).
Conclusion
In this research, we sought to estimate the effect of a child participating in RR on their performance on the PSC. If there was no effect of RR, we expected that those who started earliest would perform worst on the PSC, whereas they performed significantly better than those who do not start RR until much later. As such, our findings suggest that children who start RR near the beginning of in Year 1 in England do benefit from this early exposure to the support provided by RR in ways that are evident in the PSC.
Given that the children in this study were the lowest performing in terms of literacy learning, our findings suggest that the RR had a positive effect on decoding. Our study provides further evidence, therefore, when added to the numerous other studies showing the positive effects of RR (Sirinides et al, Citation2018), to suggest that RR provides schools with an effective early literacy intervention for children struggling with early literacy learning.
Notes
1 Our results continue to hold if we restrict our sample only to those who complete RR in Year 1 although, because of the timing of the PSC, this doesn’t allow examination of those who took the PSC before starting RR.
2 Tobit regression models that adjust for the censoring inherent in ceiling and floor effects support this hypothesis that, if anything, these issues may have slightly attenuated the findings we report later in the paper. However, this does not affect our substantive conclusions.
3 The appropriateness of this functional form is tested in the Robustness Checks section below using generalized additive models.
4 We discuss the assumptions this makes for our estimate in the Limitations section below.
5 We discuss the assumptions this makes for our estimate in the Limitations section below.
References
- Allington, R. L., McGill-Franzen, A., Camilli, G., Williams, L., Graff, J., Zeig, J., Zmach, C., & Nowak, R. (2010). Addressing summer reading setback among economically disadvantaged elementary students. Reading Psychology, 31(5), 411–427. doi:10.1080/02702711.2010.505165
- Center, Y., Wheldall, K., Freeman, L., Outhred, L., & McNaught, M. (1995). An evaluation of Reading Recovery. Reading Research Quarterly, 30(2), 240– 263. doi:10.2307/78034
- Chapman, J. W., & Tunmer, W. E. (2018). Reading Recovery’s unrecovered learners: Characteristics and issues. Review of Education, 7(2), 237–265. doi:10.1002/rev3.3121
- Chapman, J. W., Tunmer, W. E., & Prochnow, J. E. (2000). Early reading-related skills and performance, reading self-concept, and the development of academic self-concept: A longitudinal study. Journal of Educational Psychology, 92(4), 703–708. doi:10.1037/0022-0663.92.4.703
- Chetty, R., Friedman, J. N., & Saez, E. (2013). Using differences in knowledge across neighborhoods to uncover the impacts of the EITC on earnings. American Economic Review, 103(7), 2683–2721. doi:10.1257/aer.103.7.2683
- Clarke, M., & Glazzard, J. (2018). The phonics screening check 2012 – 2017: An independent enquiry into the views of head teachers, teachers and parents. Birmingham: Newman University.
- Clay, M. M. (2001). Change over time in children’s literacy development. Portsmouth, NH: Heinemann Educational Books.
- Clay, M. M. (2013). An observation survey of early literacy achievement. Portsmouth: Heinemann.
- Clay, M. M. (2016). Literacy lessons designed for individuals. Portsmouth: Heinemann.
- Colman, A. M. (2015). A dictionary of psychology. Oxford, UK: Oxford University Press.
- Darnell, C. A., Solity, J. E., & Wall, H. (2017). Decoding the phonics screening check. British Educational Research Journal, 43(3), 505–527. doi:10.1002/berj.3269
- Davis, A. (2013). To read or not to read: Decoding synthetic phonics. Impact, 2013(20), 1–38. doi:10.1111/2048-416X.2013.12000.x
- D’Agostino, J. V., & Harmey, S. J. (2016). A meta-analysis of Reading Recovery in international settings. Journal of Education for Students Placed at Risk (JESPAR), 21(1), 29–46. doi:10.1080/10824669.2015.1112746
- Department for Education (2017). (2017). Retrieved online from Phonics screening check and key stage 1 assessments in England, https://assets.publishing.service.gov.uk/government/uploads/system/uploads/attachment_data/file/654859/Phonics_KS1_SFR_Text_2017_.pdf
- Doty, S. J., Hixson, M. D., Decker, D. M., Reynolds, J. L., & Drevon, D. D. (2015). Reliability and validity of advanced phonics measures. Journal of Psychoeducational Assessment, 33(6), 503–521. doi:10.1177/0734282914567870
- Duff, F. J., Mengoni, S. E., Bailey, A. M., & Snowling, M. J. (2015). Validity and sensitivity of the phonics screening check: implications for practice. Journal of Research in Reading, 38(2), 109–123. doi:10.1111/1467-9817.12029
- Educational Endowment Foundation. (2018). British Ability Scales. Retrieved from: https://educationendowmentfoundation.org.uk/projects-and-evaluation/evaluating-projects/early-years-measure-database/early-years-measures-database/british-ability-scales
- Ellis, S., & Moss, G. (2014). Ethics, education policy and research: The phonics question reconsidered. British Educational Research Journal, 40(2), 241–260. doi:10.1002/berj.3039
- Elliot, C., & Smith, P. (2011). British Ability Scales. – Third Edition (BAS 3). London, UK: GL Assessment.
- Foorman, B., Beyler, N., Borradaile, K., Coyne, M., Denton, C. A., Dimino, J., Furgeson, J., Hayes, L., Henke, J., Justice, L., Keating, B., Lewis, W., Sattar, S., Streke, A., Wagner, R., & Wissel, S. (2016). Foundational skills to support reading for understanding in kindergarten through 3rd grade (NCEE 2016-4008). Washington, DC: National Center for Education Evaluation and Regional Assistance (NCEE), Institute of Education Sciences, U.S. Department of Education. Retrieved from the NCEE website: http://whatworks.ed.gov
- Foorman, B., Francis, D. J., Fletcher, J. M., & Schatschneider, C. (1998). The role of instruction in learning to read: Preventing reading failure in at-risk children. Journal of Education Psychology, 90(1), 37–55. doi:10.1037/0022-0663.90.1.37
- Francis, D. J., Shaywitz, S. E., Stuebing, K. K., Shaywitz, B. A., & Fletcher, J. M. (1996). Developmental lag versus deficit models of reading disability: A longitudinal, individual growth curves analysis. Journal of Educational Psychology, 88(1), 3–17. doi:10.1037/0022-0663.88.1.3
- Gilchrist, J. M., & Snowling, M. J. (2018). On the validity and sensitivity of the phonics screening check: erratum and further analysis. Journal of Research in Reading, 41(1), 97–105. doi:10.1111/1467-9817.12095
- GL Assessment (2011). BAS II Word Reading Scale. London, UK: GL Education Group.
- Glazzard, J. (2017). What could replace the phonics screening check during the early years of reading development? FORUM, 59(2), 175–182. doi:10.15730/forum.2017.59.2.175
- Gray, A., Goldsworthy, H., May, H., & Sirinides, P. (2017). Evidence for Early Literacy Intervention: The Impacts of Reading Recovery. Philadelphia, PA: CPRE Policy Briefs. Retrieved from https://repository.upenn.edu/cpre_policybriefs/82
- Grundin, H. U. (2018). Policy and evidence: a critical analysis of the Year 1 Phonics Screening Check in England. Literacy, 52(1), 39–46. doi:10.1111/lit.12124
- Hastie, T. J., & Tibshirani, R. J. (1990). Generalized additive models. London, UK: Chapman & Hall CRC.
- Hartas, D. (2011). Families’ social backgrounds matter: Socio-economic factors, home learning and young children’s language, literacy and social outcomes. British Educational Research Journal, 37(6), 893–914. doi:10.1080/01411926.2010.506945
- Holliman, A. J., Hurry, J., & Bodman, S. (2016). Children’s reading profiles on exiting the Reading Recovery programme: do they predict sustained progress? Journal of Research in Reading, 39(1), 1–18. doi:10.1111/1467-9817.12041
- Holliman, A., Hurry, J., & Douetil, J. (2010). Standardisation of the observation survey in England and Wales, UK. London, UK: Institute of Education, University of London.
- Hordacre, A., Moretti, C., & Spoehr, J. (2017). Evaluation of the trial of the UK phonics screening check in South Australian schools. South Australia, Australia: Australian Industrial Transformation Institute, Flinders University of South Australia.
- Iversen, S., & Tunmer, W. E. (1993). Phonological processing skills and the Reading Recovery program. Journal of Educational Psychology, 85(1), 112–126. doi:10.1037/0022-0663.85.1.112
- Juel, C. (1988). Learning to read and write: A longitudinal study of 54 children from first through fourth grades. Journal of Educational Psychology, 80(4), 437–447. doi:10.1037/0022-0663.80.4.437
- Lupker, S. (2005). Visual Word Recognition: Theories and Findings. In M. Snowling & C. Hulme (Eds.), The Science of Reading: A Handbook. Oxford, UK: Blackwell.
- McNaughton, S. (2002). Meeting of minds. Wellington, NZ: Learning Media.
- National Institute for Literacy (2008). Developing early literacy: Report of the National Early Literacy Panel. Jessup, MD: National Institute for Literacy.
- Piasta, S. B. (2016). Current understandings of “what works” for supporting emergent literacy development in early childhood classrooms. Child Development Perspectives, 10(4), 234–239. doi:10.1111/cdep.12188
- Reynolds, M., Wheldall, K., & Madelaine, A. (2010). Components of effective early reading interventions for young struggling readers. Australian Journal of Learning Difficulties, 15(2), 171–192. doi:10.1080/19404150903579055
- Savage, R., Burgos, G., Wood, E., & Piquette, N. (2015). The Simple View of Reading as a framework for national literacy initiatives: a hierarchical model of pupil-level and classroom -level factors. British Educational Research Journal, 41(5), 820–844. doi:10.1002/berj.3177
- Schwartz, R. M. (2005). Literacy learning of at-risk first-grade students in the Reading Recovery early intervention. Journal of Educational Psychology, 97(2), 257–267. doi:10.1037/0022-0663.97.2.257
- Shanahan, T. (2017). Reading Research: The Importance of Replication. The Reading Teacher, 70(4), 507–510. doi:10.1002/trtr.1520
- Shanahan, T. (2020). What constitutes a science of reading? Reading Research Quarterly, 55(S1), S235–S247. H. doi:10.1002/rrq.349
- Slavin, R. E., Lake, C., Davis, S., & Madden, N. A. (2011). Effective programs for struggling readers: A best evidence synthesis. Educational Research Review, 6(1), 1–26. doi:10.1016/j.edurev.2010.07.002
- Sirinides, P., Gray, A., & May, H. (2018). The impacts of Reading Recovery at scale: Results from the 4-Year i3 external evaluation. Educational Evaluation and Policy Analysis, Online First, 40(3), 316–335. doi:10.3102/0162373718764828
- Snowling, M., & Hulme, C. (2012). Interventions for children’s language and literacy difficulties. International Journal of Language & Communication Disorders, 47(1), 27–34. doi:10.1111/j.1460-6984.2011.0081.x
- Standards and Testing Agency …/2018_phonics_screening_check_administration (2018). Phonics screening check: Administration Guidance. Retrieved from https://assets.publishing.service.gov.uk/.
- Stanovich, K. (1986). Matthew effects in reading: Some consequences of individual differences in the acquisition of literacy. Reading Research Quarterly, 21(4), 360–407. doi:10.1598/RRQ.21.4.1
- Stepner, M. (2013). BINSCATTER: Stata module to generate binned scatterplots, Statistical Software Components S457709, Boston College Department of Economics, revised 24 Nov 2013. https://ideas.repec.org/c/boc/bocode/s457709.html
- Sykes, E., Bell, J., Roderio, C. (2009). Birthdate effects: A review of the literature from 1990-on. Cambridge; University of Cambridge Local Examinations Syndicate. Retrieved from https://www.cambridgeassessment.org.uk/Images/109784-birthdate-effects-a-review-of-the-literature-from-1990-on.pdf
- Torgesen, J. K., Wagner, R. K., Rashotte, C. A., Rose, E., Lindamood, P., Conway, T., & Garvan, C. (1999). Preventing reading failure in young children with phonological processing disabilities: Group and individual responses to instruction. Journal of Educational Psychology, 91(4), 579–593. doi:10.1037/0022-0663.91.4.57
- Turner, L., & Tse, L. (2015). Solving summer slide: Strategies and suggestions. Set: Research Information for Teachers, (1), 16–24. doi:10.18296/set.0004
- Vellutino, F. R., Scanlon, D. M., Small, S., & Fanuele, D. P. (2006). Response to intervention as a vehicle for distinguishing between children with or without reading disabilities: Evidence for the role of kindergarten and first-grade interventions. Journal of Learning Disabilities, 39(2), 157–169. doi:10.1177/00222194060390020401
- Vellutino, F. R. (2010). “Learning to be learning disabled”: Marie Clay’s seminal contribution to the response to intervention approach to identifying specific reading disability. Journal of Reading Recovery, 10(1), 5–23. Retrieved from https://readingrecovery.org/images/pdfs/Journals/JRR/Vol10_No1_Fall-2010/JRR_10.1_Vellutino.pdf
- Walker, M., Sainsbury, M., Betts, H., Worth, J., & Bamforth, H. (2015). Phonics screening checking evaluation: Final report. Berkshire, UK: National Foundation for Educational Research.