
Abstract
Telomere Length (TL) and integrity is significantly associated with age-related disease, multiple genetic and environmental factors. We observe mouse genomic DNA (gDNA) isolation methods to have a significant impact on average TL estimates. The canonical qPCR method does not measure TL directly but via the ratio of telomere repeats to a single copy gene (SCG) generating a T/S ratio. We use a monochromatic-multiplex-qPCR (mmqPCR) method which multiplexes the PCR and enables quantification of the target and the single copy gene within the same qPCR reaction. We demonstrate that TL measurements, from murine gDNA, isolated via Spin Columns (SC) and Magnetic Beads (MB), generate significantly smaller T/S ratios compared to gDNA isolated via traditional phenol/chloroform methods. The former methods may impede correct TL estimation by producing non representative fragment sets and reducing qPCR efficacy. This work highlights discrepancies in TL measurements due to different extraction techniques. We recommend the use of gDNA isolation methods that are shown to preserve DNA length and integrity, such as phenol/chloroform isolation. We propose that widely used high throughput DNA isolation methodologies can create spurious associations within a sample set, thus creating misleading data. We suggest that published TL associations should be revisited in the light of these data.
Introduction
Telomeres are found on all mammalian linear chromosomes, consisting of the tandemly repeated sequence TTAGGG, associated with their structural proteins, the shelterin complex. Telomeres are crucial for the maintenance, stability, and preservation of the genome.[Citation1] Due to the consistent observation that telomeres gradually shorten as mammals age, it has been hypothesized that telomere length (TL) may influence aging on a cellular level.[Citation2] In addition to being closely correlated with chronological age, TL has been robustly associated with the onset of monogenic and polygenic age-related diseases.[Citation3,Citation4]
TL is modulated by a variety of different factors, including, but not limited to, heritable load,[Citation5,Citation6] monogenic[Citation7] and polygenic effects,[Citation8] and environmental influences, such as socioeconomic status,[Citation9] educational attainment status[Citation10] and exposure to life-stress events.[Citation11]
To fully elucidate the relationships between TL, age, health and disease, understanding TL dynamics is critical. To do so, many researchers have used animal models to investigate the drivers of these associations. Care needs to be taken when extrapolating findings to humans since telomere dynamics and lengths differ from species to species.[Citation12] However, although telomere dynamics are not precisely the same as in humans, animal models such as the mouse are still similar enough to be pivotal in elucidating the molecular mechanisms behind telomere attrition. Mice have proved to be a useful model due to their similarities, extensive knowledge of their genome and the ease with which their genome and environment can be controlled. Previously, it has been observed[Citation13] that TL measurements from humans differed greatly according to the DNA isolation process chosen. T/S ratios, alone, are used in scores of papers that report associations and advantages and sources of error in this method have been widely discussed.[Citation14] This was thought to result in intra study variation, whilst being internally reliable. Mice have much longer telomeres than humans but method of isolation effects have not been studied well in murine models. Reported results could be greatly affected where a particular DNA isolation protocol restricts TL analysis to a subset of fragment lengths. A recent review highlighted the importance of the chosen DNA isolation method and its impact on human TL measurements using qPCR.[Citation15]
In our study, we investigated the effect of DNA isolation method on the TL measurements obtained, as the Telomere to Single copy gene T/S ratio.[Citation16] We compared murine tissues from three different sub strains of C57BL/6J and three commonly deployed extraction methodologies. DNA was isolated from the kidney and liver tissue of C57BL/6N (Nnt+/+), C57BL/6J (NntBAC) and C57BL/6J (Nnt−/−)[Citation17] using either a commercial Spin column (SC) kit, a magnetic bead(MB)-based isolation method or traditional phenol/chloroform (PC) isolation. These methods were chosen on the basis that they are the most commonly used isolation methods for a wide plethora of studies and biobanks. Telomere to single copy gene ratios (T/S ratios), which strongly correlate with TL, were generated by monochrome multiplex quantitative polymerase chain reaction[Citation16] (mmqPCR) and compared across isolation protocol, tissue and strain.
Materials and methods
Subjects
Three sub strains of C57BL/6J mice (10 Nnt+/+, 10 NntBAC and 9 Nnt−/−), were reared until 18 months of age and euthanised. Their tissue was immediately harvested and flash frozen. gDNA was extracted from kidney tissue from all mice (n = 29) and from liver tissue of the wildtype strain (n = 9). The relative telomere length of each sample was then determined by monochromatic-multiplex-qPCR (mmPCR).
DNA extraction
For each individual, gDNA was extracted in one of three ways. (1) Traditional phenol/chloroform followed by ethanol precipitation. Briefly, 1 cm3 of liver tissue was digested overnight in a 37 °C waterbath in a 100 µL solution consisting of 0.1 M NaCl, 10 nM Tris-base, 1 mM EDTA, 1%SDS and 2 µL proteinase K (All reagents supplied from Sigma Aldrich). Following digestion, an equal volume of Phenol-Chloroform-isoamyl alcohol (Sigma Aldrich) was added. Samples were vortexed and spun at 12,000 RPM, for 5 mins, in a centrifuge. Following separation, the aqueous phase was removed and added to a fresh tube. Pure gDNA was then extracted from the aqueous phase utilizing standard ethanol precipitation procedure. (2) A magnetic bead-based method (MagAttract HMW DNA Kit, Qiagen Ltd, Manchester UK). (3) Spindown columns (PureLinkTM Invitrogen, Carlsbad, CA). From (2) and (3) DNA was extracted using the kits as per the manufacturer’s recommendations. Following extraction, purities and yields were analyzed via NanoDrop. For each sample, aliquots at a concentration of 10 ng/µL were produced in preparation for telomere length estimation.
T/S ratio determination
Following extraction, relative telomere length was determined by mmqPCR, as previously described with some modifications. This is a method which multiplexes the PCR and enables quantification of the target and the single copy gene within the same qPCR reaction and has been shown to reduce experimental error.[Citation16] The SCG 36b4 was selected as it is highly conserved in mice and has been previously used to investigate murine TL.[Citation18] We used TL primers as previously published and modified the published SCG primers, by the addition of 5′ GC clamps, in line with Cawthorn et al.,[Citation16] thus increasing the primer melting temperature (tm) of the amplicon allowing two discrete amplification profiles (see ).
Table 1. Oligonucleotides used to amplify SGC[Citation17] and telomere target,[Citation17] sequence in bold is the GC clamp.
For each plate, standards spanning a range of concentrations of our gDNA, from 2.5 ng/µL to 40 ng/µL were run in triplicate, each sample was analyzed in duplicate. Each 10 µL reaction consisted of the following reagents: 5 µL iQ SYBR green supermix (Biorad), 900 nM TelG and TelC primers 500 nM 36B4GCF and 36B4GCR primers (all supplied from Eurogentec) (), 10 ng of gDNA and 1.2 µL dH20. The mmqPCR reaction was carried out using 96-well plates on an Agilent AriaMx thermocycler. The cycling conditions were as follows (15mins @ 95 °C) × 1, (15s @ 94 °C, 15s @49 °C) × 2, (15s @ 94 °C, 10s @ 62 °C, 15S @ 74 °C with signal acquisition, 10s @ 84 °C, 15s @ 88 °C with signal acquisition) × 30. Following amplification, all samples were subject to high resolution melt curve analysis to check the specificity of the reaction.
Results
mmqPCR validation
One Liver DNA sample isolated using a SC was selected for the standard. This sample had the highest yield and the most ideal 260/280 and 260/230 ratios. Subsequently, all samples were compared against this one to determine relative telomere length. The standards were prepared as follows. A series of dilutions spanning a 15-fold range were prepared as a series of 2-fold dilutions (2.5 ng/µL, 5 ng/µL, 10 ng/µL, 20 ng/µL and 40 ng/µL) and analyzed under the aforementioned conditions. displays the standard curves generated from these runs.
Figure 1. (A) Standard curve generated from signal collected at the 88 °C step in the thermal profile. This corresponds to amplification of the single copy gene (36b4). Circles represent the average Cq value for each triplicate. (B) Standard curve generated from signal collected at the 74 °C step in the thermal profile corresponding to amplification of telomeric repeats. Circles represent the average Cq value for each triplicate. Amplification efficiencies were 95.37% and 90.67%, respectively.
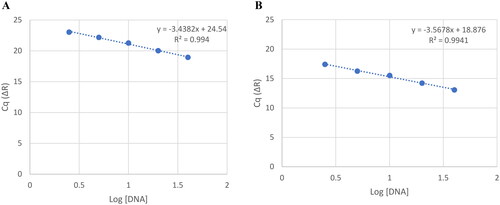
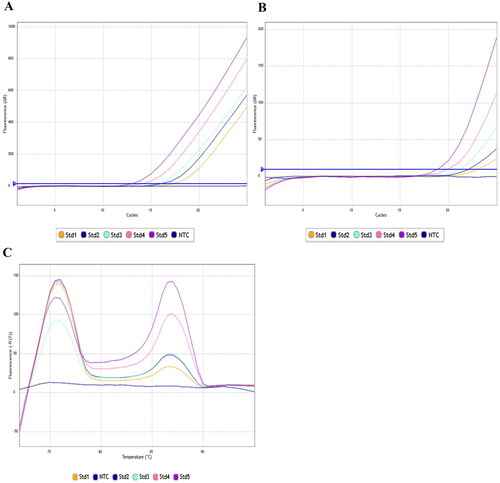
As expected, the more abundant telomeric DNA target generates much smaller quantification cycle (Cq) values than amplification of the single copy gene (SCG) 36b4, for a given dilution. On average, the Cq value for the 36b4 is appearing 5.8 cycles later than the telomeric amplification, for a given dilution. Therefore, there is no overlap between the target and the SCG Cq values. display the amplification plots of these runs, and the melt curve analysis performed at the end of the run.
Figure 2. (A) 88 °C Amplification plot. 5’ GC clamps on the SCG primers (36BGCF/R) create stable amplicon formation at high temperature thus signal at this step is solely 36b4 amplicons, since the less stable telomeric amplicons will have melted. (B) 74 °C Amplification plot. Curves here are from amplification of telomeric DNA, whilst the SCG amplification is still at baseline. (C) Melt curve analysis of products. After the final cycle, the plate was heated to 72 °C and 95 °C in 0.5 °C increments. We can observe two distinct peaks with no overlap. The first at ∼76 °C corresponds to the melting of the telomeric amplicons and the second peak at ∼88 °C corresponds to melting of the 36b4 amplicon. Std1: 2.5 ng/µL; Std2: 5 ng/µL; Std3: 10 ng/µL; Std4: 20 ng/µL; Std5: 40 ng/µL; NTC: Non template control.
T/S ratio using gDNA isolated from C57BL/6J mouse liver samples is influenced by isolation methodology
There was a highly statistically significant difference in the mean T/S ratio between each group split by isolation methodology (SC, MBs and PC), as tested by one-way ANOVA (p = 3.19 × 10⁻⁷) (supplementary material Additional file 1). Liver DNA isolated by phenol/chloroform produced the greatest T/S ratios, i.e., the longest telomeres (see ). Following this observation, the same DNA sample isolated by PC was treated by running it through a spin column, and the TL reanalyzed. The resultant T/S ratios were reduced and more closely resembled the T/S ratios generated from the SC and MB-based methods, i.e., shorter (). To determine whether DNA purity had affected the T/S ratios, correlation between 260/280, 260/230 ratios and the T/S ratios were analyzed. Whilst there was a slight positive correlation between 260/230 and T/S ratios, p = 0.0002 (), after adjusting for this potential confounder via ANCOVA analysis, this had no discernible effect on the outcome, i.e., the differences between extraction method were still highly significant (p = 0.00027) (). To investigate the integrity of the samples we ran 400 ng of gDNA isolated from each method on a 0.8% agarose gel at 70 V for 2 hours (). As can be observed the degree of fragmentation differs quite drastically between the methods. The magnetic bead method shows a large fragment at the 22 kb marker, and the DNA isolated via spin columns appears to show a smear across the gel, showing a range of fragment sizes between 4 kb and 2kb. DNA isolated via PC displayed fragments in the 9 kb–4 kb range. DNA that was initially isolated using PC and then washed through a spin column showed a much higher degree of fragmentation compared to MB, SC and just PC.
Figure 3. (A) Bar chart of T/S ratios generated from the same liver tissue sample, where DNA has been isolated using different methods differences in mean T/S ratios, between DNA samples isolated by different methodologies, were identified utilizing one-way ANOVA (Bonferroni corrected) and T-tests. Only the T/S ratios from DNA isolated using phenol/chloroform (11.12 ± 5.58) were significantly different (p ≤ 0.0001) when compared to: Phenol/chloroform followed by spin column (2.5 ± 1.24), magnetic bead isolation (1.63 ± 0.58) and spin column isolation alone (1.55 ± 0.32). These methods were not significantly different from one another. (B) Scatter plot depicting the correlation between T/S ratio and 260/230 ratios. There was a moderate correlation observed between T/S ratios and 260/230 ratios r2=0.38, p = 0.0002, however when the analysis was repeated (ANCOVA) with the 260/230 as a covariate, this potential confounding variable had no discernible influence on the differences previously observed i.e., there was still a significant difference in T/S ratios between extraction methods, and this was not due to differences in purity measurements. (C)Agarose gel electrophoresis of gDNA extracts. 0.8% agarose gel, 70v for two hours. Comparison of gDNA isolated from mouse liver tissue using different isolation methods. 400 ng of gDNA was run under the aforementioned conditions. L: Lambda/HindIII ladder; M: DNA isolated using magnetic beads; S: from spin columns; P: from phenol/chloroform; P + S: phenol/chloroform followed by spin column.
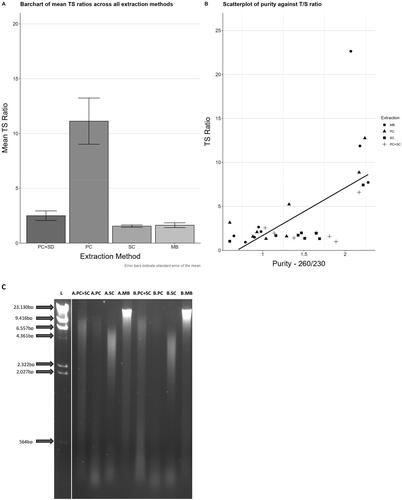
Table 2. Total yield, purities and T/S ratios for each extraction method.
Choice of gDNA isolation method may contribute to spurious associations between TL and other factors
Kidney DNA isolated using PC methodology from different sub strains of C57BL/6N (Nnt+/+) and C57BL/6J (NntBAC and Nnt−/−) mice and analyzed, produced T/S ratios which were statistically not significantly different between groups (see ), and there was a relatively greater range of variability in T/S ratios measured than when using either SC or MB methodologies () (supplementary material Additional file 2).
Figure 4. Bar charts of T/S ratios generated from mouse kidney tissue samples. DNA was isolated from three different sub strains of mice; C57BL/6N (Nnt +/+) and C57BL/6J mice, (Nnt (BAC,) and Nnt −/−), using either spin column or phenol/chloroform methodology. (A) T/S ratios generated from DNA isolated via the PC method from the same mice showed no significant difference between the different sub strains. (B) T/S ratios generated from DNA isolated using an SC were compared using one-way ANOVA. We identified a significant difference (p = 0.0287) in T/S ratios between the Nnt +/+ (1.46 ± 0.14) and Nnt (BAC) (1.2 ± 0.23) sub strains of mice after Bonferroni correction. (C) T/S ratios from each strain were pooled according to isolation method and analyzed. Student’s T-test was used to compare mean T/S ratios. There was a highly significant difference in the resultant T/S ratios (p ≤ 0.0001), between the isolation method used.
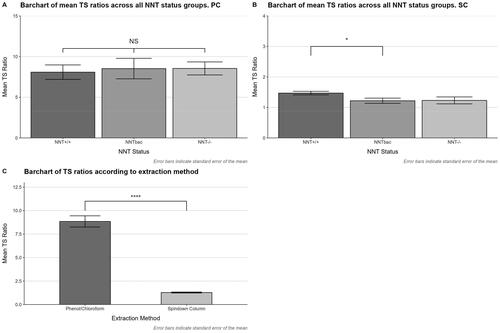
To determine whether choice of isolation methodology had any effect on this outcome, DNA from the same source tissue was isolated using SCs and TL reanalyzed. The resultant T/S ratios were significantly different between groups (), as determined by one-way ANOVA (p = 0.035). Post-hoc analysis identified a significant difference in mean T/S ratio between Nnt+/+ and NntBAC mice (p = 0.029). This significant difference seems highly likely to be produced solely due to the isolation methodology and not a real effect. There also appears to be a much smaller range of T/S ratios measured when compared with the DNAisolated withPC methodology ().
Discussion
Over the past 20 years, many studies have investigated associations between TL and a wide range of environmental and genetic effects. Due to the increased need for larger sample sizes to detect potentially small effects, traditional PC protocols fell out of favor as researchers moved to simpler, cheaper and safer commercial kits. SCs have been widely adopted for DNA extraction. However, these kits are typically optimized for extraction of fragments smaller than 10 kb.[Citation19,Citation20,Citation21] Mouse telomeres are approximately 50 kb long, therefore larger fragments containing telomeric repeats are potentially fragmented or lost during the isolation process. This would result in qPCR analysis only detecting a subset of fragments which are depleted of some of telomeric repeat containing fragments.
We systematically investigated the effect of three DNA isolation methods in C57BL/6N (Nnt+/+) and C57BL/6J (NntBAC and Nnt−/−) mice in two different tissues, liver and kidney, and made two clear observations. Firstly, T/S ratios from DNA isolated via MB-based methods and SC’s are significantly lower than the T/S ratios from DNA isolated by the PC method. Secondly, the choice of isolation method may create spurious associations between telomere length and environmental or genetic factors.
Our results show that there is a clear effect of gDNA isolation method on the resultant T/S ratio. This effect was independent of purity and so a reduction in the efficiency of the qPCR reaction due to contaminants can be excluded. These results are consistent with what was previously observed in humans;[Citation13] however, the overall effect was much smaller in that study. We hypothesize that this is due to mouse telomeres being generally much longer than humans (40–50 kb in mice versus 10–15 kb in humans). This more pronounced effect may be due to a decreased binding efficiency of larger DNA fragments containing telomeric repeats to the spindown columns and to the surface of magnetic beads. Additionally, SC and MB-based isolation methods require numerous pipetting, centrifugation and vortexing steps, compared to PC isolation, potentially leading to an increased rate of shearing of longer DNA molecules.
An important factor to consider when interpreting these associations, is that mmqPCR is measuring the amount of telomeric DNA in the sample – observing a reduced T/S ratio between two individuals can imply one of two things. One, that the telomeres are genuinely shorter, and two, there is simply less telomeric DNA present in the sample. Considering our systematic approach of analyzing the same individual mice, we believe we can rule out scenario one and can conclude that telomeric DNA is being lost in the extraction process. Silica columns have previously been associated with an increased rate of shearing and larger fragments of DNA may not bind as efficiently to the silica compared to smaller fragments and could be washed away in the wash steps.[Citation13] Subsequently, downstream analysis may only be measuring a subset of the telomere-containing DNA fragments.
Our observation in mouse kidney tissue, was that there was a significant difference in T/S ratios between the different mouse genotypes when isolated via SC. This association disappeared when the DNA was re-isolated via PC isolation, implying that the spurious association was produced by the SC isolation methodology and this observation could have serious consequences for epidemiological studies using gDNA isolated in this way. Previous studies have attempted to rectify this problem, by suggesting the use of one isolation method for all samples within the same study. However, it is clear from the data presented here that DNA isolated via SC or MB result in T/S ratios that are an inaccurate representation of the true telomere length in mice.
Conclusion
In conclusion, DNA extraction method has a clear effect on the measured T/S ratios in mice. Non-representative sets of DNA fragment sizes are likely being isolated, resulting in a marked reduction of qPCR efficacy within sample sets. This problem particularly applies to measurement of repetitive DNA where reproducible preservation of all the DNA present is crucial for this quantitative methodology to represent length. The use of methods designed to isolate fragments of approx. 10Kb or smaller in isolating mouse gDNA to investigate associations between TL and environmental and/or genetic factors should be discouraged. Genomic DNA isolation methods for TL measurement need to be selected so as to preserve DNA length and integrity as much as possible to minimize the chance of spurious associations internally and to enable comparison to other studies. Published TL associations, where spin columns and beads have been used to extract DNA, should be revisited in the light of these findings.
Statistics and reproducibility
All analysis was conducted in SPSS(v23.0). A t-test (ANOVA) was utilized to compare the differences in the resultant T/S ratios from each extraction method. Results with p < 0.05 were deemed statistically significant. Graphs were generated using GraphPad Prism (v7.02).
For each plate, standards spanning a range of concentrations from 2.5 ng/µL to 40 ng/µL were run in triplicate, each sample was analyzed in duplicate. Any pair of samples which generated a T/S ratio with a coefficient of variation greater than 30% were deemed inaccurate and were repeated. After repeating the assay, if the coefficient of variation of the duplicates was still greater than 30%, the samples were deemed unsuitable for further analysis and removed from the dataset.
Author contributions
UF and AJW initiated the study, UF, EK, EM and AJW designed the experiments, EK performed the experiments, EK and UF analyzed the experimental data and UF, EK, AW and EM wrote the paper, JW and LM contributed mouse tissue, discussed experimental design and reviewed manuscript.
Ethics approval
All mice were bred, housed, and culled at Medical Research Council Harwell. Mice were kept and studied in accordance with the UK Home Office legislation and local ethical guidelines issued by the Medical Research Council (Responsibility in the Use of Animals for Medical Research, July 1993; Home Office license 30/3146).
Supplemental Material
Download MS Excel (13 KB)Supplemental Material
Download MS Excel (26.3 KB)Acknowledgments
Our sincere thanks go to Dr Jessica Buxton (formerly Kingston University) and Professor Alex Blakemore, (Brunel University and Imperial College) who were pivotal in inspiring and supporting our initial investigations into telomere lengths.
Disclosure statement
No potential conflict of interest was reported by the author(s).
Data availability statement
All data used for this study are included in this publication as additional files.
Additional information
Funding
References
- Sfeir, A. Telomeres at a Glance. J. Cell Sci. 2012, 125, 4173–4178. DOI: 10.1242/jcs.106831.
- Hornsby, P. J. Telomerase and the Aging Process. Exp. Gerontol. 2007, 42, 575–581. DOI: 10.1016/j.exger.2007.03.007.
- Shammas, M. A. Telomeres, Lifestyle, Cancer, and Aging. Curr. Opin. Clin. Nutr. Metab. Care. 2011, 14, 28–34. DOI: 10.1097/MCO.0b013e32834121b1.
- Haycock, P. C.; Burgess, S.; Nounu, A.; Zheng, J.; Okoli, G. N.; Bowden, J.; Wade, K. H.; Timpson, N. J.; Evans, D. M.; Willeit, P.; et al. Association Between Telomere Length and Risk of Cancer and Non-Neoplastic Diseases: A Mendelian Randomization Study. JAMA Oncol. 2017, 3, 636–651. DOI: 10.1001/jamaoncol.2016.5945.
- Costa, D. d S.; Rosa, D. V. F.; Barros, A. G. A.; Romano-Silva, M. A.; Malloy-Diniz, L. F.; Mattos, P.; de Miranda, D. M. Telomere Length is Highly Inherited and Associated with Hyperactivity-Impulsivity in Children with Attention Deficit/Hyperactivity Disorder. Front. Mol. Neurosci. 2015, 8, 28. DOI: 10.3389/fnmol.2015.00028.
- Kim, J.-H.; Nam, C. M.; Lee, D.; Bang, H.; Ko, J.-H.; Lim, I.; Kim, G. J.; Koes, B. W.; Lee, D.-C. Heritability of Telomere Length Across Three Generations of Korean Families. Pediatr. Res. 2020, 87, 1060–1065. DOI: 10.1038/s41390-019-0699-7.
- Armanios, M.; Blackburn, E. H. The Telomere Syndromes. Nat. Rev. Genet. 2012, 13, 693–704. DOI: 10.1038/nrg3246.
- Coutts, F.; Palmos, A. B.; Duarte, R. R. R.; de Jong, S.; Lewis, C. M.; Dima, D.; Powell, T. R. The Polygenic Nature of Telomere Length and the Anti-Ageing Properties of Lithium. Neuropsychopharmacology 2019, 44, 757–765. DOI: 10.1038/s41386-018-0289-0.
- Needham, B. L.; Fernandez, J. R.; Lin, J.; Epel, E. S.; Blackburn, E. H. Socioeconomic Status and Cell Aging in Children. Soc. Sci. Med. 1982, 74, 1948–1951. 2012). DOI: 10.1016/j.socscimed.2012.02.019.
- Needham, B. L.; Adler, N.; Gregorich, S.; Rehkopf, D.; Lin, J.; Blackburn, E. H.; Epel, E. S. Socioeconomic Status, Health Behavior, and Leukocyte Telomere Length in the National Health and Nutrition Examination Survey, 1999-2002. Soc. Sci. Med. 1982, 85, 1–8. DOI: 10.1016/j.socscimed.2013.02.023.
- Epel, E. S.; Blackburn, E. H.; Lin, J.; Dhabhar, F. S.; Adler, N. E.; Morrow, J. D.; Cawthon, R. M. Accelerated Telomere Shortening in Response to Life Stress. Proc. Natl. Acad. Sci. U S A. 2004, 101, 17312–17315. DOI: 10.1073/pnas.0407162101.
- Louzon, M.; Coeurdassier, M.; Gimbert, F.; Pauget, B.; de Vaufleury, A. Telomere Dynamic in Humans and Animals: Review and Perspectives in Environmental Toxicology. Environ. Int. 2019, 131, 105025. DOI: 10.1016/j.envint.2019.105025.
- Cunningham, J. M.; Johnson, R. A.; Litzelman, K.; Skinner, H. G.; Seo, S.; Engelman, C. D.; Vanderboom, R. J.; Kimmel, G. W.; Gangnon, R. E.; Riegert-Johnson, D. L.; et al. Telomere Length Varies by DNA Extraction Method: Implications for Epidemiologic Research. Cancer Epidemiol. Biomarkers Prev. 2013, 22, 2047–2054. DOI: 10.1158/1055-9965.EPI-13-0409.
- Nettle, D.; Seeker, L.; Nussey, D.; Froy, H.; Bateson, M. Consequences of Measurement Error in qPCR Telomere Data: A Simulation Study. PLoS One. 2019, 14, e0216118. DOI: 10.1371/journal.pone.0216118.
- Lin, J.; Smith, D. L.; Esteves, K.; Drury, S. Telomere Length Measurement by qPCR - Summary of Critical Factors and Recommendations for Assay Design. Psychoneuroendocrinology 2019, 99, 271–278. DOI: 10.1016/j.psyneuen.2018.10.005.
- Cawthon, R. M. Telomere Length Measurement by a Novel Monochrome Multiplex Quantitative PCR Method. Nucleic Acids Res. 2009, 37, e21–e21. DOI: 10.1093/nar/gkn1027.
- Freeman, H. C.; Hugill, A.; Dear, N. T.; Ashcroft, F. M.; Cox, R. D. Deletion of Nicotinamide Nucleotide Transhydrogenase: A New Quantitive Trait Locus Accounting for Glucose Intolerance in C57BL/6J Mice. Diabetes 2006, 55, 2153–2156. DOI: 10.2337/db06-0358.
- Callicott, R. J.; Womack, J. E. Real-Time PCR Assay for Measurement of Mouse Telomeres. Comp. Med. 2006, 56, 17–22.
- Huang, Y.; Mu, J.; Qi, L.; Ge, W.; Fang, X.; Song, Y.; Yuan, Y.; Zheng, S. Diverse Fragment Lengths Dismiss Size Selection for Serum Cell-Free DNA: A Comparative Study of Serum and Plasma Samples. Clin. Chem. Lab. Med. 2020, 58, 1451–1459. DOI: 10.1515/cclm-2020-0078.
- Diefenbach, R. J.; Lee, J. H.; Kefford, R. F.; Rizos, H. Evaluation of Commercial Kits for Purification of Circulating Free DNA. Cancer Genet. 2018, 228-229, 21–27. DOI: 10.1016/j.cancergen.2018.08.005.
- Nakashima, C.; Sato, A.; Abe, T.; Kato, J.; Hirai, M.; Nakamura, T.; Komiya, K.; Sueoka, E.; Kimura, S.; Sueoka-Aragane, N.; et al. Automated DNA Extraction Using Cellulose Magnetic Beads Can Improve EGFR Point Mutation Detection with Liquid Biopsy by Efficiently Recovering Short and Long DNA Fragments. Oncotarget 2018, 9, 25181–25192. DOI: 10.18632/oncotarget.25388.