
Abstract
A system was developed in our laboratory to couple capillary electrophoresis with mass spectrometry. The capillary electrophoresis system was equipped with a high voltage supply, and a microcontroller with assembly language programming was developed for the computational control of the system. The MS system was a commercial Thermo Finningan LCQ ion trap mass spectrometer. The robustness of the coupled system was evaluated using standard protein samples (lysozyme, aprotinin, and bovine albumin) and tryptic digests of lysozyme. The system showed positive results in terms of robustness, allowing for the separation of digested proteins and the identification of 33% of the total amino acids in a protein (6 of the 18 expected peptides). The limit of detection was in the order of 1 picomole (signal-to-noise ratio), which was considered satisfactory for this system. The system shows high versatility in tandem coupling and combinations with other analytical procedures.
Introduction
Capillary electrophoresis (CE) has become increasingly important in analytical chemistry as a powerful tool for separating and identifying a large variety of molecules.[ Citation 1 , Citation 2 , Citation 3 , Citation 4 ] CE provides high resolution and efficiency, which are very important parameters in separation processes. Another advantage of CE is its low operational cost, even with organic solvents because it uses negligible volumes compared with the amounts used in HPLC, even in capillary-scale applications. In the last decade, the capillary electrophoresis coupled to a mass spectrometry (CE-MS) system has received much attention because of its low consumption of solvent during analysis. This reduction has rendered the CE-MS methods sustainable.[ Citation 5 , Citation 6 ] The high resolving power of CE and the identification capacity of MS provide excellent analytical gains in reduced time. Its low solvent consumption and high resolution make CE-MS a powerful tool for proteome and metabolome analyses.[ Citation 7 , Citation 8 ] Moreover, the small amount of injected sample (nL range) required in the electrophoretic process is an important factor for clinical applications.[ Citation 9 ] However, the greatest contribution of CE is its complementarity with already established methods, given the variety of existing separation processes and the many still under development, encompassing all the categories of compounds.[ Citation 10 ] CE-MS was introduced about two decades ago and has found different and increasingly accepted applications.[ Citation 11 , Citation 12 ]
The high resolution and efficiency of CE allied to the universality and sensitivity of MS are invaluable when compared with those of other detection systems such as UV-Vis spectrophotometry and laser-induced fluorescence (LIF), which provide little information about the analyte's structure.[ Citation 13 , Citation 14 ] For instance, the use of MS associated with computational tools is highly recommended in studies of complex samples such as proteins, peptides, and metabolites because information such as molecular mass and structure (tandem mass spectrometry) is indispensable for the characterization and quantification of these analytes. Thus, the information provided by the second dimension of the mass detector is another advantage of CE-MS. Solutes that present slight variations in migration time or even that migrate at the same velocity may be identified. In this scenario, CE-MS has emerged as a tool of great importance in bioanalysis.[ Citation 15 , Citation 16 , Citation 17 ] However, considerable research and development are still required for the tool to achieve its full technological capacity. The purpose of this study was to build a homemade laboratory CE system coupled to a nano-ESI/MS system.
CE-MS Instrumentation
The CE-MS interface plays a major role in this analytical methodology. The formation of spray (electrospray), i.e., the electrostatically induced vaporization of a liquid flowing through a capillary, forming tiny droplets at its outlet under the action of an electric field, occurs at this interface. This fine spray emerges from the capillary at a relatively high temperature and at a pressure close to that of the atmosphere. The production of this spray in the chemical environment is hindered by electrochemical phenomena, electrolyte properties, the capillary surface, the applied potential, and other factors. Thus, it is necessary to create stable electrical and physicochemical conditions for the successful formation of ions, and hence, for successful analysis.[ Citation 18 ]
CE-MS Interface Setup
The three setups commonly used in CE-ESI-MS coupling are i) coaxial sheath liquid, ii) liquid junction, and iii) sheathless or nanospray. All these configurations involve closing the high voltage circuit at the outlet of the separation capillary. These setups differ from each other in the position of their electrodes and the nature of their ionization environment (presence or absence of liquid) for the formation of spray at the inlet of the ESI-MS system.
Coaxial Sheath Liquid Flow
The interface developed by Smith et al. in the mid-1980s pioneered capillary electrophoresis systems with an ESI source.[ Citation 18 ] In these systems, one extremity of a silica capillary is inserted into a metal cone (electrode). The extremity of the capillary (MS inlet) is placed close to the auxiliary liquid, and the formation of spray is aided by a nebulization gas.[ Citation 19 ] This system allows for the stable formation of ions in the MS system; however, its disadvantage is that the auxiliary liquid dilutes the sample.[ Citation 20 , Citation 21 ]
Liquid Junction
In this setup, an electrode is placed at the injector extremity close to the MS inlet at the junction of two capillaries, and a voltage is applied to the system. An advantage of this setup is that the electrode's electrical contact is stable. However, this setup has some disadvantages, such as i) the electrode tends to form bubbles due to electrochemical reactions (electrolysis) on its surface, causing problems such as the interruption of the electric field in the CE system; ii) the occurrence of redox reactions due to the relatively large area of the capillary; and iii) the dead volume at the junction between the capillaries causes increased dispersion due to flow disturbance.[ Citation 22 , Citation 23 ]
Sheathless
The extremity of the capillary is metallized and tapered. It is inserted into a metal cone placed at the MS inlet. When the solution exits the capillary and makes contact with the metallized part close to the ESI-MS inlet, it establishes an electric field, and a spray is formed. One of its critical points is the lifetime of the metallized portion of the capillary, which is usually a metallic film. The favorable conditions for spray formation cause the film at the extremity of the capillary to degrade rapidly. The formation of chemical species resulting from the electrochemical reactions on this surface is also an undesirable phenomenon. The main advantages of this system are that the samples are not diluted (absence of auxiliary liquid) and resolution is not lost, unlike what occurs at the liquid junction interface.[ Citation 24 , Citation 25 ]
Advantages of CE-MS
CE has high resolution and efficiency, which are critical parameters, particularly when the CE system is coupled to a high-efficiency and high-resolution spectrometer. Another advantage of the CE system is its low operational cost. Even in conditions that require organic solvents, the volumes are negligible in comparison to those used in capillary scale chromatography. However, the greatest contribution of capillary electrophoresis is that it complements already established separation methods with many other separation mechanisms that encompass nearly all classes of compounds. However, these methodologies require adequate development for proper coupling to MS. The main separation methods are free solution electrophoresis (CZE) or simply CE, gel capillary electrophoresis (CGE), micellar kinetic electrochromatography (MEKC), isoelectric focalization capillary electrophoresis (CIEF), capillary sieving electrophoresis (CSE) and capillary isotachophoresis (CITP). But are not all modes of CE compatible with mass spectrometry, however there are possibilities of development, which makes this process of separation promising. Another advantage of the CE-MS system is that the ionization mode is changed only when the separation electrolyte has to be changed, unlike the LC-MS system, which requires changing the column.[ Citation 26 ]
This paper describes the homemade adaption of a controlled micro-HPLC/CE interface performed in our lab. The interfaces were of the coaxial sheath flow and sheathless types.
Materials and Methods
Development of the Instrumentation
The modular CE system developed by our group consists of a Spellman high voltage power supply (Spellman, USA), a silica capillary (Polymicro Tecnologies, USA), solution containers and supports, and platinum electrodes (Sigma Aldrich, USA). A microcontroller (Texas Instrumentals, USA) was required to control the high voltage power supply because the system was purchased without this feature to reduce costs; therefore, a power supply and a microcontroller assembly language program were developed.
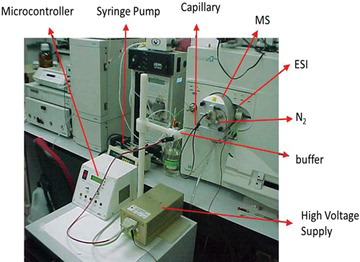
The interface used was adapted from a system LCQ Duo The silica capillary requires the removal of 0.5 cm of the polyimide from your end. This removal aims to facilitate electrical contact. The capillary requires that the end of approximately 5 mm at the outlet is exposed to the interface to facilitate the formation of the spray. The system proved to be robust assembled and disassembled. An electrical grounding electrode was performed in the reservoir system of CE with the outside of the mass spectrometer. An important detail for the correct functioning of the system and the silica capillary be in horizontal position and the same level with input from the electrospray injection system in CE. In Figure we show one photo of system where we detail the system.
Fig. 1 Illustrative photo of the CE-MS system.
Chemical Reagents
All the reagents were of analytical grade, and all the solutions were prepared with deionized water (18.2 MΩ × cm) obtained from a Milli-Q water purification system (Millipore, Milford, MA, USA). Methanol, ACN, acetic acid (99%), ammonium bicarbonate, Lysozyme, BSA, Aprotinin, dithiothreitol (DTT), iodoacetic acid (97%), and ammonium acetate were purchased from Sigma–Aldrich Chemie GmbH (Steinheim, Germany). Trypsin 250 was supplied by Promega (Sydney, Australian), trifluoroacetic acid (TFA) was obtained from Merck (NJ, USA), and C18 reverse-phase resin (10–15 µm, 300 Å) was purchased from Vydac (Hesperia, CA, USA).
Preparation of Samples
The protein digestion protocol was based on our previous paper.[ Citation 27 ] Briefly, the protein (100 µg) was dissolved in a solution of methanol/50 mmol/L NH4HCO3, pH 8.0, (60/40 v/v) in a 1.5-mL screw cap tube for 5 min at 95°C. This step served to break down the protein's tertiary structure to facilitate the enzyme's action. After cooling the mixture to room temperature, DTT, which reduces the protein's disulfide bonds, was added to a final concentration of 5 mmol L−1. Then, the solution was incubated for 30 min at 37°C. Iodoacetic acid was added to reach a final concentration of 10 mmol L−1, and the mixture was incubated in the dark at room temperature for 1.5 hr. This step promoted the alkylation of the cysteine residues. Next, the sample was diluted five-fold by adding methanol/50 mM NH4HCO3, pH 8.0 (60/40 v/v). Trypsin was added at an enzyme/substrate ratio of 1/50 w/w, and the mixture was stored at 37°C for 24 hr. The reaction was stopped by the addition of TFA at a final concentration of 0.05%. The sample's volume was reduced in a SpeedVac system (Labconco, Kansas City, MO, USA) before peptide purification.
Purification of Tryptic Peptides
The peptides were purified using purification columns built in the laboratory. These columns were built using 200 µL tips of automatic pipettes (Gilson). The construction of the columns began by placing glass fiber at the tip to retain the C18 phase. Column conditioning and purification involved the following eight steps: (1) sealing with glass fiber at the tip; (2) immobilization of 50 µL reverse phase C18 (100 mg mL−1) suspended in 100% isopropanol; (3) washing the column with 200 µL of methanol and isopropanol to enable reverse phase; (4) washing with 200 µL of 0.05% trifluoroacetic acid to equilibrate the column; (5) insertion of 200 µL of sample in the column; (6) washing with 200 µL of 0.05% trifluoroacetic acid; (7) elution of the peptides with 100 µL using a solution of 80% acetonitrile and 0.05% trifluoroacetic acid; and (8) production of purified peptides.
Analytical Conditions
The following parameters were considered: ionization temperature, nebulization gas flow rates, ionization voltage, electrolyte composition, and auxiliary liquid flow rates.
System Reliability and Robustness
The system's reliability was initially evaluated based on spectral deconvolution and spectral information. In the studies involving CE-MS/MS, the total number of identified amino acids was considered.
Results and Discussion
Development of the Instrumentation
Power Supply
To implement the controller, it was necessary to design and build a power supply with the following output characteristics: 24 VDC, 15 VDC, −15 VDC, and 5 VDC with current capacity of at least 2A at 24 V. Thus, the power supply built here was capable of supplying up to 3A because its own power consumption was 1.25 A.
A 60-V 3-A transformer with double input voltage (127 and 220 VAC) was used. The low voltage side was connected to the circuit through a 3-A fuse. The AC signal was rectified to pulsing DC with a diode bridge, and any was filtered out with two 2200-mF electrolytic capacitors. The desired voltages were obtained with voltage regulators, as indicated in Table .
Table 1. Voltage regulators (Texas Instruments)
Because the output current of these regulators is only 1 A, a current amplifier with a power transistor (TIP32) had to be built. Aluminum heat sinks were used with all the regulators and the power transistor to enhance heat dissipation. A cooler was also attached to the regulator box to dissipate heat.
Microcontroller Software
Basically, the function of the microcontroller is to digitize the analogical voltage and current information provided by the power supply for display on a LCD (16 × 2). The microcontroller was a PIC16F872 from Microchip (Chandler, Arizona, EUA). A 10-MHz oscillator crystal was used (although a 20 MHz crystal could also have been used). To develop the power supply control software, the first step was to check the proper functioning of the power supply, the safety measures, protection of the equipment, and the procedures to turn it on and off correctly. The high voltage power supply was controlled by four switches, on/off, positive/negative voltage, and two potentiometers for power supply output voltage and current setting. The software was developed following the instructions of the power supply user manual. Following these instructions, the first step was to ensure that the on/off switch was in the off position, that is, in the “low” logical state when energized. The next step was to select the output voltage polarity. With the two potentiometers at zero, the power supply was turned on. The logical level had to be shifted to high using the enable/disable switch. The potentiometers were then gradually adjusted to the desired voltage and current levels. To prevent incorrect use of the power supply, the microcontroller software was designed to present a sequence menu on the LCD accessible through two keys on the control panel. The main loop of the program was prepared by digitizing the power supply current and voltage levels and multiplying them by an appropriate correction factor, and only then displaying them on the LCD. Concomitantly to this process, a stopwatch was implemented. Internally, the stopwatch time count increased after 60 interruptions of the zero timer.
Microcontroller Circuit and Control Panel
To prevent noise and voltage spikes that might affect the proper working of the microcontroller, two integrated transistor LED photocouplers were used to isolate the power supply from the control system. Operational amplifiers were connected to the analogical data acquisition switches to prevent spurious noise from passing from the power supply to the data acquisition system. Because the analogical data varied between 0 and 10 V, a resistor divider (50%) was built to reduce the voltage level to that of the microcontroller, that is, from 0 to 5 V. 3.3 kΩ resistors with 1% tolerance were used. The control panel basically comprises the LCD, the sequence menu access keys, the current and voltage setting potentiometers, and LEDs to indicate positive/negative polarity, current/voltage control, and current leakage (error).
Analytical Conditions
The silica capillary was conditioned at the beginning of each day by first rinsing it with 1 mol L−1 of ammonium acetate for 20 min, followed by rinsing with deionized water for 2 min, and lastly with the background electrolytes for 5 min. Each sample was injected three times. The samples were injected hydrodynamically for 5 s by raising the capillary injection end 10 cm above the level of the detection end. The initial analytical condition was available using electrolytic solutions based on the conditions described in the literature. Figure illustrates these conditions. The baseline was stable, and the ions were formed abundantly for 10 min.
Fig. 2 The baseline of the CE–MS system was obtained by injecting the background electrolyte (BGE) under the following conditions: 1% acetic acid, 50% acetonitrile, 49% water; ESI voltage: 4.5 kV, and ESI temperature: 200°C. The auxiliary liquid was the same as BGE. The silica capillary was 50 cm in length, and E = 350 V cm−1. Samples were injected hydrodynamically for 5 s by raising the silica capillary injection end 10 cm above the level of the detection end.
After checking the stability of the system, the flow rate of the auxiliary liquid was varied (1–10 µL min−1) as a function of the intensity of the ions formed (data not shown). The auxiliary liquid was identical to the electrolyte used in the electrophoresis system. The best condition was 5 µL min−1. This result may be explained by the low availability of substances for vaporization at low flow rates. At high flow rates, the aerosol volume increases, contributing to reduce the formation of ions.
Parameters such as temperature, gas flow rate, and source voltage (ESI) were analyzed based on the values of each parameter in relation to ion stability and signal intensity. The best temperature found was 200°C, with a N2 gas flow of 5 psi min−1 pressure units and a source voltage of 4.5 kV. After optimizing these conditions, the system was calibrated, the physical and chemical viability of the assembled system were confirmed, and testing with protein samples was started. In this step, intact lysozyme, BSA, and aprotinin proteins and lysozyme digests were used as sample models. Lysozyme presents enzymatic and hydrolase activity (EC 3.2.1.17). Bovine serum albumin, another protein model used here, is widely used in biochemical studies. Aprotinin is a serine protease widely used in analytical models. The result of the analysis depicted in Figure demonstrates the success of the system. Aprotinin was used as a sample in the conditions shown in Figure . The result was as expected.
Fig. 3 Electropherogram/mass spectra. Sample: aprotinin 5.0 nmol µL−1 Other conditions were identical to those shown in Figure .
Figure illustrates an analytical condition using another electrolyte, aimed at finding higher analytical efficiency. This condition was successful, but the analysis of a mixture of proteins still indicated the occurrence of comigration.
Fig. 4 Electropherogram/spectrum of BSA 5.0 nmol µL−1, buffer 0.5% acetic acid in water, E = 200 V cm−1, pH 3.5, ESI voltage: 4.5 kV, ESI temperature: 200°C. Sampling was performed in the same conditions as those shown in Figure .
Figure shows an electropherogram of lysozyme and BSA separation. In this acidic condition, the reduced mobility of the species allowed for the separation of two proteins. With an aqueous electrolyte in a PVA-coated capillary, which is normally used in this experiment, the electroosmotic flow is suppressed, but in a medium rich in organic species, the flow is increased. The process of PVA treatment of the capillaries was based on earlier work by our group.[ Citation 28 ] Moreover, the use of methanol in CE-MS improves the ionization of species, which was observed in the condition under study. However, in this analytical condition, the protein digests were insufficient to separate many of the peptides (data not shown).
Fig. 5 Electropherogram obtained in a sheath-flow CE-MS system of lysozyme and BSA respectively. Separation electrolyte 1.0% acetic acid and PDMA capillary. E = 200 V cm−1, pH 3.5, ESI voltage: 4.5 kV, ESI temperature: 200°C. The sampling procedure was the same as that shown in Figure .
To improve the separation and ionization conditions, 10% methanol was added to the electrolyte, and tryptic digestion was used. The sequencing data were analyzed using the SEQUEST program (http://fields.scripps.edu/sequest/). The SEQUEST search mechanism uses the XCorr function to evaluate the match between spectra obtained experimentally and information on amino acid sequences in the database. The XCorr score is strongly dependent on the quality of the spectrum and on the generation of the model spectrum by the algorithm, which in turn, is based on knowledge about the behavior of peptide fragments in collision-induced dissociation.
Using only digested samples, the effects of two interface configurations were studied, and the sheathless system was introduced to facilitate the identification of peptides, as indicated in Table . Many peptides were identified in the sheath flow system, but the quality of sequencing was inferior (MS/MS). The experiments were performed in a sheathless capillary with a double layer of titanium/gold plating, also developed by our group.[ Citation 29 ] The best digest separation condition was NACE: 60% methanol, 30% ACN, 10% acetic acid, and NH4Ac 12.5 mmol L−1, E = 350 V cm−1.
Table 2. CE–ESI–MS/MS peptide sequencing results using SEQUEST
After generating the data, SEQUEST uses each peptide's mass to search the database by means of the virtual digestion of the entire protein database using enzyme select cleavage sites. SEQUEST compares the theoretical peptide mass in the database with the experimental ones, which usually results in more than one match. Next, all the matches are theoretically fragmented to generate their b and y fragmentation series, which SEQUEST compares with experimental peptide fragment data. SEQUEST uses two statistical indices to validate these data: the cross-correlation index (Xcorr), which compares experimental spectra with theoretical ones produced from the theoretical fragmentation of the matched peptide sequences (from the database), and dCn (delta Cn), which is the normalized difference of Xcorr of the two best matches. Reasonable values of Xcorr are (M + H) + > 1.8, (M + 2H)2 + > 2.5, and (M + 3H)3 + > 3.5; however, these scores are relatively dependent on the database used, and it is more advantageous to restrict the parameters further with large databases. The dCn value is reliable over 0.1, but if these values are too close, neither of the two matches can be discarded. Table shows the results of peptide sequencing by CE-MS/MS. Forty percent of the total amino acids were found to originate from a total of six peptides identified with double lysozyme loads.
The above described experiments (n = 6) were repeated. Six of the 18 theoretically expected peptides were identified in the analyses. The total number of amino acids identified varied from 30% to 40%, as shown in Table . The conditions involving nonaqueous electrolytes proved to be the best among those analyzed.
Analytical Reliability
The system's reliability was confirmed by the number of identified peptides and the exact mass of the analyzed protein (RSD < 5%). In fact, the main contributions of an analytical system based on mass spectrometry are analytical reliability and accuracy.
Robustness of the System
The system is robust, easy to assemble, and has an excellent potential for application. However, despite the system's viability and simplicity, the capillary is difficult to set up, which is a critical factor in CE-MS. In commercial systems, the distance between the capillary and the inlet of the mass spectrometer can be adjusted micrometrically. Conversely, in the system developed here, the capillary is positioned manually, and errors may therefore occur each time the system is set up. In addition, the sheath-flow system is completely enclosed, which makes it difficult to visualize.
Conclusion
The homemade CE-MS system built in our lab proved easy to use and viable for the analysis of proteins and peptides. However, its electrical insulation is poor, given that the MS device is not specific for coupling with an electrophoresis system. The CE system proved easy to handle but requires the development of an automated system. Although commercial systems are available, the development of a homemade system serves an educational purpose and allows it to be adapted to different laboratory applications. However, another area that needs more attention in CE-MS is nonaqueous capillary electrophoresis (NACE), which is a relatively new area and presents several advantages, including higher efficiency, detection sensitivity, and ionization. It also minimizes Joule heating band broadening effects and can use CE at high voltages.
Notes
Color versions of one or more of the figures in the article can be found online at www.tandfonline.com/ljlc.
References
- Campa , C. ; Coslovi , A. ; Flamigni , A. ; Rossi , M. Overview on Advances in Capillary Electrophoresis-Mass Spectrometry of Carbohydrates: A Tabulated Review . Electrophoresis 2006 , 27 ( 11 ), 2027 – 2050 .
- Haselberg , R. ; de Jong , G. J. ; Somsen , G. W. Capillary Electrophoresis-Mass Spectrometry for the Analysis of Intact Proteins . J. Chromatogr. 2007 , 1159 ( 1–2 ), 81 – 109 .
- Mayboroda , O. A. ; Neusüß , C. ; Pelzing , M. ; Zurek , G. ; Derks , R. ; Meulenbelt , I. ; Kloppenburg , M. ; Slagboom , E. P. ; Deelder , A. M. Amino Acid Profiling in Urine by Capillary Zone Electrophoresis-Mass Spectrometry . J. Chromatogr. 2007 , 1159 ( 1–2 ), 149 – 153 .
- Ohnesorge , J. ; Neusüß , C. ; Wätzig , H. Quantitation in Capillary Electrophoresis-Mass Spectrometry . Electrophoresis 2005 , 26 ( 21 ), 3973 – 3987 .
- Zhao , S. S. ; Zhong , X. ; Tie , C. ; Chen , D. D. Capillary Electrophoresis-Mass Spectrometry for Analysis of Complex Samples . Proteomics 2012 , 12 ( 19–20 ), 2991 – 3012 .
- Pioch , M. ; Bunz , S.-C. ; Neusüß , C. Capillary Electrophoresis/Mass Spectrometry Relevant to Pharmaceutical and Biotechnological Applications . Electrophoresis 2012 , 33 ( 11 ), 1517 – 1530 .
- Whitmore , C. D. ; Gennaro , L. A. Capillary Electrophoresis-Mass Spectrometry Methods for Tryptic Peptide Mapping of Therapeutic Antibodies . Electrophoresis 2012 , 33 ( 11 ), 1550 – 1556 .
- Ramautar , R. ; Heemskerk , A. A. M. ; Hensbergen , P. J. ; Deelder , A. M. ; Busnel , J.-M. ; Mayboroda , O. A. CE-MS for Proteomics: Advances in Interface Development and Application . J. Proteomics 2012 , 75 ( 13 ), 3814 – 3828 .
- Kolch , W. ; Neusüß , C. ; Pelzing , M. ; Mischak , H. Capillary Electrophoresis-Mass Spectrometry as a Powerful Tool in Clinical Diagnosis and Biomarker Discovery . Mass Spectrometry Reviews 2005 , 24 ( 6 ), 959 – 977 .
- Schmitt-Kopplin , P. ; Englmann , M. Capillary Electrophoresis-Mass Spectrometry: Survey on Developments and Applications 2003–2004. Electrophoresis 2005, 26 (7–8), 1209–1220.
- Assunção , N. A. ; Bechara , E. J. H. ; Simionato , A. V. C. ; Tavares , M. F. M. ; Carrilho , E. Capillary Electrophoresis Coupled to Mass Spectrometry (CE-MS): Twenty Years of Development . Quim. Nova 2008 , 31 ( 8 ), 2124 – 2133 .
- Haselberg , R. ; De Jong , G. J. ; Somsen , G. W. Capillary Electrophoresis-Mass Spectrometry for the Analysis of Intact Proteins 2007–2010 . Electrophoresis 2011 , 32 ( 1 ), 66 – 82 .
- Ryvolová , M. ; Táborský , P. ; Vrábel , P. ; Krásenský , P. ; Preisler , J. J. Chromatogr. 2007 , 1141 ( 2 ), 206 – 211 .
- Zhang , J. ; Xie , J. ; Chen , X. ; Hu , Z. Sensitive Determination of Ephedrine and Pseudoephedrine by Capillary Electrophoresis with Laser-Induced Fluorescence Detection . Analyst 2003 , 128 ( 4 ), 369 – 372 .
- Lee , R. ; Ptolemy , A. S. ; Niewczas , L. ; Britz-McKibbin , P. Integrative Metabolomics for Characterizing Unknown Low-Abundance Metabolites by Capillary Electrophoresis-Mass Spectrometry with Computer Simulations . Anal. Chem. 2007 , 79 ( 2 ), 403 – 415 .
- Hirayama , A. ; Soga , T. Amino Acid Analysis by Capillary Electrophoresis-Mass Spectrometry . Methods Molec. Biol. 2012 , 828 , 77 – 82 .
- Colnaghi Simionato , A. V. ; Moraes , E. P. ; Carrilho , E. ; Tavares , M. F. M. ; Kenndler , E. Determination of Amino Acids by Capillary Electrophoresis-Electrospray Ionization-Mass Spectrometry: An Evaluation of Different Protein Hydrolysis Procedures . Electrophoresis 2008 , 29 ( 10 ), 2051 – 2058 .
- Smith , R. D. ; Olivares , J. A. ; Nguyen , N. T. ; Udseth , H. R. Capillary Zone Electrophoresis-Mass Spectrometry Using an Electrospray Ionization Interface . Anal. Chem. 1988 , 60 ( 5 ), 436 – 441 .
- Kok , M. G. M. ; de Jong , G. J. ; Somsen , G. W. Sensitivity Enhancement in Capillary Electrophoresis-Mass Spectrometry of Anionic Metabolites Using a Triethylamine-Containing Background Electrolyte and Sheath Liquid . Electrophoresis 2011 , 32 ( 21 ), 3016 – 3024 .
- Hernández-Borges , J. ; Rodríguez-Delgado , M. A. ; García-Montelongo , F. J. ; Cifuentes , A. Highly Sensitive Analysis of Multiple Pesticides in Foods Combining Solid-Phase Microextraction, Capillary Electrophoresis-Mass Spectrometry, and Chemometrics . Electrophoresis 2004 , 25 ( 13 ), 2065 – 2076 .
- Smith , R. D. ; Barinaga , C. J. ; Udseth , H. R. Improved Electrospray Ionization Interface for Capillary Zone Electrophoresis-Mass Spectrometry . Anal. Chem. 1988 , 60 ( 18 ), 1948 – 1952 .
- Sheppard , R. L. ; Henion , J. Quantitative Capillary Electrophoresis/Ion Spray Tandem Mass Spectrometry Determination of EDTA in Human Plasma and Urine . Anal. Chem. 1997 , 69 ( 15 ), 2901 – 2907 .
- Garcia , F. ; Henion , J. D. Gel-Filled Capillary Electrophoresis/Mass Spectrometry Using a Liquid Junction-Ion Spray Interface . Anal. Chem. 1992 , 64 ( 9 ), 985 – 990 .
- Viberg , P. ; Nilsson , S. ; Skog , K. Nanospray Mass Spectrometry with Indirect Conductive Graphite Coating . Anal. Chem. 2004 , 76 ( 14 ), 4241 – 4244 .
- Serwe , M. ; Ross , G. Peptide Characterization by CE-ESI-MS with Orthogonal Spray . Chromatogr. 1999 , 49 ( 3331 ), s-73 – s-77 .
- Hommerson , P. ; Khan , A. M. ; De Jong , G. J. ; Somsen , G. W. Ionization Techniques in Capillary Electrophoresis-Mass Spectrometry: Principles, Design, and Application . Mass Spectrometry Reviews 2011 , 30 ( 6 ), 1096 – 1120 .
- Russell , W. K. ; Park , Z.-Y. ; Russell , D. H. Proteolysis in Mixed Organic-Aqueous Solvent Systems: Applications for Peptide Mass Mapping Using Mass Spectrometry . Anal. Chem. 2001 , 73 ( 11 ), 2682 – 2685 .
- Assunção , N. A. ; Grange Deziderio , L. A. ; Paulino , L. G. ; Lupetti , K. O. ; Carrilho , E. Nonaqueous Capillary Electrophoresis in Coated Capillaries: An Interesting Alternative for Proteomic Applications . Electrophoresis 2005 , 26 ( 17 ), 3292 – 3299 .
- Assunção , N. A. ; Nakayasu , E. S. ; Daffre , S. ; Carrilho , E. Development of Nanoinjector Devices for Electrospray Ionization-Tandem Mass Spectrometry (ESI-MSn) . J. Braz. Chem. Soc. 2012 , 23 ( 9 ), 1762 – 1766 .
- Color versions of one or more of the figures in the article can be found online at www.tandfonline.com/ljlc.