
 ?Mathematical formulae have been encoded as MathML and are displayed in this HTML version using MathJax in order to improve their display. Uncheck the box to turn MathJax off. This feature requires Javascript. Click on a formula to zoom.
Abstract
A nonlinear general rate model is numerically approximated to simulate fixed-bed chromatographic columns packed with core-shell particles. The model incorporates explicitly the effect of finite rates of adsorption and desorption at the adsorption sites, typically assumed to be very fast compared to the rates of the various transport processes. Using core-shell particles as a stationary phase can have advantages over applying a fully-porous stationary phase, such as higher efficiencies and better resolution of the sample components. A high resolution finite volume scheme is extended and applied to approximate the model equations. Ranges of the kinetic parameters in which limited rates of the intrinsic adsorption and desorption steps needs to be taken into account are estimated. A few case studies of predicting the elution of single-component and two-component mixtures are considered to evaluate the effects of adsorption and desorption rate constants, core-radius fraction, axial-dispersion coefficient, film mass transfer, and intraparticle diffusion on the elution profiles. Furthermore, it is demonstrated that optimum values of the inert core radius can be obtained by evaluating a typical criterion for process performance.
Graphical Abstract
Introduction
A key information required to quantify nonlinear preparative chromatography concerns adsorption equilibria, which determine the mean elution times.[Citation1] A second key information is related to process kinetics. This field is more complex because numerous different mechanisms can contribute and decide about the widths and shapes of the elution profiles.
Various mathematical models have been considered in the literature for simulating liquid chromatographic processes including kinetic effects. The models applied differ in the levels of complexities considered. The models which are most frequently used by liquid chromatographic community include the equilibrium dispersive model (EDM), the lumped kinetic model (LKM), and the general rate model (GRM).[Citation1–3] The GRM is considered as the most complete model. It takes into account the axial dispersion and all mass-transfer kinetics like external mass transfer of adsorbate from the bulk phase to the external surface of the adsorbent, diffusion transport through the pores of the adsorbent, and finite rates of the adsorption-desorption kinetics at the active sites.[Citation1, Citation2]
The LKM can be extracted from the GRM by assuming that particles are homogeneous and the partial differential equation describing intra particular mass transport across the particle radii is modified accordingly. The intraparticle mobile and stationary phase concentrations are replaced by average concentrations, and the intra particle diffusion term is replaced with a kinetic expression. The kinetic expression describes mass transfer in the bulk liquid phase and intraparticle mobile phase via an overall mass transfer coefficient which is related to the external and internal mass transfer coefficients. The EDM is the simplest model that takes axial dispersion and mass transfer kinetics into account. In the EDM, the mobile and stationary phases are assumed constantly in equilibrium, i.e. mass transfer kinetic and the kinetics of adsorption and desorption are very fast. The contribution of these kinetics are lumped together in an apparent dispersion coefficient which is related to the axial dispersion and mass transfer kinetics.
The fact that finite rates of adsorption and desorption steps at the active sites of the stationary phases can be rate limiting is only captured in the GRM model. The general possibility of this kinetic mechanism was first discussed by Giddings[Citation4] on the basis of stochastic theory. It was discussed that Gaussian-type elution peaks form when the exchange of solute molecules between the mobile and stationary phases is very fast. In contrast, if adsorption and desorption rates of solute molecules are slow, a significant portion of the injected solute molecules eluted without being captured by these sites and causing the formation of tails. Later on only a few other researchers have investigated this effect,[Citation1, Citation5, Citation6] which is typically ignored.
In recent years chromatographic column are frequently packed with core beads (also known as core-shell particles) instead of using fully porous particles.[Citation7–9] Due to the application of thin porous layers coated on solid impenetrable cores, there are shorter intraparticle diffusion pathways causing the elution of narrower peaks.[Citation8–12] Numerous theoretical studies are available describing analytical chromatography using core-shell particles.
Kaczmarski and Guiochon have used a lumped particle model to simulate chromatographic columns packed with core-shell particles of thin porous layers and have assumed a single averaged value of the concentration inside the porous layer.[Citation13] A general rate model (GRM) of fully porous particles was used to analyze the performance of thin-layered core-shell particles. A study on inert core size optimization for linear chromatography has been done by Li et al.[Citation14] A nonlinear quasi-stationary GRM for core-shell particles has been numerically investigated by Gu et al.[Citation15] Core-shell particles have also been used for chiral.[Citation16] Lambert et al. have analyzed the mass transfer properties of insulin by considering both core-shell and fully-porous particles as packing materials.[Citation17] Monolithic and fused core HPLC columns were compared for fast chromatographic analysis of fat-soluble vitamins.[Citation18] Ibrahim et al. have compared core-shell and totally porous particle stationary phases for fast and green LC determination of five hepatitis-C antiviral drugs.[Citation19] Theoretical aspects and technical properties of the columns packed with core-shell particles are described deeply in serval reviews.[Citation20–23]
In our recent article, we have numerically investigated elution profiles using core-shell particles under overloaded nonlinear conditions using a reduced GRM considering infinitely fast rates of adsorption and desorption, i.e. permanently established adsorption equilibria.[Citation24] The current article extends now these theoretical investigations to a GRM explicitly considering slow adsorption-desorption rates. The model equations incorporate core-shell adsorbents of variable layer thicknesses as packing materials. For such a nonlinear model, no analytical solutions can be derived and numerical solution techniques are required for predicting dynamics inside the chromatographic column. In this article, a semi-discrete flux-limiting high resolution finite volume scheme (HR-FVS) is extended and applied to solve the current model equations.[Citation24, Citation25] A second order nonlinearly stable explicit Runge-Kutta method is applied to solve the resulting system of ordinary differential equations (ODEs). To demonstrate the effect of selected parameters, results of a number of case studies are presented. In particular, consequence of limited rates of adsorption-desorption processes are illustrated.
The structure of this article is as follows. The considered nonlinear GRM for core-breads including finite adsorption and desorption rates is described in Section 2. The suggested numerical scheme is ntroduced in Section 3. Quantitative criteria suitable to evaluate the performance of nonlinear preparative chromatography are presented in Section 4. Results of numerical case studies are given in Section 5. Lastly, conclusions are drawn in Section 6.
Mathematical model
The GRM of liquid chromatography is regarded as the most comprehensive and accurate model. The mass balance of GRM consist of two sets of coupled equations for the mobile phase, one is for the bulk-fluid that travels within the column bed carrying the components (where the concentrations of sample components are assumed as function of time and axial-coordinate of the column) and the other one is for the liquid stored inside the porous particles (where the solute concentrations are functions of time, axial-coordinate and particle radii). An adiabatic and isothermal adsorption column packed with inert core particles is considered. Each core-shell particle has three storage regions, i.e. the inert core (impermeable), the pores, and the inner surface. At time zero, a step change in the concentration of an adsorbate is introduced into a flowing stream. The adsorption column is subjected to axial dispersion, pore diffusion, external mass transfer resistance, surface diffusion and finite rates of adsorption-desorption kinetics. It is assumed that solid concentration changes due to mass transport in the pores only. It is further assumed that cored beads have uniform particle size Rp and core size . The inert core cannot be penetrated and there is only diffusion (no convection) in the porous shell.
The mass balances for the bulk-phase are expressed as [Citation1, Citation2](1)
(1)
Here, , r denote the time, axial and particle radii coordinates, respectively. For each ith-component of the sample,
represents the solute concentration in the bulk phase, u is interstitial velocity,
denotes the axial dispersion,
is the phase ratio with bulk porosity ϵb,
is the effective external mass transfer coefficient,
is the solute concentration in the particle pores, and Nc is the number of components in the mixture.
The model equation representing the change of solute concentration in the particle pores is given as[Citation1, Citation2](2)
(2) where
is the solid-phase concentration,
is the pore diffusivity, and ϵp is the internal porosity. In the current study, in contrast to previous study,[Citation24] the rates of nonlinear adsorption-desorption kinetics are assumed finite. The ordinary differential equation below describes the amount of ith component which is adsorbed on the stationary phase:[Citation1, Citation2]
(3)
(3)
Here, qm denotes the adsorption saturation capacity which is assumed same for for all components and and
represent the adsorption and desorption rates constants for ith component of the mixture. Adsorption and desorption are important interface mass-transfer processes. The description of such processes need information on the equilibrium achieved between phases and the rate on which equilibrium is approached. In any case these processes may be affected by physicochemical properties of the solid and liquid phases. Study of such kinetics of the adsorbent is useful as they provide information about its efficiency and mechanisms of adsorption. EquationEquation (3)
(3)
(3) is a simplified adsorption-desorption kinetic expression. In most of the studies, it is assumed that a permanent adsorption equilibrium is established, i.e. adsorption-desorption rates are sufficiently high.[Citation1, Citation24] Then, the left-hand side of EquationEquation (3)
(3)
(3) can be set equal to zero which reduces EquationEquation (3)
(3)
(3) to the common multi-component Langmuir isotherm if the saturation capacities are the same for all the components, i.e.[Citation1, Citation2]
(4)
(4)
Here, bi quantifies the extent of nonlinearity coefficient. In this limiting case, the current GRM reduces to the one presented in previous article [Citation24].
For simplification of expressions, the following non-dimensional quantities are considered for a column of length L containing particles of radii Rp:(5a)
(5a)
(5b)
(5b) where τ,
and
are the dimensionless time, space and particle radii coordinates, respectively. Further,
is the dimensionless adsorption rate constant which of key interest in this paper,
is the Pectlet number based on column length,
represents modified Biot number, and
describes the ratio of space time and intraparticle diffusion time.
By introducing the dimensionless variables of EquationEquations (5a)(5a)
(5a) and Equation(5b)
(5b)
(5b) in the model EquationEquations (1)–(3), we obtain
(6)
(6)
(7)
(7)
(8)
(8)
Considering a regenerated column, the EquationEquations (6)–(8) are subjected to the following initial and boundary conditions (BCs)(9a)
(9a)
(9b)
(9b)
(9c)
(9c)
Here, represents the injected concentration of the ith-component of the sample.
For fully-porous particles, the range of ρ is from 0 to 1, while for cored particles its range is from to 1. Thus, for fully-porous beads
, while
for cored beads.
Numerical scheme
Numerous schemes are available in the literature for the approximation of chromatographic models.[Citation1, Citation2, Citation25] In this article, a semi-discrete high resolution finite volume scheme (HR-FVS) is applied to approximate the current GRM incorporating core-shell particles and finite rates of adsorption-desorption kinetics.[Citation24, Citation25] A second-order TVD-RK method is used for solving the resulting ODEs system.[Citation25] A complete derivation of the proposed numerical scheme is presented in Appendix A of this article.
Critical performance criteria
Optimization of preparative chromatography requires suitable performance criteria. Here, we propose a performance criteria by which the quality of a product can be enhanced.[Citation24, Citation26, Citation27] Consider a mixture of two components (Nc = 2) in which component 1 is less retained as compared to the component 2, i.e. .
Assume that τ1 is the dimensionless time during which the fraction of first component exceeds certain threshold, i.e. , where we take
. Further, let τ2 be the time duration during which fraction of component 2 drops below certain specified threshold, i.e.
.
The common performance attributes used in this work are cycle time, purity, productivity and yield. Here, cycle time, productivity and yield are used as performance functions, while purity is used as a constraint.
Cycle time
The cycle time is defined as the time lapse between two successive injections:
(10)
(10)
Purity
The time during which fractionation of component 1 stops is referred to as cut time. The following express is used in our calculations to find the cut time of component 1:
(11)
(11)
The required purity, which is based on the peak area, was set equal to 99%.
Productivity
A reduced-productivity is the desired amount of a compound produced per time-cycle. In the case of component 1, it can be expressed as
(12)
(12)
One can multiply volumetric flow rate with this to transform it to a dimensional form.
Yield
Yield of a desired component describes the ratio of amount in purified form and amount injected at the column inlet. In the case of component 1, it can be expressed as(13)
(13)
Numerical case studies
A few numerical case studies of single-component (Nc = 1) and two-component (Nc = 2) mixtures are carried to analyze the effects of adsorption rate , core-radius fraction
, axial dispersion
, external diffusion (Bip) and internal diffusion (ηp) on the elution profiles. All parameters of numerical test problem are listed in . Their values are chosen from the ranges of parameters typically used in high pressure liquid chromatography applications.
Table 1. Standard model parameters used in the numerical solutions.
Single-component elution profiles
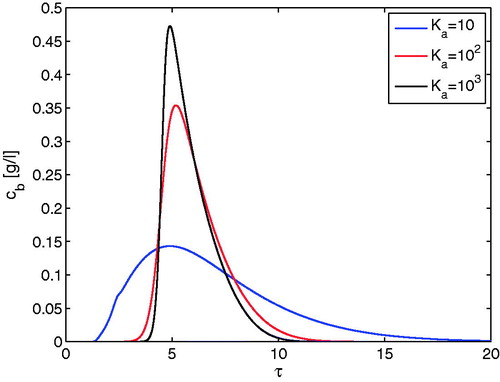
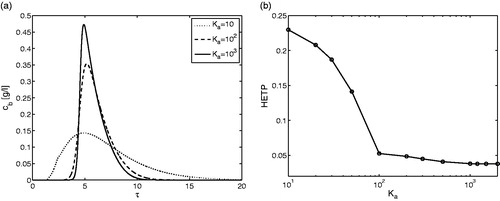
shows the effect of the dimensionless adsorption rate constant Ka on the outlet concentration profiles for a fixed core radius fraction of 0.8. For illustration, at first the elution of just one component is considered. The three kinetic effects related to axial dispersion (Peb), external diffusion (Bip) and internal diffusion (ηp) are fixed according to typical values given in . It can be observed that a relative slow rate of adsorption corresponding to Ka = 10 causes an additional band broadening. As the value of ka increases, the concentration profile becomes sharper and less broadened. For the effect becomes negligible and the GRM predictions converge into the results of a simplified GRM considering just the aforementioned three limiting effects. This limiting dimensionless rate constant corresponds to the rate constant for the desorption step of
. This magnitude confirms the general belief that the intrinsic step of settling down and escaping of molecules on active surfaces is taking place very rapidly. Unfortunately, there are no reliable estimates for these rate constants in the literature. The border values for the related rate constants identified here by numerical simulation indicate that a detailed modelling of the adsorption and desorption steps is frequently indeed not required. However, the mathematical model applied here provides a quantitative tool to identify this border, which will shift for other constellations of Peb, Bip and ηp. In we have also demonstrated the effect of Ka on the conventionally used HETP-curve indicating the remaining band broadening effect due to the other three effects when Kais sufficiently large.[Citation1]
Figure 1. Single-component elution. Effect of dimensionless adsorption rate constant Ka on the outlet concentration profiles for . Here, the dimensionless HETP is obtained by taking ratio of the second central moment and square of the first moment. All other parameters are given in .
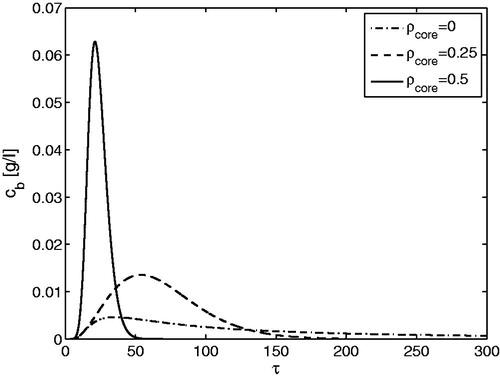
displays again for a single solute the effect of core-radius fraction on the elution curves. On increasing the value of
from 0.0 to 0.5, the retention times decrease, whereas the peaks become sharper. These two trends continue for larger values of
. The results are given for Ka = 100, thus containing still an impact of the limited rates of adsorption and desorption. For all core radius fractions, a further increase in the value of Ka will lead to converging results and to the possibility to simplify the GRM. Now, the border values for Ka will also depend on
.
Figure 2. Single-component elution. Effect of on the outlet concentration profiles for
. All other parameters are given in .
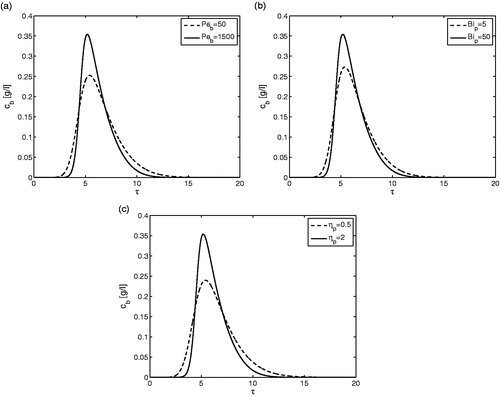
shows another time for single component elution and the effects of the three other dimensionless kinetic parameters on the outlet concentration profiles for a fixed value of Ka = 100. As the value of Peb increases (here from 50 to 1500), and keeping Bip and ηp at their reference values, the known effect is illustrated that peak broadening decreases (). Similarly, depicts, as also can be expected, that as Bip increases from 5 to 50 the band broadening of elution profile reduces. Finally, a similar well-known trend is exemplified in , where the internal diffusion parameters captured by ηp is increased from 0.5 to 2. Smaller or larger values of Ka would alter the magnitude of these trends.
Figure 3. Single-component elution, plot (a) shows the effect of Peb, plot (b) shows the effect of Bip and plot (c) shows the effect of ηp for fixed and
. All other parameters are given in .
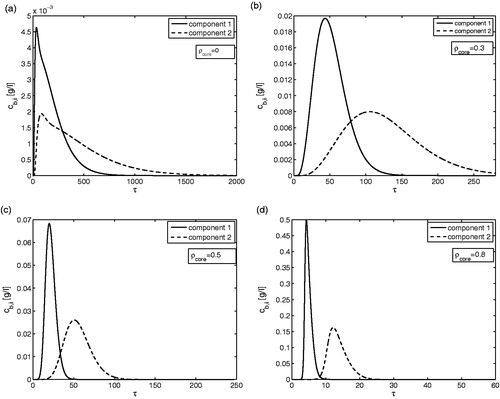
Two-component elution profile
shows the predicted elution profiles of two-components present in a binary mixture for four different values of . The already discussed effects of
on the retention times and band widths of the elution profiles are obvious, now for both components. The results are still influenced by the finite rates of the adsorption and desorption steps because of the chosen values for
for the two components (i.e. 100 and 250). For the case considered, the fully porous particles are not able to separate the two-components (). (
) depicts an already better resolution, which further impoves for
in . At
() the two components are almost base-line separated. The results shown in are further evaluated in terms of the performance criteria introduced.
Figure 4. Two-component elution. Effect of on the outlet concentration profiles for fixed values of
and
. All other parameters are given in .
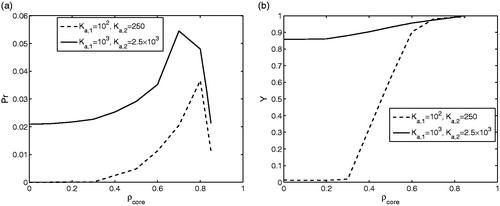
presents the predicted productivities Pr (EquationEquation (12)(12)
(12) , ) and yields Y (EquationEquation (13)
(13)
(13) , ) as functions of
. To determine these criteria the cycle and cut times had to be calculated specifiying the purity requirements. The figure shows the results over
for two sets of Ka, differing by a factor of 10. The larger values correspond to negligible limitations by finite adsorption and desorption rates. This case is obviously the best and leads to the highest performance. An interesting results is the fact that for smaller rate constants of these steps a shift to larger values of
is advisable. It should be mentioned that the results descriebd are valid for given nonlinearity parameters bi and injection concentration
. Changing these parameters will of course change the shape of the elution profiles and the proportions of the contributions of different kinetic effects, which is seen as outside the scope of this paper.
Figure 5. Two-component elution. Plots of productivity and yield Y as functions of
. All other parameters are given in .
Conclusion
A nonlinear General rate Model (GRM) for fixed-beds packed with core-bead particles was investigated numerically. The model considered explicitly finite rates of the adsorption and desorption steps at the active sites of the stationary phase. A high resolution finite volume scheme was extended to solve the nonlinear model equations incorporating core-shell particles. This tool allows quantifying the effect of limited rates of adsorption and desorption on the shape of elution profiles for both fully porous and core-shell particles and allows identifying minimal rates required to neglect this effect and to further simplify the model. The model developed and the solution strategy derived are seen useful for predicting optimal layer thicknesses for the core-shell particles.
References
- Guiochon, G.; Felinger, A.; Shirazi, D.G., Katti, A.M. Fundamentals of Preparative and Nonlinear Chromatography, 2nd ed; ELsevier Academic press: New York, 2006.
- Guiochon, G.; Lin, B. Modeling for Preparative Chromatography; Academic Press: New York, 2003.
- Ruthven, D.M. Principles of Adsorption and Adsorption Processes; Wiley-Interscience: New York, 1984.
- Giddings, J.C. Dynamics of Chromatogrpahy. Part I: Principles and theory; Marcel Dekker: New York, 1965.
- Gu, T.; Truei, Y.-H.; Tsai, G.-J.; Tsao, G.T. Modeling of Gradient Elution in Multicomponent Nonlinear chromatography. Chem. Eng. Sci. 1992, 47, 253–262.
- Ohkuma, T.; Hara, S. Tail-producing Slow Adsorption-desorption Process in Lquid-solid Chromatography. J. Chromatogr. 1987, 400, 47–63.
- Horvath, C.G.; Preiss, B.A.; Lipsky, S.R. Fast Liquid Chromatography: An Investigation of Operating Parameters and these Paration of Nucleotides on Pellicular Ion Exchangers. Anal. Chem. 1967, 39, 1422–1428.
- Kirkland, J.J. Controlled Surface Porosity Supports for High Speed Gas and Liquid Chromatography. Anal. Chem. 1969, 41, 218–220.
- Kirkland, J.J.; Truszkowski, F.A.; Dilks, C.H.; Engel, G.S. Superficially Porous Silica Microspheres for Fas Thigh-performance Liquid Chromatography of Macromolecules. J. Chromatogr. A 2000, 890, 3–13.
- Fanigliulo, A.; Cabooter, D.; Bellazzi, G.; Tramarin, D.; Allieri, B., Rottigni, A.; Desmet, G. Comparison of Performance of High Performance Liquid Chromatography Columns Packed With Superficially and Fully Porous 2.5 mm Particles Using Kinetic Plots. J. Sep. Sci. 2010, 33, 3655–3665.
- Pietrogrande, M.C.; Dondi, F.; Ciogli, A.; Gasparrini, F.; Piccin, A.; Serafini, M. Characterization of New Types of Stationary Phases for Fast and Ultra-fast Liquid Chromatography by Signal Processing Based on AutoCovariance Function: A Case Study of Application to Passiflora Incarnata L. Extract Separations. J. Chromatogr. A 2010, 1217, 4355–4364.
- Ali, I.; Al-Othman, Z.A.; Al-Záabi, M. Superficially Porous Particles Columns for Super Fast HPLC Separations. Biomed. Chromatogr. 2012, 26, 1001–1008.
- Kaczmarski, K.; Guiochon, G. Modeling of the Mass-transfer Kinetics in Chromatographic Columns Packed with Shell and Pellicular Particles. Anal. Chem. 2007, 79, 4648–4656.
- Li, P.; Yu, J.; Xiu, G.; Rodrigues, A.E. A Strategy for Tail or Eddesign of Efficient and Low-pressure Drop Packed Column Chromatography. AIChE J. 2010, 56, 3091–3098.
- Gu, T.; Liu, M.; Cheng, K.-S.C.; Ramaswamy, S.; Wang, C. A General Rate Model Approach for the Optimization of the Core Radius Fraction for Multicomponent Isocratic Elution in Preparative Nonlinear Liquid Chromatography Using Cored Beads. Chem. Eng. Sci. 2011, 66, 3531–3539.
- Lomsadze, K.; Jibuti, G.; Farkas, T.; Chankvetadze, B. Comparative High-performance Liquid Chromatography Enantioseparations on Polysaccharide Based Chiral Stationary Phases Prepared by Coating Totally Porous and Core-shell Silica Particles. J. Chromatogr. A. 2012, 1234, 50–55.
- Lambert, N.; Kiss, I.; Felinger, A. Significance and Estimation of Chromatographic Parameters. J. Chromatogr. A. 2014, 1366, 84–91.
- Kurdi, S.E.; Musuleq, D.A.; Alhazmi, H.A.; Bratty, M.A., Deeb, S.E. Comparing Monolithic and Fused Core HPLC Columns for Fast Chromatographic Analysis of Fat-soluble Vitamins. Acta Pharm. 2017, 67, 203–213.
- Ibrahim, A.E.; Hashem, H.; Elhenawee, M.; Saleh, H. Comparison Between Core-shell and Totally Porous Particle Stationary Phases for Fast and Green LC Determination of Five Hepatitis-C Antiviral Drugs. J. Sep. Sci. 2018, 41, 1734–1742.
- Gritti, F.; Cavazzini, A.; Marchetti, N.; Guiochon, G. Comparison Between the Efficiencies of Columns Packed with Fully and Partially Porous C18-bonded Silica Materials. J. Chromatogr. A. 2007, 1157, 289–303.
- Fekete, S.; Oláh, E.; Fekete, J. Fast Liquid Chromatography: The Domination of Core-shell and Very Fine Particles. J. Chromatogr. A 2012, 1228, 57–71.
- Hayes, R.; Ahmed, A.; Edge, T.; Zhang, H. Core-shell Particles: Preparation, Fundamentals and Applications in High Performance Liquid Chromatography. J. Chromatogr. A 2014, 1357, 36–52.
- González-Ruiz, V.; Olives, A.I.; Martín, M.A. Core-shell Particles Lead the Way to Renewing High-performance Liquid Chromatography. Trend Anal. Chem. 2015, 64, 17–28.
- Qamar, S.; Sattar, F.A.; Abbasi, J.N.; Seidel-Morgenstern, A. Numerical Simulation of Nonlinear Chromatography with Core-shell Particles Applying the General Rate Model. Chem. Eng. Sci. 2016, 147, 54–64.
- Javeed, S.; Qamar, S.; Seidel-Morgenstern, A.; Warnecke, G. Efficient and Accurate Numerical Simulation of Nonlinear Chromatographic Processes. J. Comput. Chem. Eng. 2011, 35, 2294–2305.
- Horváth, K.; Felinger, A. Influence of Particle Size and Shell Thickness of Core-shell Packing Materials on Optimum Experimental Conditions in Preparative Chromatography. J. Chromatogr. A 2015, 1407, 100–105.
- Debets, H.J.G.; Bajema, B.L.; Doornbos, D.A. A Critical Evlaution of Quality Criteria for the Optimization of Chromatogrpahic Multicomponent Separations. Andytica. Chimica. Acta 1983, 151, 131–141.
- Cockburn, B.; Shu., C.-W. TVB Runge-Kutta Local Projection Discontinuous Galerkin Finite Element Method For Conservation Laws II. General Framework. Math. Comput. 1989, 52, 411–435.
Appendix A: Numerical schemes
Here, a complete derivations of the proposed numerical scheme is presented. In the case of fully-porous particles, ρ ranges from 0 to 1, while for cored particles it ranges from to 1. Thus, ρ-axis can be replaced by a new variable
such that
(A-1)
(A-1)
Using this transformation, EquationEquations (6)–(9c) can be re-written in term of new variable γ as(A-2)
(A-2)
(A-3)
(A-3)
(A-4)
(A-4)
Similarly, the transformation in Equation (A-1) can be used to change variable ρ to γ in the initial and boundary conditions given by EquationEquations (9a)–(9c).
In compact form, the above system of dimensionless equations can be expressed as (A-2)-(A-4):(A-5)
(A-5)
(A-6)
(A-6)
(A-7)
(A-7) where
, and for
and
, we have
(A-8)
(A-8)
In order to apply the scheme, the first step is to discretize the computational domain. Let Nx and are the number of discretization points along the x and γ-coordinates. The computational domain is taken as
which is covered by cells
for
and
. The characteristic coordinates in the cell Ωlm are denoted by
. Here
(A-9)
(A-9) and for the uniform mesh
(A-10)
(A-10)
Then, for and
, the cell averaged values
and
at any time t are given as
(A-11)
(A-11)
(A-12)
(A-12)
By integrating EquationEquation (A-5) on interval Il and using EquationEquation (A-11), we obtain(A-13)
(A-13) where
and the differential terms can be approximated as
(A-14)
(A-14)
Integration of EquationEquation (A-6)(A-6)
(A-6) over the interval Ωlm gives
(A-15)
(A-15)
(A-16)
(A-16) where
(A-17)
(A-17)
Finally, integrating EquationEquation (A-7)(A-7)
(A-7) over interval Ωlm gives
(A-18)
(A-18)
Furthermore, concentrations approximation in EquationEquations (A-13) and Equation(A-15) is needed at the cells interfaces and
. Numerous ways are present for their approximation. We are presenting here the first and second order approximations. Due to the positivity of velocity u and
, the contractions vectors at the interfaces of cell, cb and cp, are approximated as follows.
First order approximation of cell interface concentrations
Here, the backward difference formula is applied for the approximation of concentrations at the cell interfaces:(A-19)
(A-19)
With the use of aforementioned approximations, a first order accurate numerical scheme is obtained in the axial coordinates.
Second order approximation of cell interface concentrations
Here, the cell interface concentrations are calculated as:(A-20)
(A-20)
(A-21)
(A-21) where
is used to avoid division by zero. The flux limiting functions ψ and
are given as [Citation25]
(A-22)
(A-22)
(A-23)
(A-23)
The scheme given by EquationEquations (A-20)-(A-23) can not be used at the boundary intervals. Therefore, backward approximations are applied on the boundary intervals. For computing fluxes at interior intervals, EquationEquations (A-20)-(A-23) are used. It is to be noted that this first order approximation at the boundary cells does not reduces the overall accuracy of this scheme.
To guarantee the same accuracy in time coordinate, a second order accurate TVD-RK method is applied for solving EquationEquations (A-20)-(A-23). Let us denote the right-hand side of EquationEquations (A-20) and Equation(A-21) by and
. A second order TVD-RK scheme updates cb and
through the following two stages [Citation28]
(A-24a)
(A-24a)
(A-24b)
(A-24b)
(A-24c)
(A-24c) where
and
represent solutions at previous time step, tn, and
,
and
are updated one calculated at the next time step
. Also,
is time step which is evaluated using the following CFL condition
(A-25)
(A-25)
The above-mentioned numerical algorithm was implemented in C programming language.