Abstract
Background
This paper aimed to explore the differences in subjective experiences of intoxication depending on drinking location and drink type. Methods: Data came from 32,194 respondents to The Global Drug Survey (GDS) 2015, an annual, cross-sectional, online survey. Respondents selected their usual drinking location (home alone: home with partner/family: house parties: pubs/bars or clubs) and usual drink (wine; beer/cider/lager; spirits or alcopops/coolers). They indicated how many drinks they required to reach three stages of intoxication (feeling the effects; an ideal stage of intoxication; and the tipping point) and how frequently they reached each stage. Results: Drink type affected grams of alcohol reported to reach the tipping point: 109 gm wine, 127 gm alcopops, 133 gm of beer, and 134 gm of spirts. Respondents who drank at home alone, or in clubs reached their tipping point more frequently compared to other locations. Conclusions: Where people drink, and the type of alcohol they drink, affected the amount of alcohol reported to reach different stages of intoxication. Understanding why different drinking locations, and drink types lead to a need for greater consumption to reach an ideal state of drunkenness, such as social cues from other people who drink, may enable people to reduce their drinking.
Introduction
Alcohol use is associated with benefits such as increased feelings of sociability and relaxation, and reductions in social anxiety (Bourgain et al., Citation2012; Peele & Brodsky, Citation2000). However, alcohol use can also cause harm to the individual, their family and friends, and wider society (GBD 2016 Alcohol Collaborators, Citation2018; Laslett et al., Citation2010, Citation2011; WHO, Citation2018). In order to reduce harms at the population level, governments around the world promote lower risk drinking guidelines suggesting an upper weekly or daily limit (see ), which in many countries differs for men and women (Furtwaengler & de Visser, Citation2013; Kalinowski & Humphreys, Citation2016).
Table 1. Descriptive demographic data and proportions of respondents from each country choosing each usual drinking location and usual drink type.
Previous research suggests that people who drink alcohol seek to manage their intake in order to strike a balance between achieving a pleasurable state of intoxication while avoiding consuming too much (Burgess et al., Citation2019). Reaching this sweet spot (Graber et al., Citation2016) but not exceeding their tipping point – where they become excessively intoxicated, feeling out of control or unwell (Burgess et al., Citation2019), can be challenging (Beccaria et al., Citation2015). For those trying to reduce alcohol related harms, a focus on this tipping point provides a potentially useful avenue for interventions.
In a previous study, data from the Global Drug Survey (GDS) were used to investigate the amount of alcohol typically needed to reach this tipping point as well as to explore some of the factors associated with reaching this state more frequently. The amount of alcohol that respondents said they would need to consume to reach their tipping point usually exceeded the weekly low risk drinking guidelines in most countries (Davies et al., Citation2020). Being male, younger in age and scoring higher on the Alcohol Use Disorders Identification Test (AUDIT) was associated with reaching the “tipping point” more frequently. This analysis however, did not explore the role of drinking location or beverage type. The authors noted this was a limitation given the evidence that location impacts consumption (Stanesby et al., Citation2019). For example in a UK study (Ally et al., Citation2016), drinking alone at home was associated with lower risk drinking, while consuming alcohol at home with a partner was considered an increased risk for drinking related harms. Drinking outside of the home with friends, as well as drinking in multiple locations was typically characterized by higher risk patterns of drinking (Ally et al., Citation2016).
Beverage type also affects how much alcohol is needed to reach the tipping point (Meier et al., Citation2018). While the active ingredient of ethanol remains the same, there are stark differences in the types of drinks chosen by different groups of people at different times (Makela et al., Citation2011) resulting in different harms (Room et al., Citation2011). Drinking spirits has, for example, been associated with increased feelings of aggression, compared to drinking wine (Ashton et al., Citation2017). Additionally, spirit consumption was a stronger predictor of male mortality than consumption of beer or wine in a large European study (Korotayev et al., Citation2018). Beer was associated with negative social and personal impacts in a cross-national (Room et al., Citation2011) as well as a study in Sweden (Ramstedt & Boman, Citation2011).
Aims
This paper aimed to explore the impact of drinking location and drink type on the 1) amount of alcohol needed and 2) frequency of reaching three stages of intoxication (feeling the effects of alcohol; becoming as drunk as you would like to be; and reaching the tipping point). We also explored the association between drink type and location, as well as how much alcohol was reportedly consumed in and outside of the home by country of residence. We expected that drinking outside of the home would be associated with higher alcohol consumption to reach each stage of intoxication, and that spirits and wine would be the drink types associated with reaching the “tipping point” more frequently due to their higher alcohol by volume.
Method
Design and procedure
Global Drug Survey (GDS) is an annual, anonymous cross-sectional web survey. An opportunistic sample of people who use or have used alcohol and/or other drugs was recruited via various partnerships with media, researchers and harm reduction organizations. A detailed breakdown of the recruitment and sampling strategy is available elsewhere (Barratt et al., Citation2017). GDS2015 took place between November 2014 to January 2015, collecting data in 11 languages (English, German, Greek, Polish, French, Italian, Spanish, Portuguese, Flemish, Hungarian and Danish). Ethical approval was obtained from the Kings College London Research Ethics Committee 11671/001: Global Drug Survey, the University of Queensland (No: 2017001452) and the University of New South Wales (HREC HC17769) Research Ethics Committees.
Participants
GDS2015 recruited 97,855 respondents from 174 countries. The present study used data from female and male respondents aged 16 to 80 years who consumed alcohol at least once in the past year, resided in countries with 200+ respondents, and answered questions about their usual drink type and location. People who identified as non-binary were not included in the current analysis because the numbers were too small for meaningful comparisons by gender, but will form the basis of another paper. The sample therefore included 32,194 respondents from 17 countries (see ).
Measures
Respondents were asked: “So first of all where have you done most of your drinking over the last 12 months?” Response options were: home on your own, home with partner/family, house parties, pubs or bars, clubs.
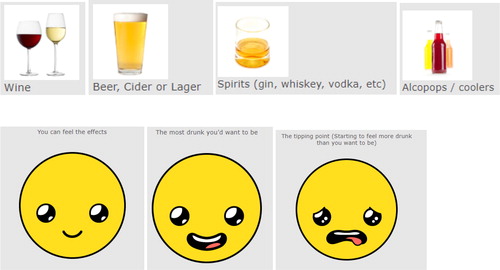
Four categories of drink type were presented as icons – see Appendix: wine; beer, cider or lager; spirits and alcopops/coolers (i.e. pre-mixed single container). Respondents were asked to select the drink type they consumed most often, and the size of their typical drink (sizes presented were: wine = small 125 ml, medium 175 ml, large 200 ml or other; beer/cider/lager = small 300 ml, medium 400 ml, large 500 ml or other; spirit = small 30 ml, large 60 ml or other; alcopops = small 350 ml, large 700 ml or other).
Following the icons, respondents were then presented with the following question:
“Imagine you were drinking just this type of drink and not using any other drugs. How many drinks would it take for you to reach the following stages of intoxication?”
The three stages were “you can feel the effects,” being “as drunk as you would like to be” and “the tipping point (starting to feel more drunk than you want to be).” Following that they were asked:
“Over the last 12 months, how often have you reached these stages of intoxication?”
Response options were “at least weekly,” “at least monthly,” “at least once a year,” “less than once a year” and “never.”
GDS2015 contained a range of demographic measures including gender, age, and country of residence. Alcohol consumption and harmful consequences of drinking were assessed using the 10 item Alcohol Use Disorders Identification Test (AUDIT; Babor et al., Citation2001). AUDIT responses generate a total score of 0–40 which is further categorized as lower risk of dependence (0–7), increasing risk (8–15), higher risk (16–19) and possible dependence (20+).
Analysis
We applied alcohol by volume (ABV) to each drink size using the following average estimates (IARD, Citation2019) for each product (wine = 12%, beer = 4.5%, spirits = 40% and alcopops = 5%). Then, we converted this volume into mass representing 10 grams of alcohol per 100 milliliters of the beverage. We used 10 grams as this is the World Health Organization (WHO) “standard drink” estimate and the modal global value (WHO, Citation2018). The categories “at least weekly” and “at least monthly” were combined into one category (often), and “at least once a year,” “less than once a year” and “never” into another category (rarely/never). We followed the WHO definition of excessive drinking, which is more than 60 gm of alcohol at least once in the last 30 days (WHO, Citation2018) which is associated with increased risk of acute consequences from alcohol. In particular, this is useful when looking at being “as drunk as you would like to be” and the “tipping point.”
Descriptive statistics were used to compare AUDIT scores, usual drinking locations and preferred drink type among respondents from different countries. For the further analysis presented in , the first two categories – home alone and home with partner/friends – were combined into one category named “home drinking” and house parties, pubs/bars and clubs were combined into another category named “out of the home.” Grams of alcohol were not normally distributed, however due to the large sample size, t-tests and ANOVAs were used to explore differences (Fagerland, Citation2012). Chi-squared tests were used to explore bivariate relationships between drinking location and type and the frequency of reaching each stage of intoxication. Correspondence analysis was used to explore the relationship between drink type and location. Finally, multi-level, random intercept logistic regression models were used to explore factors associated with reaching each stage of intoxication either weekly or monthly compared to yearly/less than yearly and never. These analyses involved clustering for country of residence, which was entered as a random factor to account for confounders relating to country that were not incorporated into the model such as drinking culture. We controlled for the effects of age, gender and AUDIT score which were entered as fixed factors alongside drinking location and type. Analyses were conducted in SPSS 26 (IBM).
Figure 1. Comparison of alcohol (in gm) needed to feel the effect and whether the preferred drinking location is within or outside of the home by country.
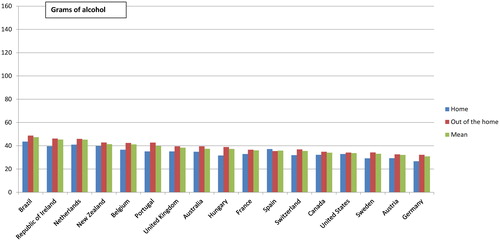
Figure 2. Comparison of alcohol (in gm) needed to reach the ideal level of intoxication and whether the preferred drinking location is within or outside of the home by country.
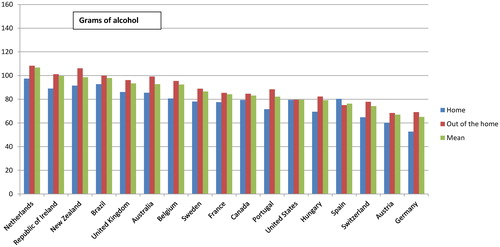
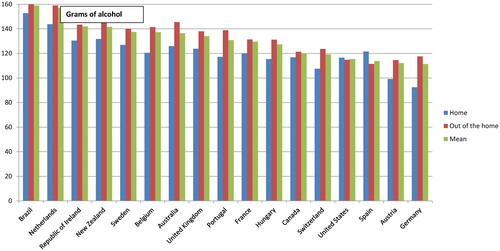
Figure 3. Comparison of alcohol (in gm) needed to reach the tipping point and whether the preferred drinking location is within or outside of the home by country.
Results
Of the 32,194 respondents, 31,891 completed both the drink type and location questions. displays descriptive statistics for drinking location and type in the sample. Across included countries, house parties were the most common drinking location. Overall, most respondents usually drank outside of their home (74.1%) but there was substantial variation across countries. For example, 54.6 percent of respondents from New Zealand usually drank at home compared to 14.1 percent of respondents from the Republic of Ireland. Across included countries, beer/cider/lager was the drink type most commonly reported. There was variation between countries, for example, 38.2% of respondents from Portugal preferred wine, compared to 5.6% from Brazil.
There was a significant association between drinking location and drink type χ2(12) = 3325.46, p<.001, V= .186. presents the biplot of drink type and location to illustrate this association. Wine was most commonly consumed at home. Beer/lager/cider was more likely to be consumed in pubs/bars than other locations. Spirits were more likely to be consumed at clubs and house parties. Alcopops were more likely to be consumed at clubs.Footnote1 Further exploratory tests showed that women were more likely to drink wine, spirits and alcopops than men and men were more likely to drink beer (χ2(3)= 4172.29, p<.001). There was also a significant association between gender and preferred location (χ2(4)=226.55, p<.001.) Men were more likely to drink at home alone, and house parties than women. Women more likely to drink at home with partner family than men, however there was no difference between men and women in terms of selecting pubs/bars and clubs.
Grams of alcohol at each stage of intoxication by drinking location and type
Models in show the predictors of consuming more grams of alcohol for each stage of intoxication. In all models, the effects of drink type and location were significant. Those who indicated that they did most of their drinking at home with their partner/family reported consuming fewer grams of alcohol at each stage of intoxication. To be as drunk as they would like to be, people who picked house parties (83.99 gm) and pubs (83.75 gm) consumed a similar amount but those who selected clubs reported consuming significantly more (87.50 gm). The tipping point showed a similar pattern– with house parties (131.41 gm) and pubs (128.32 gm) being similar and clubs (136.66 gm) with the highest number of grams. Those who selected wine as their preferred drink type reported consuming fewer grams of alcohol at each stage of intoxication. Spirts was the second lowest drink type. Respondents who chose alcopops reported the highest number of grams to reach each stage, followed by those who chose beer/lager/cider.
Table 2. Results of multi-level multivariable linear regression models with country included as a random effect exploring factors associated with a greater amount of alcohol in grams at each stage of intoxication.
compare respondents from different countries in terms of the grams of alcohol consumed by people who did most of their drinking at home (alone or with partner/family) or outside of the home (at house parties, pubs/bars and clubs). The pattern of people reporting more grams for each stage of intoxication outside of the home was similar. Respondents from Spain were the only group to report more grams at home, compared to outside of the home, for each level of intoxication. Respondents from Germany and Austria consistently reported consuming fewer grams at each stage of intoxication, but other countries, such as Sweden, move toward the right of the figure, indicating relatively more grams of alcohol as they get more intoxicated. Respondents from Brazil and Republic of Ireland consumed more to feel the effects. Respondents from the Netherlands and Republic of Ireland consumed most to reach their ideal level of intoxication and respondents from Brazil and the Netherlands consumed most to reach the tipping point.
Predictors of reaching each stage of intoxication at least monthly or weekly
Models in compare the likelihood of being in the “at least weekly” and “at least monthly” category compared to the “at least once a year,” “less than once a year” and “never” category. The rationale for comparing these two categories is that being in the monthly/weekly category represents higher risk single occasion drinking, which is associated with greater harms. Compared to those drinking at home alone, those who were drinking at home with partner or family were less likely to reach their ideal level of intoxication at least monthly. Compared to respondents who commonly drank wine, those picking alcopops or spirits were less likely to reach their ideal level of intoxication at least monthly. Compared to respondents who drank at home alone, those who drank in bars and clubs were more likely to reach their tipping point at least monthly, and those who were drinking at home with partner or family were less likely to reach their tipping point more frequently compared to those drinking at home alone.
Table 3. Results of multi-level multivariable logistic regression models with country included as a random effect.
Discussion
This paper explored the impact of drinking location and drink type on the 1) amount of alcohol needed and 2) frequency of reaching three stages of intoxication in a large sample of people who drink alcohol. Drinking location affected how much alcohol respondents consumed to reach different stages of intoxication; drinking outside of the home—at house parties, bars/pubs or clubs—was associated with higher amounts of alcohol to reach each stage of intoxication in comparison to amounts reported when drinking at home, either alone or with partner/family. Additionally, respondents who usually drink in clubs reported needing to consume significantly more than those who drink at house parties or bars/clubs to achieve both wanted/desired (as drunk as they would like to be) and unwanted/undesired (the tipping point) stages of intoxication. This finding was consistent across respondents from different counties. Reaching the tipping point was more common in respondents who drank most often in pubs/bars compared to home alone and was less common in respondents who drank with partner/family compared to home alone. Drink type also affected respondents perceptions of how much alcohol respondents needed to reach different stages of intoxication; beer/lager/cider drinkers consumed more alcohol to reach each stage of intoxication.
That the “as drunk as you would like to be” stage of intoxication required 80 gm of alcohol for people drinking outside of the home is a serious concern. This amount of alcohol exceeds the high risk daily drinking guidelines in most countries (Davies et al., Citation2020). In the UK, it represents more than two thirds of the low risk weekly allowance and will represent four fifths of the low risk drinking guidelines due for release by NHMRC in Australia in 2021(Australian Government, Citation2020). Similarly, results for the tipping point should give public health practitioners and policy makers food for thought; if, roughly 130gms of alcohol constitute the tipping point (i.e. 134 gm of alcopops, 133 gm of beer and 127 gm of spirits), then self-reported alcohol tolerance out-strips low risk guidelines. Messaging that adopts a harm reduction approach—seeking to reduce the number of drinking episodes where individuals’ reach their tipping point—may be a more feasible approach to reduce population-level consumption relative to low risk messages that do not match people’s consumption levels.
Drink type and location were associated, where wine for example, was more likely to be consumed at home, and spirts outside of the home in clubs and house parties. There were country differences observed in terms of grams of alcohol consumed both inside and outside of the home, in line with patterns of consumption observed in other studies (Labhart et al., Citation2017), and may be linked to socio-cultural differences in the use of alcohol (Gordon et al., Citation2012). Further studies are needed to examine this finding, as the size and volume of typical products consumed in different countries are likely to differ.
Regardless of the amount of alcohol consumed, the tipping point remains an important focus, given that this is where people are consuming more alcohol than they actually need to enjoy the effects of drinking. There was no significant effect of drink type on reaching the tipping point more frequently, suggesting that where drinking occurs is a more important consideration than the type of drink being consumed when developing harm reduction measures. There are many factors that may explain why drinking outside of the home is associated with higher amounts, such as being exposed to longer drinking sessions, more conversations that distract from the intoxication, more exposure when people are buying rounds, and more perceived positive effects in interaction with loud music and movement. It may also be that people’s perception of how drunk they are is influenced by the perceived intoxication of others, especially when in the presence of peers who drink a lot (Garnett et al., Citation2015; Moore et al., Citation2016).
Drinking alone at home is associated with greater alcohol consumption relative to drinking at home with partner/family, possibly because there are likely fewer cues to slow down or stop drinking, such as someone telling you to slow down or stop. Drinking alone at home is the only setting that lacks social cues to inform drinking (Clapp & Shillington, Citation2001; Moore et al., Citation2016). In addition, isolation may increase feelings of depression or boredom that can trigger excessive alcohol use which is now even more of concern during the COVID-19 pandemic.
Future studies are needed to ask people about where and with whom they usually drink, to attempt to disentangle the different contextual, environmental and social influences on consumption. Understanding the contextual, environmental and social cues associated with patterns of drinking in different locations would allow for the development of more nuanced interventions, while understanding that even within individuals, not all drinking behaviors are the same (Meier et al., Citation2018). There are different social practices and meanings associated with drinking in different places, which result in different patterns of consumption (Supski et al., Citation2017).
Limitations
A key strength of this study is that it drew on a large international sample. However, respondents were recruited opportunistically and, comprise a younger, more highly educated set of respondents than the general population. Conceptions of the “tipping point” and the number of drinks required to reach this stage of intoxication are likely to be different in older samples, and those recruited using other methods. Further, this study explored the consumption of one drink type only when, in reality, most young adults mix different drink types and some may even use other drugs concurrently (Miller et al., 2017). Evidence suggests that combining drink types may be more harmful than consuming just one drink type during a night out (Ramstedt & Boman, Citation2011) which should be considered in future research. Also, the current study failed to investigate drinking in multiple locations on one occasion, for example pre-loading at home, followed by drinking in licensed premises (Coomber et al., Citation2018) . This may result in reaching the tipping point more quickly, or more frequently, and varies by age, sex and country (Ferris et al., Citation2019; Labhart et al., Citation2017). In nightlife studies in European countries and Australia, for example, participants were breathalyzed, and asked questions about their planned alcohol intake over the remainder of their evening, and most participants engaged in pre-loading (Hughes et al., Citation2011).
Implications and conclusions
The findings of this large international survey suggest that when developing interventions to reduce excessive alcohol consumption drinking location should always be considered. In our study, people who usually drank alone at home or in clubs reached their tipping point more frequently. These two groups are likely to require different interventions to encourage them to reduce their drinking. People drinking at home alone may find it acceptable to use online tools to monitor their consumption, as well as to access tailored support and advice (Davies et al., Citation2019). The lack of social context may make this group particularly vulnerable for developing problematic consumption patterns and early detection of such behavior is tricky. People drinking in clubs could be encouraged to drink less by considering potential risks for physical and mental health or socially embarrassing behaviors that they may regret later (Davies et al., Citation2017). Overall, our findings suggest that prevention measures that focus on supporting people to reduce instances of reaching the “tipping point” could help reduce harm.
Declaration of interest
The authors declare that they have no conflict of interest. The authors alone are responsible for the content and writing of the article.
Supplemental Material
Download MS Word (42 KB)Notes
1 “The small number of respondents who indicated they usually consumed alcopops (2.3% of the total sample) means caution should be taken when generalising this result.
References
- Ally, A. K., Lovatt, M., Meier, P. S., Brennan, A., & Holmes, J. (2016). Developing a social practice-based typology of British drinking culture in 2009-2011: Implications for alcohol policy analysis. Addiction (Abingdon, England), 111(9), 1568–1579. https://doi.org/https://doi.org/10.1111/add.13397
- Ashton, K., Bellis, M. A., Davies, A. R., Hughes, K., & Winstock, A. R. (2017). Do emotions related to alcohol consumption differ by alcohol type? An international cross-sectional survey of emotions associated with alcohol consumption and influence on drink choice in different settings. BMJ Open, 7(10), e016089. http://bmjopen.bmj.com/content/7/10/e016089.abstracthttps://doi.org/https://doi.org/10.1136/bmjopen-2017-016089
- Australian Government. (2020). Draft Australian guidelines to reduce health risks from drinking alcohol. https://www.nhmrc.gov.au/health-advice/alcohol#
- Babor, T., Higgins-Biddle, J. C., Saunders, J. B., & Monteiro, M. G. (2001). The alcohol use disorders identification test, guidelines for use in primary care. Geneva, World Health Organization.
- Barratt, M. J., Ferris, J. A., Zahnow, R., Palamar, J. J., Maier, L. J., & Winstock, A. R. (2017). Moving on from representativeness: Testing the utility of the Global Drug Survey. Substance Abuse: Research and Treatment, 11. https://doi.org/https://doi.org/10.1177/1178221817716391
- Beccaria, F., Petrilli, E., & Rolando, S. (2015). Binge drinking vs. drunkenness. The questionable threshold of excess for young Italians. Journal of Youth Studies, 18(7), 823–838. https://doi.org/https://doi.org/10.1080/13676261.2014.992321
- Bourgain, C., Falissard, B., Blecha, L., Benyamina, A., Karila, L., & Reynaud, M. (2012). A damage/benefit evaluation of addictive product use. Addiction (Abingdon, England), 107(2), 441–450. https://doi.org/https://doi.org/10.1111/j.1360-0443.2011.03675.x
- Burgess, M., Cooke, R., & Davies, E. L. (2019). My own personal hell: Approaching and exceeding thresholds of too much alcohol. Psychology & Health, 34(12), 1451–1469. https://doi.org/https://doi.org/10.1080/08870446.2019.1616087
- Clapp, J. D., & Shillington, A. M. (2001). Environmental predictors of heavy episodic drinking. The American Journal of Drug and Alcohol Abuse, 27(2), 301–313. https://doi.org/https://doi.org/10.1081/ADA-100103711
- Coomber, K., Zahnow, R., Ferris, J., Droste, N., Mayshak, R., Curtis, A., Kypri, K., de Andrade, D., Grant, K., Chikritzhs, T., Room, R., Jiang, H., Taylor, N., Najman, J., & Miller, P. (2018). Short-term changes in nightlife attendance and patron intoxication following alcohol restrictions in Queensland, Australia. BMC Public Health, 18(1), 1185. https://doi.org/https://doi.org/10.1186/s12889-018-6098-x
- Davies, E. L., Conroy, D., Winstock, A. R., & Ferris, J. A. (2017). Motivations for reducing alcohol consumption: An international survey exploring experiences that may lead to a change in drinking habits. Addictive Behaviors, 75, 40–46. https://doi.org/https://doi.org/10.1016/j.addbeh.2017.06.019
- Davies, E. L., Cooke, R., Maier, L. J., Winstock, A. R., & Ferris, J. A. (2020). Drinking to excess and the tipping point: An international study of alcohol intoxication in 61,000 people. International Journal of Drug Policy, 83, 102867. https://doi.org/https://doi.org/10.1016/j.drugpo.2020.102867
- Davies, E. L., Maier, L. J., Winstock, A. R., & Ferris, J. A. (2019). Intention to reduce drinking alcohol and preferred sources of support for help: An international cross sectional study. Journal of Substance Abuse Treatment, 99, 80–87. https://doi.org/https://doi.org/10.1016/j.jsat.2019.01.011
- Fagerland, M. W. (2012). t-Tests, non-parametric tests, and large studies–A paradox of statistical practice?BMC Medical Research Methodology, 12(1), 78. https://doi.org/https://doi.org/10.1186/1471-2288-12-78
- Ferris, J. A., Puljević, C., Labhart, F., Winstock, A., & Kuntsche, E. (2019). The role of sex and age on pre-drinking: An exploratory international comparison of 27 countries. Alcohol and Alcoholism (Oxford, Oxfordshire), 54(4), 378–385. https://doi.org/https://doi.org/10.1093/alcalc/agz040
- Furtwaengler, N. A. F. F., & de Visser, R. O. (2013). Lack of international consensus in low-risk drinking guidelines. Drug and Alcohol Review, 32(1), 11–18. https://doi.org/https://doi.org/10.1111/j.1465-3362.2012.00475.x
- Garnett, C., Crane, D., West, R., Michie, S., Brown, J., & Winstock, A. (2015). Normative misperceptions about alcohol use in the general population of drinkers: A cross-sectional survey. Addictive Behaviors, 42, 203–206. https://doi.org/https://doi.org/10.1016/j.addbeh.2014.11.010
- GBD 2016 Alcohol Collaborators. (2018). Alcohol use and burden for 195 countries and territories, 1990- 2016: A systematic analysis for the Global Burden of Disease Study 2016. The Lancet, 392(10152), 1015–1035. https://doi.org/https://doi.org/10.1016/S0140-6736(18)31310-2
- Gordon, R., Heim, D., & MacAskill, S. (2012). Rethinking drinking cultures: A review of drinking cultures and a reconstructed dimensional approach [Review]. Public Health, 126(1), 3–11. https://doi.org/https://doi.org/10.1016/j.puhe.2011.09.014
- Graber, R., de Visser, R. O., Abraham, C., Memon, A., Hart, A., & Hunt, K. (2016). Staying in the ‘sweet spot’: A resilience-based analysis of the lived experience of low-risk drinking and abstention among British youth. Psychology & Health, 31(1), 79–99. https://doi.org/https://doi.org/10.1080/08870446.2015.1070852
- Hughes, K., Quigg, Z., Bellis, M. A., van Hasselt, N., Calafat, A., Kosir, M., Juan, M., Duch, M., & Voorham, L. (2011). Drinking behaviours and blood alcohol concentration in four European drinking environments: A cross-sectional study. BMC Public Health, 11(1) 918. https://doi.org/https://doi.org/10.1186/1471-2458-11-918
- IARD. (2019). Drinking guidelines: General population. http://www.iard.org/resources/drinking-guidelines-general-population/
- Kalinowski, A., & Humphreys, K. (2016). Governmental standard drink definitions and low-risk alcohol consumption guidelines in 37 countries. Addiction (Abingdon, England), 111(7), 1293–1298. https://doi.org/https://doi.org/10.1111/add.13341
- Korotayev, A., Khaltourina, D., Meshcherina, K., & Zamiatnina, E. (2018). Distilled spirits overconsumption as the most important factor of excessive adult male mortality in Europe. Alcohol and Alcoholism (Oxford, Oxfordshire), 53(6), 742–752. https://doi.org/https://doi.org/10.1093/alcalc/agy054
- Labhart, F., Ferris, J. A., Winstock, A., & Kuntsche, E. (2017). The country-level effects of drinking, heavy drinking and drink prices on pre-drinking: An international comparison of 25 countries. Drug and Alcohol Review, 36(6), 742–750. https://doi.org/https://doi.org/10.1111/dar.12525
- Laslett, A. M., Catalano, P., Chikritzhs, T., Dale, C., Doran, C., Ferris, J. A., Jainullabudeen, T., Livingston, M., & Matthews, S. (2010). The range and magnitude of alcohol’s harm to others. A. E. a. R. Foundation. http://www.fare.org.au/wp-content/uploads/research/The-Range-and-Magnitude-of-Alcohols-Harm-toOthers.pdf
- Laslett, A. M., Room, R., Ferris, J. A., Wilkinson, C., Livingston, M., & Mugavin, J. (2011). Surveying the range and magnitude of alcohol’s harm to others in Australia. Addiction (Abingdon, England), 106(9), 1603–1611. https://doi.org/https://doi.org/10.1111/j.1360-0443.2011.03445.x
- Makela, P., Hellman, M., Kerr, W., & Room, R. (2011). A bottle of beer, a glass of wine or a shot of whiskey? Can the rate of alcohol-induced harm be affected by altering the population’s beverage choices?Contemporary Drug Problems, 38(4), 599–619. https://doi.org/https://doi.org/10.1177/009145091103800408
- Meier, P. S., Warde, A., & Holmes, J. (2018). All drinking is not equal: How a social practice theory lens could enhance public health research on alcohol and other health behaviours. Addiction (Abingdon, England), 113(2), 206–213. https://doi.org/https://doi.org/10.1111/add.13895
- Miller, P. G., Ferris, J., Coomber, K., Zahnow, R., Carah, N., Jiang, H., Kypri, K., Chikritzhs, T., Clough, A., Livingston, M., de Andrade, D., Room, R., Callinan, S., Curtis, A., Mayshak, R., Droste, N., Lloyd, B., Matthews, S., Taylor, N., … Najman, J. (2017). Queensland alcohol-related violence and night time economy monitoring project (QUANTEM): A study protocol. BMC Public Health, 17(1), 789. https://doi.org/https://doi.org/10.1186/s12889-017-4811-9
- Moore, S. C., Wood, A. M., Moore, L., Shepherd, J., Murphy, S., & Brown, G. D. A. (2016). A rank based social norms model of how people judge their levels of drunkenness whilst intoxicated. BMC Public Health, 16(1), 798–798. https://doi.org/https://doi.org/10.1186/s12889-016-3469-z
- Peele, S., & Brodsky, A. (2000). Exploring psychological benefits associated with moderate alcohol use: A necessary corrective to assessments of drinking outcomes?Drug and Alcohol Dependence, 60(3), 221–247. https://doi.org/https://doi.org/10.1016/S0376-8716(00)00112-5
- Ramstedt, M., & Boman, U. (2011). Is spirits really the most harmful alcoholic beverage? Evidence from a recent alcohol survey in Sweden. Contemporary Drug Problems, 38(4), 579–597. https://doi.org/https://doi.org/10.1177/009145091103800407
- Room, R., Ferris, J., Bond, J., Greenfield, T. K., & Graham, K. (2011). Differences in trouble per litre of different alcoholic beverages – A global comparison with the GENACIS dataset. Contemporary Drug Problems, 38(4), 493–516. https://doi.org/https://doi.org/10.1177/009145091103800403
- Stanesby, O., Labhart, F., Dietze, P., Wright, C. J. C., & Kuntsche, E. (2019). The contexts of heavy drinking: A systematic review of the combinations of context-related factors associated with heavy drinking occasions. PLoS One, 14(7), e0218465. https://doi.org/https://doi.org/10.1371/journal.pone.0218465
- Supski, S., Lindsay, J., & Tanner, C. (2017). University students’ drinking as a social practice and the challenge for public health. Critical Public Health, 27(2), 228–237. https://doi.org/https://doi.org/10.1080/09581596.2016.1190001
- WHO. (2018). Global status report on alcohol and health (Vol. 2018) Geneva, World Health Organization..
Appendix:
Screen shots from GDS2015 used in the questions