
Abstract
Background: Both alcohol consumption and mental well-being problems have been found to be prevalent in higher educated students and often have severe consequences. However, previous findings of the association between these constructs are mixed, possibly because often linear models are fitted, while some theories suggest a curvilinear association between the two concepts. Objectives: To clarify previously mixed findings, the current study compared curvilinear and linear models for the relationship between alcohol consumption and mental well-being in university students. Because of potential gender differences in this relationship, these models were explored for females and males separately. Data from the first cross-sectional online survey wave of the Healthy Student Life project including 2,631 female and 998 male students was used. The Alcohol Use Disorders Identification Test-consumption was used to measure alcohol consumption. Mental well-being was assessed by six sub-concepts (i.e., depressive symptoms, anxiety, stress, life satisfaction, happiness, and self-rated mental health). Results: For females both linear (for anxiety, life satisfaction, and self-rated mental health) and curvilinear (for depression, stress, and happiness) associations were found, while for males no support for either curvilinear or linear models was found. Conclusions: Results should be interpreted with caution due to the small effect sizes in the relationships for females but may suggest that testing the curvilinear association between alcohol consumption and mental well-being is an important future endeavor.
Introduction
Drinking alcohol plays a major role in Western student culture (Piacentini et al., Citation2012), which is reflected in a relatively high prevalence of alcohol consumption among students in higher education. Weekly binge drinking was common for 27.8% of Dutch university students (van Hooijdonk et al., Citation2022). During the first COVID-19 lockdown, this percentage dropped to 13.9%. Furthermore, 85% of students indicated drinking in the past year, and 10.6% were classified as excessive drinkers [>14 (females) and >21 (males) glasses per week; Dopmeijer et al., Citation2021]. These high prevalences are in line with other Western countries (Gill, Citation2002; Karam et al., Citation2007). Excessive alcohol consumption has been associated with negative academic outcomes such as lower academic performance (GPA) and reduced student engagement (Porter & Pryor, Citation2007), but also has consequences beyond academics, for example, increased risk for violence, alcohol-related traffic fatalities, unsafe sexual behavior, health problems (White & Hingson, Citation2013), and experiencing alcohol-related problems later in adulthood (Jennison, Citation2004).
Next to this, the mental well-being of students has been a growing concern (Sharp & Theiler, Citation2018), and even more so during the COVID-19 pandemic (Li et al., Citation2021). Auerbach et al. (Citation2018) found that approximately one-third of their international student sample could be classified as having a mental disorder in the past 12 months. Student life is characterized by high (academic) stressors (Sharp & Theiler, Citation2018), and poor lifestyle behaviors (e.g., low sleep quality; Ridner et al., Citation2016), which could negatively impact mental well-being. Previous studies have often suggested that alcohol consumption and poor mental well-being in students co-occur. However, studies investigating the relationship between the two concepts show inconsistencies in how this possible relationship looks (Piumatti et al., Citation2019).
Several studies found negative associations in students, indicating that higher alcohol consumption was associated with lower mental well-being. High(er) levels of alcohol consumption were associated with more depressive symptoms (Dvorak et al., Citation2013; Pedrelli et al., Citation2016), more chance of generalized anxiety disorder (Cranford et al., Citation2009), higher psychological distress (Chang et al., Citation2021; Hunt & Burns, Citation2017; Tembo et al., Citation2017), higher perceived stress (Du et al., Citation2021), lower life satisfaction (Sæther et al., Citation2019), and lower mental health (Blank et al., Citation2016; Jao et al., Citation2019). During the COVID-19 pandemic, a decline in psychological health was associated with an increase in alcohol consumption (Ryerson, Citation2022).
Possible causal explanations for this negative association have been described. For example, it might be that drinking excessive amounts of alcohol has detrimental effects on the human brain (e.g., on the chemicals related to mood regulation), resulting in mood disruptions (Volkow et al., Citation2008). However, in the reverse causal direction, students who experience negative mental health symptoms (e.g., depression/anxiety symptoms) might consume alcohol to cope with negative moods and stressors (Hudson et al., Citation2018). Moreover, the ‘dual diagnosis hypothesis’ suggests that alcohol disorders and mood disorders mutually stimulate each other, instead of one preceding the other (Valentiner et al., Citation2004). Finally, it could also be that an underlying factor, like genetic vulnerability, influences both excessive drinking and depressive symptoms (Foo et al., Citation2018).
In contrast several empirical findings showed positive associations among students, which means that higher alcohol consumption was associated with higher mental well-being. Hartley et al. (Citation2004) reported that binge drinkers had lower depression and anxiety scores than abstainers. Alcohol consumption was positively associated with subjective well-being (Molnar et al., Citation2009) and happiness (among students practicing a sport; Zhou et al., Citation2014). Above average mental well-being was associated with hazardous consumption (only among male students; Davoren et al., Citation2015), and excessive drinking was protective for negative mental health symptoms (Borst et al., Citation2015).
An explanation for these positive associations may be found in the social context of alcohol consumption among students. Increased alcohol consumption has been associated with better alignment to the student community (Nezlek et al., Citation1994), more close friends (Sæther et al., Citation2019), lower social anxiety (Battista et al., Citation2010; Ham & Hope, Citation2005), and increased social connectedness (Hunt & Burns, Citation2017), all factors generally contributing to better mental well-being. Thus, positive associations between alcohol consumption and mental health must not be interpreted in a causal direction (Burris et al., Citation2009), as possibly alcohol consumption is only co-occurring with higher mental well-being in a certain social context (Aan Het Rot et al., Citation2008; Heath, Citation2007; Peele & Brodsky, Citation2000).
There are also numerous studies that did not find significant relationships between alcohol consumption and mental well-being in university students, for example for depression (Esmaeelzadeh et al., Citation2018; Schnetzer et al., Citation2013), life satisfaction (Grant et al., Citation2009), happiness (Piqueras et al., Citation2011), overall mental well-being and psychological problems (Dopmeijer et al., Citation2021). Most of these studies (except Schnetzer et al., Citation2013) categorized participants in subgroups based on their alcohol consumption (e.g., abstainers vs. moderate vs. excessive drinkers) and compared levels of mental well-being for these subgroups. With the same approach also significant between-group differences have been found. For example, moderate alcohol consumption was associated with lower depression scores (Adewuya et al., Citation2006; O’Donnell et al., Citation2006), lower emotional loneliness (Sæther et al., Citation2019), and higher general well-being (Lanier et al., Citation2001) compared to abstainers and excessive drinkers. These findings suggest a non-linear association between alcohol and mental well-being. However, results are mixed, with studies finding the highest levels of life satisfaction (Sæther et al., Citation2019) and mental well-being (Blank et al., Citation2016) among abstainers.
A limitation of studies using a categorical modeling framework is that they use different cutoff values (of an originally continuous score like glasses alcohol per week) to determine different consumption levels (e.g., abstainers/low, moderate and excessive drinkers), (for example >8 for females)/>9 for males on the Alcohol Use Disorders Identification Test - subscale Consumption (AUDIT-c) in Verhoog et al., (Citation2020); >4 for females/>5 for males in Carretero et al., Citation2016); >5 (females)/>7(males) in Campbell & Maisto, Citation2018). As a result, studies are more difficult to compare, which can explain contradictory findings.
Another important explanation for the inconsistent and mixed results regarding the association between alcohol consumption and mental well-being in university students might be that most studies did not consider the possibility of a curvilinear relationship. Most previous studies used linear models or compared drinking groups (categorical modeling frameworks). Some results of studies using categorical models indicated a non-linear relationship, with moderate drinkers having higher mental well-being than abstainers and excessive drinkers. To our knowledge, only two studies used curvilinear modeling in a sample of university students to explore the relationship between mental well-being (Jensen et al., Citation2021), life satisfaction (Murphy et al., Citation2005), and alcohol consumption. Both studies provide insights in the possible relevance of considering this type of association. Jensen et al. (Citation2021) found that moderate levels of mental health problems were associated with the highest levels of risky alcohol consumption. Murphy et al. (Citation2005) found a positive curvilinear association between social satisfaction and alcohol consumption (i.e., moderate drinking was associated with the highest social satisfaction). This curvilinear association was only present for males, while for females, alcohol use was associated with lower general life satisfaction.
Hence, another factor that should not be ignored in the relationship between students’ alcohol consumption and mental well-being is gender. The prevalence of alcohol consumption is often lower in females than in males (Engs & Hanson, Citation1990; van Hooijdonk et al., Citation2022; Wicki et al., Citation2010). On a biological level, there are gender differences in alcohol metabolism resulting in different physiological reactions to alcohol (Gill, Citation2000; Thomasson, Citation2002). Consequences of excessive alcohol use appear to be more negative for females than for males, at least in some domains (e.g., alcohol-related illnesses at lower levels of exposure, more cognitive and motor impairment, higher risk of physical harm and sexual assault; Holmila & Raitasalo, Citation2005; Nolen-Hoeksema, Citation2004). Regarding mental health, the prevalence of mental health problems is often higher in females than in males (Dyrbye et al., Citation2006; Prowse et al., Citation2021). Females generally tend to internalize emotions more than males, resulting in negative mental health symptoms. However, males are more likely to externalize emotions, resulting in noncompliant behavior (Eaton et al., Citation2012), which can explain higher drinking rates.
Because of these gender differences in alcohol consumption and well-being, also the relationship between alcohol consumption and mental well-being might be different for females and males (Graham et al., Citation2007). Several studies indeed found gender differences in the strength of shape of the relationship between alcohol consumption and mental well-being (Adewuya et al., Citation2006; Begdache et al., Citation2020; Blank et al., Citation2016; Davoren et al., Citation2013; Murphy et al., Citation2005; Pedersen, Citation2013), but they tend to provide mixed results (Geisner et al., Citation2004). In conclusion, more research is needed to understand the moderating effect of gender on the relationship between alcohol consumption and mental well-being.
To address some of the gaps in the literature, the current study aimed to explore the association between alcohol consumption and mental well-being in male and female students separately. We started with exploratory “classical” descriptive analyses including correlations (with continuous alcohol consumption) and categorical comparisons (abstainers, moderate, excessive drinkers) with mental well-being. Next, we aimed to identify the best fitting relationship (linear, curvilinear or no relationship) between alcohol consumption and mental well-being in both male and female students in our explanatory analyses. Here, we have treated alcohol consumption in a continuous manner (AUDIT-c score). Mental well-being was operationalized as the experience of negative mental well-being symptoms (i.e., depression, anxiety, stress) and of subjective mental well-being (i.e., life satisfaction, happiness, self-rated mental health). If the type of relationship between alcohol consumption and one of the mental well-being indicators was similar in females and males (either linear or curvilinear in both genders), we aimed to combine the samples and test whether the slope was the same for females and males.
Method
Study design and procedure
We used data from the first wave (October-November 2021) of the Healthy Student Life project at the Behavioural Science Institute, Radboud University (Healthy Student Life Team, Citation2022). The survey included, among others, questions about participants’ mental well-being, lifestyle behaviors (including alcohol consumption) and demographics. The study was ethically approved by the Ethical Committee Social Sciences of the Radboud University (ECSS-2021-086). Participants gave active consent and completed the survey (∼30 min) in English or Dutch language. After completing the survey they could sign up for a raffle with prizes. This study was pre-registered at Open Science Framework (Osf.io; https://osf.io/tg93z).
Participants
From the N = 25,035 students invited, 4902 students (19.6%) started the survey. For the current study we used the following exclusion criteria: (1) older than 30 years old (n = 166), (2) who filled in “Other” at the gender variable (n = 66), (3) who had missing value(s) at one of the main constructs (six indicators of mental well-being, and AUDIT-c score, n = 1083), (4) who reported unrealistic amounts of alcoholic beverages per average drinking day (>30; n = 0). Some participants met multiple exclusion criteria. After exclusion, N = 2631 females and N = 998 males remained. The mean age was 22.1 (SD = 2.49) years old for females and 22.3 (SD = 2.73) for males. Within both groups the majority of the sample consisted of bachelor (56.3% of females, 59.1% of males) or master (36.2% of females, 34.8% of males) students, students following a fulltime program (99.7% of females, 99.5% of males), and Dutch students (83.3% of females, 84.3% males). Most participants were living with roommates (48.8% of females, 41.6% of males), followed by living with parents (28.3% of females, 33.6% of females). Half of the females and males were member of a study association and around 5% was member of a student association (see Supplementary Table S1).
Instruments
More information about the specific items, answer categories and scoring for multi-items variables can be found in Supplementary Method 1.
Alcohol consumption
The 3-item Alcohol Use Disorders Identification Test-consumption (AUDIT-c; Bradley et al., Citation1998) was used to measure alcohol consumption (frequency of drinking, binge drinking, number of glasses per typical drinking day; Verhoog et al., Citation2020). It has been identified as a valid and reliable scale to identify risky drinking behavior in student populations (Barry et al., Citation2015; Campbell & Maisto, Citation2018; Verhoog et al., Citation2020). Answer categories ranged from 0 to 4, and the sum score of these three items (range 0–12) was used in the analyses. The referred time period was changed from the past year to the past half year to avoid overlap with the second wave of the healthy student life project (6 months after the first wave). The AUDIT-c scale showed acceptable internal reliability (Cronbach’s Alpha; α = .73 for females; α = .72 for males).
Depressive complaints
To measure depressive symptoms, the 8-item Center for Epidemiologic Studies-Depression Scale (CES-D8; Radloff, Citation1977) was used. The sum score (range 8–32) of the individual items was used in the analyses, based on Radloff (Citation1977). The CES-D8 scale showed good internal reliability (Cronbach’s Alpha: α = .85 for females; α = .84 for males).
Anxiety
The Dutch translation (Donker et al., Citation2011) of the 2-item Generalized Anxiety Disorder (GAD-2; Spitzer et al., Citation2006) scale was used to measure anxiety related problems in the past two weeks. The sum score (range 0–6) of the individual items was used in the analyses (Spitzer et al., Citation2006). The GAD-2 items showed acceptable to good reliability (Cronbach’s Alpha: α = .80 for females; α = .77 for males; Spearman-Brown: ρ(2629) = .64, p < .001 for females; r(996) = .59, p < .001 for males; based on recommendations by Eisinga et al. (Citation2013).
Perceived stress
To measure perceived stress, the 10-item Perceived Stress Scale (PSS; Cohen et al., Citation1994) was used. This scale included questions about the degree participants experience stressful situations in the past month. The sum score (range 0-40) of the individual items was used in the analyses (Cohen et al., Citation1983, Citation1994). The PSS-10 scale showed good internal reliability (Cronbach’s Alpha: α = .88 for females; α = .87 for males).
Life satisfaction
Life satisfaction was measured by a single item satisfaction with life scale (Cheung & Lucas, Citation2014), which entailed the question “In general, how satisfied are you with your life?.” Participants were asked to answer this question on a 4-point Likert-scale ranging from: Very dissatisfied (1) to Very Satisfied (4). The score of this single item was used in the analyses.
Happiness
To measure happiness, the single item Happiness scale (Abdel-Khalek, Citation2006) was used. This scale questioned the participant “Do you feel happy in general?.” Participants could answer this question by filling in a Likert-scale that ranged from: Not happy at all (1) to Very happy (10). Scores on this single item were used in the analyses.
Self-rated mental health
The self-rated mental health single-item question was: “In general, would you say your mental health is: Poor (1), Fair (2), Good (3), Very Good (4), Excellent (5)” (Ahmad et al., Citation2014). Scores on this single item were used in the analyses.
Gender
Participant’s gender was examined by the question “What is your gender?.” Participants could respond with either (1) Male, (2) Female, or (3) Other, namely. Information on this variable was supplemented with information about participants’ sex via the Administrative Services.
Background variables
Upon permission of the student several background variables have been extracted from the university administrative services: age, sex, nationality, international student, faculty, study phase, type of study, and living situation to describe the current study samples (see above, under “Participants”).
Statistical analyses
Power analyses
A pre-registered a priori power analysis for linear bivariate regression (G*Power; Faul et al., Citation2007) with a power estimate of 1 − b = .80 and a critical alpha of α = .05 was conducted, based on a moderate association between alcohol consumption and depressive symptoms (r = .21; SD = 5.95 for AUDIT; SD = 8.83 for DBI-II, depressive symptoms; (Dvorak et al., Citation2013). This resulted in a minimum sample size of n = 173 for both genders, resulting in a total minimum sample size of n = 246.
Exploratory analyses
Descriptive statistics and correlations between alcohol consumption and the six indicators of mental well-being were computed separately for females and males. Independent sample t-tests were performed to see whether females and males differed significantly on alcohol consumption and the indicators of mental well-being. Moreover, One-Way ANOVAs were conducted to examine if drinking categories (abstainer, moderate and excessive) significantly differed on the indicators of mental well-being for females and males separately. According to Verhoog et al. (Citation2020), participants scoring 0 on the AUDIT-c were labeled as abstainers, participants with scores 1–7 (females) and 1–8 (males) were labeled as moderate drinkers, and participants with scores 8–12 (females) and 9–12 (males) were labeled as excessive drinkers. In case of significant between-group differences, post-hoc tests were performed to explore which groups significantly differ from each other. Tukey post-hoc test was used for depressive complaints, anxiety and self-rated mental health because groups differed in sample sizes, Games-Howell post-hoc test was used for perceived stress, life satisfaction and happiness because of different sample sizes and heterogenous variances. For the exploratory analyses, the critical p-value was p = .05.
Explanatory analyses: linear and curvilinear models
Linear modeling (LM) and general additive modeling (GAM) were used within the package Mixed GAM Computation Vehicle (mgcv; Wood, Citation2017) in R (Team R Development Core, Citation2018) to explore respectively linear and curvilinear relationships between alcohol consumption (predictor variable) and each mental well-being outcome measure (N = 6) for females and males separately. When only one model was significant, this model was adopted. When both models were significant, a Chi-Square test was performed. If this test was significant, the model with the most explained variance (R2) was adopted. If the test was non-significant, the LM was adopted, since adding the curvilinear parameter to the linear model did not improve the model fit. The results were visually plotted to interpret the direction of the regression lines (by ggPlot2; Wickham & Chang, Citation2016). When this analysis resulted in a similar optimal model between alcohol consumption and a mental well-being indicator for females and males (either both linear or both curvilinear), the procedure above would be performed on the entire dataset, with gender added as a moderation variable to test possible gender differences in the regression slopes. Additionally, the outcomes of the Chi-Square test were compared to an AIC test in order to ensure the reliability of our conclusions (using the rules of thumb by Anderson & Burnham, Citation2004). More information on the GAM specifics can be found in the Supplementary Method 2.
To correct for multiple hypotheses testing in the explanatory analyses, the Benjamini-Hochberg procedure (Benjamini & Hochberg, Citation1995) was used. p-value were put in an ascending order, and ranks were assigned, where the smallest p-value has the rank of 1. For each p-value, a critical p-value was calculated by the formula (i/m)*Q, in which I is the rank of the p-value, m is the number of tests (m = 30), and Q is the false discovery rate (5%). The largest p-value that was smaller than its critical value becomes the new critical value for all explanatory significance tests, which was p = .023.
Results
Descriptives and exploratory analyses
One in three (31.5%) of the female students and 43.9% of the male students reported weekly drinking (varying from 2–3 times per week till 6–7 times per week). Binge drinking (≥4 (females)/≥6 glasses (males) alcohol per occasion) for at least 2 to 3 times a week was reported by 11.9% of the females and 15.4% of the males.
Males scored significantly higher on alcohol consumption than females (M = 3.70 versus M = 3.36, ). Females scored significantly higher on all indicators of negative mental health symptoms (depression, anxiety, and stress), and lower on all indicators of subjective mental well-being (life satisfaction, happiness, and self-reported mental health). The effect sizes (Cohen’s d) are small to moderate, ranging from d = .09 for happiness to d = −.41 for stress. Significant correlations between alcohol consumption and the indicators of mental well-being were found for females (except for perceived stress), while no significant correlations were found for males (except for self-reported mental health; Supplementary Table S2).
Table 1. Descriptive information and independent sample t-test output of gender differences in alcohol consumption and the six indicators of mental well-being.
For exploratory purposes we categorized the participants in 3 subgroups: abstainers, moderate and excessive drinkers and explored their mean mental well-being scores (). For females, we found significant differences between the drinking groups on all indicators of mental well-being. Moderate drinkers scored significantly lower on all three indicators of negative mental health symptoms, and higher on all three indicators of subjective mental well-being compared to abstainers. In addition, moderate drinkers scored significantly lower on stress compared to excessive drinkers. Excessive drinkers scored higher on happiness and self-reported mental health compared to abstainers. For males, the means of the mental well-being scores did not significantly differ between abstainers, moderate and excessive drinkers.
Table 2. Mean scores of the mental well-being variables for abstainers, moderate drinkers, and excessive drinkers, separately for females and males.
Explanatory analyses: comparing linear and curvilinear models
The relationship between alcohol consumption and mental well-being in females was best explained by a curvilinear model for depressive symptoms, happiness, and perceived stress (). Moderate alcohol consumption was associated with less depressive and less stress symptoms compared to low or high alcohol consumption, reflected in a U-shaped curve ( and ), and with higher happiness scores compared to either low or high alcohol consumption, resulting in a reversed U-shaped form (). For anxiety, life satisfaction, and self-rated mental health, the curvilinear model did not significantly improve the model fit, so the linear model was adopted. Alcohol consumption was negatively related to anxiety, and positively to life satisfaction and self-rated mental health (dotted lines in ). Chi-square and AIC values provided similar conclusions for all comparisons.
Figure 1. AUDIT-c and depression. The GAM model was adopted. ggPlot visualizations of the significant LM and GAM in the relationship between AUDIT-c score and depression for females. The dotted line indicates the LM, full line indicates the GAM. The size of the dots refers to the number of observations per data point.
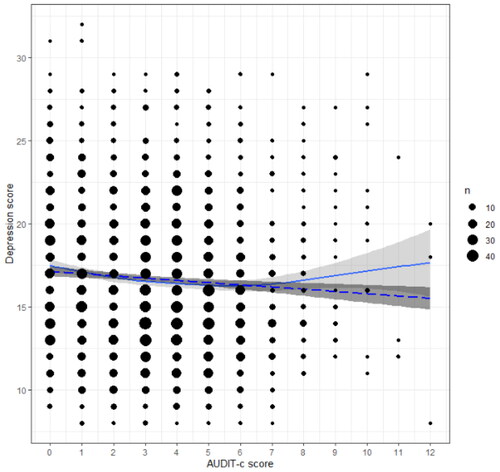
Figure 2. AUDIT-c and anxiety. LM model was adopted. ggPlot visualizations of the significant LM and GAM in the relationship between AUDIT-c score and anxiety for females. The dotted line indicates the LM, full line indicates the GAM. The size of the dots refers to the number of observations per data point.
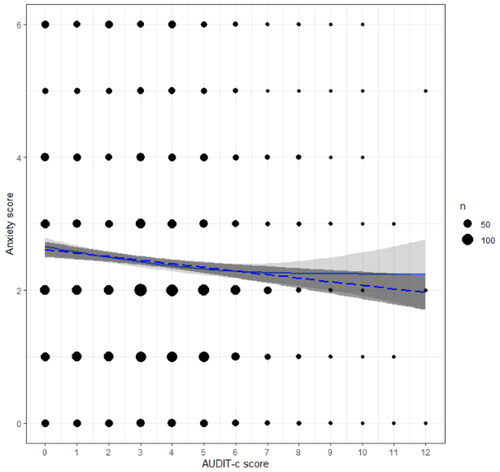
Figure 3. AUDIT-c and perceived stress. The GAM model was adopted. ggPlot visualizations of the significant GAM in the relationship between AUDIT-c score and perceived stress for females. The full line indicates the GAM. The size of the dots refers to the number of observations per data point.
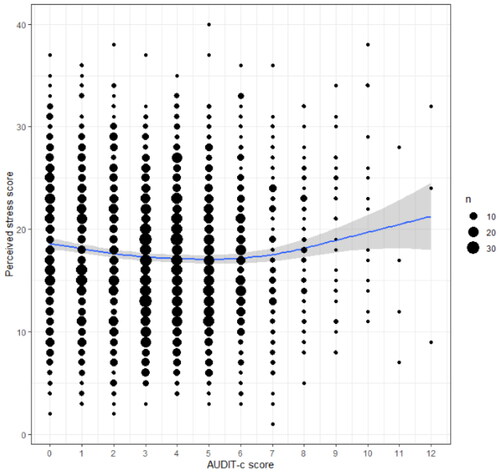
Figure 4. AUDIT-c and life satisfaction. LM model was adopted. ggPlot visualizations of the significant LM and GAM in the relationship between AUDIT-c score and life satisfactionfor females. The dotted line indicates the LM, full line indicates the GAM. The size of the dots refers to the number of observations per data point.
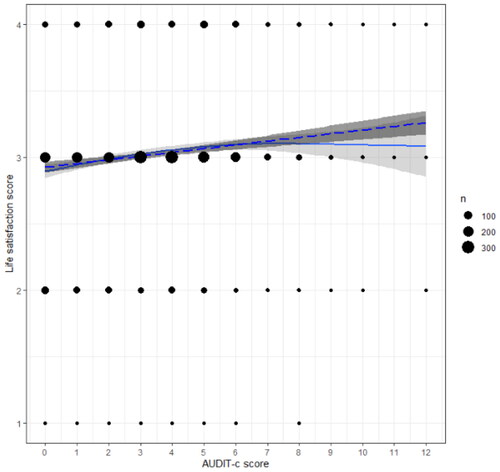
Figure 5. AUDIT-c and happiness. The GAM model was adopted. ggPlot visualizations of the significant LM and GAM in the relationship between AUDIT-c score and happiness for females. The dotted line indicates the LM, full line indicates the GAM. The size of the dots refers to the number of observations per data point.
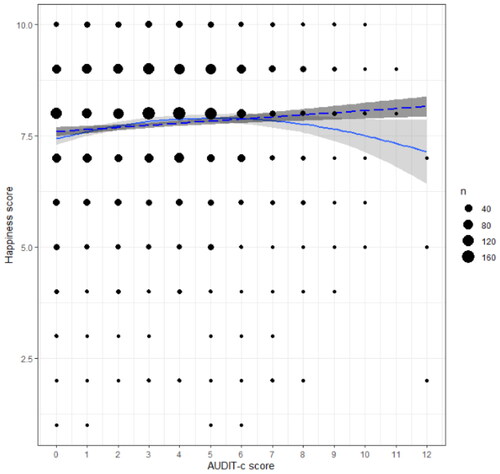
Figure 6. AUDIT-c and mental health. LM model was adopted. ggPlot visualizations of the significant LM and GAM in the relationship between AUDIT-c score and self-rated mental health score for females. The dotted line indicates the LM, full line indicates the GAM. The size of the dots refers to the number of observations per data point.
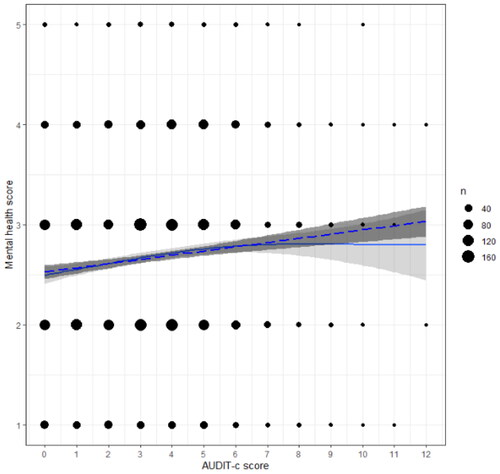
Table 3. Results of the linear and curvilinear models for the relationship between alcohol consumption (AUDIT-c) and each of the indicators of mental well-being for females and males separately.
In the group of male students alcohol consumption was neither linearly nor curvilinearly related to any indicator of mental well-being (see ).
Comparing slope for females and males
Because females and males did not display the same (significant) relationships between alcohol consumption and the indicators of mental well-being, the procedure above was not performed on the entire dataset, and possible gender differences in the regression slopes were not tested.
Discussion
The current study investigated the type of relationship (curvilinear, linear, or absent) between alcohol consumption and mental well-being among female and male students. The main finding of this study is that for females, both linear (for anxiety, life satisfaction and self-rated mental health) and curvilinear (for depressive symptoms, stress, and happiness) small associations with alcohol consumption were found, while for males no association between alcohol consumption and mental well-being was found.
Most students consumed alcohol in the past half year (i.e., 87%) which is in line with previous observations (Dopmeijer et al., Citation2021). In line with previous literature (Wicki et al., Citation2010), male students consumed more alcohol than female students, and female students scored worse on mental well-being indicators compared to males (this effect was the strongest for anxiety, stress and mental health, but effect sizes were generally low).
For females, alcohol consumption was significantly related with all indices of mental well-being. For depressive symptoms and stress, U-shaped relationships were found, and for happiness, a reversed U-shaped relationship was found. The reversed U-shaped relationship suggests that moderate alcohol consumption is associated with better mental well-being than no/low or excessive consumption. Moderate drinkers could score better on mental health outcomes than abstainers due to social aspects related to alcohol drinking (Peele & Brodsky, Citation2000), while if alcohol consumption increases to above moderate, chemical effects of alcohol on brain (Volkow et al., Citation2008), and alcohol-coping (Hudson et al., Citation2018) might explain the lower well-being of excessive drinkers.
In line with findings from Adewuya et al. (Citation2006) and (Begdache et al., Citation2020), we found a negative linear relationship for anxiety, and positive linear relationship for life satisfaction and self-rated mental health, indicating that female students with higher alcohol consumption experienced less anxiety, more life satisfaction and higher self-rated mental health. A possible explanation of this positive relationship might be that students primarily have social motives for alcohol consumption, instead of coping motives (Dopmeijer et al., Citation2021). It should be noted that the variables that linearly associate with alcohol consumption had relatively little degrees of freedom (df) and a limited number of items (anxiety 6 df, 2 items; life satisfaction 3 df, 1 item; self-rated mental health 4 df, 1 item) in comparison to the variables that were curvilinear associated with alcohol consumption (depressive symptoms 23 df, 8 items; perceived stress 40 df, 10 items; happiness 10 df, 1 item). It could be that for variables with lower variation, it was more difficult to detect a curvilinear association. To overcome this, future research should examine those variables on scales with more degrees of freedom, for example continuous scales based on multiple items.
When comparing these curvilinear models to categorical and linear ones, they show slightly different pictures. For example, our categorical analyses show that the abstainers score worse than moderate consumers (with excessive consumers scoring similar to either abstainers or moderate consumers), while our linear analyses show positive associations with excessive consumption (i.e., more consumption is related to lower depression and anxiety, and higher life satisfaction, happiness and mental health). Our curvilinear analyses provide a different perspective; moderate consumption is generally associated with higher mental wel-being than no/low consumption, but we mainly see a steep decrease in mental well-being among students with high alcohol consumption. This trend is not visible in the other two analyses, and therefore emphasizes the importance of considering curvilinear modeling.
Against our expectations, no significant (neither linear nor curvilinear) associations were found between alcohol consumption and indicators of mental well-being for males. A health monitor in the Netherlands also did not find an association between excessive alcohol consumption and depressive symptoms, anxiety or emotional exhaustion in Dutch students (Dopmeijer et al., Citation2021). The smaller sample size in our male sample compared to our female sample might explain the null findings in males. Future research should use larger male samples, similar to the sample size of the female sample. Besides this, the distributions of the mental well-being variables are somewhat more skewed for males in comparison to females. Skewed distributions in the outcome variable are a violation of regression models, and could specifically result in inaccurate detection of curvilinear associations (Cao et al., Citation2018).
Importantly, it should be noted that although the models in females were significant, the explained variance of the accepted models was low (around 1%). Together with the non-significant relationships in males this suggests that the association between alcohol consumption and mental well-being was weak in the current sample. In fall 2021, mental health problems were prevalent in students because of the COVID-19 pandemic while social drinking occasions were still limited. This could explain why alcohol consumption and mental well-being did not co-occur strongly in this period. For future studies, it should be monitored whether there is a stronger relationship between alcohol consumption and mental well-being post-COVID-19. If this is the case, it is important to determine whether the relationship is either linear or curvilinear since these conclusions can be substantially different (i.e. higher alcohol consumption is associated with lower depressive symptoms in a linear model versus excessive alcohol use is associated with more depressive symptoms than moderate use in a U-shaped relationship). In conclusion, the applied method or model (linear, curvilinear or categorical) has major impact on how the relationship between alcohol consumption and mental well-being is interpreted. This could have implications for policy development or interventions (for example with regard to “target” groups).
Another important note is that based on a study like the current one, we are not able to make causal inferences. One should be careful in interpreting the association (if any) between alcohol consumption and mental well-being. An association does not mean that increasing alcohol consumption would foster increased mental well-being or the other way around. We expect that the social factors that are associated with (moderate) drinking can explain the higher mental well-being scores, and not the alcohol consumption itself. To understand those social factors, future research should examine more specific drinking related factors (e.g., drinking situations, drinking motives: social versus coping) that might moderate the relationship between alcohol consumption and mental well-being. Future research should also use longitudinal designs to get more insight in the causal direction in the relationship between alcohol consumption and mental well-being.
Additional limitations must be considered for our study. The AUDIT-c distribution was skewed to the left for both females and males, indicating that only a small proportion of participants scored high on the AUDIT-c (reflecting excessive drinking). With more excessive drinkers in the model there could be more power to detect whether a linear or curvilinear model fits better, since the differences between these models are mainly in the extremes of the distribution (very low versus very excessive drinkers). Future research should try to replicate this finding including more excessive drinkers. Furthermore, our data collection took place when the COVID-19 pandemic was still ongoing. Although there was no lockdown, several limiting measures were in place (i.e., working from home if possible, maximum number of visitors for festivals, parties, sport matches) or were introduced during data collection (i.e., access with corona pass only in several places, wear a mouth mask in public places, earlier closing times for shops, restaurants, events and a maximum of 75 persons per room at the university; (Rijksinstituut voor Volksgezondheid en Milieu, Citation2022). Because of these COVID-19 measures, alcohol consumption (especially drinking in social situations) was probably lower than under “normal” (non-Covid) circumstances.
It should be noted that 72.5% of our sample consisted of females, while in the entire student population 58.5% of the students is female, indicating that males were underrepresented. A gender bias in survey response rate is previously found indicating that female students are more likely to respond then male students (Porter & Umbach, Citation2006). From the total sample invited, about one in five students responded to our invitation to participate in the survey study. It might be possible that specific types of students (e.g., engaged students or students who are doing well) are overrepresented, and that students with for example mental well-being problems are underrepresented.
In summary, we found weak but significant relationships between alcohol consumption and mental well-being indicators in female students, but no significant relationships in male students. We proposed a novel conceptual framework to explore the relationship between alcohol consumption and mental well-being: a curvilinear one. In female students we found a curvilinear relationship of alcohol consumption with depressive symptoms, stress and happiness and a linear relationship with anxiety, life satisfaction and self-rated mental health. We showed that testing the relationship between the two concepts in a (more classical) linear and categorical manner led to different conclusions compared to a curvilinear approach. Hence, we hope to encourage future research to also consider curvilinear modeling when examining the relationship between alcohol consumption and mental well-being in university student populations.
Author contributions
SG and JV conceived the Healthy Student Life (HSL) project; SS, KvH, TvN, SG, and JV designed the HSL project; KvH collected the data and prepared the dataset under the supervision of SS, TvN, SG, JV; BvB conceived the research plan for the current manuscript, under supervision of JV and SS; BvB designed the analyses plan, and wrote a pre-registration under supervision of JV; BvB analyzed the data and wrote a thesis under the supervision of JV; BvB and JV drafted and finalized the manuscript; SS, KvH, TvN, SG gave constructive feedback for intellectual content to the draft of the manuscript.
Ethical approval and consent
The Healthy Student Life project was ethically approved by the Ethical Committee of Social Sciences of Radboud University (ECSS-2021-086). Participants gave active consent.
Supplemental Tables.docx
Download MS Word (21.6 KB)Supplemental Methods.docx
Download MS Word (22.2 KB)Disclosure statement
No potential conflict of interest was reported by the authors.
Data availability
The dataset in this manuscript is part of a larger project (the Healthy Student Life project, https://www.ru.nl/bsi/research/group-pages/healthy-student-life/.). The dataset and scripts generated and analyzed for the current study are available from the corresponding author upon reasonable request.
Additional information
Funding
References
- Aan Het Rot, M., Russell, J. J., Moskowitz, D. S., & Young, S. N. (2008). Alcohol in a social context: Findings from event-contingent recording studies of everyday social interactions. Alcoholism, Clinical and Experimental Research, 32(3), 459–471. https://doi.org/10.1111/j.1530-0277.2007.00590.x
- Abdel-Khalek, A. M. (2006). Measuring happiness with a single-item scale. Social Behavior and Personality: An International Journal, 34(2), 139–150. https://doi.org/10.2224/sbp.2006.34.2.139
- Adewuya, A. O., Ola, B. A., & Aloba, O. O. (2006). Gender differences in the relationship between alcohol use and anxiety symptoms among Nigerian college students. Drug and Alcohol Dependence, 85(3), 255–257. https://doi.org/10.1016/j.drugalcdep.2006.05.016
- Adewuya, A. O., Ola, B. A., Aloba, O. O., Mapayi, B. M., & Oginni, O. O. (2006). Depression amongst Nigerian university students: Prevalence and sociodemographic correlates. Social Psychiatry and Psychiatric Epidemiology, 41(8), 674–678. https://doi.org/10.1007/s00127-006-0068-9
- Ahmad, F., Jhajj, A. K., Stewart, D. E., Burghardt, M., & Bierman, A. S. (2014). Single item measures of self-rated mental health: A scoping review. BMC Health Services Research, 14(1), 398. https://doi.org/10.1186/1472-6963-14-398
- Anderson, D. R., & Burnham, K. P. (2004). Model selection and multimodel inference: A practical information-theoretic approach (2nd ed.). Springer-Verlag.
- Auerbach, R. P., Mortier, P., Bruffaerts, R., Alonso, J., Benjet, C., Cuijpers, P., Demyttenaere, K., Ebert, D. D., Green, J. G., Hasking, P., Murray, E., Nock, M. K., Pinder-Amaker, S., Sampson, N. A., Stein, D. J., Vilagut, G., Zaslavsky, A. M., & Kessler, R. C, WHO WMH-ICS Collaborators. (2018). WHO world mental health surveys international college student project: Prevalence and distribution of mental disorders. Journal of Abnormal Psychology, 127(7), 623–638. https://doi.org/10.1037/abn0000362
- Barry, A. E., Chaney, B. H., Stellefson, M. L., & Dodd, V. (2015). Evaluating the psychometric properties of the AUDIT-C among college students. Journal of Substance Use, 20(1), 1–5. https://doi.org/10.3109/14659891.2013.856479
- Battista, S. R., Stewart, S. H., & Ham, L. S. (2010). A Critical review of laboratory-based studies examining the relationships of social anxiety and alcohol intake. Current Drug Abuse Reviews, 3(1), 3–22. https://doi.org/10.2174/1874473711003010003
- Begdache, L., Kianmehr, H., Sabounchi, N., Marszalek, A., & Dolma, N. (2020). Common and differential associations between levels of alcohol drinking, gender-specific neurobehaviors and mental distress in college students. Trends in Neuroscience and Education, 19, 100129. https://doi.org/10.1016/j.tine.2020.100129
- Benjamini, Y., & Hochberg, Y. (1995). Controlling the false discovery rate: A practical and powerful approach. Journal of the Royal Statistical Society: Series B (Methodological), 57(1), 289–300. https://doi.org/10.1111/j.2517-6161.1995.tb02031.x
- Blank, M. L., Connor, J., Gray, A., & Tustin, K. (2016). Alcohol use, mental well-being, self-esteem and general self-efficacy among final-year university students. Social Psychiatry and Psychiatric Epidemiology, 51(3), 431–441. https://doi.org/10.1007/s00127-016-1183-x
- Borst, J. M., Frings-Dresen, M. H. W., & Sluiter, J. K. (2015). Prevalence and incidence of mental health problems among Dutch medical students and the study-related and personal risk factors: A longitudinal study. International Journal of Adolescent Medicine and Health, 28(4), 349–355. https://doi.org/10.1515/ijamh-2015-0021
- Bradley, K. A., McDonell, M. B., Bush, K., Kivlahan, D. R., Diehr, P., & Fihn, S. D. (1998). The AUDIT alcohol consumption questions. Alcoholism: Clinical & Experimental Research, 22(8), 1842. https://doi.org/10.1097/00000374-199811000-00034
- Burris, J., Brechting, E., Salsman, J., & Carlson, C. (2009). Factors associated with the psychological well-being and distress of university students. Journal of American College Health, 57(5), 536–544. https://doi.org/10.3200/JACH.57.5.536-544
- Campbell, C. E., & Maisto, S. A. (2018). Validity of the AUDIT-C screen for at-risk drinking among students utilizing university primary care. Journal of American College Health, 66(8), 774–782. https://doi.org/10.1080/07448481.2018.1453514
- Cao, M., Song, Q. C., & Tay, L. (2018). Detecting curvilinear relationships: A comparison of scoring approaches based on different item response models. International Journal of Testing, 18(2), 178–205. https://doi.org/10.1080/15305058.2017.1345913
- Carretero, M. Á. G., Ruiz, J. P. N., Delgado, J. M. M., & González, C. O. (2016). Validation of the alcohol use disorders identification test in university students: AUDIT and AUDIT-C. Adicciones, 28(4), 194–204. https://doi.org/10.20882/adicciones.775
- Chang, W. P., Stuart, H., & Chen, S. P. (2021). Alcohol use, drug use, and psychological distress in university students: Findings from a Canadian Campus Survey. International Journal of Mental Health and Addiction, 20(4), 2366–2381. https://doi.org/10.1007/s11469-021-00519-w
- Cheung, F., & Lucas, R, E. (2014). Assessing the validity of single-item life satisfaction measures: Results from Three Large Samples. Quality of Life Research, 23(10), 2809–2818. https://doi.org/10.1007/s11136-014-0726-4
- Cohen, J., Cohen, P., West, S. G., & Aiken, L. S. (1983). Applied Multiple Regression/Correlation Analysis for the Behavioral Sciences (2nd ed.). Lawrence Erlbaum Associates.
- Cohen, S., Kamarck, T., & Mermelstein, R. (1983). A global measure of perceived stress. Journal of Health and Social Behavior, 24(4), 385–396. https://doi.org/10.2307/2136404
- Cohen, S., Kamarck, T., & Mermelstein, R. (1994). Perceived stress scale (PSS). Measuring Stress: A Guide for Health and Social Scientists (pp. 1646–1648). Publisher: Mind Garden, Menlo Park, CA.
- Cranford, J. A., Eisenberg, D., & Serras, A. M. (2009). Substance use behaviors, mental health problems, and use of mental health services in a probability sample of college students. Addictive Behaviors, 34(2), 134–145. https://doi.org/10.1016/j.addbeh.2008.09.004
- Davoren, M. P., Fitzgerald, E., Shiely, F., & Perry, I. J. (2013). Positive mental health and well-being among a third level student population. PLoS One, 8(8), e74921. https://doi.org/10.1371/journal.pone.0074921
- Davoren, M. P., Shiely, F., Byrne, M., & Perry, I. J. (2015). Hazardous alcohol consumption among university students in Ireland: A cross-sectional study. BMJ Open, 5(1), e006045. https://doi.org/10.1136/bmjopen-2014-006045
- Donker, T., van Straten, A., Marks, I., & Cuijpers, P. (2011). Quick and easy self-rating of Generalized Anxiety Disorder: Validity of the Dutch web-based GAD-7, GAD-2 and GAD-SI. Psychiatry Research, 188(1), 58–64. https://doi.org/10.1016/j.psychres.2011.01.016
- Dopmeijer, J. M., Nuijen, J., Busch, M. C. M., Tak, N. I., & van Hasselt, N. (2021). Monitor Mentale Gezondheid en Middelengebruik Studenten hoger onderwijs Deelrapport 2.
- Du, C., Zan, M. C. H., Cho, M. J., Fenton, J. I., Hsiao, P. Y., Hsiao, R., Keaver, L., Lai, C. C., Lee, H., Ludy, M. J., Shen, W., Swee, W. C. S., Thrivikraman, J., Tseng, K. W., Tseng, W. C., Doak, S., Folk, S. Y. L., & Tucker, R. M. (2021). The effects of sleep quality and resilience on perceived stress, dietary behaviors and alcohol misuse: A mediation-moderation analysis of higher education students from asia, europe and north america during the COVID-19 pandemic. Nutrients, 13(2), 442. https://doi.org/10.3390/nu13020442
- Dvorak, R. D., Lamis, D. A., & Malone, P. S. (2013). Alcohol use, depressive symptoms, and impulsivity as risk factors for suicide proneness among college students. Journal of Affective Disorders, 149(1-3), 326–334. https://doi.org/10.1016/j.jad.2013.01.046
- Dyrbye, L. N., Thomas, M. R., & Shanafelt, T. D. (2006). Systematic review of depression, anxiety, and other indicators of psychological distress among U.S. and Canadian Medical Students. Academic Medicine: Journal of the Association of American Medical Colleges, 81(4), 354–373. https://doi.org/10.1097/00001888-200604000-00009
- Eaton, N. R., Keyes, K. M., Krueger, R. F., Balsis, S., Andrew, E., Markon, K. E., Grant, B. F., & Hasin, D. S. (2012). In mental disorder prevalence : evidence from a national sample. Journal of Abnormal Psychology, 121(1), 282–288. https://doi.org/10.1037/a0024780.An
- Eisinga, R., Grotenhuis, M. T., & Pelzer, B. (2013). The reliability of a two-item scale: Pearson, Cronbach, or Spearman-Brown? International Journal of Public Health, 58(4), 637–642. https://doi.org/10.1007/s00038-012-0416-3
- Engs, R. C., & Hanson, D. J. (1990). Gender differences in drinking patterns and problems among college students: A review of the literature. Journal of Alcohol and Drug Education, 35(2), 36–47.
- Esmaeelzadeh, S., Moraros, J., Thorpe, L., & Bird, Y. (2018). The association between depression, anxiety and substance use among Canadian post-secondary students. Neuropsychiatric Disease and Treatment, 14, 3241–3251. https://doi.org/10.2147/NDT.S187419
- Faul, F., Erdfelder, E., Lang, A. G., & Buchner, A. (2007). G*Power 3: A flexible statistical power analysis program for the social, behavioral, and biomedical. Behavior Research Methods, 39(2), 175–191. https://doi.org/10.3758/BF03193146
- Foo, J. C., Streit, F., Treutlein, J., Ripke, S., Witt, S. H., Strohmaier, J., Degenhardt, F., Forstner, A. J., Hoffmann, P., Soyka, M., Dahmen, N., Scherbaum, N., Wodarz, N., Heilmann-Heimbach, S., Herms, S., Cichon, S., Preuss, U., Gaebel, W., Ridinger, M., … Frank, J, Major Depressive Disorder Working Group of the Psychiatric Genomics Consortium. (2018). Shared genetic etiology between alcohol dependence and major depressive disorder. Psychiatric Genetics, 28(4), 66–70. https://doi.org/10.1097/YPG.0000000000000201
- Geisner, I. M., Larimer, M. E., & Neighbors, C. (2004). The relationship among alcohol use, related problems, and symptoms of psychological distress: Gender as a moderator in a college sample. Addictive Behaviors, 29(5), 843–848. https://doi.org/10.1016/j.addbeh.2004.02.024
- Gill, J. (2000). The effects of moderate alcohol consumption on female hormone levels and reproductive function. Alcohol and Alcoholism (Oxford, Oxfordshire), 35(5), 417–423. https://doi.org/10.1093/alcalc/35.5.417
- Gill, J. S. (2002). Reported levels of alcohol consumption and binge drinking within the UK undergraduate student population over the last 25 years. Alcohol and Alcoholism (Oxford, Oxfordshire), 37(2), 109–120. https://doi.org/10.1093/alcalc/37.2.109
- Graham, K., Massak, A., Demers, A., & Rehm, J. (2007). Does the association between alcohol consumption and depression depend on how they are measured? Alcoholism, Clinical and Experimental Research, 31(1), 78–88. https://doi.org/10.1111/j.1530-0277.2006.00274.x
- Grant, N., Wardle, J., & Steptoe, A. (2009). The relationship between life satisfaction and health behavior: A cross-cultural analysis of young adults. International Journal of Behavioral Medicine, 16(3), 259–268. https://doi.org/10.1007/s12529-009-9032-x
- Ham, L. S., & Hope, D. A. (2005). Incorporating social anxiety into a model of college student problematic drinking. Addictive Behaviors, 30(1), 127–150. https://doi.org/10.1016/j.addbeh.2004.04.018
- Hartley, D. E., Elsabagh, S., & File, S. E. (2004). Binge drinking and sex: Effects on mood and cognitive function in healthy young volunteers. Pharmacology, Biochemistry, and Behavior, 78(3), 611–619. https://doi.org/10.1016/j.pbb.2004.04.027
- Healthy Student Life Team (2022). Healthy student life. https://www.ru.nl/bsi/research/group-pages/healthy-student-life/?reload=true
- Heath, D. B. (2007). Why we don’t know more about the social benefits of moderate drinking. Annals of Epidemiology, 17(5), S71–S74. https://doi.org/10.1016/j.annepidem.2007.01.016
- Holmila, M., & Raitasalo, K. (2005). Gender differences in drinking: Why do they still exist? Addiction (Abingdon, England), 100(12), 1763–1769. https://doi.org/10.1111/j.1360-0443.2005.01249.x
- Hudson, A., Thompson, K., MacNevin, P. D., Ivany, M., Teehan, M., Stuart, H., & Stewart, S. H. (2018). University students’ perceptions of links between substance use and mental health: A qualitative focus group study. Emerging Adulthood, 6(6), 399–410. https://doi.org/10.1177/2167696817748106
- Hunt, K., & Burns, S. (2017). Is there an association between social connectedness, social identity, alcohol consumption and mental health among young university students? Open Journal of Preventive Medicine, 07(06), 99–114. https://doi.org/10.4236/ojpm.2017.76009
- Jao, N. C., Robinson, L. D., Kelly, P. J., Ciecierski, C. C., & Hitsman, B. (2019). Unhealthy behavior clustering and mental health status in United States college students. Journal of American College Health, 67(8), 790–800. https://doi.org/10.1080/07448481.2018.1515744
- Jennison, K. M. (2004). The short-term effects and unintended long-term consequences of binge drinking in college: A 10-year follow-up study. The American Journal of Drug and Alcohol Abuse, 30(3), 659–684. https://doi.org/10.1081/ADA-200032331
- Jensen, P., Haug, E., Sivertsen, B., & Skogen, J. C. (2021). Satisfaction with life, mental health problems and potential alcohol-related problems among Norwegian UNIVERSITY STUDENTS. Frontiers in Psychiatry, 12, 578180. https://doi.org/10.3389/fpsyt.2021.578180
- Karam, E., Kypri, K., & Salamoun, M. (2007). Alcohol use among college students: An international perspective. Current Opinion in Psychiatry, 20(3), 213–221. https://doi.org/10.1097/YCO.0b013e3280fa836c
- Lanier, C. A., Nicholson, T., & Duncan, D. (2001). Drug use and mental well being among a sample of undergraduate and graduate college students. Journal of Drug Education, 31(3), 239–248. https://doi.org/10.2190/R7T3-T266-JN9E-UX3W
- Li, Y., Wang, A., Wu, Y., Han, N., & Huang, H. (2021). Impact of the COVID-19 pandemic on the mental health of college students: A systematic review and meta-analysis. Frontiers in Psychology, 12, 669119. https://doi.org/10.3389/fpsyg.2021.669119
- Molnar, D. S., Busseri, M. A., Perrier, C. P. K., & Sadava, S. W. (2009). A longitudinal examination of alcohol use and subjective well-being in an undergraduate sample. Journal of Studies on Alcohol and Drugs, 70(5), 704–713. https://doi.org/10.15288/jsad.2009.70.704
- Murphy, J. G., McDevitt-Murphy, M. E., & Barnett, N. P. (2005). Drink and be merry? Gender, life satisfaction, and alcohol consumption among college students. Psychology of Addictive Behaviors, 19(2), 184–191. https://doi.org/10.1037/0893-164X.19.2.184
- Nezlek, J. B., Pilkington, C. J., & Bilbro, K. G. (1994). Moderation in excess: Binge drinking and social interaction among college students. Journal of Studies on Alcohol, 55(3), 342–351. https://doi.org/10.15288/jsa.1994.55.342
- Nolen-Hoeksema, S. (2004). Gender differences in risk factors and consequences for alcohol use and problems. Clinical Psychology Review, 24(8), 981–1010. https://doi.org/10.1016/j.cpr.2004.08.003
- O’Donnell, K., Wardle, J., Dantzer, C., & Steptoe, A. (2006). Alcohol consumption and symptoms of depression in young adults from 20 countries. Journal of Studies on Alcohol, 67(6), 837–840. https://doi.org/10.15288/jsa.2006.67.837
- Pedersen, D. E. (2013). Gender differences in college binge drinking: Examining the role of depression and school stress. The Social Science Journal, 50(4), 521–529. https://doi.org/10.1016/j.soscij.2013.03.003
- Pedrelli, P., Borsari, B., Lipson, S. K., Heinze, J. E., & Eisenberg, D. (2016). Gender differences in the relationships among major depressive disorder, heavy alcohol use, and mental health treatment engagement among college students. Journal of Studies on Alcohol and Drugs, 77(4), 620–628. https://doi.org/10.15288/jsad.2016.77.620
- Peele, S., & Brodsky, A. (2000). Exploring psychological benefits associated with moderate alcohol use: A necessary corrective to assessments of drinking outcomes? Drug and Alcohol Dependence, 60(3), 221–247. https://doi.org/10.1016/S0376-8716(00)00112-5
- Piacentini, M. G., Chatzidakis, A., & Banister, E. N. (2012). Making sense of drinking: The role of techniques of neutralisation and counter-neutralisation in negotiating alcohol consumption. Sociology of Health & Illness, 34(6), 841–857. https://doi.org/10.1111/j.1467-9566.2011.01432.x
- Piqueras, J. A., Kuhne, W., Vera-Villarroel, P., Van Straten, A., & Cuijpers, P. (2011). Happiness and health behaviours in Chilean college students: A cross-sectional survey. BMC Public Health, 11(1) https://doi.org/10.1186/1471-2458-11-443
- Piumatti, G., Lietz, F., Aresi, G., & Bjegovic-Mikanovic, V. (2019). Alcohol use, psychological distress, and subjective well-being among young adult university students: A cross-national study between Serbia and Italy. Journal of Ethnicity in Substance Abuse, 18(4), 511–529. https://doi.org/10.1080/15332640.2017.1417186
- Porter, S. R., & Pryor, J. (2007). The effects of heavy episodic alcohol use on student engagement, academic performance, and time use. Journal of College Student Development, 48(4), 455–467. https://doi.org/10.1353/csd.2007.0042
- Porter, S. R., & Umbach, P. D. (2006). Student survey response rates across institutions: Why do they vary? Research in Higher Education, 47(2), 229–247. https://doi.org/10.1007/s11162-005-8887-1
- Prowse, R., Sherratt, F., Abizaid, A., Gabrys, R. L., Hellemans, K. G. C., Patterson, Z. R., & McQuaid, R. J. (2021). Coping with the COVID-19 pandemic: Examining gender differences in stress and mental health among university students. Frontiers in Psychiatry, 12, 650759. https://doi.org/10.3389/fpsyt.2021.650759
- Radloff, L. S. (1977). The CES-D scale: A self-report depression scale for research in the general population. Applied Psychological Measurement, 1(3), 385–401. https://doi.org/10.1177/014662167700100306
- Ridner, S. L., Newton, K. S., Staten, R. R., Crawford, T. N., & Hall, L. A. (2016). Predictors of well-being among college students. Journal of American College Health, 64(2), 116–124. https://doi.org/10.1080/07448481.2015.1085057
- Rijksinstituut voor Volksgezondheid en Milieu (2022). Tijdlijn van coronamaatregelen. Rivm 1–6.
- Ryerson, N. C. (2022). Behavioral and psychological correlates of well-being during COVID-19. Psychological Reports, 125(1), 200–217. https://doi.org/10.1177/0033294120978160
- Sæther, S. M. M., Knapstad, M., Askeland, K. G., & Skogen, J. C. (2019). Alcohol consumption, life satisfaction and mental health among Norwegian college and university students. Addictive Behaviors Reports, 10(March), 100216. https://doi.org/10.1016/j.abrep.2019.100216
- Schnetzer, L. W., Schulenberg, S. E., & Buchanan, E. M. (2013). Differential associations among alcohol use, depression and perceived life meaning in male and female college students. Journal of Substance Use, 18(4), 311–319. https://doi.org/10.3109/14659891.2012.661026
- Sharp, J., & Theiler, S. (2018). A review of psychological distress among university students: pervasiveness, implications and potential points of intervention. International Journal for the Advancement ofS Counselling, 40(3), 193–212. https://doi.org/10.1007/s10447-018-9321-7
- Spitzer, R. L., Kroenke, K., Williams, J. B. W., & Löwe, B. (2006). A brief measure for assessing generalized anxiety disorder: The GAD-7. Archives of Internal Medicine, 166(10), 1092–1097. https://doi.org/10.1001/archinte.166.10.1092
- Team R Development Core. (2018). A language and environment for statistical computing. R Foundation for Statistical Computing.
- Tembo, C., Burns, S., & Kalembo, F. (2017). The association between levels of alcohol consumption and mental health problems and academic performance among young university students. PLoS One, 12(6), e0178142. https://doi.org/10.1371/journal.pone.0178142
- Thomasson, H. R. (2002). Gender differences in alcohol metabolism: physiological responses to ethanol. Recent Developments in Alcoholism, 12, 163–179. https://doi.org/10.1007/0-306-47138-8
- Valentiner, D. P., Mounts, N. S., & Deacon, B. J. (2004). Panic attacks, depression and anxiety symptoms, and substance use behaviors during late adolescence. Journal of Anxiety Disorders, 18(5), 573–585. https://doi.org/10.1016/j.janxdis.2003.04.001
- van Hooijdonk, K. J. M., Rubio, M., Simons, S. S. H., van Noorden, T. H. J., Luijten, M., Geurts, S. A. E., & Vink, J. M. (2022). Student-, study-and COVID-19-related predictors of students’ smoking, binge drinking and cannabis use before and during the initial COVID-19 lockdown in The Netherlands. International Journal of Environmental Research and Public Health, 19(2), 812. https://doi.org/10.3390/ijerph19020812
- Verhoog, S., Dopmeijer, J. M., De Jonge, J. M., Van Der Heijde, C. M., Vonk, P., Bovens, R. H. L. M., De Boer, M. R., Hoekstra, T., Kunst, A. E., Wiers, R. W., & Kuipers, M. A. G. (2020). The use of the alcohol use disorders identification test-consumption as an indicator of hazardous alcohol use among university students. European Addiction Research, 26(1), 1–9. https://doi.org/10.1159/000503342
- Volkow, N. D., Ma, Y., Zhu, W., Fowler, J. S., Li, J., Rao, M., Mueller, K., Pradhan, K., Wong, C., & Wang, G. J. (2008). Moderate doses of alcohol disrupt the functional organization of the human brain. Psychiatry Research, 162(3), 205–213. https://doi.org/10.1016/j.pscychresns.2007.04.010
- White, A., & Hingson, R. (2013). The burden of alcohol use: Excessive alcohol consumption and related consequences among college students. Alcohol Research: Current Reviews, 35(2), 201–218.
- Wickham, H., & Chang, W. (2016). Package ggplot2: An implementation of the grammar of graphics. Create Elegant Data Visualisations Using the Grammar of Graphics, 2(1), 1–189.
- Wicki, M., Kuntsche, E., & Gmel, G. (2010). Drinking at European universities? A review of students’ alcohol use. Addictive Behaviors, 35(11), 913–924. https://doi.org/10.1016/j.addbeh.2010.06.015
- Wood, S. N. (2017). Generalized additive models: An introduction with R. In Generalized additive models: An introduction with R. Publisher CRC Press, Boca Raton, FL. (2nd ed).
- Zhou, J., O’Brien, K. S., & Heim, D. (2014). Alcohol consumption in sportspeople: The role of social cohesion, identity and happiness. International Review for the Sociology of Sport, 49(3-4), 278–293. https://doi.org/10.1177/1012690213493105