
Abstract
The challenges of working with hygroscopic pharmaceutical raw materials can have a significant impact on the industry’s ability to make high-quality medicines. In order to mitigate the impact to the manufacturing process or product quality it is critical to understand the hygroscopicity of the raw materials across the entire supply chain so that the proper management strategies can be implemented, from the raw material manufacturing to the use of the raw material in the drug manufacturing process. Employing suitable controls protects these materials from physical and chemical changes due to moisture uptake such as caking or hydrolysis. We have developed a fit for purpose and data-driven approach to hygroscopicity classifications of over 200 commonly used chemicals, excipients, media and resins in drug manufacturing processes. Dynamic vapor sorption data is presented with supporting thermal gravimetric analysis and X-ray powder diffraction data where pertinent. Approximately 60% of all raw materials tested were determined to be hygroscopic. Strategies for applying this data to reduce the potential impact of hygroscopic materials on the manufacturing of pharmaceuticals are discussed with examples.
Introduction
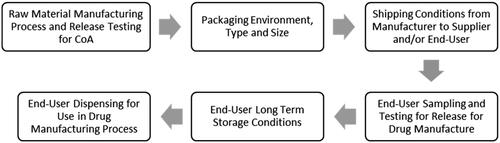
High quality chemicals, excipients, cell culture media and chromatography resins are crucial to successful manufacturing of drug substance (DS) and drug product (DP) in the pharmaceutical industry. To ensure that these raw materials are suitable for DS and DP manufacturing, quality control measures are required throughout the supply chain during the manufacturing and packaging of these raw materials as well as shipping, sampling, long-term storage and dispensing (). One attribute of these raw materials that must be considered throughout this process is hygroscopicity or the propensity for the material to readily take up and retain moisture. An increase in moisture content in a raw material may cause physical (e.g. caking, deliquescence, color change, crystal form change), chemical (e.g. hydrolysis) or purity (e.g. assay, water content) changes rendering the material unsuitable for the drug manufacturing process. Therefore, it is important during drug development to have a clear picture of each raw material’s hygroscopicity and the risks associated with moisture uptake to the raw material attributes, the drug manufacturing process, and ultimately to the ability to meet the target product profile. Hygroscopic raw materials with a risk of impact to the DS or DP need to be identified to enable mitigations to be put in place to avoid exposure to moisture and ensure product quality.
Figure 1. Focus points in the supply chain for hygroscopic raw material controls.
One common source of information for hygroscopicity is the raw material safety data sheets or product data sheet from the raw material manufacturer or supplier. However, this information is often contradictory, vague or not listed (which could mean the material is not hygroscopic or it is unknown) and no references are provided. Literature sources may offer a more detailed hygroscopicity analysis, however the analytical methods used to determine hygroscopicity may be variable between sources or not fit-for-purpose. Murikipudu et al determined the hygroscopicity of 30 inactive and 10 active pharmaceutical ingredients by 3 different methods showing that the hygroscopicity classification can vary with the method employed (Murikipudi et al. Citation2013). Additionally, most literature focuses on the hygroscopicity of excipients used for tableting and active pharmaceutical ingredients, and only those in powder form (Callahan et al. Citation1982; Visalakshi et al. Citation2005; Murikipudi et al. Citation2013). Included in this research are raw materials used in synthetic and biologic drug manufacturing which includes a wide variety of excipients, chemicals and media that may be in solid or liquid form. Similarly, different manufacturers (or different lots from the same manufacturer) of the same raw material may have variable hygroscopicity due to alterations in physical properties such as particle size, crystallinity or porosity (Bronlund and Paterson Citation2004; Sun Citation2011). To avoid these discrepancies and ensure the proper control of raw materials used in our processes we developed a data-driven hygroscopicity classification system, utilizing dynamic vapor sorption (DVS) analysis and the European Pharmacopeia hygroscopicity criteria, that is applicable to the temperature and humidity conditions the materials are exposed to throughout the supply chain. Thermal gravimetric analysis (TGA) and X-ray powder diffraction (XRPD) were used as supporting analytical techniques to ensure accurate interpretation of the DVS data. The results for over 200 raw materials are presented and discussed.
Utilizing the results of this data-driven approach, the hygroscopicity classifications were updated on all internal raw material specifications and general handling recommendations were made to ensure the proper management of all hygroscopic raw materials within our network. We then conducted individual risk assessments for each hygroscopic raw material to identify those materials at high risk of impacting a manufacturing process or drug product due to moisture uptake and implemented additional preventative mitigations where needed. These mitigations, such as establishing the appropriate raw material specification, collaborating with the supplier to ensure proper handling and storage of the material or even suggesting non-hygroscopic alternatives, are discussed with case studies to emphasize the importance of understanding raw material attributes such as hygroscopicity.
Materials and methods
Over 200 raw materials were selected for analysis as they are commonly used in the drug manufacturing process as chemicals, excipients, media or resins. All raw materials were procured from certified commercial sources. Brand names are provided in the tables where available to help clarify the material grade and source.
Moisture sorption data to determine the hygroscopicity classification was collected using a DVS Endeavor (Surface Measurement Systems) dynamic vapor sorption (DVS) analyzer. Samples (∼100 mg) were evaluated in an aluminum pan by equilibrating at 30% RH (equilibration set to a dm/dt of 0.001% wt/min with a minimum of 10 min and maximum of 3 h), then an intermediate step at 65% RH (equilibration set to a dm/dt of 0.001% wt/min with a minimum of 10 min and maximum of 3 h) then the final hold at 80% RH (for 24 h) at 25 °C with a nitrogen flow rate of 500 sscm. Equilibrium was not always achieved during this final 24 h hold. The increase in mass from the end of the 30% RH step to the end of the 80% RH step was used to assign the hygroscopicity classification (‘H-1′ to ‘H-4′) according to unless otherwise noted in the result tables. The qualitative term of ‘hygroscopic materials’ used in this manuscript includes materials classified as hygroscopic (H-3) or very hygroscopic (H-4). Since the end of the 30% RH step is the zero point (or baseline), any weight loss/gain recorded during the 30% RH step is additive to the weight gain at 80% RH. In some cases (evaporative liquids), the experiment was started at 80% RH as noted in the data tables to avoid evaporation at lower humidity.
Table 1. Hygroscopicity classification.
Follow-up DVS experiments were collected using a DVS Endeavor or DVS Advantage DVS analyzer. Samples were evaluated as above but from 40% to 95% RH in 5% RH steps (equilibration set to a dm/dt of 0.002% wt/min with a minimum of 10 min and a maximum of 360 min) at 20, 25, 30, 35, 40 or 50 °C.
X-ray powder diffraction (XRPD) data were obtained using a PANalytical X’Pert PRO diffractometer. Samples were scanned at ambient temperature in continuous mode from 5 to 45 degrees (2θ) with step size of 0.0334 degrees at 45 kV and 40 mA with CuKα radiation (1.54 Å). The incident beam path was equipped with a 0.02 rad soller slit, 15 mm mask, 4 degrees fixed anti-scatter slit and a programmable divergence slit. The diffracted beam was equipped with a 0.02 rad soller slit, programmable anti-scatter slit and a 0.02 mm nickel filter. Samples were prepared on a low background sample holder and placed on a spinning stage with a rotation time of 2 s.
Thermal gravimetric analysis (TGA) was performed on a TA Instruments Discovery Series analyzer at 10 °C/min from ambient temperature to the temperature indicated in the data tables in a platinum pan under dry nitrogen at 25 mL/min. The upper temperature is variable as it was decreased to avoid material degradation which was causing instrument interference in subsequent experiments. A consequence of this is that the theoretical water content of some of the hydrates does not align with the TGA weight loss as discussed in the results section.
Particle size distribution (PSD) was determined by laser diffraction on the Sympatec HELOS/BF with a RODOS/M disperser equipped with the ASPIROS powder feeder. At least 100 mg of the sample powder was added to the glass dispersing tube and capped. Disperser injection diameter was 4 mm and the powder feed rate was 50 mm/s. The primary dispersing pressure was 2 bar and analysis was set for ‘2 s real time’ on the R5 lens.
Polarized light microscopy (PLM) photomicrographs were taken using a Nikon LV100 polarized light microscope, equipped with a Nikon Digital Camera Sight DS-Fi2. NIS Elements Documentation software was used to capture the photomicrographs and apply the scale bar. Samples were dispersed as dry powders on a microscope slide and examined under transmitted polarized light.
Results
The percent weight change on DVS at 25 °C/30% RH, 25 °C/65% RH and 25 °C/80% RH for over 200 common raw materials are presented in separated by the categories of excipients, chemicals, media, hydrates, amino acids, liquids and resins respectively. These categories are used solely for ease of presentation and discussion as many materials could fall into more than one of these categories. The crystallinity of the material by XRPD and the weight loss by TGA prior to DVS analysis is also included in . The crystallinity description is provided as a very general description of the material based on an XRPD experiment. The description of ‘crystalline’ indicates that the diffraction pattern had distinct peaks indicating a mostly crystalline material while the description ‘amorphous’ indicates that the diffraction pattern was a broad halo with no distinct peaks. Identification of the specific polymorph(s) and/or content of amorphous phases would require further experimentation beyond the scope of this study but may provide valuable insights for interpreting hygroscopicity variation between suppliers or batches as differences in crystallinity can impact hygroscopicity. The crystallinity after the DVS analysis is indicated in as determined by XRPD (spectra pre-DVS and post-DVS is the same or different) or by visual observance (materials that have partially or fully deliquesced to a liquid). Where materials were analyzed more than once each analysis is listed separately to show the reproducibility of the measurements.
Table 2. Data supporting hygroscopicity classification of excipients.
Table 3. Data supporting hygroscopicity classification of chemicals.
Table 4. Data supporting hygroscopicity classification of hydrates.
Table 5. Data supporting hygroscopicity classification of amino acids.
Table 6. Data supporting hygroscopicity classification of media.
Table 7. Data supporting hygroscopicity classification of liquids.
Table 8. Data supporting hygroscopicity classification of resins.
Excipients
Materials commonly used as excipients in synthetic or biologic formulations are shown in . The majority of these excipients are intended for use in an aqueous parenteral formulation or intended to dissolve upon oral dosing in the aqueous environment of the gut or intestines, which indicates that the materials have suitable water solubility for this purpose. Therefore, since like dissolves like and water is polar, it is expected that the majority of these excipients would have polar functionalities and therefore the propensity to be hygroscopic depends on the arrangement and availability of these groups to the water vapor (Newman et al. Citation2008). Disordered amorphous excipients such as carboxymethylcellulose sodium, copovidone and hydroxypropyl methylcellulose have more molecular movement rendering them more susceptible to water uptake than crystalline counterparts. Many excipients experience weight loss with an increase in temperature by TGA, this indicates that the materials may contain moisture of hydration, surface moisture or other volatiles or that the material undergoes degradation upon heating. As no significant weight loss was seen for any of the excipients during the equilibration step at 25 °C/30% RH during the DVS experiment, any moisture is considered inherent to the materials as received (as opposed to excess moisture absorbed upon storage or exposure to the environment during sample preparation) and therefore a suitable baseline for the hygroscopicity classification. For example, the TGA of sodium stearyl fumarate indicates a 3% weight loss by 150 °C. It has been shown by Shrestha et al that this material is partially hydrated (∼0.6 eq) in its commercial form and that this hydrated form is not hygroscopic as is confirmed in this experiment (Shrestha et al. Citation2021). Magnesium stearate has been shown to contain 4.8 or 6.1% water as received from two different commercial sources (Dubinsksaya et al. Citation2010). The material used in this study, from a third commercial source, likely contains only 3.6% water based on the weight loss on TGA to 125 °C. These values are similar to or less than the stoichiometric dihydrate at 5.7% water. Similarly, for β-cyclodextrin research has shown between 9 and 12 water molecules (12.5–16.0% by weight) associated with the crystal lattice, which is in line with 12.5% weight loss seen on TGA and the 3.1% increase in weight during the DVS experiment (Pereva et al. Citation2019). Classification of these materials as hygroscopic could vary with differences in the experimental conditions and the water content as received. This emphasizes the importance of both aligning the experimental conditions with how the data will be used and analyzing a representative sample. Citric acid shows variability in the weight change at 25 °C/80% RH (16.6%, 45.9% and 10.4% wt) between measurements and between lots. This material partially deliquesced (became a liquid-solid mixture) at 80% RH based upon visual assessment at the end of the experiment. Lafontaine et al determined the hydration point (monohydrate with 9.4% theoretical water content) for citric acid at 25 °C to be 73.4–74.3% RH and the critical point of deliquescence to be 76.9% RH (Lafontaine et al. Citation2013). With 80% RH being just above the critical point of deliquescence, the extent of this liquid layer coating and dissolving the solid sample is likely leading to the variability in weight increase prior to reaching equilibrium at the end of the experiment.
Chemicals
Results for over 70 chemicals commonly used in synthetic or biologic drug manufacture are listed in . Similar to the excipients, the hygroscopic chemicals are water soluble as they are mostly used in aqueous buffers for chromatography or in cell culture and/or are highly water-soluble chloride, citrate or sodium salts. Therefore, it is expected that these chemicals could have a propensity to take up water. A few chemicals show weight loss by TGA but are not classified as hygroscopic based on the DVS data. For most materials the water is inherent to the material as received from the supplier as a hydrated material therefore the material was in the appropriate state for DVS analysis to determine the hygroscopicity classification. For example iron(III) citrate was purchased as the monohydrate form which has a 6.8% theoretical water content and the material lost 8.1% weight by TGA to 150 °C and folic acid was shown by Yang et al. to have 2 equivalents of water or 7.5% wt by glass-pan Karl Fisher titration which aligns with the weight loss on TGA (Gong et al. Citation2012). For other materials, such as niacinamide, the majority of the weight loss on TGA of 4.1% to 175 °C is likely due to volatilization of the material itself. Almeida-Muradian et al showed that the melting point of niacinamide is 130–133 °C followed by volatilization from 140 °C to 260 °C (Moreschi et al. Citation2009). It is important to understand the origination of the weight loss during heating to not misinterpret the material as holding excess moisture.
Hydrates
The TGA data and theoretical water content for over 30 hydrates is included in . This data was used to supplement the DVS data to ensure that the material was in the proper hydrated form prior to the experiment. The majority of the weight loss by TGA is in line with the theoretical water content with a few exceptions described below. For cupric sulfate pentahydrate, dicalcium phosphate dihydrate, magnesium sulfate monohydrate and sodium phosphate dibasic dihydrate or heptahydrate the weight loss observed with TGA is less than the theoretical hydrate form. It is likely that the TGA experiment was not run to a high enough temperature to remove all the water. For example, cupric sulfate pentahydrate weight loss on TGA is 26.3% to 150 °C, but the theoretical water content for the pentahydrate is 36.0%. Instructions for loss on drying (LOD) testing in the USP monograph instruct for the material to be heated at 250 °C to a constant weight indicating a higher temperature is required to fully dehydrate the material (United States Pharmacopeia and National Formulary (USP43-NF38) Citation2021). Similarly, dicalcium phosphate dihydrate weight loss on TGA is only 4.8% to 165 °C, but theoretical water content for the dihydrate is 20.9%. Literature shows that one water for two molecules of dicalcium phosphate is lost at 110 °C, then the remaining water is lost at >165 °C which is outside the limit of our TGA experiment (Miyazaki et al. Citation2009).
The initial DVS conditions of 25 °C/30% RH were selected to provide a condition where the majority of materials would not absorb or lose moisture, however a few of the hydrates partially dehydrated during this step. Sodium phosphate dibasic heptahydrate lost 11.2% weight during the equilibration step on the DVS which was gained back at 80% RH. Since the material was simply rehydrating it was not classified as hygroscopic. The same rational was applied for the sodium phosphate dodecahydrates (dibasic and tribasic) and magnesium sulfate heptahydrate.
Amino acids
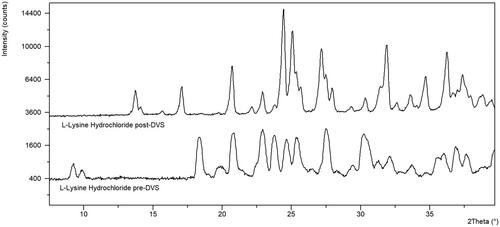
The majority of the free amino acids evaluated, other than arginine and proline, are not hygroscopic and do not show any significant weight loss by TGA (). The non-hygroscopic nature of these free amino acids is aligned with the work of Mellon and Hoover who also show these amino acids to be non-hygroscopic (Mellon and Hoover Citation1951). They suggested that the polar groups of these molecules must be coordinated in the crystal lattice in a way that makes them unavailable to interact with water molecules. Two of the hydrochloride salt forms, L-cysteine dihydrochloride and L-lysine hydrochloride, were confirmed to undergo a crystal form change by XRPD ( and ). These materials were classified as hygroscopic, regardless of the crystal form change, to ensure that the materials are protected from moisture to avoid this form conversion. L-cysteine hydrochloride monohydrate and l-cysteine dihydrochloride appear similar post-DVS by XRPD indicating that there may be some displacement of hydrochloride occurring during the DVS of L-cysteine dihydrochloride.
Figure 2. XRPD of L-cysteine dihydrochloride and L-cysteine hydrochloride monohydrate pre and post-DVS.
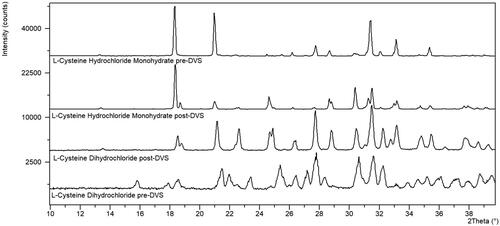
Figure 3. XRPD of L-lysine hydrochloride pre-DVS and post-DVS.
Media
Powder media are dry blended mixtures of ingredients commonly used in cell culture, such as amino acids, vitamins, salts, sugars and trace elements (). For confidentiality reasons the exact components and their ratios cannot be provided therefore these were named Media 1 – Media 12. TGA data is not shown as it provides little added value to the DVS measurements since the media are complex mixtures and many of the components are hydrated. A few common powder media and media components are also included in this table. The majority of the media and media components are very hygroscopic with most increasing in weight even at 25 °C/65% RH and some even at the lowest tested humidity of 25 °C/30% RH. This was expected considering the percentage of the media components that are classified as H-3 or H-4. A description of how this information was used to classify over 80 powdered media can be found in the discussion.
Liquids
The application of DVS to determine hygroscopicity of liquid samples is less common than for solid samples likely due to the complexity introduced by evaporation. The DVS data for 12 liquids is shown in . As the DVS experiment is run under a nitrogen stream, it is likely that evaporation of some liquids could occur during the experiment due to the surface of the liquid being exposed to fast moving gas with low to moderate humidity, especially for the lower viscosity liquids such as dimethyl sulfoxide (DMSO), dimethylformamide (DMF) and methanesulfonic acid (MSA) (Magin and Randall Citation1960; LeBel and Goring Citation1962; Roitman et al. Citation1994; Alam et al. Citation2019). Therefore, these materials were analyzed starting at 80% RH rather than 30% RH to minimize the effect of evaporation influencing the results. Additionally, the weight change noted in the table for DMF and MSA is the maximum weight before weight loss started to occur rather than the 24 h time point. This was sufficient data to determine these liquids are hygroscopic at 25 °C/80% RH. Additionally, work by LeBel and Goring confirm the hygroscopicity of DMSO (and glycerol) using saturated salt solutions in closed vessels thereby minimizing concern for evaporation (LeBel and Goring Citation1962). Work by Roitman et al confirms the hygroscopicity of MSA (10% mass gain in 25 min) when 3 droplets were openly exposed to room conditions (24 °C/30% RH) (Roitman et al. Citation1994). The remaining liquids are higher in viscosity, or resistant to flow, which is indicative of strong intermolecular forces of attraction reducing the likelihood of evaporation during the experiment. Results show that many common solvents and liquid excipients used in drug manufacturing process are hygroscopic or very hygroscopic under these experimental conditions. This is expected as these are polar liquids that are miscible with water. Work by Arand et al for a series of surfactants, where they collected full water sorption isotherms from 0 to 95%RH using a comparable vapor sorption instrument, confirms the water sorption at 80%RH, for glycerol (∼100% by weight), polysorbate 20 (∼25–30% by weight) and polysorbate 80 (∼20% by weight) (Arand et al. Citation2016). The values by Arand et al are higher than this work possibly due to the differences in the drying step and the equilibration settings.
Similar work has been conducted with room temperature ionic liquids (RT-IL) (organic cation and either an organic or an inorganic anion that are liquids at room temperature), which are viscous liquids used as solvents or catalysts for synthetic reactions or are salts of active pharmaceutical ingredients (API) created to improve dissolution rate, solubility and ultimately bioavailability of the API (Fatyeyeva et al. Citation2015; Meinel et al. Citation2015; Shaw et al. Citation2016). These studies, using either a comparable vapor sorption instrument or closed vial with nitrogen flow and Karl Fischer water determination, have shown that both protic and aprotic RT-ILs are hygroscopic. However, the upper limit of water sorption is much higher for the hydrophilic, water miscible RT-ILs. These studies have also shown by infrared spectroscopy that water interacts with the bulk in water-miscible RT-ILs, but for water-immiscible RT-ILs water interacts mainly with the surface ions (Fatyeyeva et al. Citation2015; Shaw et al. Citation2016).
Resins
Most chromatography resins are supplied as suspensions in ethanol/water and are therefore classified as non-hygroscopic without the need for DVS analysis. The four resins in are supplied as dry powders. The DVS analysis shows that these powder resins are only slightly hygroscopic to borderline hygroscopic indicating that extensive mitigations are not needed to protect these resins from moisture.
Discussion
Determining the hygroscopicity of the raw materials used for DS and DP manufacture allows the industry to apply proper shipping, storage, and handling controls for hygroscopic materials. The consequences of mishandling these materials include physical and chemical stability issues such as clumping or hydrolysis, or failed release testing such as water content, loss on drying (LOD), assay or appearance (color, clumping, droplets on the packaging liner) or an inaccurate concentration of the material used in the manufacturing process due to increased moisture content not accounted for during material dispensing. These issues cause delays to manufacturing runs, which costs both time and money due to lengthy investigations into the root cause of the failed release specification. This can ultimately result in failure to supply drug to patients. In addition, it can lead to worker safety concerns due to the action of lifting and breaking up clumped material.
Challenges with previous approach to categorizing hygroscopic materials
Prior to implementing this raw material hygroscopicity classification platform, there was no consistent approach to quantifying hygroscopicity, only 24% of our raw materials were classified as hygroscopic or very hygroscopic and 48% of the materials were not classified at all. For those materials that were classified the sources were supplier safety data sheets, journal articles and visual observation which are all valid sources, but they have their drawbacks including lack of consistency, relevancy and accuracy as described below.
A common source for determining the hygroscopicity of raw materials is the supplier safety data sheets (SDS). The SDS is typically qualitative indicating that the material is ‘hygroscopic’ or, it may have no mention of hygroscopicity, which could indicate that the hygroscopic nature of the material is unknown or that it is not hygroscopic. In addition, the SDS does not include references with any data to support the hygroscopicity determination. This can lead to materials being classified as hygroscopic that do not need to be based on how they are used and stored. We determined that there was a need to develop a consistent robust quantitative classification system based on referenced data that could be used across all raw materials. For example many safety data sheets indicate potassium phosphate monobasic as being hygroscopic; however, Luber and Schönherr indicate that the point of deliquescence for potassium phosphate monobasic is 97% RH and Jančaitienė and Šlinkšienė show that granulated potassium phosphate monobasic (2–3.15 mm particle size, 1.26% moisture content) over NaNO2 (20–22 °C and 73–75% moisture) increased in weight by only 0.32% after 100 h, but over water (20–22 °C and 96–98% moisture) the increase in weight was ∼20% after 100 h (Schonherr and Luber Citation2001; Jancaitiene and Slinksiene Citation2020). Similarly, in this study potassium phosphate monobasic is not hygroscopic at 25 °C/80% RH (). Based on this data, the classification of non-hygroscopic is appropriate for our purpose as the material is not likely to be exposed to ≥ 96% RH during the packaging, shipping, sampling, dispensing and long-term storage before use in the drug substance manufacturing process. Despite the hygroscopic point of potassium phosphate monobasic being at such a high humidity, caking of this material can remain an issue possibly due to other particle interactions (Zafar et al. Citation2017). A similar situation was encountered for spermine tetrahydrochloride, where the supplier safety data sheet indicates the material as hygroscopic however the material did not increase in weight at 25 °C/80% RH and it was shown in subsequent internal DVS testing to be non-hygroscopic to 25 °C/90% RH with only a 0.07% increase in weight and slightly hygroscopic at 25 °C/95% RH gaining 1.7% weight in 6 h. It is important to note that equilibration had not been reached at 95% RH in this experiment indicating that spermine tetrahydrochloride could absorb more than 1.7% moisture over time at this high humidity. The design of the DVS analysis provides a fit-for-purpose hygroscopicity classification for these materials possibly alleviating the need for extensive moisture controls.
A more reliable source for hygroscopicity classification is journal articles with analytical data to show the hygroscopicity of the material with detailed method descriptions, however this does not provide a direct comparison of all raw materials used at Amgen and the literature data could be misleading or not fit-for-purpose if the data is not applied appropriately to how the material will be received from the supplier and handled once received. For instance, the material hygroscopicity could be misclassified as higher if the material is dried prior to analysis. Also, if the material is only hygroscopic at very high humidity (which the material will not see throughout the supply chain), applying increased shipping and handling precautions could be a waste of time and money for that material. For example, Callahan et al as well as Ertel and Cartensen indicate magnesium stearate dihydrate to be non-hygroscopic which aligns with this work (Callahan et al. Citation1982; Ertel and Carstensen Citation1988). However, magnesium stearate dihydrate was determined to be hygroscopic by Dubinskaya et al due to moisture uptake from 3 to 80% RH of about 5% wt and from 3 to 98% RH of approximately 30% wt (Dubinsksaya et al. Citation2010). The method description does not detail how this experiment was conducted however it is possible that the material dehydrated at the starting relative humidity of only 3%, therefore the hygroscopicity determination may be relevant to the anhydrous form of magnesium stearate rather than the hydrated material as received from the supplier. This emphasizes the importance of employing a single approach to all materials, evaluating the method used to determine the hygroscopicity of the material and understanding how to apply the results for the intended purpose. Murikipudi et al presented a comparison of three analytical methods commonly used in the literature to determine hygroscopicity (termed the conventional method, EP method and water vapor sorption analysis method) showing how the hygroscopicity classifications could be quite different depending on how the analysis was conducted and how the materials are classified based on the results (Murikipudi et al. Citation2013). The water vapor sorption analysis method proposed by Murikipudi et al is similar to the method utilized in this work, therefore when comparing the weight increase by vapor sorption at 25 °C/80% RH for 24 h for 16 excipients the results are aligned () with the exception of poloxamer 188 (1.2% vs 11.0%). The data for poloxamer 188 was more aligned when studied by Murikipudi et al using the conventional method and the EP method (2.7% wt at 25 °C/83% RH for 7 days or 0.2% wt at 25 °C/80%RH for 24 h respectively).
Table 9. Comparison of vapor sorption data for excipients with Murikipudi et al.
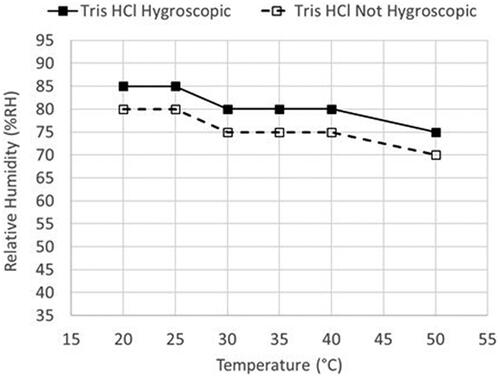
Visual observation of a raw material, as the material travels throughout the supply chain, is an important supplemental tool when evaluating a materials hygroscopicity. While this source of information is certainly subjective and qualitative, when combined with analytical data the input can be critical. We found this to be the case in our assessment of tris(hydroxymethyl)aminomethane (TRIS) hydrochloride. The material from supplier 1 did not absorb moisture during the initial DVS experiments to 25 °C/80% RH. However, the material is known to occasionally pick up moisture on long term storage at ambient conditions internally. To further investigate TRIS hydrochloride, samples from a second and third supplier (each supplier run in duplicate) were analyzed by DVS using smaller %RH steps and ending at a higher relative humidity. The material from supplier 2 and 3 gained 0.09 ± 0.08% weight at 25 °C/75% RH and 13.37 ± 0.73% weight at 25 °C/80% RH. Since the material from supplier 1 was not hygroscopic at 25 °C/80% RH, but the material from supplier 2 and 3 was hygroscopic at this same condition, this may indicate that the temperature and humidity conditions are near the critical point between hygroscopic and non-hygroscopic. To investigate this further, the TRIS hydrochloride from supplier 1 was analyzed at higher and lower temperatures on the DVS from 40 to 95% RH to determine the line between hygroscopic and non-hygroscopic. The data shows () that material from supplier 1 is hygroscopic with either a small increase in temperature (30 °C/80% RH) or humidity (25 °C/85% RH). This shows that while the DVS method selected to analyze the raw materials was suitable to classify the majority of materials, a higher temperature may be needed to encompass the range of temperatures that the raw materials may be exposed to throughout the supply chain. Similar work was conducted for TRIS base where it was shown by DVS to be hygroscopic at 25 °C/95% RH or 35 °C/90% RH.
Figure 4. TRIS Hydrochloride (from supplier 1) temperature and relative humidity hygroscopicity limits.
Another caveat with using literature data to assign hygroscopicity is that the material analyzed in the literature could have different physical properties such as particle size, pore size or crystallinity that could render it more or less hygroscopic than the material being used internally to manufacture DS or DP (Bronlund and Paterson Citation2004; Sun Citation2011). For instance, dextrose shows reproducible variability in the weight increase at 25 °C/80% RH for 24 h between suppliers () where the material from supplier 1 (lot 1 and lot 2) would be classified as slightly hygroscopic (H-2) and the material from supplier 2 would be classified as hygroscopic (H-3) under these conditions. The XRPD analysis () shows that the anhydrous dextrose from both supplier 1 and supplier 2 is converting to the dextrose monohydrate during the DVS experiment. The sample from supplier 2, with the higher weight increase, shows further conversion to the monohydrate as noted by the decrease in intensity of the peaks at 17.3 and 28.5° 2Theta and the increase in the peak at 9.5 and 13.0° 2Theta. The theoretical monohydrate would be 9.3% indicating that the material conversion to the monohydrate was less than 50% complete. Additionally, the dextrose from both suppliers did not reach equilibrium during the final 24 h hold on the DVS indicating that given enough time, both supplier materials would be considered hygroscopic at 25 °C/80% RH. To determine if physical properties could be the cause of variability in the moisture uptake kinetics the materials were also analyzed by laser diffraction and polarized light microscopy. No significant differences in crystallinity were identified by XRPD (), however particle size as seen by microscopy () and laser diffraction () represented by the D4,3 was smaller, 197.04 µm vs 221.20 µm, for the material from supplier 2. While these methods are not optimized or validated it can be theorized that the smaller particle size could lead to faster uptake of moisture for supplier 2 due to the increase in surface area exposed to the moisture. Additionally, there could be variable amorphous content that was not detectable by XRPD attributing to the difference in water sorption rates. This highlights the importance of understanding the physical properties of the raw materials in use in drug manufacturing and how changing suppliers can impact the materials hygroscopicity classification. In this instance, dextrose is classified as an H-3 regardless of supplier to account for the worst case during long term storage.
Figure 5. XRPD of dextrose from supplier 1 (0.6% wt) and supplier 2 (4.2%wt) before (pre-DVS) and after the DVS experiment (post-DVS) in comparison with dextrose monohydrate.
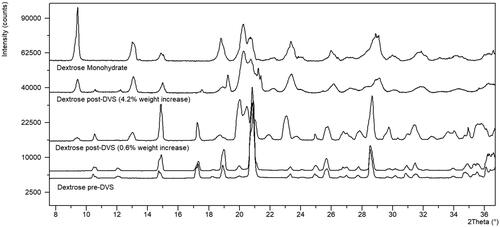
Figure 6. Polarized light microscopy of dextrose from (A) supplier 1 and (B) supplier 2 (scale bar = 100 µm).
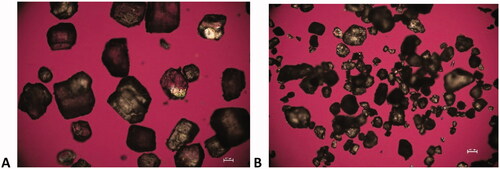
Table 10. Particle size distribution of dextrose from supplier 1 and supplier 2.
Current application of hygroscopicity classifications and risk mitigation for hygroscopic materials
With the application of this work we have identified that a little over 60% of our raw materials are hygroscopic (H-3) or very hygroscopic (H-4) under the conditions they may be exposed to throughout the supply chain. This is a 2.5-fold increase from the prior state indicating significant improvement in our understanding of the need for proper handling controls both in collaboration with our suppliers and internally. The hygroscopicity classifications provided the basis for a holistic risk analysis for each hygroscopic material to evaluate impact to the DS or DP. Also, special considerations were implemented for cell culture media as described below.
Our manufacturing sites receive hundreds of shipments of hygroscopic raw materials every year; therefore, understanding the impact of moisture uptake and implementing controls is crucial to maintaining the quality of our supply. Integration of this knowledge into the supply chain has led to a decrease in out-of-specification results and reduced the observed clumping of the materials. The hygroscopicity classifications are used in collaboration with suppliers to update packaging conditions (environmental controls), packaging configurations (pack size, special drum liners, desiccants) and shipping conditions (controlled temperature or humidity) to protect the material from moisture before it is received. This has enabled us to proactively implement several mitigation practices to reduce exposure of the materials to moisture. Some suppliers are qualified to provide tailgate samples (defined here as a sample that is representative of the entire batch) or a side sample (defined here as a sample that is representative of a single drum) for release testing. This alleviates the need for opening the drums for sampling once received which decreases the exposure of the material to moisture in the environment. Internally, the classification is included on the raw material specifications so that the material is sampled, tested and dispensed under the appropriate environmental conditions. For example, sampling for water testing is done quickly, done first and as a separate aliquot from the rest of the release testing to ensure the container is opened a minimum number of times prior to analysis. Additionally, sampling, testing and dispensing are conducted in environmentally controlled or monitored locations and in some cases an inert gas overlay is applied to ensure a dry atmosphere inside the container.
The hygroscopicity ratings are also used as part of a holistic risk analysis for each material to determine if moisture content is a critical attribute that could impact the DS or DP manufacturing process. Just because the raw material is hygroscopic does not mean that a release test for water is required. For instance, if the material is hygroscopic at 25 °C/80% RH, but not at 25 °C/65% RH, has had no issues with moisture uptake in the past and is dissolved in water as a buffer component before used in the manufacturing process there is low risk to impact to the process and therefore no need to include a water specification in the testing of this material. However, if a material is hygroscopic and will be used in a dry granulation process, a water release specification could be critical because it would impact the final moisture content of a tablet. Betaine is an example of a very hygroscopic material where multiple mitigations were put in place to protect this material from moisture. The water specification for betaine was the same both internally and at the supplier and material lots were typically received from the supplier at the upper limit for this attribute. Therefore, when moisture uptake occurred between the sampling for water testing at the supplier and release testing in our quality control labs, the results were above the specification limit. Employing our hygroscopicity classification platform betaine was classified as very hygroscopic (H-4) and upon further review of the DVS raw data it was shown to absorb moisture at ∼4.8% by weight per hour at 25 °C/65% RH causing an open container to quickly exceed the water specification. To avoid these out of specification results a risk assessment was conducted which determined that the drug substance manufacturing process would not be significantly impacted by a small increased moisture content in betaine, therefore the internal water specification was increased providing a window between the supplier release testing and internal release testing. Additionally, controls were put into place at the supplier to ensure the material was packaged in an environmentally controlled space, that the water testing was conducted at the time of packaging and that side samples were provided with each drum alleviating the need to open the bulk drum of material upon receipt for release testing. Another mitigation strategy considered for betaine was to replace this hygroscopic material with a non-hygroscopic alternative such as betaine hydrochloride (). If this is done early enough in development it allows the teams to consider a non-hygroscopic alternate for use in the drug manufacturing process thereby avoiding the complications that come with hygroscopic raw materials all together.
Cell culture media is a class of raw materials that were known to be hygroscopic, but the extent of hygroscopicity had not yet been realized prior to this work. Over 80 different powder cell culture media raw materials were in scope of this project. Most of these media contain a large portion of the same components, just at differing ratios, and those components had already been analyzed by DVS as part of this work. Therefore, for those media whose composition was known, a paper exercise was conducted where the hygroscopicity and % by weight of each media component was tabulated, then the total % by weight of H-3 and H-4 media components combined was used to classify the hygroscopicity of the media by comparing to the DVS analysis of 5 media with known compositions (). Even the media with the lowest composition of hygroscopic components (6.3%) was very hygroscopic by DVS absorbing 30.5% weight after 24 h at 25 °C/80% RH. This paper exercise resulted in 96.4% of the powder media being classified as very hygroscopic (H-4). The major challenges with hygroscopic media are caking and appearance changes. Media, because of its complex mixture of colored components, can undergo color changes upon moisture uptake and this can lead to an out of specification result during release testing for appearance. For example, a powder nutrient feed medium with an appearance specification of ‘tan to brown’ failed its release specification when the material changed color to ‘light red or pink’. In this case a time consuming investigation was conducted which determined that the color change occurred between 25 °C/17.5% RH and 25 °C/20% RH due to hygroscopicity of the overall media and dissolving/spreading of a dark red component. To mitigate the caking and appearance issues this media is stored at a low temperature with desiccants to maintain low moisture levels.
Conclusion
Vapor sorption data for over 200 pharmaceutical raw materials was provided and utilized to classify the hygroscopicity of each material based on the European Pharmacopeia hygroscopicity descriptions. Application of this data to mitigate moisture uptake for hygroscopic materials throughout the supply chain was discussed including proposing non-hygroscopic alternate materials during early development, establishing the raw material specification appropriately, collaborating with suppliers to ensure quality and implementing proper handling and storage of the materials. By increasing the awareness of the hygroscopicity of our raw materials we have decreased the occurrence of clumping issues, improving the ergonomics of handling these materials, and decreased the occurrence of out of specification release testing saving significant time and cost of investigations.
| Abbreviations | ||
| DS | = | Drug Substance |
| DP | = | Drug Product |
| DVS | = | Dynamic Vapor Sorption |
| TGA | = | Thermal Gravimetric Analysis |
| XRPD | = | X-ray Powder Diffraction |
| PSD | = | Particle Size Distribution |
| PLM | = | Polarized Light Microscopy |
| RH | = | Relative Humidity |
| EP | = | European Pharmacopoeia |
| USP | = | United States Pharmacopoeia |
Disclosure statement
No potential conflict of interest was reported by the author(s).
References
- Alam MS, Ashokkumar B, Siddiq AM. 2019. The density, dynamic viscosity and kinematic viscosity of protic and aprotic polar solvent (pure and mixed) systems: an experimental and theoretical insight of thermophysical properties. J Mol Liq. 281:584–597.
- Arand K, Asmus E, Popp C, Friedmann AA, Riederer M. 2016. Water sorption isotherms of surfactants: a tool to evaluate humectancy. J Agric Food Chem. 64(26):5310–5316.
- Bronlund J, Paterson T. 2004. Moisture sorption isotherms for crystalline, amorphous and predominantly crystalline lactose powders. Int Dairy J. 14(3):247–254.
- Callahan JC, Cleary GW, Elefant M, Kaplan G, Kensler T, Nash RA. 1982. Equilibrium moisture content of pharmaceutical excipients. Drug Dev Ind Pharm. 8(3):355–369.
- Dubinsksaya VA, Polyakov NA, Suponitskii YL, Dement’eva NN, Bykov VA. 2010. Studies of moisture exchange between stearic acid, calcium stearate and magnesium stearate. Pharm Chem J. 44(2):89–45.
- Ertel KD, Carstensen JT. 1988. An examination of the physical properties of pure magnesium stearate. Int J Pharm. 42(1–3):171–180.
- Fatyeyeva K, Dahi A, Chappey C. 2015. Water sorption properties of room-temperature ionic liquids over the whole range of water activity and molecular states of water in these media. Royal Soc Chem. 5:76927–76938.
- Gong H, Huang T, Yang Y, Wang H. 2012. Purity determination and uncertainty evaluation of folic acid by mass balance method. Talanta. 101:96–103.
- Jancaitiene K, Slinksiene R. 2020. Influence of cellulose additive on the granulation process of potassium dihydrogen phosphate. Chem Ind Chem Eng Q. 26(4):359–367.
- Lafontaine A, Sanselme M, Cartigny Y, Cardinael P, Coquerel G. 2013. Characterization of the transition between the monohydrate and the anhydrous citric acid. J Therm Anal Calorim. 112(1):307–315.
- LeBel RG, Goring DAI. 1962. Density, viscosity, refractive index and hygroscopicity of mixtures of water and dimethyl sulfoxide. J Chem Eng Data. 7(1):100–101.
- Magin GB, Randall LE. 1960. Review of literature on evaporation suppression (Vol. 272). Washington (DC): United States Government Printing Office.
- Meinel L, Balk A, Wiest J, Widmer T, Galli B, Holzgrabe U. 2015. Transformation of acidic poorly water soluble drugs into ionic liquids. Eur J Pharm Biopharm. 94:73–82.
- Mellon EF, Hoover SR. 1951. Hygroscopicity of amino acids and its relationship to the vapor phase water absorption of proteins. J Am Chem Soc. 73(8):3879–3882.
- Miyazaki T, Sivaprakasam K, Tantry J, Suryanarayanan R. 2009. Physical characterization of dibasic calcium phosphate dihydrate and anhydrate. J Pharm Sci. 98(3):905–916.
- Moreschi ECP, Matos JR, Almeida-Muradian LB. 2009. Thermal analysis of vitamin PP Niacin and niacinamide. J Therm Anal Calorim. 98(1):161–164.
- Murikipudi V, Gupta P, Sihorkar V. 2013. Efficient throughput method for hygroscopicity classification of active and inactive pharmaceutical ingredients by water vapor sorption analysis. Pharm Dev Technol. 18(2):348–358.
- Newman AW, Reutzel-Edens SM, Zografi G. 2008. Characterization of the "hygroscopic" properties of active pharmaceutical ingredients. J Pharm Sci. 97(3):1047–1059.
- Pereva S, Nikolova V, Angelova S, Spassov T, Dudev T. 2019. Water inside β-cyclodextrin cavity: amount, stability and mechanism of binding. Beilstein J Org Chem. 15:1592–1600.
- Roitman DB, McAlister J, Oaks FL. 1994. Composition characterization of methanesulfonic acid. J Chem Eng Data. 39(1):56–60.
- Schonherr J, Luber M. 2001. Cuticular penetration of potassium salts: effects of humidity, anions and temperature. Plant Soil. 236(1):117–122.
- Shaw SK, Lucio AJ, Anaredy RS. 2016. Adventitious water sorption in a hydrophilic and a hydrophobic ionic liquid: analysis and implications. ACS Omega. 1(3):407–416.
- Shrestha M, Shi H, Strohmeier M, Medek A. 2021. Investigation of solid dosage form components interaction using orthogonal techniques- discovery of new forms of sodium stearyl fumarate. J Pharm Sci. 110(4):1592–1600.
- Sun J. 2011. The use of dynamic vapor sorption method in the determination of water sorption limit and setting specification for drug substance. Am Pharm Rev. 14(6).
- USP. Cupric Sulfate. In: USP-NF. Rockville, MD; USP; 2022. https://doi.org/10.31003/USPNF_M20700_01_01
- Visalakshi NA, Mariappan TT, Bhutani H, Singh S. 2005. Behavior of moisture gain and equilibrium moisture contents (EMC) of various drug substances and correlation with compendial information on hygroscopicity and loss on drying. Pharm Devel Technol. 10(4):489–497.
- Zafar U, Vivacqua V, Calvert G, Ghadiri M, Cleaver JAS. 2017. A review of bulk powder caking. Powder Technol. 313:389–401.