?Mathematical formulae have been encoded as MathML and are displayed in this HTML version using MathJax in order to improve their display. Uncheck the box to turn MathJax off. This feature requires Javascript. Click on a formula to zoom.
Abstract
For a solid understanding of drug characteristics, in vitro measurement of the intrinsic dissolution rate is important. Hydrodynamics are often emphasized as the decisive parameter influencing the dissolution. In this study, experiments and computational fluid dynamic (CFD) simulations showed that the mixing behavior in the rotating disc apparatus causes an inhomogeneous flow field and a systematic error in the calculation of the intrinsic dissolution rate. This error is affected by both the experimental time and the velocity. Due to the rotational movement around the tablet center, commonly utilized in pharmacopeia methods, a broad variance is present with regard to the impact of fluid velocity on individual particles of the specimen surface. As this is significantly reduced in the case of uniform overflow, the flow channel is recommended for investigating the dissolution behavior. It is shown that rotating disc measurements can be compared with flow channel measurements after adjusting the measured data for the rotating disc based on a proposed, representative Reynolds number and a suggested apparatus-dependent correction factor. Additionally, modeling the apparatus-independent intrinsic dissolution rate for different temperatures in the rotating disc apparatus is possible using the adapted Levich’s equation.
Graphical Abstract
1. Introduction
Intrinsic dissolution testing in pharmaceutical research provides insight into the performance of individual substances, especially during preformulation (Zakeri-Milani et al. Citation2009; Andersson et al. Citation2021). The heterogeneous dissolution process is the transformation of a solute from the solid phase into the formed solid-liquid interface, before transferring it into the bulk fluid by diffusion and convection (Paus et al. Citation2015; Gopal Rangarao et al. Citation2022). This is “the mixing of two phases with the formation of one new homogeneous phase” (Siepmann and Siepmann Citation2013). The intrinsic dissolution rate (IDR) describes the mass transfer rate and is therefore a velocity phenomenon. In contrast to solubility, which is an equilibrium phenomenon, IDR may be better suited to correlate with the dissolution rate in vivo (Yu et al. Citation2004; Zakeri-Milani et al. Citation2009).
One advantage of the intrinsic dissolution test for experimentally determining the intrinsic dissolution rate is that the sample is fixed in place such that only one surface of the sample is in contact with the liquid. This prevents movement of the compacted sample with the flow (Peltonen et al. Citation2003; Kakhi Citation2009; Todaro et al. Citation2017), and edge effects have negligible influence (Missel et al. Citation2004). In the common intrinsic dissolution test apparatus according to Ph. Eur. (method 2.9.29), also known as the rotating disc or Wood’s apparatus, compressed, pure, solid substances with minimal porosity and constant surface areas of 0.5 to 1.3 cm2 are used (Berger et al. Citation2007; Avdeef and Tsinman Citation2008; Alsenz et al. Citation2016; European Pharmacopoeia Citation2019). Reduction of the required sample size (e.g. powder suspension) has been investigated in various research projects over the last two decades (Tsinman et al. Citation2009; Alsenz et al. Citation2016; Etherson et al. Citation2020; Teleki et al. Citation2020; Andersson et al. Citation2021), because this allows potential problems to be identified or predicted at an early development stage (Issa and Ferraz Citation2011). However, disc systems are preferred when the focus is on substance properties (Bergström et al. Citation2019), particularly because the flow conditions around each individual particle are not known, and particle shape and size have an influence on the dissolution rates (Mosharraf and Nyström Citation1995; Andersson et al. Citation2021). In general, external factors such as hydrodynamics, temperature or pH affect the intrinsic dissolution. Therefore, a robust dissolution test is necessary for meaningful results (Shiko et al. Citation2011; Shekunov and Montgomery Citation2016), and a distinction between the two mechanisms of surface reaction and mass transfer, which are combined phenomena during dissolution, should be possible (Kaunisto et al. Citation2009).
In the case of a rotating disk, the specimen holder is continuously rotated, and the flow, especially in the vicinity of the specimen, is affected (Kaunisto et al. Citation2009; Todaro et al. Citation2017; Gopal Rangarao et al. Citation2022). Due to hydrodynamics, local concentrations of the substance differ within the dissolution media. A concentration boundary layer in the immediate vicinity of the sample is formed (Levich Citation1962; Grijseels et al. Citation1981) and saturation effects influence the dissolution process (Siepmann and Siepmann Citation2020). It was shown that the hydrodynamic boundary layer was thicker for the rotating disc method compared to the theory (Kaunisto et al. Citation2009), and since local differences in hydrodynamics affect the boundary formation and the dissolution rate (Viegas et al. Citation2001; Shiko et al. Citation2011), various attempts have been made to exploit well-defined hydrodynamics using flow-through apparatuses (Peltonen et al. Citation2003; Missel et al. Citation2004; Greco et al. Citation2011; Sleziona et al. Citation2021).
The aim of this study was to compare the flow channel method with the rotating disc method, which is the standard for intrinsic dissolution measurements. Therefore, the influence of hydrodynamics was a focus. Flow simulations and experiments were applied to investigate different settings concerning the fluid velocity and temperature. Theophylline monohydrate was used as model substance to determine the intrinsic dissolution rate. The different mixing characteristics of the methods and the radius-dependent shear on the specimen due to rotation was used to model the two compared methods and reconcile the results.
2. Methods and materials
2.1. Materials
Pure theophylline monohydrate (BASF, Ludwigshafen, Germany) was used without further purification or modification, while water was filtered and deionized (Milli-Q Advantage A 10 System; Merck KGaA, Darmstadt/Germany) for all experiments before being used as dissolution medium. The saturation concentration was determined via spectrophotometry (Specord200Plus; Analytik Jena AG, Jena/Germany) after a dissolution time of 48 h at the desired temperature. The measurements were conducted at the absorption maximum at 272 nm.
2.2. Rotating disc investigations
2.2.1. Rotating disc dissolution experiments
For the experiments with the rotating disc apparatus according to the Ph. Eur. method 2.9.29 (Erweka DT6; Erweka GmbH, Langen/Germany), an 8 mm die was used. 180 mg of theophylline monohydrate was inserted in the die cavity and compressed by a punch using a benchtop hydraulic press (Paul-Otto Weber GmbH, Remshalden/Germany) at 3 MPa for about 30 s.
In order to avoid any disturbance of the fluid motion during testing by the entrainment of air bubbles, as previously discussed in the literature (Viegas et al. Citation2001; Sleziona et al. Citation2021), an advanced preparation procedure was applied in this study. Specifically, the die was stored at least 15 min in a thermal chamber (IPP 30; Memmert GmbH & Co. KG, Schwabach/Germany) at test temperature before the dissolution test was performed. Immediately before starting the test, the surface of the matrix was wetted with a damp paper towel under brief, planar contact. The threaded holes were filled with a few drops of the tempered (25 °C or 37 °C, 15 min) and degassed (S180H Elmasonic; Elma Schmidbauer GmbH, Singen/Germany) dissolution medium (900 mL), before the holder was positioned at the prescribed position (3.8 cm from the bottom (European Pharmacopoeia Citation2019)) in the vessel. Immediately after reaching the position, the rotation was ramped up to the test speed.
The amount of dissolved substance was quantified under sink conditions using UV-spectroscopy (Lambda2S; Perkin Elmer GmbH, Rodgau/Germany).
2.2.2. Rotating disc mixing experiments
For the determination of the mixing behavior, the mounting was removed as quickly as possible (∼12 s) after a specified time of dissolution testing, and the medium was homogenized by stirring before the amount of dissolved substance was measured.
2.2.3. Rotating disc simulation
In the simulation, the experimental conditions were recreated by computational fluid dynamics (CFD) using the software CFX 2020 R1, ANSYS, Inc., Canonsburg, PA, USA. The geometry of the dissolution device was recreated in a computational domain and discretized into about 1.5 million elements. The resulting, unstructured grid had higher resolution in areas of high velocity gradients, like the rotating wall, and a maximum aspect ratio of 7.3 in order to obtain quick convergence to the numerical solution. An average orthogonal quality of 0.77 ± 0.14 (1 being the best) and a skewness of 0.23 ± 0.14 (0 being the best and 1 the worst) indicating a high-quality grid (Sirasitthichoke et al. Citation2023).
Two fluids, air and a mixture consisting of water and theophylline monohydrate, were defined and a density difference fluid buoyancy model was utilized. The “Volume of Fluid Method” was applied for the location and reconstruction of the free surface between the two fluids. For the “variable composition mixture” the material group of “constant property liquids” was used, containing the model substance, theophylline monohydrate (198.18 g mol−1), and water. In the fluid specific models, the kinematic diffusivity of theophylline monohydrate (198.18 g mol−1) in water was calculated according to Stokes-Einstein as 9.033·10−10 m2 s−1 (25 °C) and 1.207·10−9 m2 s−1 (37 °C) for the two temperatures shown, and used in the model. In the component models a constrained condition for the water was used. No mass transfer between the air and the theophylline-water mixture was permitted in the model. The tablet was defined as a bulk source with an experimentally determined flux of theophylline monohydrate of 1.467·10−4 kg m−2 s−1 (25 °C) and 2.893·10−4 kg m−2 s−1 (37 °C). Liquid properties of density, viscosity, specific heat capacity and surface tension at the respective temperatures (25 °C and 37 °C) were chosen, assuming that the dissolved component at maintained sink conditions has the same properties as the surrounding liquid.
For the boundary type “wall” used for the vessel, the mounting, and the tablet, no-slip condition was selected, so the die and holder as well as the tablet in the die are defined as rotating wall with a rotational speed of 100 rpm. This leads to a stationary domain with a rotating wall and an impulse transfer between the rotating surface of the holder with the tablet and the surrounding fluid.
In the basic settings of the solver control, a high resolution advection scheme was used with a second-order, backward-Euler, transient scheme. A coefficient loop timescale control with a minimum coefficient loop of one and a maximum of 10 was chosen. The convergence criteria was a root mean square (RMS) residual type with the residual target of 1·10−6. In the equation class settings, a transient scheme with second-order, backward-Euler was set for continuity and for mass fraction. In the advances options, a segregated multiphase control was used.
A total physical time of 4 min was simulated with time steps of 0.05 s in the transient calculations. The sampling point was defined according to the coordinates in the experiment.
2.3. Flow channel investigations
2.3.1. Flow channel dissolution experiments
In the flow-through dissolution apparatus according to Sleziona et al. (Citation2021), in accordance with the principle of the rotating disc, the substance to be investigated is presented as compact in a die with one exposed surface to the dissolution media. Due to the lack of insulation or temperature control of Sleziona’s flow channel, dissolution tests were only carried out in the flow channel at 25 °C (Sleziona et al. Citation2021).
In the experiments, a 13 mm die was used. 1000 mg of theophylline monohydrate was inserted in the die cavity and compressed by the punch using a benchtop hydraulic press (Paul-Otto Weber GmbH, Remshalden/Germany) under 3 MPa for about 30 s.
The dissolution medium (700 mL) was tempered (25 °C), and degassed (S180H Elmasonic; Elma Schmidbauer GmbH, Singen/Germany) for 15 min, and then continuously stirred in a reservoir vessel and fed into the channel via a gear pump (BVP-Z200; Ismatec, Wertheim/Germany) during testing (Sleziona et al. Citation2021). The amount of dissolved substance was quantified using UV-spectroscopy (Specord200Plus; Analytik Jena AG, Jena/Germany).
In addition to the previously published results of Sleziona et al. (Citation2021), dissolution experiments at higher flow rates up to approximately 1805 mL min−1, leading to Reynolds numbers (Re) of up to 1000, were investigated. Moreover, transient flow conditions, particularly for high Reynolds numbers, in the channel can be assumed, and a transient numerical solution utilized.
2.3.2. Flow channel running-in experiments
For the determination of the running-in behavior, a tracer solution was injected at the area where the tablet is usually placed in the setup, and the amount of dissolved substance was quantified over time. The time until a constant concentration (>98% of the final value) was reached was identified. These equilibration times were considered for the evaluation of the dissolution experiments and the dissolution kinetics.
2.3.3. Flow channel simulation
In the simulation of the flow channel using CFD software (FLUENT 2020 R1, ANSYS, Inc., Canonsburg, PA, USA), a version of 3D, pressure based, trans-sst model (Menter Citation2009) and a transient solver were selected. The setup described in Sleziona et al. (Citation2021) with a volume of approximately 0.19 L and a tetrahedron mesh containing 0.91 million elements with an aspect ratio of about 1.9 was used. The boundary conditions at the inlet correspond to certain Reynolds numbers and were implemented as a velocity magnitude with a turbulent intensity of 5%. For the outlet, the boundary condition was set as “pressure-outlet”. The primary convergence criterion was established as being residuals lower than 1·10−6. The mixing behavior within the channel was not investigated because a homogeneous mixture was formed due to turbulence in the mixing tank connected to the channel.
2.4. Common calculations
The dissolution tests were performed under constant stirring rate or flow velocity and at constant temperature (25 °C or 37 °C), using the Reynolds number (Re) to describe the hydrodynamics via the linear velocity (u), the diameter as characteristic length (d), and the fluid kinematic viscosity (νl). (EquationEquation 1(1)
(1) )
(1)
(1)
The linear velocity (u) of a discrete point at the rotating surface can be represented as a function of the rotational speed (ω) depending on the radius (r). (EquationEquation 2(2)
(2) )
(2)
(2)
In contrast, the linear velocity (u) in a flow channel is calculated based on the volume flow (), width and height of the channel cross-section (Sleziona et al. Citation2021). (EquationEquation 3
(3)
(3) )
(3)
(3)
The calculation of the intrinsic dissolution rate (IDR) from experimental data is described in the Ph. Eur. and Nernst-Brunner, considering the volume of the dissolution medium (V), the surface area of the compacted substance in contact with the dissolution medium (A) and the slope of the regression line of the cumulative mass of substance dissolved over time (dc/dt) (Etherson et al. Citation2020). (EquationEquation 4(4)
(4) )
(4)
(4)
3. Results
3.1. Calculations and modeling
3.1.1. Rotational Reynolds number
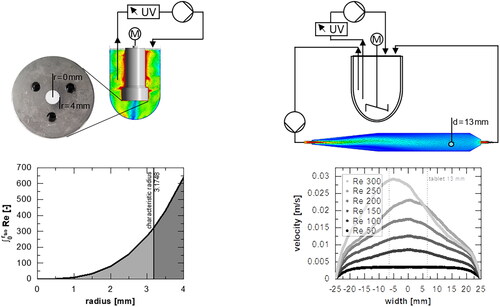
For the determination of the intrinsic dissolution rate, the Reynolds number (Re) (Missel et al. Citation2004) is a suitable reference to harmonize set points for different apparatuses. Hereby, a characteristic length is considered to determine apparatus-dependent values of Re. In this work, the Reynolds number is used to determine the characteristic radius for the rotating disc. Therefore, the area under the curve of the Reynolds equation (EquationEquation 1(1)
(1) extended by EquationEquation 2
(2)
(2) ) over the specimen radius (rtab) (EquationEquation 5
(5)
(5) ) is used.
(5)
(5)
The area under the curve corresponds to the surface stress of the rotating specimen and is divided at the characteristic radius (r) into two equally stressed areas independent of the rotational speed (). After simplification, the characteristic radius can be calculated via EquationEquation 6(6)
(6) .
(6)
(6)
Figure 1. Visual determination of the characteristic radius for the rotational reynolds number with equal areas under the curve in light and dark grey. Shown for 100 rpm at 37 °C.
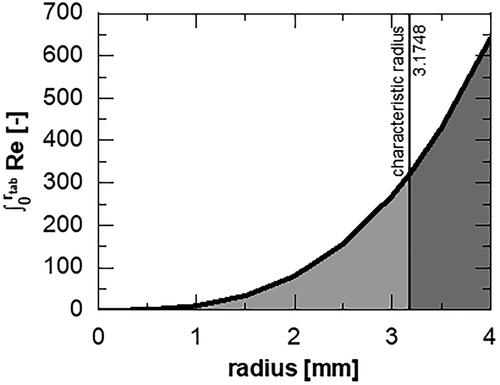
In this study, the characteristic radius of the rotating disc is approximately 3.2 mm.
With the radius of the specimen (rtab), the rotational speed (ω) and the kinematic viscosity of the dissolution medium (νl), the rotational Reynolds number (Re) can be calculated according to EquationEquation 7(7)
(7) .
(7)
(7)
3.1.2. Extension of common calculation approach for intrinsic dissolution rate
For the comparison of the (see EquationEquation 4
(4)
(4) ) determined with the individual devices, a mathematical correction factor is required to account for the stress on the specimen surface caused by the relative velocity (Sleziona et al. Citation2021). For the customized IDR (IDR+), Equationequation 4
(4)
(4) is extended by an apparatus-dependent factor (Fapparatus) (EquationEquation 8
(8)
(8) ).
(8)
(8)
A value of Fchannel = 1 represents no differences in relative velocity for a uniformly overflowed specimen (Sleziona et al. Citation2021). The extended apparatus-dependent factor for the rotating disc apparatus (Fdisc) is given by the relative deviation of the characteristic sample area from the real tablet area. According to EquationEquation 9(9)
(9) , a generally valid value of 0.37 is obtained after substituting EquationEquation 6
(6)
(6) .
(9)
(9)
3.2. Running-in and mixing behavior
3.2.1. Rotating disc tests
For the rotating disc, the flow simulation was used to characterize the shift of the velocity (see ) and mixing behavior (). The velocity plane and velocity vectors beneath the mounting signifies the presence of a radial velocity caused by a centrifugal force (). The relative velocity at the sample point (circle) was calculated for different rotational speeds and a run time of 4 min (). The mixing behavior is monitored by the distribution of the dissolved component within the liquid phase in the cross-section (), and the mass fraction at different temperatures () was calculated. Additionally, the experimentally determined mass fraction was compared to the simulation results.
Figure 2. (A) Velocity plane and (C) mass fraction plane in the cross section of the rotating disc apparatus at 100 rpm and 37 °C assuming stationary conditions after 4 min physical time, including velocity vectors. (B) Relative velocity of different rotational speeds at 37 °C as well as (D) determined mass fraction (100 rpm) over time at the sample point (mean ± sd, n = 3).
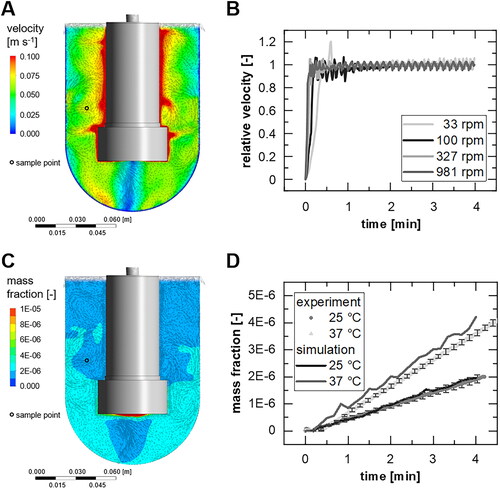
The highest speed was found at the outer wall of the rotating mounting, while the lowest velocities were near the walls of the vessel (per definition) and in the central axis below the specimen (). Fluctuations in velocity at the sampling point are also present in shorter time durations (). Especially within the first minute, the largest changes of velocity occur in short time intervals due to the start-up behavior of the apparatus. For 100 rpm, which corresponds approximately to Re = 303 (at 37 °C, EquationEquation 8(8)
(8) ), the assumed stationary state at the sampling point is reached after about 2 min, with a deviation of 2% from the final mean value (average over 9 s) (). For higher velocities, this mixing time can be reduced (e.g. to 53 s for 327 rpm (Re = 990)). For 33 rpm (Re = 100), the disturbances apparently set in after approximately 3 min within a fluctuation range of ±7%. With regard to the time rate of change of the mass fraction (), there is only a difference in slope between the experiment and simulation in the first 15–30 s for 37 °C, in accordance with an inhomogeneous mass fraction distribution in the vessel (). Subsequently, the increase of the mass fractions matches overall between experiment and simulation.
The mixing behavior was additionally investigated experimentally at different rotational speeds (15 to 300 rpm) and different times (2 to 6 min) by removing the mounting, manually homogenizing the dissolution medium, and then determining the relative difference between the last measuring point of the online concentration determination and the concentration of the homogenized medium ().
Figure 3. Mixing behavior as relative difference between last measuring point of online quantification and after homogenization, (A) after 4 min dissolution testing for different rotational speeds (mean ± sd, n = 3-6) and (B) after different times for 50, 100, 200 rpm (mean ± sd, n = 3).
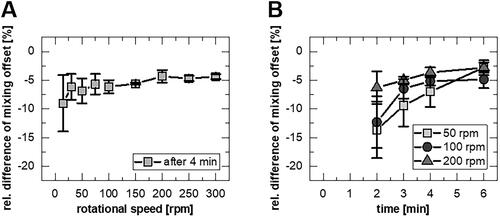
A decrease in the relative differences can be seen with increasing rotation speed of the mounting during the test () or time (). Lower speeds led to non-uniform rotation of the rotating disc with short interruptions, and higher speeds could not be realized. A systematic error in the dissolution tests with an underestimation of the dissolving substance quantity of at least −5% was determined.
3.2.2. Flow channel tests
Since the mixing in the experiment with the flow channel is ensured in the intermediate container (Sleziona et al. Citation2021), the distribution of the dissolving species in the channel itself is not relevant.
The time required to obtain a homogeneous mixture in the intermediate container after starting the pump was determined experimentally to differentiate the kinetics of the channel and the intermixed container from the kinetics of the dissolution. Longer mixing times were determined for lower speeds (). Setting the criterion for a homogeneous mixture to >98% of the final value, the corresponding mixing time is 6.9 min for Re = 60 or 1.4 min for Re = 300.
Figure 4. Running-in behavior as (A) experimentally determined relative absorbance over time after injection of a tracer solution to determine an equilibration time. (B) Velocity profiles for different flow velocities via simulation. (C) a velocity plane in the Middle layer of the flow channel according to Sleziona et al. (Citation2021) (at Re = 200).
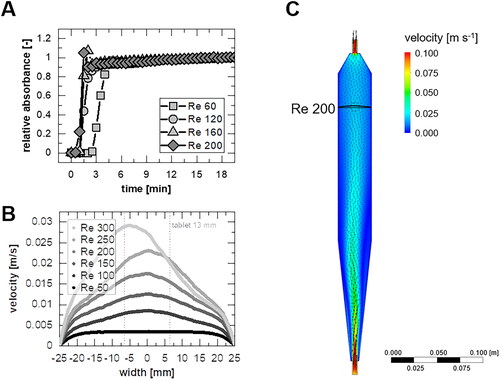
Moreover, the flow pattern () at the tablet is of interest since a uniform velocity profile across the cross-section of the tablet is desirable to ensure robust analytics of the dissolution test. This criterion can be used to define the range of application for dissolution experiments in this specific flow channel. For the uniformity of the profile, a deviation of 10% between the velocity in the center and the tablet edge (diameter 13 mm) was chosen. The smallest Reynolds number tested was 50 (corresponds to approximately 20 mL min−1 (25 °C)).
The velocity plane of the flow channel () implies a starting contact of the flow at Re = 200 with the wall at the beginning of the inlet zone. Only at larger Reynolds numbers does the attachment of the flow to the wall lead to a non-axisymmetric flow profile until the tablet is reached (). Nevertheless, according to the defined criterion, for Re > 150, the velocity profiles are no longer classified as uniform (see appendix ).
Steady-state flow profiles in the channel were obtained within the time for the homogenization in the vessel, so there was no need to adjust the mixing time for the dissolution tests. This was investigated experimentally in Sleziona’s previous work using particle image velocimetry (PIV) (Sleziona et al. Citation2021).
3.3. Dissolution
3.3.1. Apparatus reconciliation
Usually, dissolution tests are carried out with the rotating disc method at normal human body temperature, 37 °C. For a comparison with the flow channel introduced in Sleziona’s work (Sleziona et al. Citation2021), tests were carried out at 25 °C.
The calculation of the apparatus-independent intrinsic dissolution rates (IDR+, EquationEquation 8(8)
(8) ) was performed with consideration of the equilibration times for the flow channel (between 1 min for Re > 350 and 7 min for Re = 60) as well as for the rotating disc (2 min) over the obtained concentration changes for a 2 min measuring time.
shows the values determined for the flow channel (FC) (dark squares (Sleziona et al. Citation2021) and bright squares (this study)), which, by definition, are apparatus-independent. For the rotating disc (RD), the apparatus-independent data (white circles) are shown in contrast to the data not considering the apparatus-dependent factor (grey circles).
Figure 5. Dissolution data for theophylline monohydrate at 25 °C determined with the flow channel (FC) (published from Sleziona et al. (Citation2021): dark squares; this study: bright squares; mean ± sd, n = 5-6), and the rotating disc apparatus (RD) without (grey circles; mean ± sd, n = 4) and with correction term for calculation of apparatus-independent intrinsic dissolution rate (white circles).
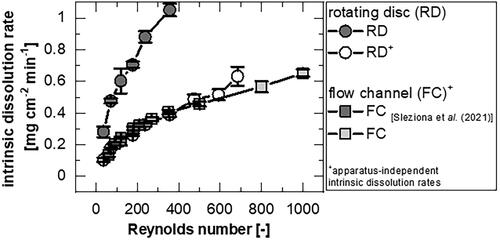
By accounting for the apparatus-dependent factors in the calculation of IDR+ (EquationEquation 8(8)
(8) ), the data from the rotating disc and the flow channel overlap. Larger rotation speeds lead to larger differences between rotating disc and flow channel. For Re > 350, the IDR+ determined for the flow channel is smaller than the values of the rotating disc.
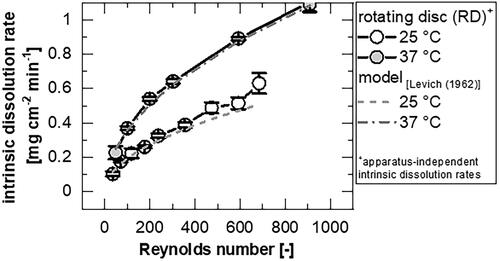
3.3.2. Temperature reconciliation
Investigations were conducted on the rotating disc at different temperatures and faster dissolution rates were determined for the higher temperature (). An attempt was made to compare them against a model proposed in the literature (Levich Citation1962; Yu et al. Citation2004; Kaunisto et al. Citation2009) (). The mass flux at the surface of the disc is described via Levich’s equation (Levich Citation1962, p. 69) (EquationEquation 10(10)
(10) ) containing the diffusion coefficient (D), the rotational speed (ω), the kinematic viscosity of the dissolution medium (νl) and the saturation concentration (cs).
(10)
(10)
Figure 6. Comparison of the apparatus-independent intrinsic dissolution rate of theophylline monohydrate at different temperatures measured with the rotating disc apparatus (mean ± sd, n = 4) and calculated according to Levich’s model.
The diffusion coefficients were calculated according to the modified Stokes-Einstein equation (EquationEquation 11(11)
(11) ) with the Boltzmann’s constant (kB), the temperature (T), the dynamic viscosity (η), a numerical factor of the modified equation (n) and the Van-der-Waals-radius (RvdW) (Edward Citation1970; Zhao et al. Citation2003).
(11)
(11)
The saturation concentration of theophylline monohydrate in water was determined in this study at 25 °C (6.52 ± 0.12 g L−1) and 37 °C (10.82 ± 1.00 g L−1). These results are in good agreement with literature values (Fokkens et al. Citation1983; Zhang and Rasmuson Citation2012; Liu et al. Citation2014). For the investigated temperature, it is assumed that no effects of hydrate transformation are to be expected (Lange Citation2017).
The model prediction fits well with the experimental results of the apparatus-independent intrinsic dissolution obtained with the rotating disc apparatus.
4. Discussion
4.1. Stationarity of the measurement and flow characteristics
4.1.1. Characteristics of robust dissolution testing
Dissolution tests should provide consistent results under constant conditions. Both investigated methods have an equilibration period due to the ramping up of the rotation (rotating disc; , ) or due to the initiation of pumping (flow channel, ), which has to be respected during the measurement. The measurements are conducted after a stationary state is assumed. The dissolution process itself is considered stationary, even if the surface of the specimen changes due to the dissolving mass (see appendix ). Thus, the shortest possible test times should be selected. The duration depends on the solubility of the substance and the analytics and should be determined for each substance separately.
4.1.2. Rotating disc characteristics
It is mentioned in the literature that for the rotating disc method, the laminar flow conditions are attributed to the range of rotational speed between 25–200 rpm (Greco et al. Citation2011) and are maintained until at least Re ≈ 104 (Kaunisto et al. Citation2009). This approximate value refers to the disc diameter (54 mm (European Pharmacopoeia Citation2019)) as the characteristic length. Using the characteristic radius introduced in this study results in a value for the maintained laminar flow of Re ≈ 869 (EquationEquation 7(7)
(7) ).
In this study, however, differences in velocity and mass fraction in the vessel occur for all settings tested (). The inhomogeneity in the velocity distribution () cannot be eliminated by holding the mixing time for the rotating disc method constant at 2 min (). This is in agreement with the findings of Tsinman et al. (Citation2009), who also mentioned a "lag" time needed for delays caused by experimental timing or wettability. Inhomogeneity with running measuring time is caused by fluctuations of the velocity (>5%) in the sampling point and differs also for a variation of the rotation speed (, ). The low mixing effect (< −5% relative difference of the mixing offset, ) is the reason for the non-uniform distribution of solute in the vessel () and thus introduces a systematic error in the concentration determination (). Medium velocities are preferable, since at higher velocities (981 rpm, Re = 2969) more fluctuations (∼7%) are present even after a longer run time () and no improved solute distribution can be obtained (). These observations correlate with the magnitude of the experimental errors (, ).
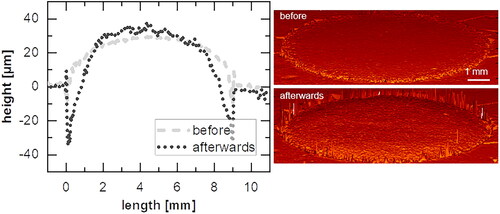
In general, the method-characteristic fluid movement with the swirled flow pattern () is necessary to circulate the entire fluid. This implies that sink conditions cannot be guaranteed to exist near the sample () (Siepmann and Siepmann Citation2020). The erosion of the tablet (see appendix ) due to hydrodynamic induced shear could influence the local fluid motion and thus affect the intrinsic dissolution rate (Kaunisto et al. Citation2011). However, since the simulation reproduces the experimental data well (), the removal of mass can be assumed to be negligible in this study. Accordingly, the experimental error of the results seems to be due to hydrodynamics only.
While the shortest possible mixing time is reasonable with regard to material removal (see appendix ) a longer mixing time must be observed with regard to the expected stationarity (). A good compromise was achieved for theophylline monohydrate with a mixing time of 2 min followed by a test time of 2 min.
4.1.3. Flow channel characteristics
For a flow channel method, laminar flow can be ensured by means of a rule of thumb for calculating the length of the inlet section as a function of Reynolds number (EquationEquation 1(1)
(1) ) and the hydraulic diameter (Böswirth et al. Citation2012, p. 183). An evaluation can be made experimentally using PIV or color filament. In previous work it was determined that laminar flow is present in this flow channel up to Re = 250 (Sleziona et al. Citation2021), but for Re > 150 the deviation between tablet center and tablet edge are larger than 10% (, appendix ). This can be explained by an asymmetric flow pattern due to attachment to the wall (). In the range of higher flow velocities an over- or underestimation of the data can occur due to the variability of the flow, which may explain the larger error bars in the experimental data for higher Re ().
By definition, there is no mixing of the liquid in the laminar flow channel. Since the channel contains 27% of the total medium with a volume of approximately 192 mL, a large proportion of which is unmixed, complete mixing is only achieved after longer times (up to 6.9 min for Re = 300; ). A relaxation of the set >98%-criterion for homogeneity and a smaller channel volume could reduce this. In this study, within the equilibration time, a steady flow is built up in the channel.
In contrast to the rotating disc, the use of a channel method reduces the range of variation in velocities across or at the tablet (see appendix ). Thus, the flow channel provides more robust information about the dissolution behavior of pharmaceutical substances, particularly with respect to the distinction between diffusion-controlled release and surface reaction-limited dissolution.
4.2. Method independent dissolution behavior and modeling
The stress on the specimen is characterized by the Reynolds number and different for rotation (EquationEquation 7(7)
(7) ) and overflow (EquationEquation 1
(1)
(1) ). Nevertheless, the introduction of the characteristic diameter for the rotating disc method (, EquationEquation 6
(6)
(6) ) aligns the stress on the tablet comparable to the flow channel method. Without the apparatus-dependent correction factor, the intrinsic dissolution rate is overestimated () since the true radius is greater than the characteristic radius (; EquationEquation 6
(6)
(6) ) and therefore is normalized to a greater area (EquationEquation 8
(8)
(8) ). The corrected rotating disc data (IDR+ according to EquationEquation 8
(8)
(8) and Re according to EquationEquation 7
(7)
(7) ) were in good agreement with the flow channel method data determined using the equations (IDR according EquationEquation 4
(4)
(4) and Re according to EquationEquation 1
(1)
(1) ; ). The determined mixing offset () does not lead to significantly different data, so the influence on the sample point position is not considered in the introduced equation of the apparatus-independent IDR+ (EquationEquation 8
(8)
(8) ). Only for Re > 350 do the values of rotating disc and flow channel experiments not overlap (). This may be due to the fact that during rotation a part of the tablet around the axis of rotation is constantly exposed to low velocities and therefore possible limitations of the dissolution by surface reaction cannot be reached, while other particles are hardly stressed. Moreover, in the flow channel, for greater Re, which are no longer in the laminar flow range, the diffusive transition could be enhanced and thus the IDR overestimated. Nevertheless, the deviations in the flow profile (see appendix ) are always smaller (<12%) than for the rotating disc (∼21%) and therefore the channel appears to provide more robust data for IDR compared to the rotating disc.
In this work, modeling of the apparatus-independent rotating disc data with Levich’s model (EquationEquation 10(10)
(10) ) for both tested temperatures showed good agreement with the experimental data. In most cases the data are slightly underestimated (). Insignificant larger differences were found at 25 °C (25 °C: ∼−8.6 ± 5.6%; 37 °C: ∼−2.6 ± 1.8%), which is attributed to the small temperature variations during the experiments.
5. Conclusion
Within this study, flow simulations and dissolution tests with theophylline monohydrate were conducted and a model for comparison of dissolution in the standard rotating disc (Ph. Eur. method 2.9.29) with a flow channel apparatus was established. The adapted Levich’s model shows agreement with experimental data with moderate deviations.
Based on hydrodynamics, the simulation studies of the rotating disk apparatus and the flow channel apparatus demonstrated that the interpretation of the results of the measured intrinsic dissolution rate varies between the two methods. Although both methods were operated in closed-loop mode, the flow channel method can allow a clear correlation between flow velocity and intrinsic dissolution rate due to the uniform overflow of the sample and the spatial separation of sample and mixed medium as well as sampling. For the rotating disk apparatus, the simulation of hydrodynamics and mass fraction as well as the experiments provided a new approach for interpreting the intrinsic dissolution rate determined with this method.
It was shown that the rotating disc apparatus has poor mixability, and that results vary with the test duration and rotational speed. For the measuring time range, a compromise must be found between a velocity state assumed to be stationary at the measuring point and the mass removal from the specimen. The influence of the sampling point is considered to be negligible if the measurement is carried out at a sufficient distance from the specimen. For the flow channel an equilibration time results, which is related to the inner volume of the laminar flow channel.
This study demonstrates that a comparison between the rotating disc and the flow channel is possible, with suggested equations for the calculation of the Reynolds number and an apparatus-independent intrinsic dissolution rate. For the rotating disc, a characteristic radius was introduced to compensate the relative velocity differences over the specimen due to the rotation around the center axis. In the flow channel, the specimen was overflowed uniformly, demonstrating the usefulness of this method for investigating surface reaction-limited systems. By adjusting the geometry of the channel and the flow rates of the fluid, the method is not limited to investigations of a wider Reynolds range, and it is possible to gain deeper insight into the dissolution behavior of different specimens.
Acknowledgements
The authors are grateful for the assistance of Elizabeth Ely (EIES, Oxford, IN, USA) in preparing the manuscript. The authors would further like to thank Anika David and Carla Matke for conducting preliminary experiments.
Disclosure statement
No potential conflict of interest was reported by the author(s).
Additional information
Funding
References
- Alsenz J, Haenel E, Anedda A, Du Castel P, Cirelli G. 2016. Miniaturized intrinsic dissolution screening (MINDISS) assay for preformulation. Eur J Pharm Sci. 87:3–13. doi: 10.1016/j.ejps.2015.09.008.
- Andersson SBE, Frenning G, Alderborn G. 2021. Determination of intrinsic drug dissolution and solute effective transport rate during laminar fluid flow at different velocities. Pharmaceutics. 13(6):835. doi: 10.3390/pharmaceutics13060835.
- Avdeef A, Tsinman O. 2008. Miniaturized rotating disk intrinsic dissolution rate measurement: effects of buffer capacity in comparisons to traditional wood’s apparatus. Pharm Res. 25(11):2613–2627. doi: 10.1007/s11095-008-9679-z.
- Berger CM, Tsinman O, Voloboy D, Lipp D, Stones S, Avdeef A. 2007. Technical note: miniaturized intrinsic dissolution rate (Mini-IDR™) measurement of griseofulvin and carbamazepine. Dissolution Technol. 14(4):39–41. doi: 10.14227/DT140407P39.
- Bergström CAS, Box K, Holm R, Matthews W, McAllister M, Müllertz A, Rades T, Schäfer KJ, Teleki A. 2019. Biorelevant intrinsic dissolution profiling in early drug development: fundamental, methodological, and industrial aspects. Eur J Pharm Biopharm. 139:101–114. doi: 10.1016/j.ejpb.2019.03.011.
- Böswirth L, Bschorer S, Buck T. 2012. Technische Strömungslehre: Lehr- und Übungsbuch. 9., überarb. Aufl. Wiesbaden: Vieweg + Teubner. 352 p. (Vieweg + Teubner Studium). ISBN: 978-3-8348-8647-7; [accessed 2023 Jun 3]. https://link.springer.com/content/pdf/10.1007/978-3-8348-8647-7_8.pdf.
- Edward JT. 1970. Molecular volumes and the stokes-einstein equation. J Chem Educ. 47(4):261. doi: 10.1021/ed047p261.
- Etherson K, Dunn C, Matthews W, Pamelund H, Barragat C, Sanderson N, Izumi T, Da Mathews CC, Halbert G, Wilson C, et al. 2020. An interlaboratory investigation of intrinsic dissolution rate determination using surface dissolution. Eur J Pharm Biopharm. 150:24–32. doi: 10.1016/j.ejpb.2020.02.005.
- European Pharmacopoeia. 2019. Publ. in accordance with the Convention on the Elaboration of a European Pharmacopoeia. 10th edition. Strassbourg: Council of Europe. bd. (European treaty series; no. 50). ISBN: 9789287189127.
- Fokkens JG, van Amelsfoort J, Blaey CJde, Kruif CGde, Wilting J. 1983. A thermodynamic study of the solubility of theophylline and its hydrate. Int J Pharm. 14(1):79–93. doi: 10.1016/0378-5173(83)90116-3.
- Gopal Rangarao B, Monica K, Bhattacharyya S. 2022. A brief review on pharmaceutical dissolution interlinking the aspect of science and regulation. Bull Pharm Sci. Assiut. 45(1):11–21. doi: 10.21608/bfsa.2022.239165.
- Greco K, Bergman TL, Bogner R. 2011. Design and characterization of a laminar flow-through dissolution apparatus: comparison of hydrodynamic conditions to those of common dissolution techniques. Pharm Dev Technol. 16(1):75–87. doi: 10.3109/10837450903499341.
- Grijseels H, Crommelin DJA, Blaey CJd 1981. Hydrodynamic approach to dissolution rate. Pharmaceutisch Weekblad Scientific Edition. 3(1):1005–1020. doi: 10.1007/BF02193318.
- Issa MG, Ferraz HG. 2011. Intrinsic dissolution as a tool for evaluating drug solubility in accordance with the biopharmaceutics classification system. Dissolution Technol. 18(3):6–13. doi: 10.14227/DT180311P6.
- Kakhi M. 2009. Classification of the flow regimes in the flow-through cell. Eur J Pharm Sci. 37(5):531–544. Epub 2009 Apr 18. eng doi: 10.1016/j.ejps.2009.04.003.
- Kaunisto E, Marucci M, Axelsson A. 2011. Dissolution kinetics or pure mass transfer? A mechanistic study of dissolution. AIChE J. 57(10):2610–2617. doi: 10.1002/aic.12475.
- Kaunisto E, Nilsson B, Axelsson A. 2009. Drug dissolution rate measurements - evaluation of the rotating disc method. Pharm Dev Technol. 14(4):400–408. doi: 10.1080/10837450802712641.
- Lange L. 2017. Phase behavior of pharmaceutical cocrystals. 1. Auflage. München: Verlag Dr. Hut. IX, 161, A-Z, AA-AI Seiten (Schriftenreihe Thermodynamik; Band 23). ISBN: 978-3-8439-2967-7. Deutsche und englische Zusammenfassung.
- Levich VG. 1962. Physicochemical Hydrodynamics. Englewood Cliffs, N.J.: Prentice-Hall. p. 700. p. (Prentice-Hall international series in the physical and chemical engineering sciences). ISBN: 9780136744405.
- Liu C, Dang L, Bai W, Wang R, Wei H. 2014. Solid–liquid equilibrium of theophylline in solvent mixtures. J Chem Eng Data. 59(2):263–268. doi: 10.1021/je400864f.
- Menter FR. 2009. Review of the shear-stress transport turbulence model experience from an industrial perspective. In J Comput Fluid Dyn. 23(4):305–316. doi: 10.1080/10618560902773387.
- Missel PJ, Stevens LE, Mauger JW. 2004. Reexamination of convective diffusion/drug dissolution in a laminar flow channel: accurate prediction of dissolution rate. Pharm Res. 21(12):2300–2306. doi: 10.1007/s11095-004-1512-8.
- Mosharraf M, Nyström C. 1995. The effect of particle size and shape on the surface specific dissolution rate of microsized practically insoluble drugs. Int J Pharm. 122(1-2):35–47. doi: 10.1016/0378-5173(95)00033-F.
- Paus R, Hart E, Ji Y. 2015. A novel approach for predicting the dissolution profiles of pharmaceutical tablets. Eur J Pharm Biopharm. 96:53–64. doi: 10.1016/j.ejpb.2015.06.029.
- Peltonen L, Liljeroth P, Heikkilä T, Kontturi K, Hirvonen J. 2003. Dissolution testing of acetylsalicylic acid by a channel flow method-correlation to USP basket and intrinsic dissolution methods. Eur J Pharm Sci. 19(5):395–401. doi: 10.1016/S0928-0987(03)00140-4.
- Shekunov B, Montgomery ER. 2016. Theoretical analysis of drug dissolution: I. Solubility and intrinsic dissolution rate. J Pharm Sci. 105(9):2685–2697. doi: 10.1016/j.xphs.2015.12.006.
- Shiko G, Gladden LF, Sederman AJ, Connolly PC, Butler JM. 2011. MRI studies of the hydrodynamics in a USP 4 dissolution testing cell. J Pharm Sci. 100(3):976–991. doi: 10.1002/jps.22343.
- Siepmann J, Siepmann F. 2013. Mathematical modeling of drug dissolution. Int J Pharm. 453(1):12–24. doi: 10.1016/j.ijpharm.2013.04.044.
- Siepmann J, Siepmann F. 2020. Sink conditions do not guarantee the absence of saturation effects. Int J Pharm. 577:119009. doi: 10.1016/j.ijpharm.2019.119009.
- Sirasitthichoke C, Patel S, Reuter KG, Hermans A, Bredael G, Armenante PM. 2023. Computational determination of hydrodynamics in the USP dissolution testing Apparatus 1 (rotating basket). Chem Eng Sci. 280:118946. doi: 10.1016/j.ces.2023.118946.
- Sleziona D, Mattusch A, Schaldach G, Ely DR, Sadowski G, Thommes M. 2021. Determination of inherent dissolution performance of drug substances. Pharmaceutics. 13(2):146. doi: 10.3390/pharmaceutics13020146.
- Teleki A, Nylander O, Bergström CAS. 2020. Intrinsic dissolution rate profiling of poorly water-soluble compounds in biorelevant dissolution media. Pharmaceutics. 12(6):493. doi: 10.3390/pharmaceutics12060493.
- Todaro V, Pearsons T, Grove G, Healy AM, D’Arcy DM. 2017. Characterization and simulation of hydrodynamics in the paddle, basket and flow-through dissolution testing apparatuses - a review. Dissolution Technol. 24(3):24–36. doi: 10.14227/DT240317P24.
- Tsinman K, Avdeef A, Tsinman O, Voloboy D. 2009. Powder dissolution method for estimating rotating disk intrinsic dissolution rates of low solubility drugs. Pharm Res. 26(9):2093–2100. doi: 10.1007/s11095-009-9921-3.
- Viegas TX, Curatella RU, van Winkle LL, Brinker G. 2001. Measurement of intrinsic drug dissolution rates using two types of apparatus. Pharm Technol. 25:44–35.
- Yu LX, Carlin AS, Amidon GL, Hussain AS. 2004. Feasibility studies of utilizing disk intrinsic dissolution rate to classify drugs. Int J Pharm. 270(1–2):221–227. eng doi: 10.1016/j.ijpharm.2003.10.016.
- Zakeri-Milani P, Barzegar-Jalali M, Azimi M, Valizadeh H. 2009. Biopharmaceutical classification of drugs using intrinsic dissolution rate (IDR) and rat intestinal permeability. Eur J Pharm Biopharm. 73(1):102–106. doi: 10.1016/j.ejpb.2009.04.015.
- Zhang S, Rasmuson ÅC. 2012. The theophylline–oxalic acid co-crystal system: solid phases, thermodynamics and crystallisation. CrystEngComm. 14(14):4644. doi: 10.1039/c2ce25299f.
- Zhao YH, Abraham MH, Zissimos AM. 2003. Fast calculation of van der waals volume as a sum of atomic and bond contributions and its application to drug compounds. J Org Chem. 68(19):7368–7373. eng doi: 10.1021/jo034808o.
Appendix
Figure A1. Velocity at the characteristic length compared to the deviation against the tablet center for the rotating disc (theoretical calculation using EquationEquations 2(2)
(2) and Equation7
(7)
(7) assuming no-slip conditions) and the flow-through dissolution apparatus (flow simulations) according to Sleziona et al. (Citation2021). The standard deviations indicate the velocities at the edge of the tablet for both methods. For the rotating disc, an infinitely low effective velocity results mathematically in the center of the tablet.
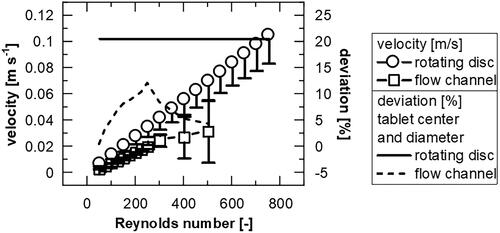
Figure A2. Surface topography measured via white light interferometer (MicroProf; Fries Research & Technology GmbH, Bergisch Gladbach/Germany) for a theophylline monohydrate tablet used in the rotating disc at 100 rpm before the test and after 4 min dissolution testing.