
Abstract
A collaborative partnership among community-based organizations (CBOs) could strengthen local services and enhance the capacity of a community to provide services as well as meet the diverse needs of older adults. The United Way of Tarrant County developed the LIVE WELL Initiative, partnering with six CBOs to provide nine evidence-based or evidence-informed health interventions to improve the health and lower healthcare costs of vulnerable individuals at risk for poor health. The nine programs include specific target areas, such as falls prevention, chronic disease self-management, medication management, and diabetes screening and education. A total of 63,102 clients, nearly 70% of whom were older adults, were served through the Initiative. Significant improvements in self-reported health status were observed among served clients. The percentage of clients reporting self-rated health as good, very good, and excellent increased from 47.5% at baseline to 61.1% at follow-up assessment. The mean healthy days improved from 16.9 days at baseline to 20.6 days at follow-up assessment. Additional improvements in program-specific outcomes demonstrated significant impacts of targeted intervention focus among served clients by program. The findings of this study emphasize that the impact of a collaborative partnership with multiple CBOs could promote health and well-being for older adults.
Sixty percent of Americans have at least one chronic condition, and four in 10 Americans have two or more chronic conditions (National Center for Chronic Disease Prevention and Health Promotion, Citation2019). In addition, the prevalence of multiple chronic conditions is higher among older adults. Among those age 65 and older, the percentage with multiple chronic conditions rises to 81% (Buttorff, Ruder, & Bauman, Citation2017), and the impact is dramatic: increased healthcare costs, reduced quality of life, and difficulty performing activities of daily living (Bähler, Huber, Brüngger, & Reich, Citation2015; Barile et al., Citation2013; Marengoni et al., Citation2011). In older adult populations, community-based organizations (CBOs) often supplement formal healthcare services by offering evidence-based programs or evidence-informed programs that address chronic diseases commonly found in clients. These rigorously tested programs have demonstrated significant positive health outcomes when implemented according to protocol (Frieson, Tan, Ory, & Smith, Citation2018; Mingo et al., Citation2014; Ory et al., Citation2013). Some federal agencies, including the Administration for Community Living, require states and their CBOs to use only evidence-based programs when seeking funding for activities from Title III-D (Administration for Community Living, Citation2017).
Because of the complexity of public health programs designed to prevent or control disease and the diverse needs and preferences of older adults, it is a challenge for a single CBO to impact the health of a community. To support older adults, many CBOs often establish partnerships with other groups to provide effective and efficient services; collaborative partnerships among CBOs are important to strengthen local services and enhance the capacity of a community to provide services (Ivery & Akstein-Kahan, Citation2010). Successful partnership among CBOs increases accountability to clients, stakeholders, and service providers in local communities. Evaluation of programs meant to improve public health became increasingly more valuable as programs grew more complex. Assessing and documenting implementation, evaluating effectiveness, and ensuring accountability to clients and organizers, stakeholders, CBOs, and service providers have become vital functions. The purpose of this paper was (a) to describe the LIVE WELL Initiative, a partnership of community-based funding agency and CBOs, established by United Way of Tarrant County (UWTC) in 2010 and (b) to present evaluative data associated with the health impact upon those served.
Methods
The LIVE WELL Initiative
In 2010, the UWTC, a nonprofit countywide services organizer headquartered in Fort Worth, Texas, developed a decade-long three-armed initiative focused on income, education, and health to improve quality of life in the community through partnership with local organizations. The LIVE WELL Initiative addressed the immediate needs of individuals at risk for poor health outcomes by engaging older adults in health self-management techniques and healthy behaviors. UWTC leadership established the LIVE WELL Initiative Bold Goal to improve the lives of 17,000 adults with ongoing health concerns and to serve the lives of 63,000 adults by 2020. The Bold Goal represented a shared vision for change and allowed UWTC to lead a common agenda with its CBO partners for collective impact.
Partners and programs
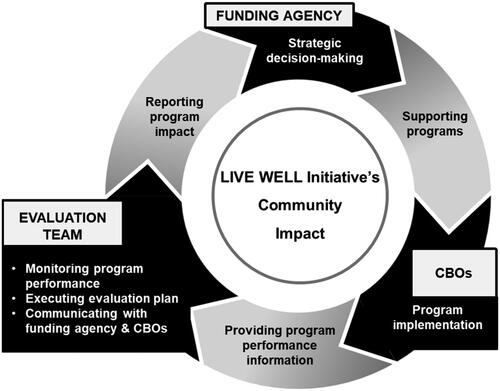
To achieve this Bold Goal, the UWTC established a partnership with key CBOs through a formal grant mechanism to provide these health programs and endorse healthy behaviors associated with improving health and lowering health care costs. Starting four evidence-based or evidence-informed programs from four CBOs in 2010, UWTC funded a total of nine programs from six CBOs for nine years: A Matter of Balance (AMOB), Chronic Disease Self-Management Program (CDSMP), HomeMeds, DiabetesSalud!, Community Health Navigation, diabetes-nutrition counseling, REACH-TX, In-home Respite, and Universal Precautions Toolkit Training for health literacy. As the funding agency UWTC supported the CBOs and their service providers, the funded programs were implemented to meet strategic goals; the evaluation team conducted the assessment to share meaningful data with CBOs and UWTC in a timely manner; and this helped the funding agency make strategic decisions. The LIVE WELL Initiative coordinated the unique contributions of the three entities: the funding agency, the CBOs, and the evaluation team (see ). This paper is a report of the evaluation team.
Figure 1. LIVE WELL Initiative evaluation model.
LIVE WELL Initiative evaluation
The evaluation of the LIVE WELL Initiative was designed to assess the performance of the individual programs and to monitor the achievement of the Initiative’s Bold Goal. shows the description and intervention focus of each program. The nine programs provided services in or near Tarrant County, a North Central Texas County with a population of 2.1 million (U. S. Census Bureau, P. D, 2017). The evaluation focused on three aspects: outputs, performance standards, and common health and program-specific outcomes. Outputs were defined as annual goals for the number of individuals served by each program and set by UWTC and each organization. Performance standards established implementation (i.e., delivery of the programs) benchmarks based on published information for each of the evidence-based programs. Common health and program-specific outcomes included standardized measures to demonstrate the impact of programs on the health and well-being of clients. Common health and program-specific outcomes are the focus of this paper.
Table 1. LIVE WELL Initiative programs and characteristics.
Measures
Quantifiable indicators (e.g., self-reported health status, health care utilization, nursing home placement) were selected and measured for each participant prior to program participation (baseline) and after service delivery (follow-up). Collecting follow-up measurements varied from 30 days to 6 months depending up the requirement of each program. Two types of measures were used to document outcomes of the LIVE WELL Initiative: (a) common health measures used by all programs and (b) program-specific measures directly related to a significant symptom of the conditions addressed by program.
Common health measures: Healthy Days Measures
Developed by the Centers for Disease Control and Prevention (CDC), the Healthy Days Measures has been used extensively in health research (Centers for Disease Control and Prevention, Citation2000). Administering it is simple and individuals can easily reflect upon their own health; furthermore, the Healthy Days Measure demonstrated validity and reliability (Jia, Muennig, Lubetkin, & Gold, Citation2004; Ounpuu, Chambers, Chan, & Yusuf, Citation2001). Thus, it has been regarded as acceptable for use in state innovation waiver programs (Texas Health and Human Services Commission, 2011). The four items on the CDC Healthy Days Measures were collected at baseline and follow-up assessments by each program. One item asked clients to choose one of five choices (excellent, very good, good, and fair or poor) to indicate their general health status. Two items asked clients to report the number of days in the previous 30 days when their physical health (including physical illness and injury) and mental health (including stress, depression, and problems with emotions) were not good. Clients were also asked to report the number of days in the previous 30 days when their poor physical or mental health kept them from doing their usual activities, including self-care, work, or recreation. Potential responses for the three items ranged from 0 days to 30 days. Physical and mental health days defined as not good (i.e., unhealthy days) were summed to create a combined variable, ranging from 0 days to 30 days. Finally, the total number of healthy days was calculated by subtracting unhealthy days from 30 days. The Wilcoxon signed-rank test and paired t-test were conducted to assess changes in general health status and total number of healthy days, respectively.
Program-specific measures
In addition to collecting the number of healthy days as a common measure, each program collected standardized outcomes to show the impact of targeted services based on program objective and intervention focus. summarizes program-specific outcomes.
Table 2. Outcome measures by program.
Falls efficacy scale
The Falls Efficacy Scale (Tennstedt, Lawrence, & Kasten, Citation2001) was used with clients enrolled in the AMOB program. Collected at baseline and completion of the program, the scale consisted of five items measuring participants’ perceived ability to manage the risk of falls or actual falls (Tennstedt et al., Citation1998). Ratings were done on a 4-point Likert scale: 1 = not sure at all, 2 = not very sure, 3 = somewhat sure, and 4 = absolutely sure. Scores ranged from 5 to 20 with higher scores indicating higher levels of managing the risk of falls.
Stanford self-efficacy for managing chronic disease
The Self-Efficacy Scale (Lorig, Sobel, Ritter, Laurent, & Hobbs, Citation2001) was used with clients enrolled in the CDSMP at baseline and completion of the program. The Self-Efficacy Scale included six items involving how confidently a person managed activities and tasks related to pain and chronic disease. Responses were made on a 10-point scale: 1 = not at all confident to 10 = totally confident with higher scores indicating higher levels of confidence in managing the tasks.
Medication adherence
Clients enrolled in HomeMeds program from Sixty and Better, Inc. completed the Morisky Medication Adherence Scale (Morisky, Green, & Levine, Citation1986) at baseline and 30-day follow-up (Morisky, Ang, Krousel-Wood, & Ward, Citation2008). The reliability and predictive validity of the Morisky Scale have been demonstrated in numerous studies, including patients dealing with many chronic diseases (e.g., diabetes, hypertension), as a self-reported measure of adherence to medications (Krapek et al., Citation2004; Krousel-Wood, Thomas, Muntner, & Morisky, Citation2004). Responses to the questions were Yes (= 0) or No (= 1) for each item. The possible overall score for the eight-item medication adherence questionnaire ranged from 0 to 8. Three levels of adherence were considered based on the following scores: 0 to <6 (low); 6 to <8 (medium); 8 (high).
Use or plan to use updated medication list
Clients enrolled in the HomeMeds program from Meals on Wheels (MOW), Inc. of Tarrant County were asked whether they used or planned to use an updated medication list when they had an appointment with a physician. This question was asked at the 75‒90 days follow-up assessment. The responses were either Yes (= 1) or No (= 0).
Levels of glucose
The hemoglobin A1c test was conducted at baseline and 6-month follow-up sessions to examine the A1c level (%) among clients enrolled in DiabetesSalud!.
Patient activation measure
The Patient Activation Measure (PAM) is a 13-item survey tool designed to assess knowledge, skill, and confidence in managing one’s own health care (Hibbard, Mahoney, Stockard, & Tusler, Citation2005). The responses were made on a Likert scale with four options: strongly disagree (= 1), disagree (= 2), agree (= 3), strongly agree (= 4), and N/A. The total scores ranged from 13 to 52 with no N/A. If at least one item garnered a response of N/A, the total was divided by the number of items completed and multiplied by 13 to obtain a total PAM score. The total scores were categorized into four stages: in Stage 1 (PAM score of ≤ 47.0) the client believed activation important; in Stage 2 (PAM score of 47.1–55.1) the client had the knowledge and confidence to take action; in Stage 3 (PAM score of 55.2–67.0) the client took action; and in Stage 4 (PAM score of ≥67.1) the client was able to stay the course under stress. High PAM scores indicated that patients gained confidence in their ability to self-manage and make lifestyle changes (Rask et al., Citation2009).
Zarit caregiver burden interview
The Zarit Caregiver Burden Interview (Zarit, Reever, & Bach-Peterson, Citation1980) was used to assess caregiver burden for caregivers who received in-home respite care from Easterseals North Texas at baseline and 6-month assessments. The interview included 12 items scored on a scale of 1 (never) to 5 (nearly always). The total scores ranged from 1 to 60 with higher scores indicating greater burden.
REACH II quality of life
REACH II quality of life was assessed for caregivers enrolled in REACH-TX at baseline and 6-month follow-up assessments. Five domains of caregiver quality of life include depression, caregiver burden, social support, self-care, and care recipient’s problem behavior (Belle et al., Citation2006). Details of each domain are described elsewhere (Cho, Luk-Jones, Smith, & Stevens, Citation2019).
Nursing home placement
Nursing home placement assessed outcomes for care recipients (i.e., dementia patients) of REACH-TX and in-home respite care. Caregivers enrolled in REACH-TX and in-home respite care were asked whether care recipients were admitted to long-term care facilities at the 6-month follow-up assessment.
Goal attainment
Clients enrolled in the diabetes-nutrition counseling program with MOW, Inc. of Tarrant County were encouraged to set behavior goals to improve health outcomes related to one of the education topics. Goal setting is recognized as an efficient strategy for promoting behavioral change in the National Standards for Diabetes Self-Management Education and Support through the setting of SMART goals (i.e., specific, measureable, achievable, reasonable, and timely) (Haas et al., Citation2014; Miller & Bauman, Citation2014). Clients set up their behavioral goals at initial home visits. During the 6-month follow-up call, they reported the progress of goal attainment for each goal as follows: none (=0), a few of the time (=1), some of the time (=4), most of the time (=7), and all of the time (=10).
Health literacy knowledge and impacts
Librarians, CBO representatives, and clinicians enrolled in the health literacy Universal Precautions Toolkit training were given 15 items on a questionnaire developed by the University of North Texas Health Science Center. The questionnaire included items to assess knowledge, attitudes, and practice, as well as plan to implement the knowledge gained from the training.
Analysis
Depending on the distribution of outcomes, the Wilcoxon signed-rank test and paired t-test were conducted to examine changes in the outcomes from baseline to follow-up assessments.
Results
Number of clients served
summarizes the number of clients enrolled in each program in the LIVE WELL Initiative from 2010 to 2019. The Initiative identified clients at risk for poor health and served a total of 63,102 clients. As stated above, the UWTC worked with partner organizations to set annual goals to achieve the Bold Goal. Almost 3,700 clients, for instance, enrolled in the AMOB delivered by Sixty and Better; MOW delivered HomeMeds to over 15,000 clients; and 2,381 dementia caregivers received the REACH-TX intervention from the Alzheimer’s Association. The average age of clients in all programs was over 60 years old (with the exception of DiabetesSalud!). The majority were 65 years old, female, White, and non-Hispanic (see Supplement Table 1).
Table 3. Number of clients enrolled in the programs of LIVE WELL Initiative.
A total of 63,102 people were identified by counting unique clients enrolled in organizations. Thus, a client enrolled in more than one program in the same organization was counted as a unique client; for example, if a client had diabetes and nutritional risk screening and enrolled in both AMOB and CDSMP from Sixty and Better, Inc., the client was counted as one individual. The same was true for clients served by MOW, Inc. of Tarrant County. Furthermore, REACH-TX from the Alzheimer’s Association North Central Texas Chapter and in-home respite care from Easterseals North Texas provided service to a family, so both caregivers and care recipients were counted. If clients enrolled in both organizations, the clients were also counted once. Because both organizations referred clients (i.e., caregivers and care recipients) to each other and shared clients' information as well as organizational identification numbers, we were able to identify the number of unique clients.
Changes in common health measures from baseline to follow-up across programs
and summarize the changes in common health measures (i.e., general health status and number of healthy days) from baseline to follow-up in the LIVE WELL Initiative indicating that CBOs can be essential providers of evidence-based services improving health status among adults living with chronic conditions. shows changes in general health status among clients following enrollment and completion by each program. Overall, the percentage of participants who rated their health good, very good, and excellent improved from 47.5% to 61.1% in the follow-up assessment (z = − 31.57, p < .001). With the exception of caregivers partaking of in-home respite, the Wilcoxon signed-ranks tests showed all programs significantly increased the proportion of clients who rated their health good, very good, and excellent from baseline to follow-up.
Table 4. Change in proportion in clients who rated their health good, very good, and excellent from baseline to follow-up by program.
Table 5. Change in the average number of healthy days from baseline to follow-up by program.
shows changes in the average number of healthy days among clients enrolled in and completing each program. Overall, the average number of healthy days for clients also significantly improved from 16.87 days (SD = 13.37) at baseline to 20.6 days (SD = 12.33) at follow-up assessment (t(14,032) = 34.98, p < .001). Paired t-tests showed significant differences in the changes in the average number of healthy days among all programs, with the exception of CDSMP and in-home respite care-recipients.
Changes in program specific outcomes from baseline to follow-up
Each program showed significant improvement in program-specific outcomes (). Clients enrolled in AMOB showed improvement in falls efficacy score from 2.72 (SD = .74) to 3.21 (SD= .63), t (2,117) =33.28, p < .001. Those enrolled in CDSMP also showed significant improvement in self-efficacy score for managing chronic disease (t (507) = 9.71, p < .001). The mean of the self-efficacy scores was 7.41 (SD = 2.08) at baseline and 8.18 (SD = 1.38) at the completion of the program. MOWI HomeMeds clients were asked whether they would use or plan to use the updated medication list at a future doctor’s appointment 75 days after the program. Nearly 89% (88.8%) of MOWI HomeMeds clients responded to using or planning to use their updated medication list. Morisky’s Medication Adherence Scale (Morisky et al., Citation1986) was used to assess medication adherence level at baseline and 6 months among clients enrolled in HomeMeds from Sixty and Better, Inc. Low adherence level significantly decreased from 42.4% at baseline to 28.8% at follow-up assessment, (z = − 22.30, p < .001). The levels of glucose from hemoglobin A1c tests also significantly improved from 8.80 (SD = 2.50) at baseline and 7.20 (SD = 1.80) at follow-up session among DiabetesSalud! clients, t(1,442) = −27.79, p < .001. Clients enrolled in the Community Health Navigation program showed a significant increase in responses about an ability to stay the course from 23.2% at baseline to 35.9% at 6-month follow-up assessment (z = − 7.72, p < .001).
Table 6. Changes in program-specific outcomes from baseline to follow-up by program.
Discussion
In 2010 the UWTC established the LIVE WELL Initiative to improve population outcomes for adults with chronic diseases or older adults with early stage of dementia. To achieve this goal, the UWTC partnered with six CBOs providing nine evidence-based or evidence-informed programs. For nine years, the LIVE WELL Initiative served a total of 63,102 clients. At least 50% of them were 65 years and older and were served by each program (with the exception of Diabetes Salud!). Clients served through the Initiative showed significant improvements in self-reported common health measures (i.e., general status and average number of healthy days). Clients enrolled in targeted intervention also showed significant improvements in program-specific measures (i.e., Falls Efficacy Scale, Self-Efficacy for Managing Chronic Disease, Medication Adherence, A1c levels, PAM, Caregiver Burden, and REACH II Quality of Life). These findings indicate that a collaborative partnership through the LIVE WELL Initiative contributed to promoting health and well-being for served clients including a majority of older adults.
This paper documents the community impact of the LIVE WELL Initiative sponsored by the UWTC. Spanning slightly over 9 years, the LIVE WELL Initiative not only reached more than 60,000 adults but also served a critical role in maintaining or improving the health status of over 18,000 individuals at risk for poor health. Findings from the LIVE WELL Initiative suggest that the UWTC, a community-based funding agency, effectively led and funded a coalition of service-oriented CBOs in an evidence-based or evidence-informed approach to supporting adults (and their family caregivers) living with chronic conditions. Inclusion of an independent evaluation team facilitated analyzing a combination of output and outcome measurement that provided ongoing feedback to CBOs and UWTC leaders. Collectively, the three core entities (UWTC, CBOs, and the evaluation team; see ) contributed uniquely to the success of the LIVE WELL Initiative across a nine-year partnership. UWTC provided a long-term commitment to funding; CBOs integrated programs into their service mission and embraced new evaluation tools, and the evaluation team provided quarterly data reports used to facilitate implementation and monitor outcomes. Collectively, the partners used evaluation reports to inform future years of the Initiative.
By examining changes in health status with a common set of standardized self-reported health measures across multiple evidence-based and evidence-informed programs, the LIVE WELL Initiative established a unique and reliable approach to documenting the health impact of community-based programs designed to support the management of a diverse set of chronic conditions. This approach provided the UWTC with meaningful data that could be reported across the partner CBOs and applicable to the larger community. Of equal importance, the evaluation strategy included examining the changes in program-specific outcome measures. The program-specific outcome measures provided data on the aspects of the chronic conditions for which the specific programs were designed to address. This was also a critical tool that UWTC leaders used to communicate the impact of the LIVE WELL Initiative to stakeholders and that CBO staff used to facilitate the impact of specific program to stakeholders. Collectively, the evaluation of both standardized self-rated health measures and program-specific outcomes ensures accountability to participants and stakeholders.
Noteworthy from this study is the contribution of the evaluation team to the Initiative. As a core element of the overall initiative, the evaluation team also played an important role as the interface between UWTC (funding agency) and the CBOs (program providers). The evaluation team provided ongoing technical support to CBO leaders and their staff. Concurrent issues were raised to UWTC leaders for join problem solving, quality improvement, and plans of action. This role was critical because the core missions of all the partner organizations were not always aligned. Of note, the primary mission of the CBOs was service delivery to meet needs of clients; thus the collection of data for evaluation purposes was often new to the organization (Altman et al., Citation1991; Kreuter, Lezin, & Young, Citation2000; Merzel & D'Afflitti, Citation2003; Parker, Schulz, Israel, & Hollis, Citation1998; Plough & Olafson, Citation1994). To overcome this challenge, the evaluation team worked with the CBOs to find reasonable compromises that would provide the necessary data as well as service delivery to accommodate clients’ needs. The evaluation team also contributed to the sustainability of community-based programs by providing data reports that the CBOs could use to see seek funding opportunities outside the LIVE WELL Initiative, that is from other community partners, such as local hospital systems and county public health departments.
Although findings from this paper provide significant evidence of a successful collaborative partnership among a funding agency, CBOs, and evaluation team in a community setting, one particular limitation associated with a community-based service-delivery model ‒ high attrition rate ‒ should be addressed. As shown in , the data collection rates vary across programs ranging from 18.8% to 47.9% for , 17.6% to 46.7% for , and 16.6% to 93.7% for , respectively. The rates represent the percentage of data collected to show the change from baseline and follow-up assessments among clients enrolled in each program. A couple of reasons could explain the various rates. First, the rate for follow-up assessment by program was lower than expected in traditional intervention studies because of characteristics of community-based service settings. The priority of CBOs’ mission is to provide services to clients in need instead of data collection for evaluation. The data collection model is new to the existing culture of many CBOs (Cho et al., Citation2019). Furthermore, unlike traditional and pragmatic trials, obstacles such as refusing response, no response for follow-up calls, are a challenge to overcome to collect data. Second, the common health and program-specific measures at baseline and follow-up assessments were not available from the inception of the Initiative. In other words, for the first two years, the CBOs focused on recruiting the number of clients and delivering services instead of collecting measures. It was during the third year that each funded program was required to collect common outcome measures and program-specific outcome measures at baseline and follow-up assessment, to improve assessment data collection. Third, the CBOs began collecting the common measures (i.e., Healthy Days Measures) presented in this paper, during the fifth year. After a discussion among leadership of the funding agency and evaluation team, the funding agency decided to implement a new common health measure. As a result, the number of collected common health measures is much less than the number of clients served through the Initiative.
Conclusion
The findings of the LIVE WELL Initiative of the UWTC add to the growing literature on the evaluation of community-based interventions and programs addressing health promotion and well-being in local communities and with community leaders and workers. The 9-year history of the LIVE WELL Initiative documented here provides insight into the long-term direction of complex community-based health programs. In sum, creating a mutually respectful relationship by allowing flexibility in facing processes and ensuring that CBOs and service providers remained informed about changes well in advance of their implementation are emphasized in real-world settings to establish the science surrounding a comprehensive assessment of service delivery successfully. Open communication, a willingness to prepare audience-specific periodic reports, and friendly course corrections were instrumental in keeping programs on track, encouraging trust, and accruing dividends in shared goals and shared success as well as serving as a foundation for achieving sustainability. Future evaluation work may expand on the framework we provided here for use in developing evaluation strategies to promote successful partnerships in community settings.
Supplemental Material
Download MS Word (45.3 KB)Acknowledgments
The authors acknowledge the former and current project staff of the UWTC as well as the program leaders in each organization who made the most significant contribution to the implementation and evaluation of the LIVE WELL Initiative. These include Katrine White and Aisha Jackson at United Way of Tarrant County; Theresa Hocker, Susanna Luk-Jones, Teresa Linn, and Laura McEntire at Alzheimer’s Association North Central Texas Chapter; Lenee Bassham, Lynn Boyd, Donna Runion, and Donna Dempsey at Easterseals North Texas; Sherry Simon, Kathie Robinson, Brook Harris, Denise Blevins, Jennifer Lopez, Steven Wilson, Bill May, Lilly Frawley, Sam Powell, Allison Feather, Lynell Bond, and Steven Cook at Meals on Wheels, Inc. of Tarrant County; Liz Trevino, Derrick Villa, Cindy Delgado, Geraldine Whitaker, Jessica Allen, and Keneisha Houston at the North Texas Community Health Centers, Inc.; Jerry Mosman, Jennifer Severance, Christina Bartha, and Monique Barber at Sixty and Better, Inc.; and Katie Cardarelli, Anissa Carbajal-Diaz, Kim Linear, Marcela Nava, Erin Carlson, and Teresa Wagner at the University of North Texas Health Science Center.
Additional information
Funding
References
- Administration for Community Living. (2017). Health promotion. Retrieved from www.acl.gov/programs/health-wellness/disease-prevention.
- Altman, D. G., Endres, J., Linzer, J., Lorig, K., Howard-Pitney, B., & Rogers, T. (1991). Obstacles to and future goals of ten comprehensive community health promotion projects. Journal of Community Health, 16(6), 299–314. doi:10.1007/BF01324515
- Bähler, C., Huber, C. A., Brüngger, B., & Reich, O. (2015). Multimorbidity, health care utilization and costs in an elderly community-dwelling population: A claims data based observational study. BMC Health Services Research, 15(1), 23. doi:10.1186/s12913-015-0698-2
- Barile, J. P., Thompson, W. W., Zack, M. M., Krahn, G. L., Horner-Johnson, W., & Bowen, S. E. (2013). Multiple chronic medical conditions and health-related quality of life in older adults, 2004-2006. Preventing Chronic Disease, 10, E162. doi:10.5888/pcd10.120282
- Belle, S. H., Burgio, L., Burns, R., Coon, D., Czaja, S. J., Gallagher-Thompson, D., … Zhang, S. (2006). Enhancing the quality of life of dementia caregivers from different ethnic or racial groups: A randomized, controlled trial. Annals of Internal Medicine, 145(10), 727–738. doi:10.7326/0003-4819-145-10-200611210-00005
- Buttorff, C., Ruder, T., & Bauman, M. (2017). Multiple Chronic Conditions in the United States. RAND Corporation. Retrieved from www.rand.org/pubs/tools/TL221.html.
- Centers for Disease Control and Prevention. (2000). Measuring healthy days: Population assessment of health-related quality of life. Retrieved from https://www.cdc.gov/hrqol/pdfs/mhd.pdf.
- Cho, J., Luk-Jones, S., Smith, D. R., & Stevens, A. B. (2019). Evaluation of REACH-TX: A community-based approach to the REACH II intervention. Innovation in Aging, 3(3), igz022. doi:10.1093/geroni/igz022
- Frieson, C. W., Tan, M. P., Ory, M. G., & Smith, M. L. (2018). Editorial: Evidence-based practices to reduce falls and fall-related injuries among older adults. Front Public Health, 6, 222. doi:10.3389/fpubh.2018.00222
- Haas, L., 2012 Standards Revision Task Force, Maryniuk, M., Beck, J., Cox, C. E., Duker, P., Edwards, L., Fisher, E. B., Hanson, L., Kent, D., Kolb, L., McLaughlin, S., Orzeck, E., Piette, J. D., Rhinehart, A. S., Rothman, R., Sklaroff, S., Tomky, D., & Youssef, G. (2014). National standards for diabetes self-management education and support. Diabetes Care, 37 Suppl 1(Suppl 1Suppl 1), S144–S153. doi:10.2337/dc14-S144
- Hibbard, J. H., Mahoney, E. R., Stockard, J., & Tusler, M. (2005). Development and testing of a short form of the patient activation measure. Health Services Research, 40(6p1), 1918–1930. doi:10.1111/j.1475-6773.2005.00438.x
- Ivery, J., & Akstein-Kahan, D. (2010). The Naturally Occurring Retirement Community (NORC) Initiative in Georgia: Developing and managing collaborative Partnerships to support older adults. Administration in Social Work, 34(4), 329–343. doi:10.1080/03643107.2010.500974
- Jia, H., Muennig, P., Lubetkin, E. I., & Gold, M. R. (2004). Predicting geographical variations in behavioural risk factors: An analysis of physical and mental healthy days. Journal of Epidemiology and Community Health, 58(2), 150–155. doi:10.1136/jech.58.2.150
- Krapek, K., King, K., Warren, S. S., George, K. G., Caputo, D. A., Mihelich, K., … Lubowski, T. J. (2004). Medication adherence and associated hemoglobin A1c in type 2 diabetes. The Annals of Pharmacotherapy, 38(9), 1357–1362. doi:10.1345/aph.1D612
- Kreuter, M. W., Lezin, N. A., & Young, L. A. (2000). Evaluating community-based collaborative mechanisms: Implications for practitioners. Health Promotion Practice, 1(1), 49–63. doi:10.1177/152483990000100109
- Krousel-Wood, M., Thomas, S., Muntner, P., & Morisky, D. (2004). Medication adherence: A key factor in achieving blood pressure control and good clinical outcomes in hypertensive patients. Current Opinion in Cardiology, 19(4), 357–362. doi:10.1097/01.hco.0000126978.03828.9e
- Lorig, K. R., Sobel, D. S., Ritter, P. L., Laurent, D., & Hobbs, M. (2001). Effect of a self-management program on patients with chronic disease. Effective Clinical Practice : ECP, 4(6), 256–262.
- Marengoni, A., Angleman, S., Melis, R., Mangialasche, F., Karp, A., Garmen, A., … Fratiglioni, L. (2011). Aging with multimorbidity: A systematic review of the literature. Ageing Research Reviews, 10(4), 430–439. doi:10.1016/j.arr.2011.03.003
- Merzel, C., & D'Afflitti, J. (2003). Reconsidering community-based health promotion: Promise, performance, and potential. American Journal of Public Health, 93(4), 557–574. doi:10.2105/ajph.93.4.557
- Miller, C. K., & Bauman, J. (2014). Goal setting: An integral component of effective diabetes care. Current Diabetes Reports, 14(8), 509. doi:10.1007/s11892-014-0509-x
- Mingo, C. A., Smith, M. L., Ahn, S., Jiang, L., Cho, J., Towne, S. D., & Ory, M. G. (2014). Chronic Disease Self-Management Education (CDSME) program delivery and attendance among urban-dwelling African Americans. Front Public Health, 2, 174. doi:10.3389/fpubh.2014.00174
- Morisky, D. E., Ang, A., Krousel-Wood, M., & Ward, H. J. (2008). Predictive validity of a medication adherence measure in an outpatient setting. The Journal of Clinical Hypertension, 10(5), 348–354. doi:10.1111/j.1751-7176.2008.07572.x
- Morisky, D. E., Green, L. W., & Levine, D. M. (1986). Concurrent and predictive validity of a self-reported measure of medication adherence. Medical Care, 24(1), 67–74. doi:10.1097/00005650-198601000-00007
- National Center for Chronic Disease Prevention and Health Promotion. (2019). Chronic diseases in America. Retrieved from https://www.cdc.gov/chronicdisease/resources/infographic/chronic-diseases.htm.
- Ory, M. G., Ahn, S., Jiang, L., Smith, M. L., Ritter, P. L., Whitelaw, N., & Lorig, K. (2013). Successes of a national study of the Chronic Disease Self-Management Program: Meeting the triple aim of health care reform. Med Care, 51(11), 992–998. Nov). ‒. doi:10.1097/MLR.0b013e3182a95dd1
- Ounpuu, S., Chambers, L. W., Chan, D., & Yusuf, S. (2001). Validity of the US. Behavioral Risk Factor Surveillance System's health related quality of life survey tool in a group of older Canadians. Chronic Diseases in Canada, 22(3‒4), 93–101.
- Parker, E. A., Schulz, A. J., Israel, B. A., & Hollis, R. (1998). Detroit's East Side Village Health Worker Partnership: Community-based lay health advisor intervention in an urban area. Health Education & Behavior: The Official Publication of the Society for Public Health Education, 25(1), 24–45. doi:10.1177/109019819802500104
- Plough, A., & Olafson, F. (1994). Implementing the Boston Healthy Start Initiative: A case study of community empowerment and public health. Health Education Quarterly, 21(2), 221–234. doi:10.1177/109019819402100207
- Rask, K. J., Ziemer, D. C., Kohler, S. A., Hawley, J. N., Arinde, F. J., & Barnes, C. S. (2009). Patient activation is associated with healthy behaviors and ease in managing diabetes in an indigent population. The Diabetes Educator, 35(4), 622–630. doi:10.1177/0145721709335004
- Tennstedt, S., Howland, J., Lachman, M., Peterson, E., Kasten, L., & Jette, A. (1998). A randomized, controlled trial of a group intervention to reduce fear of falling and associated activity restriction in older adults. The Journals of Gerontology: Psychological Sciences and Social Sciences, 53(6), P384–P392.
- Tennstedt, S. L., Lawrence, R. H., & Kasten, L. (2001). An intervention to reduce fear of falling and enhance activity: Who is most likely to benefit? Educational Gerontology, 27(3-4), 227–240. doi:10.1080/036012701750194969
- Texas Health and Human Services Commission (2011). Texas Healthcare Transformation and Quality Improvement Program. Retrieved Project Number 11-W-00278/6 from https://www.medicaid.gov/Medicaid-CHIP-Program-Information/By-Topics/Waivers/1115/downloads/tx/tx-healthcare-transformation-fs.pdf.
- U. S. Census Bureau, P. D. (2017). Annual estimates of the resident population: April 1, 2010 to July 1, 2017, 2017 Population Estimates https://factfinder.census.gov/faces/tableservices/jsf/pages/productview.xhtml?src=CF.
- Zarit, S. H., Reever, K. E., & Bach-Peterson, J. (1980). Relatives of the impaired elderly: Correlates of feelings of burden. The Gerontologist, 20(6), 649–655. doi:10.1093/geront/20.6.649