
ABSTRACT
Studies of the role of phonological representations in learning to read have almost exclusively focused on speech perception. In the current study, we examined links between sensorimotor control of speech, reading, and reading-related abilities. We studied two languages, English and Dutch, which vary in the regularity of their spelling-to-sound mappings. There were 236 American and Dutch children, 4 to 8 years old, who performed an altered auditory feedback task in which the first formant of the /ɛ/ vowel was altered. A stronger response to altered feedback for literate relative to preliterate children was observed, and this was particularly the case for the Dutch children. Moreover, the magnitude of the responses was related to precursors of reading in preliterate children and to reading skill in literate children. We propose that these findings could be related to changes in children’s speech production skills that facilitate the integration of orthographic and phonemic information.
Introduction
Reading skill builds on speech and language skills (Mattingly, Citation1972), particularly during the early stages of reading development. Unlike learning to speak—which occurs automatically—learning to read has been called an “unnatural act,” which requires instruction (Liberman, Citation1989) and builds on preexisting neural networks that are developed for speech (Rueckl et al., Citation2015). The precise role of phonology in reading development and skilled reading (Leinenger, Citation2014) is hotly debated throughout the literature and is argued to differ across orthographies (Ziegler et al., Citation2010). Studies on developmental dyslexia often report that impaired phonological representations underlie reading deficiencies, but the nature of the phonological impairment is under debate (Ramus & Szenkovits, Citation2008). The present study probes one aspect of the speech system: integration of auditory information in the sensorimotor control of speech in children who vary in their reading skill.
A common notion in the literature is that if the representations of the speech sounds are suboptimal, it is hard to establish stable and automatized spelling-to-sound mappings (Boada & Pennington, Citation2006). Indeed, the phonological deficit hypothesis assumes impaired phonological representations to be at the core of difficulties in acquiring accurate and fluent reading in children with dyslexia (Snowling, Citation1981). A considerable amount of research has investigated speech perception as a proxy for the quality of phonological representations, but results are contentious. Children with dyslexia are sometimes shown to perform worse in speech perception tasks (Hakvoort et al., Citation2016). Also in typically reading children, strong correlations between early speech perception and later reading abilities have been reported (Boets et al., Citation2011). However, perceptual deficits in individuals with dyslexia have not always been found for all phonetic contrasts (Cornelissen, Hansen, Bradley, & Stein, Citation1996), not always under clear auditory (Ziegler, Pech-Georgel, George, & Lorenzi, Citation2009) or noisy conditions (Hazan, Messaoud-Galusi, & Rosen, Citation2012), and not for the majority of individuals with dyslexia (Manis et al., Citation1997). Remarkably, although phonological representations are hypothesized to have both perceptual and articulatory representations (Guenther, Ghosh, & Tourville, Citation2006), studies on the phonological deficit hypothesis have almost exclusively focused on speech perception. Examining speech production skills is often considered to be labor intensive, expensive, and difficult to reproduce (Farouk, Citation2014, p. 9). The few studies that have examined speech production skills in relation to reading report that reading development is associated with articulation (Catts, Citation1997; Foy & Mann, Citation2001, Citation2012) and speaking rate (Smith, Roberts, Lambrecht-Smith, Locke, & Bennett, Citation2006). Children with reading disability have also been found to perform more poorly when repeating multisyllabic words (Catts, Citation1986, Citation1989) and nonwords (see Melby-Lervåg & Lervåg, Citation2012). (Non)Word repetition, however, involves many cognitive abilities, including short-term memory and attention (Ramachandra, Hewitt, & Brackenbury, Citation2011), and cannot be taken as a pure measure of phonological representations. In short, speech perception deficits are not consistently reported in children with reading difficulties, and many speech production tasks may not isolate the underlying construct of phonological representations. We propose that, to further understand the role of phonological representations in reading, not only speech perception but also speech production should be taken into account. Moreover, perception and production systems are interdependent, and influential models of speech production indicate that speech feedforward and feedback mechanisms are crucially involved in the quality of phonological representations (Guenther et al., Citation2006; Hickok, Houde, & Rong, Citation2011).
The importance of speech feedforward and feedback mechanisms is often demonstrated by studies that apply altered auditory feedback that induce a mismatch between speech production and speech perception. These alterations in auditory feedback result in short-term changes in motor representations to adjust to the altered percept (Purcell & Munhall, Citation2006). More important, the change in production is associated with a change in perception (Shiller, Sato, Gracco, & Baum, Citation2009), consistent with speech motor actions playing an important role in speech perceptual representations. Although these mechanisms are shown to be crucially involved in phonological representations, they have not yet been adequately examined in emergent readers. In a recent study, we examined the sensorimotor control of speech using an altered auditory feedback paradigm to probe the quality of phonological representations in adults (Van Den Bunt et al., Citation2017). We argued that this sensorimotor control of speech is crucially involved in the adequate development of phonological representations (Guenther et al., Citation2006; Hickok et al., Citation2011) and directly reflects phonological processes, in contrast to measures such as phonological awareness, that also entail metalinguistic processing (Van Den Bunt et al., Citation2017). We found that adults with dyslexia responded differently in an altered auditory feedback task in which we changed the first formantFootnote1 of the /ɛ/ vowel in the participants’ production in the direction of the English /æ/ vowel. When we experimentally manipulate what the speaker hears (the auditory feedback) by adjusting the formant in such a way that their own production appears to deviate from what they intended to say, participants usually adjust their speech production in direction opposite to the adaptation. Adults with dyslexia adapted their speech production to a stronger extent when their productions were immediately fed back to them over the headphones with gradual alteration to the first formant of the vowel. They also returned to their baseline production to a lesser extent when the feedback was no longer altered. These findings suggest that adults with dyslexia have weaker sensorimotor representations that result in both an increase in the motor response to a perceptual error and a reduction in the ability to reestablish the representation when the error is removed. Although this study showed that the response to altered auditory feedback distinguishes typical and dyslexic adult readers, an important follow-up question is how the sensorimotor control of speech is related to individual differences in reading in children. If sensorimotor control indeed is a crucial mechanism in the development of phonological representations and if reading hinges on the quality of phonological representations, the sensorimotor control of speech should be associated with both individual differences in reading and reading-related skills in preliterate children.
In the literature on precursors of reading development, phonological awareness, letter knowledge, and rapid naming have often been used as indicators of the quality of phonological representations (Hester & Hodson, Citation2004; Nittrouer & Lowenstein, Citation2013). Although these measures do reflect phonological representations to some extent, other cognitive abilities are also heavily involved in performance on these measures. As such, poor performance on these measures does not necessarily indicate poor phonological representations but could also be the consequence of other limited cognitive capacities. Relating the sensorimotor control of speech to these precursors of reading will clarify to what extent these measures reflect the quality and stability of phonological representations and those language processes that act upon these representations.
A factor that may modulate the importance of phonological skills in learning to read is the orthographic transparency of the language in which a child is learning to read. Transparent orthographies contain mappings between spelling and speech sounds that are more consistent, whereas opaque orthographies have inconsistent mappings between spelling and speech sounds. English is a language with an extremely weak consistency in letter-sound mappings (Borgwaldt, Hellwig, & De Groot, Citation2005), yet the vast majority of studies on the precursors of reading have been conducted in English. This has led some to argue that the importance of phonological awareness has been overestimated and that phonological awareness is less important in transparent orthographies such as German or Dutch (Share, Citation2008). A number of studies have directly compared the influence of phonological skills as a function of orthographic transparency, but the results are mixed. For instance, Ziegler and colleagues (Citation2010) reported that phonological awareness is a significant predictor of reading ability in all alphabetic languages but that the relation is stronger in more opaque orthographies. Some, however, have concluded that phonological awareness is important only in English (Georgiou, Parrila, & Papadopoulos, Citation2008), whereas others have suggested that it is equally important across languages (Caravolas, Volín, & Hulme, Citation2005). More cross-language contrasts of basic speech related skills, and not merely metaphonological tasks, are required to make progress in our understanding of the cognitive basis for reading. In the current study we measured the sensorimotor control of speech in Dutch and English. On the notion that English has a highly inconsistent orthography in which letters do not consistently translate into the same sounds, it could be argued that learning to decode print will be less reliant than Dutch on the quality of those basic mechanisms associated with sensorimotor control of speech.
In summary, we examine the role of phonological representations in early reading by examining the response to altered auditory feedback in preliterate and literate children and relate this response to individual differences in reading and reading-related abilities across two languages with contrastive orthographic depths. We target three questions. First, is being able to read associated with a different response to manipulations in auditory feedback? Because phonology and reading are strongly intertwined, we hypothesize that being able to read would be associated with a different response to alterations in auditory feedback. If learning to read indeed has an impact on the response to altered auditory feedback, it may further elucidate what aspect of phonological representations are accessed during reading. Second, is the response to altered feedback related to individual differences in reading and reading-related abilities? On one hand, based on previous findings of a stronger response to altered feedback in adults with dyslexia (Van Den Bunt et al., Citation2017), we expect that stronger adaptation would be associated with weaker reading(-related) abilities. However, because learning to read also co-occurs with a change in phonological representations, a competing hypothesis is that in typically developing children, better reading and stronger reading-related abilities are associated with a stronger response to altered auditory feedback. Third, are the relations between the response to altered feedback and reading different between languages with contrasting orthographies- English and Dutch? On the assumption that a core aspect of all orthographies entails mapping orthographic forms to the systems supporting phonology (Rueckl et al., Citation2015) we anticipate relations between the sensorimotor control of speech and reading in both languages; however, the strength of the relation may be stronger for Dutch with its more transparent orthography, due to the greater covariance between spoken and written forms.
Methods
Participants
Participants in the U.S. sample were taken from the participant pool of a 3-year ongoing longitudinal study. They were recruited from the New Haven, Connecticut, area over 2½ years. Children in the U.S. sample entered the study at one of two time points: (a) between preschool and the first half of kindergarten (N = 50; Mage = 5.48, SDage = 0.64) or (b) between the last quarter of kindergarten and first quarter of Grade 1 (N = 46; Mage = 7.19, SDage = 0.52). These children completed the altered auditory feedback task during the 2nd year of the larger longitudinal study. All children were native English speakers with little or no exposure to a second spoken language. In addition to the altered auditory feedback task, all children also participated in literacy assessment sessions that measured their phonological awareness skills, rapid naming ability, letter knowledge, basic word recognition, and decoding skills. Written consent was obtained from both the primary guardians and the child participants prior to beginning the study.
Participants in the Dutch sample were recruited in two waves. During the first wave, 53 schools in the surroundings of Nijmegen were approached to participate in a study on predictors of reading development. Six schools gave permission to administer cognitive tests during school hours across 3 consecutive years, while children moved from kindergarten to Grade 2. Response to altered auditory feedback in these children was assessed at the end of Grade 2 (Mage = 7.98, SDage = .31) in 106 children. Three children were bilingual; all children were fluent speakers of Dutch. To examine differences in the responsivity to altered auditory feedback in children at different stages of reading development, an additional group of 43 children was recruited at one school during the second wave. Ten of them were in kindergarten (Mage = 5.45 years, SDage = .36), 16 at the beginning of Grade 1 (Mage = 6.69 years, SDage = .45), and 16 at the beginning of Grade 2 (Mage = 7.72 years, SDage = .71). This school was located in a multicultural neighborhood, and the majority of these children (31 of 42) were bilingual; all of these children were fluent speakers of Dutch except one, whose data were excluded from analyses. Measures of phonological awareness, letter knowledge, rapid naming, and reading were obtained for all children. All parents consented with participation of their child in this study.
For this study, participants in both the U.S. and Dutch samples were classified as preliterate or literate based not on grade level but on the actual reading level (nonword reading score of zero is preliterate; all others are considered literate children).
Materials
Phonological awareness
Phonological awareness was measured using the Clinical Test of Phonological Processing, second edition (CTOPP-2, Wagner, Torgesen, Rashotte, & Pearson, Citation2013), for the U.S. sample, and a translated version of the first edition of the CTOPP (Wagner, Torgesen, & Rashotte, Citation1999), by the first author, for the Dutch sample. The Elision and Blending Words subtests were administered to all participants. The Elision subtest consisted of 34 items (20 in the Dutch version) and measured the ability of an individual to repeat a word with a specific sound omitted (e.g., say /bold/ without saying /b/). The Blending Words subtest consisted of 33 items (20 in the Dutch version) and measured the ability to combine sounds to form words (e.g. What word do these sounds make: /t/-/oy/?).
Rapid naming
Rapid naming was measured using the colors and objects cards of the CTOPP-2 (Wagner et al., Citation2013) for the U.S. sample and of the Clinical Evaluation of Language Functions, fourth edition, for the Dutch sample (Kort, Schittekatte, & Compaan, 2004). The card of colors in CTOPP-2 contained four rows by nine columns of squares filled with one of six colors. The card of objects in CTOPP-2 contained four rows by nine columns of six objects. Prior to beginning the rapid naming tasks, each participant had a practice session in which they named each color and object once to ensure that they were familiar with the names of the colors and objects. The Dutch cohort used a card with colors consisting of six rows with six circles filled with one of four unique colors. The card with objects consisted of six rows with four objects. The total time in seconds for each card was used as the score for rapid naming.
Letter knowledge
Children in the U.S. sample completed the Woodcock Johnson Test of Achievement–Third Edition. The Letter-Word Identification subtest assessed participants’ letter and word knowledge (Woodcock, McGrew, & Mather, Citation2001), with a total of 76 items. The subtest ranged from single letter identification (e.g., M) to sight word identification (e.g., “therapeutic”). The task began with an age-appropriate start point to establish a basal, which was measured by the six lowest consecutive correct responses. The task ended when participants reached a ceiling indicated by the six highest consecutive incorrect responses.
In the Dutch sample, letter knowledge was measured using a card with all 34 graphemes of the Dutch language on it. The child was asked to articulate all graphemes, without a time limit. The number of correctly articulated graphemes was the score on letter knowledge. Because this measure shows ceiling effects for readers, it was administered to the children only in kindergarten or at the beginning of Grade 1.
Reading
In the U.S. sample, reading ability was measured using the Tests of Word Reading Efficiency (Wagner et al., Citation1999) nonword reading Phonetic Decoding Efficiency subtest. This test required children to read as many nonwords as possible, of increasing difficulty (in terms of length and phonological complexity), in 45 s.
In the Dutch sample, reading ability was measured using a standardized nonword reading test Klepel (Van Den Bos, Spelberg, Scheepstra, & De Vries, Citation1994). This test consisted of one card with 120 phonotactically legal nonwords of increasing difficulty. The children were asked to read as many items as possible within 2 min. The used reading score consisted of the total number of correctly read items in the 1st min.
The total number of accurately read items was converted to score of correctly read nonwords per minute for use in analyses. A log-transformation was applied to this score because the measure was skewed to the right in both languages.
Altered auditory feedback
The altered auditory feedback task was the same for both samples. Participants were asked to produce the nonword /bɛp/ when a specific cartoon figure appeared on the screen. The figure remained on the screen for 2 s while the participant’s speech was automatically recorded at 44.1 kHz. Participants were instructed to speak only when the figure was on the screen and to say nothing other than the nonword /bɛp/ throughout the experiment. The participant’s speech was amplified and accompanied by pink noise to eliminate the perception of bone-conducted sound and thus ensured that the participant perceived the altered signal instead of hir or her own voice while speaking. Before the experiment, the task was explained, and the participant completed a few practice trials. The task consisted of four phases, as illustrated in . The baseline phase consisted of 30 trials in which the first formant (F1) of the vowel was unaltered to enable measuring a child’s baseline production and variability of the /ɛ/ vowel. In the ramp phase, the F1 was gradually increased to the maximal perturbation of a 25% increase in F1 over 25 trials, gradually changing the /ɛ/ sound in the direction of the English /æ/. The ramp phase helped to keep the alteration in altered auditory feedback unconscious for the child. The hold phase consisted of 25 trials in which the alteration of the feedback was kept at maximum. The after-effect phase consisted of 15 trials in which the feedback was unaltered again to measure how well and fast a child returned to his baseline. In the case of a missed trial (due to lack of response from the participant), the trial would be repeated immediately until a response was recorded. Thus, the set number of trials in a given phase was always reached before moving on to the next phase. It is important to note that acoustically, the perturbation is equal across languages. On a perceptual level, however, a 25% increase in the frequency of the first formant of the /ɛ/ vowel results in a sound close to the English /æ/ vowel. Because this is a nonexisting vowel in Dutch, perceptually, the adaptation might have approached the phoneme boundary of another vowel for the U.S. sample but not for the Dutch.
Figure 1. Design of the altered auditory feedback task.
Participants in the U.S. sample wore a lavalier microphone around the neck. The Dutch sample spoke the nonword /bɛp/ in a Sennheiser e835 FX microphone (Sennheiser Electronic GmbH & Co. KG, Wedemark, Germany) that was positioned in close proximity to the mouth. Both groups of participants wore noise-canceling headphones (HD360 Pro, Sennheiser Electronic GmbH&Co., KG, Germany) to receive the feedback. Two methodologies were used to alter the signal and present the modified feedback signal to the participants. For all U.S. participants and participants of the first wave in the Netherlands, the produced speech was amplified using a microphone amplifier (Tube UltraGain MIC100, Behringer GmbH, KG, Germany) and split in two separate streams. In one stream, the signal was unaltered. In the other stream, the formants were altered by a sound signal processor (VoiceOne, TC Helicon Vocal Technologies, Victoria, Canada). Next, both streams were entered into an analogue filterbox (852, Wavetek, San Diego, CA). The altered stream was low-pass filtered at 1.25 kHz, and the unaltered stream was high-pass filtered at 1.25 kHz. For children of this age, the first formant of the /ɛ/ vowel is always below 1.25 kHz and the second formant always above 1.25 kHz. Because the alteration of the speech signal takes approximately 10 ms, the unaltered stream was also delayed by 10 ms using an audio delay box (DataVideo AD100, Datavideo Technologies Europe BC, Utrecht, the Netherlands). Last, the two streams and the noise signal were combined (Skytek, STM3004, Skytronic, Manchester, UK) and amplified in a headphone amplifier (HA400, Behringer GmbH, KA, Germany). For the Dutch participants recruited during the second wave, the Audapter software (Cai, Ghosh, Guenther, & Perkell, Citation2008; Tourville, Cai, & Guenther, Citation2013) and an external audio-card (Roland UA-25 EX, Hamamatsu, Japan) were used to alter the speech. The different methods of inducing altered auditory feedback did not affect the magnitude of adaptation.Footnote2
Analysis
Altered auditory feedback processing
The first formants of the produced utterances and of the manipulated signal during the hold phase were estimated using a robust formant tracking algorithm that performs well in a noisy environment (e.g., at schools) and with speaker variability (Mustafa & Bruce, Citation2006). The coefficient of variation of the /bɛp/ productions during baseline was calculated for every participant individually and used as a measure of speech production stability. For the response to altered auditory feedback, it was first examined whether the applied manipulation was at least greater than 10%. This was not the case for six participants in the Dutch sample and four participants in the U.S. sample, and thus these participants were excluded from further analyses. In addition, six participants in the U.S. sample and one participant in the Dutch sample were excluded because the first formant of a large number of trials (> 25) could not be estimated.
Internal consistency was evaluated per phase by calculating Cronbach’s alpha: Coefficients showed excellent internal consistency for the ramp (α = .89), hold (α = .95), and after-effect (α = .92) phases.
Results
The characteristics of participants included in the final sample are summarized in .
Table 1. Participant Characteristics and Descriptives for Performance During the Altered Auditory Feedback Task, Separately for the U.S. and Dutch Preliterate and Literate Children.
Motor stability and reading
First, we checked whether the groups differed in speech production variability during baseline. A two (preliterate vs. literate) by two (English vs. Dutch) Welch’s analysis of variance on the coefficient of variation of the first formant during the baseline phase showed that variation in vowel production was similar across reading stages and languages, F(34.62) = 1.81, p = .164.
Next, we examined whether the coefficient of variation correlated with reading and reading-related abilities, separately for preliterate and literate children. Only the number of read nonwords per minute in the literate group significantly correlated with the coefficient of variation (r = −.20, p = .006): Literate children who read more nonwords per minute showed less variation in vowel production. No significant correlations were found between the coefficient of variation during the baseline phase and reading-related measures (rapid naming, letter knowledge and phonological awareness), in the literate or preliterate children (all ps > .10).
Sensorimotor control and reading
Linear mixed-effects models were employed on the raw F1 scores using the lmer function of the lme4 package (Bates, Maechler, Bolker, & Walker, Citation2014) in R (Version-3.2.3, R Core Team, Citation2014). The p values within the model were estimated using Satterthwaite approximations (Kuznetsova, Brockhoff, & Christensen, Citation2015). The null model for all analyses included main effects for the different phases, for trial number within each of the phases, an interaction of trial by phase, and main effects for language and age. The within-model approximations revealed significant effects for age (older age was associated with lower first formant: β = −35.72, p < .001) and Dutch language (compared to English, β = −130.44, p < .001). More interesting, significant effects were found for the ramp (β = −12.89, p < .001), hold (β = −36.58, p < .001), and after-effect (β = −25.74, p < .001) phases, which indicate the expected opposing response to the manipulation. In addition, significant Phase × Trial interaction effects were found for the ramp (β = −6.06, p < .001) and after-effect (β = 8.11, p < .001) phases. These interaction effects indicate that during the ramp phase, the response deviated further from baseline as a function of trial and that during the after-effect phase, the response got closer to baseline as a function of trial.
After this, the best model fit was obtained by performing analyses of variance on sequential models, starting from the null model, gradually adding the reading-related measures and moving to complex models. The best model fit was obtained by likelihood ratio tests using the maximum likelihood criterion. First, the ability to read (preliterate vs. literate) was added to the null model. A model with two-way interactions of phase by trial and phase by ability to read was significantly better than the null model, χ2 (4) = 17.38, p = .002. However, a three-way interaction of phase by trial by ability to read was significantly better than the model with the two interaction terms, χ2 (4) = 11.71, p = .020. This model showed a significantly stronger adaptation response in the hold (β = −21.66, p = .004) and after-effect (β = −18.97, p = .011) phases for literate children. Moreover, literate children showed a marginally significant stronger adaptation response as a function of trial during the ramp (β = −6.20, p = .053) and the hold (β = −8.79, p = .009) phases. To create a graphical depiction of the results, the standardized F1 for each trial was calculated, using the mean and standard deviation of the baseline phase. depicts the response to altered feedback for the two groups with the samples of different languages collapsed because no interaction with language was found.
Figure 2. Adaptation response to altered auditory feedback split for preliterate and literate children; error bars represent ± 1 standard error of the mean.
Next, the number of read nonwords per minute, using the literate children only, was added to the null model. Adding a Phase × Nonwords per Minute interaction to the baseline model did not significantly improve the model, χ2 (4) = 5.07, p = .280. A three-way interaction of phase by trial by nonwords per minute showed a significant effect of the read nonwords per minute, χ2 (8) = 17.15, p = .029. The within-model approximation showed only a marginally significant effect: Nonword reading was associated with a faster (= Trial × Phase) deviation from the baseline (β = −4.07, p = .057). Moreover, the only further significant improvement of the model was a four-way interaction with phase, trial, nonwords per minute, and language, χ2 (15) = 25.27, p = .046. The within-model approximation showed that the reading response to altered auditory feedback relation was particularly driven by the Dutch participants with a stronger (β = −20.26, p = .048) and faster (β = −16.45, p < .001) deviation from the baseline in the hold phase of the experiment. Adding other interactions did not significantly improve the model.
Last, we examined whether reading-related measures were correlated with the response to altered auditory feedback, separately for preliterate children and literate children. Scores for phonological awareness, rapid naming, and letter knowledge (for the preliterate group) were separately standardized and averaged per subtest, per language, and per reading group and correlated to the slope of adaptation during the ramp phase, the total adaptation during the hold phase, and the slope during the after-effect phase, all derived from the random effects structure of the null model. As summarized in , in the preliterate children, phonological awareness (r = −.27, p = .039), rapid naming (r = .38, p = .003), and letter knowledge (r = −.27, p = .041) all showed a significant correlation with response to altered feedback during the hold phase but no significant correlations with the slope during the ramp (phonological awareness: r = −.06; rapid naming: r = .18; letter knowledge: r = .06) or after-effect (phonological awareness: r = .03; rapid naming: r = −.18; letter knowledge: r = .02) phases. For the literate children, no significant correlations were found for phonological awareness (all rs < .05) or rapid naming (all rs < .10). depicts the significant correlations in the group of preliterate children.
Table 2. Correlations of the Reading Related-Measures With the Response to Altered Auditory Feedback.
Table 3. Correlations of the Reading Related-Measures With the Response to Altered Auditory Feedback.
Figure 3. Significant correlations between reading-related measures and response to altered feedback in the preliterate children. Note. Scores on the y-axis represent the relative adaptation score retrieved from the random effects structure from the linear mixed-effects model. The lower the score, the stronger the adaptation in response to altered feedback during the hold phase.
Finally, correlational analyses were performed separately for Dutch and U.S. children across groups of literacy to examine how established cognitive correlates of reading relate to the response to altered feedback (see ).
Discussion
In the current study, we examined how the sensorimotor control of speech—hypothesized to be important for the adequate development of phonological representations—was associated with reading skill in young children. We first examined whether speech production variability was related to reading skill, which was found to be the case within the group of literate children. Next, we found that the response to altered auditory feedback was related to reading stage (preliterate vs. literate), in literate children was related to reading skill, and in preliterate children was associated with predictors of reading development. Moreover, we found that the association between reading and the response to altered auditory feedback was stronger for the Dutch literate children. The literate children deviated from their baseline production faster than the preliterate children in the ramp phase and had a stronger deviation from the baseline during the hold and after-effect phases. Within the group of literates only, better reading skill was associated with a faster deviation from baseline during the ramp phase. Last, the Dutch participants showed a stronger and faster deviation from baseline during the hold phase as a function of read nonwords per minute. In the preliterate children, we found that a stronger response to altered feedback was associated with better skills in phonological awareness, rapid naming, and letter knowledge. These relations of the precursors of reading with response to altered feedback within the preliterate children reinforce the idea that the literacy effects (i.e., a stronger response to altered auditory feedback in the children able to read and a stronger response for the children with better reading skills) is not a general age-related effect but is associated with learning to read itself.
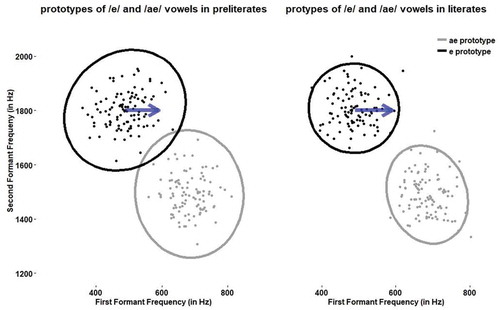
To shed light on the relevance of the association between children’s response to altered auditory feedback and their reading skill, it is useful to turn to the speech motor control literature in adults. In adults, the magnitude of the response to altered feedback is influenced by the characteristics of an individual’s vowel space. Specifically, Niziolek and Guenther (Citation2013) found that perturbed feedback that results in an alteration at the border of a phonemic category yields a stronger response than altered feedback close to the center of the category (Niziolek & Guenther, Citation2013). With increasing age, dispersion across F1–F2 space of different productions of the same vowel reduces, resulting in the area taken up by a particular vowel category becoming more compact and more separate from those of other vowel categories (Yang & Fox, Citation2013). If we consider the larger response to altered auditory feedback in literate compared to preliterate children in light of the developmental changes in acoustical vowel space and the findings in adults that the magnitude of the altered auditory feedback response is influenced by phonemic categories, it indicates that the exemplar areas of the vowel category in literate children is likely to have been smaller (more compact), which resulted in the alteration being closer to the category boundary. In the preliterate children, who are likely to have a vowel category that is characterized by more widely dispersed exemplars, the alteration (which was of the same size) was further away from the category boundary, presumably resulting in a smaller altered auditory feedback response. In we have depicted how this narrower vowel space could lead to altered auditory feedback that is closer to phoneme boundaries.
Figure 4. A proposal for what might happen in the vowel space as children become increasingly literate. Note. The vowel productions of the preliterate and literate children are simulated with the exact same parameters and variability. However, literate children might have built a narrower prototype of the involved vowels. With an equal alteration in auditory feedback (the arrow), this leads to perturbations that are close to the phoneme boundary in the literate children (hence, a stronger adaptation response) and further away from the boundary in the preliterate children (hence, a weaker adaptation response).
The changes in vowel space characteristics apparently co-occur with, and possibly facilitate, the integration of orthography into previously established phonological representations. From this perspective, learning to read is associated with changes in representations, making them into highly contrastive and consciously addressable phonemic representations. Following the same line of reasoning, the positive correlation in the preliterate children between the response to altered feedback and performance on important precursors of reading is a possible indication that these hypothesized changes in vowel space characteristics precede formal literacy instruction. This interpretation matches with neural findings in early literacy research. For instance, Pugh and colleagues (Citation2013) reported that reading readiness is positively associated with the amount of activation in inferior frontal gyrus (a region critical for speech-motor production) during the processing of spoken words and nonwords. Both the results of the current study and the neural findings by Pugh and colleagues (Citation2013) suggest an increasingly fine-grained analysis of speech as the child is shaping its (neural) speech system to become an efficient reader.
Of interest, we found that reading-related skills were similarly related to the response to altered auditory feedback for both English and Dutch in preliterate children but that reading fluency was related to the response to altered auditory feedback to a stronger extent in the Dutch literate children. Thus, we suggest here that at the level of constructing a basic reading circuit, the binding of speech mechanisms to print processing is similar in these languages. This would seem to make sense given our recent neurobiological finding in four languages that print/speech binding in perisylvian cortex is similar across four languages contrastive in orthographic depth (Rueckl et al., Citation2015). At some level, the dependence on speech appears universal, and the current data conform to this notion. We also found that in literate children the relation of this responses to modification was actually stronger in Dutch. We tentatively suggest that this may merely reflect developmental differences in acquisition of reading; it is well established that fluency develops faster in languages with transparent orthographies (Ellis et al., Citation2004). As such, the predictive utility of reading fluency may not yet be relevant in our U.S. sample. We must test this by seeing whether the links between individual differences in reading fluency become more similar in older cohorts learning to read English. Another factor that relates to these differences between the U.S. and Dutch sample is that the recruitment and teaching methodology differs between the two samples, and this could have impacted the differences in the response to altered auditory feedback. Follow-up experimental studies should minimize any differences in reading instruction or recruitment across cross-lingual samples to maximize the interpretability of the results.
The methodology and the results of the current study provide new opportunities to address the role of phonology in reading. First, the present study shows not only that the relation between phonology and orthography is demonstrable with meta-linguistic or speech perception measures but also that the quality of children’s phonological representations as reflected in their speech production are also associated with reading skill. Follow-up studies could directly measure acoustic characteristics of the vowel space and relate them to reading development and the response to altered auditory feedback. Another interesting follow-up could address the issue of the direction of the association by providing literacy instruction to 4- to 5-year-olds in an experimental and longitudinal design and measure whether learning to read changes the phonological representations, or whether the sensitivity to altered auditory feedback predicts learning rates in reading. It is possible that, over time, reading instruction has developed to be given in a versatile period in which the vowel space is reorganizing itself and that this reorganization accommodates the acquisition of automatized and stable grapheme-phoneme representation.
The current study examined how the sensorimotor control of speech was related to reading and reading-related skills in children. The results of the study show that becoming a reader is related to a stronger response to altered auditory feedback in both a transparent and an opaque orthography. We propose that this stronger response could be related to changes in the characteristics of the vowel space that facilitate the integration of orthographic information with phonological representations. The methodological concepts and the findings of the current study open up new possibilities to examine the (reciprocal) role of phonology in reading.
Additional information
Funding
Notes
1 Formants are spectral peaks in the speech signal, and the first two formants largely determine the identity of the vowel. For instance, adult men produce the /ɛ/ vowel, on average, with an F1 frequency of 530 Hz and an F2 frequency of 1850 Hz, whereas the /æ/ is produced with an F1 frequency of 660 Hz and an F2 frequency of 1700 Hz.
2 To make sure the adaptation was equal across methods and samples, we calculated the formants of the adapted signal and calculated whether the percentage change during the hold phase was the same for the Voice-One method in the U.S. and first wave of the Dutch sample and the Audapter method in the second wave of the Dutch sample. On average, the adaptation during the hold phase for the Voice-One method was 20.59% for the U.S. sample and 19.42% for the first wave of the Dutch sample; the adaptation using the Audapter software was 21.10% on average. Welch’s t test did not reveal any statistically significant differences between the amount of adaptation (all ps > .13).
References
- Bates, D., Maechler, M., Bolker, B., & Walker, S. (2014). lme4: Linear mixed-effects models using Eigen and S4. Retrieved from http://cran.r-project.org/package=lme4
- Boada, R., & Pennington, B. F. (2006). Deficient implicit phonological representations in children with dyslexia. Journal of Experimental Child Psychology, 95(3), 153–193. doi:10.1016/j.jecp.2006.04.003
- Boets, B., Vandermosten, M., Poelmans, H., Luts, H., Wouters, J., & Ghesquière, P. (2011). Preschool impairments in auditory processing and speech perception uniquely predict future reading problems. Research in Developmental Disabilities, 32(2), 560–570. doi:10.1016/j.ridd.2010.12.020
- Borgwaldt, S. R., Hellwig, F. M., & De Groot, A. M. B. (2005). Onset entropy matters - Letter-to-phoneme mappings in seven languages. Reading and Writing, 18, 211–229. doi:10.1007/s11145-005-3001-9
- Cai, S., Ghosh, S. S., Guenther, F. H., & Perkell, J. (2008). A system for online dynamic perturbation of formant frequencies and results from perturbation of the Mandarin triphthong/iau/. In Proceedings of the 8th Intl. Seminar on speech production (pp. 65–68), Strasbourg, France.
- Caravolas, M., Volín, J., & Hulme, C. (2005). Phoneme awareness is a key component of alphabetic literacy skills in consistent and inconsistent orthographies: Evidence from Czech and English children. Journal of Experimental Child Psychology, 92(2), 107–139. doi:10.1016/j.jecp.2005.04.003
- Catts, H. W. (1986). Speech production/phonological deficits in reading-disordered children. Journal of Learning Disabilities, 19(8), 504–508. http://doi.org/10.1177/0022219486019008
- Catts, H. W. (1989). Speech production deficits in developmental dyslexia. Journal of Speech and Hearing Disorders, 54, 422–428.
- Catts, H. W. (1997). The early identification of language-based reading disabilities. Language, Speech, and Hearing Services in Schools, 28(1), 86–87. doi:10.1044/0161-1461.2801.86
- Cornelissen, P. L., Hansen, P. C., Bradley, L., & Stein, J. F. (1996). Analysis of perceptual confusions between nine sets of consonant-vowel sounds in normal and dyslexic adults. Cognition, 59(3), 275–306. doi:10.1016/0010-0277(95)00697-4
- Ellis, N. C., Natsume, M., Stavropoulou, K., Hoxhallari, L., Van Daal, V. H. P., Polyzoe, N., … Petalas, M. (2004). THe effects of orthographic depth on learning to read alphabetic, syllabic, and logographi scripts. Reading Research Quarterly, 39(4), 438–468. doi:10.1598/RRQ.39.4.5
- Farouk. (2014). Application of Wavelets in speech processing. Springer Briefs in Speech Technology. doi:10.1007/978-3-319-02732-6_2
- Foy, J. G., & Mann, V. (2001). Does strength of phonological representations predict phonological awareness in preschool children? Applied Psycholinguistics, 22, 301–325. doi:10.1017/S0142716401003022
- Foy, J. G., & Mann, V. A. (2012). Speech production deficits in early readers: Predictors of risk. Reading and Writing, 25, 799–830. doi:10.1007/s11145-011-9300-4
- Georgiou, G. K., Parrila, R., & Papadopoulos, T. C. (2008). Predictors of word decoding and reading fluency across languages varying in orthographic consistency. Journal of Educational Psychology, 100(3), 566–580. doi:10.1037/0022-0663.100.3.566
- Guenther, F. H., Ghosh, S. S., & Tourville, J. A. (2006). Neural modeling and imaging of the cortical interactions underlying syllable production. Brain and Language, 96, 280–301. doi:10.1016/j.bandl.2005.06.001
- Hakvoort, B., De Bree, E., Van Der Leij, A., Maassen, B., Van Setten, E., Maurits, N., & Van Zuijen, T. L. (2016). The role of categorical speech perception and phonological processing in familial risk children with and without dyslexia. Journal of Speech Language and Hearing Research, 59(6), 1448. doi:10.1044/2016_JSLHR-L-15-0306
- Hazan, V., Messaoud-Galusi, S., & Rosen, S. (2012). The effect of talker and token variability on speech perception in noise in children with dyslexia. Journal of Speech, Language, and Hearing Research, 56(1), 44–62. doi:10.1044/1092-4388(2012/10-0107)
- Hester, E., & Hodson, B. W. (2004). The role of phonological representation in decoding skills of young readers. Child Language Teaching and Therapy, 20(2), 115–133. doi:10.1191/0265659004ct266oa
- Hickok, G., Houde, J., & Rong, F. (2011). Sensorimotor integration in speech processing: Computational basis and neural organization. Neuron, 69(3), 407–422. doi:10.1016/j.neuron.2011.01.019
- Kuznetsova, A., Brockhoff, P., & Christensen, R. H. (2015). lmerTest: Tests in linear mixed effects models. Retrieved from http://cran.r-project.org/package=lmerTest
- Leinenger, M. (2014). Phonological coding during reading. Psychological Bulletin, 140(6), 1534–1555. doi:10.1037/a0037830
- Liberman, A. M. (1989). Reading is hard just because listening is easy. (C. Von Euler, I. Lundberg, & G. Lennerstrand, Eds.). Hampshire, England: Macmillan.
- Manis, F. R., Mcbride-Chang, C., Seidenberg, M. S., Keating, P., Doi, L. M., Munson, B., & Petersen, A. (1997). Are speech perception deficits associated with developmental dyslexia? Journal of Experimental Child Psychology, 66(2), 211–235. doi:10.1006/jecp.1997.2383
- Mattingly, I. G. (1972). Reading, the linguistic process, and linguistic awareness. In J. F. Kavenagh & I. G. Mattingly (Eds.), Language by ear and by eye. Cambridge, MA: MIT Press.
- Melby-Lervåg, M., & Lervåg, A. (2012). Oral language skills moderate nonword repetition skills in children with dyslexia: A meta-analysis of the role of nonword repetition skills in dyslexia. Scientific Studies of Reading, 16(1), 1–34. http://doi.org/10.1080/10888438.2010.537715
- Mustafa, K., & Bruce, I. C. (2006). Robust formant tracking for continuous speech with speaker variability. IEEE Transactions on Audio, Speech and Language Processing, 14(2), 435–444. doi:10.1109/TSA.2005.855840
- Nittrouer, S., & Lowenstein, J. H. (2013). Perceptual organization of speech signals by children with and without dyslexia. Research in Developmental Disabilities, 34(8), 2304–2325. doi:10.1016/j.ridd.2013.04.018
- Niziolek, C. A., & Guenther, F. H. (2013). Vowel category boundaries enhance cortical and behavioral responses to speech feedback alterations. Journal of Neuroscience, 33(29), 12090–12098. doi:10.1523/JNEUROSCI.1008-13.2013
- Pugh, K., Landi, N., Preston, J., Mencl, W. E., Austin, A. C., Sibley, D., … Seidenberg, M. S. (2013). The relationship between phonological and auditory processing and brain organization in beginning readers. Brain and Language, 125(2), 173–183. doi:10.1016/j.bandl.2012.04.004
- Purcell, D. W., & Munhall, K. G. (2006). Adaptive control of vowel formant frequency: Evidence from real-time formant manipulation. The Journal of the Acoustical Society of America, 120(2), 966–977. http://doi.org/10.1121/1.2217714
- R Core Team. (2014). R: A language and environment for statistical computing. Vienna, Austria: R Foundation for Statistical Computing. Retrieved from https://www.R-project.org/
- Ramachandra, V., Hewitt, L. E., & Brackenbury, T. (2011). The relationship between phonological memory, phonological sensitivity, and incidental word learning. Journal of Psycholinguistic Research, 40(2), 93–109. http://doi.org/10.1007/s10936-010-9157-8
- Ramus, F., & Szenkovits, G. (2008). What phonological deficit? Quarterly Journal of Experimental Psychology (2006), 61(July2014), 129–141. doi:10.1590/S1516-80342007000400015
- Rueckl, J. G., Paz-Alonso, P. M., Molfese, P. J., Kuo, W.-J., Bick, A., Frost, S. J., … Frost, R. (2015). Universal brain signature of proficient reading: Evidence from four contrasting languages. Proceedings of the National Academy of Sciences, 112(50), 15510–15515. doi:10.1073/pnas.1509321112
- Share, D. L. (2008). On the Anglocentricities of current reading research and practice: The perils of overreliance on an “outlier” orthography. Psychological Bulletin, 134(4), 584–615. doi:10.1037/0033-2909.134.4.584
- Shiller, D. M., Sato, M., Gracco, V. L., & Baum, S. R. (2009). Perceptual recalibration of speech sounds following speech motor learning. The Journal of the Acoustical Society of America, 125(February), 1103–1113. doi:10.1121/1.3058638
- Smith, A., Roberts, J., Lambrecht-Smith, S., Locke, J. L., & Bennett, J. (2006). Reduced speaking rate as an early predictor of reading disability. American Journal of Speech-Language Pathology, 15(3), 289–297. doi:10.1044/1058-0360(2006/027)
- Snowling, M. J. (1981). Phonemic deficits in developmental dyslexia. Psychological Research, 43, 219–234. doi:10.1007/BF00309831
- Tourville, J. A., Cai, S., & Guenther, F. H. (2013). Exploring auditory-motor interactions in normal and disordered speech. In Proceedings of the 165th meeting of the acoustical society of America. Montreal, Canada.
- Van Den Bos, K. P., Spelberg, H. C. L., Scheepstra, A. J. M., & De Vries, J. R. (1994). De Klepel. Een test voor de leesvaardigheid van pseudo-woorden [The Klepel. A test for the ability to read pseudo-words]. Nijmegen, the Netherlands: Berkhout Testmateriaal.
- Van Den Bunt, M. R., Groen, M. A., Ito, T., Francisco, A. A., Gracco, V. L., Pugh, K. R., & Verhoeven, L. (2017). Increased response to altered auditory feedback in dyslexia: A weaker sensorimotor magnet implied in the phonological deficit. Journal of Speech, Language, and Hearing Research, 60(3), 654–667. doi:10.1044/2016_JSLHR-L-16-0201
- Wagner, R. K., Torgesen, J. K., & Rashotte, C. A. (1999). Comprehensive test of phonological processing. Austin, TX: PRO-ED.
- Wagner, R. K., Torgesen, J. K., Rashotte, C. A., & Pearson, N. A. (2013). Comprehensive test of phonological processing – 2nd ed. (CTOPP-2). Austin, TX: Pro-Ed.
- Woodcock, R. W., McGrew, K. S., & Mather, N. (2001). Woodcock Johnson III Tests of Achievement. Rolling Meadows, IL: Riverside Publishing.
- Yang, J., & Fox, R. A. (2013). Acoustic development of vowel production in American English children. Proceedings of the Annual Conference of the International Speech Communication Association, INTERSPEECH (August), Lyon, France, pp. 1263–1267.
- Ziegler, J. C., Bertrand, D., Tóth, D., Csépe, V., Reis, A., Faísca, L., … Blomert, L. (2010). Orthographic depth and its impact on universal predictors of reading: A cross-language investigation. Psychological Science : A Journal of the American Psychological Society/APS, 21(4), 551–559. doi:10.1177/0956797610363406
- Ziegler, J. C., Pech-Georgel, C., George, F., & Lorenzi, C. (2009). Speech-perception-in-noise deficits in dyslexia. Developmental Science, 12, 732–745. doi:10.1111/j.1467-7687.2009.00817.x