
ABSTRACT
Purpose
We aim to identify the most accurate model for predicting adolescent (Grade 9) reading difficulties (RD) in reading fluency and reading comprehension using 17 kindergarten-age variables. Three models (neural networks, linear, and mixture) were compared based on their accuracy in predicting RD. We also examined whether the same or a different set of kindergarten-age factors emerge as the strongest predictors of reading fluency and comprehension difficulties across the models.
Method
RD were identified in a Finnish sample (N ≈ 2,000) based on Grade 9 difficulties in reading fluency and reading comprehension. The predictors assessed in kindergarten included gender, parental factors (e.g., parental RD, education level), cognitive skills (e.g., phonological awareness, RAN), home literacy environment, and task-avoidant behavior.
Results
The results suggested that the neural networks model is the most accurate method, as compared to the linear and mixture models or their combination, for the early prediction of adolescent reading fluency and reading comprehension difficulties. The three models elicited rather similar results regarding the predictors, highlighting the importance of RAN, letter knowledge, vocabulary, reading words, number counting, gender, and maternal education.
Conclusion
The results suggest that neural networks have strong promise in the field of reading research for the early identification of RD.
Predicting reading difficulties (RD) accurately and early facilitates timely support. The absence of effective prediction mechanisms can result in delayed RD identification, putting children at increased risk of lower academic achievement and of developing low self-concept, anxiety, and even depression (e.g., Aro et al., Citation2019; McArthur et al., Citation2021; Sanfilippo et al., Citation2020). Despite advances in the early identification and prediction of RD, many children who would benefit from early enrichment and support remain unidentified and without timely access to preventive environments. One key reason why early identification has proved to be challenging is that there is no single deficit at the core of RD, but rather a combination of various deficits that can vary from child to child (e.g., Pennington, Citation2006; Van Bergen et al., Citation2014). In response to this, hybrid models have been suggested as a promising approach (e.g., Erbeli et al., Citation2018; Schatschneider et al., Citation2016; Spencer et al., Citation2014). Hybrid m odel thinking entails that accurate identification of RD requires a complex multivariate assessment in which predictions are improved by using multiple predictor measures. Thus, statistical approaches that can handle a large number of predictors with differential impacts on different individuals are necessary.
Predictors of RD
In this study, we focused on the prediction of RD in decoding and in reading comprehension (RC) in adolescence, which remains an understudied age group (Eklund et al., Citation2018; Manu et al., Citation2021; Ricketts et al., Citation2020). Since we focused on adolescent reading skills and our sample concerns a language with a highly transparent orthography (Finnish), our focal decoding measure is reading fluency (RF) and not accuracy, which by this age and in this context does not present variation that would have discriminative value (Aro, Citation2017).
Early cognitive skills are powerful predictors of later RD (e.g., Caravolas et al., Citation2019; Clayton et al., Citation2020; Psyridou et al., Citation2021). The literature indicates partially different predictors of RF and RC. Of the cognitive predictors of RD in RF, we focused on phonological awareness, letter knowledge, RAN, and number counting, which emerge as key early predictors of RF both among Finnish-speaking children (Kairaluoma et al., Citation2013; Koponen et al., Citation2016; Psyridou et al., Citation2021;), and in other language contexts (e.g., Bernabini et al., Citation2021; Caravolas et al., Citation2019; Clayton et al., Citation2020; Melby-Lervåg et al., Citation2012; Snowling et al., Citation2019). Studies on the early predictors of RC have shown strong predictive effects of early vocabulary (e.g., Florit & Cain, Citation2011; Manu et al., Citation2021; Nation et al., Citation2010; Psyridou et al., Citation2018) and listening comprehension measures (e.g., Florit & Cain, Citation2011; Manu et al., Citation2021; Nation et al., Citation2010). Therefore, we included vocabulary and listening comprehension among the cognitive predictors of RD in this study.
Motivational factors also are important predictors of children’s learning (e.g., Schiefele et al., Citation2012). In the present study, motivation was represented by task-avoidant behavior which in prior studies has been shown to be more prevalent among children with poor reading skills and may further impede their reading progress (Georgiou et al., Citation2010; Hirvonen et al., Citation2010). Longitudinal research has indicated that higher task avoidance predicts slower reading development, even after controlling for motivational factors such as autoregressors or phonological processing and non-verbal IQ (Georgiou et al., Citation2010).
Home literacy environment, particularly shared parent-child book reading and instruction of literacy skills at home, has also been found to predict children’s language and literacy development (e.g., Khanolainen et al., Citation2020; Mol & Bus, Citation2011; Silinskas et al., Citation2020a). Some evidence suggests, however, that home literacy environment may simply reflect parental skills and the correlation between home environment and child skills may in fact be due to the correlation between the skills of parents and their children. Puglisi et al. (Citation2017) and Van Bergen et al. (Citation2017) reported that the correlation between measures of children’s literacy skills and home literacy environment largely lost its significance after controlling for parental literacy skills. In the light of this, research that examines the effects of home literacy environments should also include parental reading measures. Parental RD (or family risk for RD) have been identified as one of the best early predictors of children’s RD (Esmaeeli et al., Citation2019; Psyridou et al., Citation2021; Snowling & Melby-Lervåg, Citation2016; Van Bergen et al., Citation2015). In the present study, we included family risk for RD, at-home learning activities, as well as parental education level as predictors of children’s RD. Inclusion of parental education level is in line with studies documenting strong effects of parental education levels on children’s reading development (e.g., Hamilton et al., Citation2016). Finally, the child’s gender was included as a predictor as previous studies have suggested increased vulnerability for RD among boys (e.g., Manu et al., Citation2021; Psyridou et al., Citation2021; Quinn & Wagner, Citation2015).
Statistical models for the prediction of RD
There are multiple potential statistical models available for early identification of risk factors for RD. In the present study we focus on comparing two commonly used but differing approaches (linear regression and mixture model) and a newer neural network-based approach. The deep artificial neural networks, a category of deep learning and a subcategory of machine learning (Goodfellow et al., Citation2016; Urban & Gates, Citation2021) is a promising new methodology that has been used successfully in other fields, but still is used rarely in reading research. Deep neural networks are computational models inspired by the human brain and have impacted research on natural language processing (Graves et al., Citation2013) and gameplaying (Mnih et al., Citation2015; Silver et al., Citation2016), among others. They are composed of units that work in parallel and are arranged in interconnected layers: an input layer that includes the independent variables; one or more hidden layers that contain unobservable network units; and an output layer which includes the dependent variables (Hinton, Citation2007; LeCun et al., Citation2015). A deep neural network learns to perform a specific task (e.g., prediction, or classification) through training during which the model learns the strength of the connections between the units in the layers (Cichy & Kaiser, Citation2019; Urban & Gates, Citation2021). Once trained, the deep neural networks model can be used to perform the same task using new inputs (Cichy & Kaiser, Citation2019).
The neural networks models have the advantage of being able to handle a large number of variables that can correlate with each other and do not need to be linearly associated (Urban & Gates, Citation2021). Thus, in addition to the linear effects, the neural networks models can identify linear, nonlinear, or interactional effects (for example, several combinations of the independent variables building cumulative risk) or a combination of these. In contrast to neural networks, when using linear models, only linear effects can be identified and it is often difficult to include a broad set of predictors in a linear prediction model due to collinearity problems.
Mixture models, which along with the linear regression model, is widely used in reading research, can handle a large number of correlated variables and do not expect that the associations between variables are the same for all participants of the sample. Instead, mixture models (e.g., latent class analysis, latent transition analysis, latent profile analysis) allow for the identification of homogeneous groups from a heterogeneous sample. From the prediction perspective, the identification of subgroups among predictors (e.g., identification of differential risk factor profiles for RD) can reveal combinations of predictors that are meaningfully associated with the outcome; this may not be identifiable in models which assume the same estimates across all participants. Even though mixture models were not designed for optimizing prediction per se, they provide the possibility to identify groups of children for whom the probability of belonging to the RD group is very high (even 1.0).
The present study
The present study aims to identify the most accurate model for predicting adolescent (Grade 9) RF and RC difficulties using a large set of kindergarten-age variables. Three models (neural networks, linear, and mixture) were compared based on their accuracy to predict RD, and to determine whether the same or different set of kindergarten-age factors emerge as the strongest predictors of RF or RC difficulties in the three models. The neural networks model was selected because it is a new method which has been broadly used in other fields with very promising results. We sought to examine whether the neural networks model can provide as high, or higher, accuracy in the identification of RD than the more commonly used methods. The linear model and mixture model were selected as contrast models to the new neural networks model because they are commonly used, have a differential approach to prediction but both use maximum likelihood methods, and there is a robust evidence of their usefulness in reading research.
To the best of our knowledge, no previous studies have compared these three models in the field of reading research. Previous studies in other fields that have used neural networks for prediction (without comparing them with linear and/or mixture models) have demonstrated high accuracy (e.g., Alzheimer’s: Lu et al., Citation2018; ADHD: Kuang & He, Citation2014; autism: Heinsfeld et al., Citation2018; biomedicine: Mamoshina et al., Citation2016; Parkinson’s: Choi et al., Citation2017; psychiatry: Vieira et al., Citation2017). Given these results, we hypothesized that neural networks would provide high accuracy in predicting RD.
Method
Participants
The present study was part of the Finnish longitudinal First Steps Study that includes data from approximately 2,000 children from kindergarten to Grade 9 (Lerkkanen et al., Citation2006). Reading skills of the participants were assessed in Grades 1, 2, 3, 4, 6, 7, and 9. In the present study, we used data from children’s assessment taken in the fall and spring of kindergarten (i.e., age 6), and their RF and RC skills assessment taken in Grade 9. There were 1,880 children at the beginning of the follow-up but when they entered school, all their classmates were also invited to participate. Over the years the sample size varied and altogether 2,518 children participated in at least one assessment. Descriptive statistics for the sample used in this study can be found in (more information on the number of participants in each assessment and the descriptive statistics for the reading measures used in Grades 1–9 can be found in Psyridou et al., Citation2021). The sample was drawn from four municipalities – two in central, one in western, and one in eastern Finland – out of which one was mainly urban, one mainly rural, and two included both urban and semi-rural environments. In three of the municipalities, the participants comprised the entire age cohort of children, and in another municipality, the participating children comprised about half the age cohort. Out of the parents who were contacted, 78–89% agreed to participate in the study. Ethnically and culturally, the sample was very homogeneous and representative of the Finnish population, and parental education levels were very close to the national distribution of Finland (Statistics Finland, Citation2007). The university’s Ethical Committee approved the First Steps Study, and the study conforms to the Declaration of Helsinki. All participants provided informed written consent and children gave their assent prior to their inclusion in the study.
Table 1. Reading measures and kindergarten-age factors used in the study.
Table 2. Descriptive statistics for the kindergarten-age factors and the reading fluency and reading comprehension skills in Grade 9.
Measures
The children were assessed longitudinally, in kindergarten (fall 2006 and spring 2007) and in Grade 9 (RF: spring 2016; RC (PISA): fall 2015). The measures are described in detail in .
Statistical analysis
Kindergarten-age measures were used to predict RF and RC difficulties in Grade 9 using three models (neural networks, linear, and mixture). RF and RC were analyzed separately, and RF or RC difficulty was defined as scoring in the lowest 10% of the RF or RC distribution, respectively.
Neural networks model
For the neural networks model, the Multilayer Perceptron Network (MLP) was used to produce a predictive model to identify RF or RC difficulties based on the kindergarten-age measures. MLP was conducted using SPSS (version 26). We first examined whether the missing-completely-at-random (MCAR) assumption could be established for the data. Little’s MCAR test indicated that the data were not MCAR (Little, Citation1988). The effect sizes (Cohen’s d) for the comparison of the participants with and without data ranged from .01 to −.39. However, because it is important for MLP not to have missing values, an expectation-maximization algorithm in SPSS was used to impute missing data using only the kindergarten-age variables so that the Grade 9 reading variables remained unchanged and independent from the kindergarten-age variables.
The MLP was set to randomly choose approximately 70% of the data for the training model and 30% for the testing model. Furthermore, we allowed the model to choose the number of hidden layers and units automatically. The training sample was used for the estimation of the weights. Once the weights had been decided, the testing sample was utilized to estimate whether the weights generated with the training sample apply to another subset of people and whether the model can be generalized. To balance the imputed cases between the training and testing models, the selection of participants for both models is important. Therefore, we used 20 different seed values to select and allocate participants to the training and testing models, randomly, using the continuous RF and RC variables. Because MLP results vary from analysis to analysis, the MLP was run 20 times using the same seed and the predicted RF and RC scores from each analysis were saved (i.e., 20 seeds were run 20 times each, separately for RF and RC). Next, the mean of the 20 predicted RF/RC scores was calculated for each seed and the correlations between the mean of the predicted RF/RC and the observed RF/RC scores for the training and testing model were estimated for each seed. For the 20 seeds, the correlations between the mean of the 20 predicted RF/RC scores and the observed RF/RC scores in the training (70% of data) and testing (30% of data) models varied from .49 to .62 for the RF models (Appendix B) and from .48 to .58 for the RC models (Appendix C). The seed with the closest and highest correlation among the training and testing model was used for the prediction of RF/RC difficulties.
Next, using the best-identified seed, the MLP was run 20 times to predict the dichotomized RF and 20 times to predict the dichotomized RC variables with the kindergarten variables, and the predicted RF/RC scores from each analysis were saved. As the dependent variables are dichotomous, the predicted scores represent each participant’s probability of belonging to the lowest 10% of the RF or RC distributions.
The average of the 20 predicted scores was used to test the ability of the model to predict RF and RC difficulties using Receiver Operating Characteristic (ROC) curves (Fawcett, Citation2006). The ROC curve is plotted with the true-positive rate (i.e., sensitivity) against the false-positive rate (i.e., 1-specificity) where the true-positive rate is on the y-axis and false-positive rate is on the x-axis. ROC curves compare sensitivity versus 1-specificity across a range of values for the ability to predict a dichotomous outcome. Each point on the ROC curve represents a sensitivity/1-specificity pair corresponding to a particular cutoff. The ROC curve is a useful tool because the curves of different models can be directly compared, either in general or for different thresholds, and the area under the curve can be used as a summary of the model skill. The larger the area under the curve, the better the identification of those with and without difficulties.
In addition to the ROC curves, we attempted to identify the most important kindergarten-age factors in predicting RF and RC difficulties. We conducted an independent variable importance analysis (provided by the MLP), which computes each kindergarten-age factor’s importance in determining the neural network based on the combined training and testing samples. The analysis was conducted 20 times, and the mean of the normalized importance for each kindergarten-age factor was calculated based on the results from the 20 analyses.
Linear model
For the linear model, a logistic regression analysis with backward deletion (BReg) was used to identify the kindergarten factors that predict RF or RC difficulties in Grade 9. BReg was conducted in Mplus (version 8.7). Logistic regression is useful when we aim to predict the presence or absence of a characteristic based on a set of predictors. It is similar to linear regression but is more suitable when the dependent variable is dichotomous (in this case, RD vs. no RD). Even though stepwise regression (either forward or backward) has received criticism, it was selected because it allows us to prune a list of plausible explanatory variables down to a parsimonious group of the “most important” variables. In addition, this criticism is mitigated by having a separate training and testing sample. We used the backward selection because starting with the full model has the advantage of considering the effects of all variables simultaneously. This is especially important in cases of collinearity because backward selection may be forced to keep all the variables in the model unlike forward selection where none of them may be entered. Full information maximum likelihood was used as an estimator, and robust standard errors were calculated (MLR estimator in Mplus). The MLR allows the calculation of more unbiased standard errors. BReg analysis was done in a stepwise manner. All kindergarten-age factors were added to the model, then the factor with the highest p-value was removed (one factor at a time) until all remaining factors were statistically significant. By using the full sample (N = 1,880) without the testing sample as defined by the MLP (N = 1,535 for RF, N = 1,576 for RC), we identified the best minimal group of factors that predicted RF or RC difficulties. Predictive values for each individual were saved and used for the ROC curves and comparison of the models. ROC curves were produced using the same testing sample as in the MLP (N = 345 for RF; N = 304 for RC) to examine the model’s ability to predict RF or RC difficulties.
Mixture model
For the mixture model, a latent profile analysis (LPA) was used to identify homogeneous profiles for the kindergarten-age measures based on the whole data set (N = 1,880). LPA was conducted in Mplus (version 8.7). To ensure each profile’s validity, we used 500 starting values, as a large set of random starting values is recommended (Asparouhov & Muthen, Citation2008). In the best-fitting LPA model, the individuals are assigned to a specific profile based on the highest posterior probabilities. This information was saved to an Mplus file and used further in SPSS to compare the results with the other two models. Given that for the LPA we were unable to produce ROC curves, a cross-tabulation between the LPA profile grouping and the dichotomized RF and RC variables was used.
Model comparison
Finally, using the same 30% of the data used for the testing round in MLP and estimating the linear model, the three models’ results were compared using a logistic regression to examine which method can produce the specific information that the others cannot achieve. The maximum likelihood function in logistic regression gives a chi-square test which tests the fit of the model. The dichotomized RF or RC variable was used as the dependent variable and was predicted using the predicted MLP scores (i.e., the predicted probability of the individual belonging to the lowest 10% of the RF or RC distribution based on the MLP analysis), the predictive BReg scores (i.e., the predicted probability of the individual belonging to the lowest 10% of the RF or RC distribution based on the BReg analysis), and the saved latent class information from the LPA (i.e., to which profile each individual belonged). The prediction scores and latent class information of the three models were used as independent variables. One method’s predictive scores were added in the first block, and the predictive scores from the other method were added in the second block. The chi-square test indicates whether the predictor in the second block is more informative for predicting the dichotomous RF or RC variable than the predictor in the first block. For the most informative method, we also examined whether it was more informative than the other two methods combined.
Computational codes for all the analyses can be found in Supplemental Materials.
Results
Descriptive statistics
The descriptive statistics of the kindergarten-age factors and the RF and RC measures in Grade 9 are presented in . The correlations between all assessed measures are displayed in Appendix A. Both RF (mean score) and RC significantly correlated with all kindergarten-age factors, except for teaching letters at home.
Neural networks model
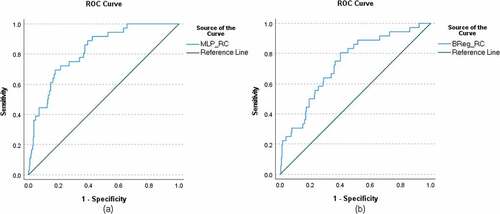
For the best identified seed, the correlation between the predicted and observed RF scores was .58 for the training model and .58 for the testing model, while the correlation between the predicted and observed RC scores was .55 for the training model and .55 for the testing model. Using the best identified seed, the MLP was run 20 times to predict the dichotomized RF and 20 times to predict the dichotomized RC variables with the kindergarten variables. The average of the 20 predicted scores for RF and RC represents the predicted probability that the individual belongs to the lowest 10% of the respective distribution. The average of the 20 predicted scores for RF and RC were used to produce the ROC curves for RF and RC ( for the testing models; Appendix Z for the training models) and then to compare the models. The ROC curves suggested that the MLP had high classification accuracy; the area under the curve was .79 (p < .001, 95% CI .699 – .880) for RF, and .83 (p < .001, 95% CI .764 – .890) for RC. Based on the ROC analysis, for RF when the sensitivity was .82 the 1-specificity was ranging from .40 to .47 and the precision was ranging from .13 to .15. For RC when the sensitivity was .82, the 1-specificity was .37 and the precision was .24. (See also, for the corresponding sensitivity, specificity, and precision estimates for different cutoff values and for specificity and precision values corresponding to specific sensitivity values).
Table 3. Corresponding sensitivity, specificity, and precision estimates for different cutoff values for reading fluency.
Table 4. Corresponding sensitivity, specificity, and precision estimates for different cutoff values for reading comprehension.
Table 5. Specificity and precision values corresponding to specific sensitivity values for reading fluency.
Table 6. Specificity and precision values corresponding to specific sensitivity values for reading comprehension.
Figure 1. ROC curves for reading fluency using MLP (figure a) and BReg (figure b) for the testing models.
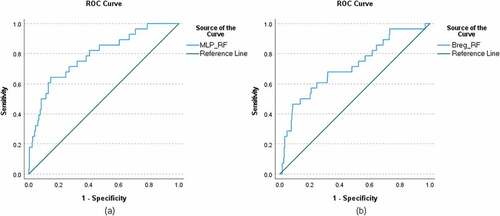
Figure 2. ROC curves for reading comprehension using MLP (figure a) and BReg (figure b) for the testing models.
Finally, the independent variable importance analysis indicated that the most important factors for predicting RF difficulties were RAN, letter knowledge (spring), and gender (). For the prediction of RC difficulties, vocabulary, RAN, and letter knowledge (spring) emerged as the most important factors ().
Figure 3. Mean of normalized importance for the kindergarten-age factors for the prediction of reading fluency difficulties.
Figure 4. Mean of normalized importance for the kindergarten-age factors for the prediction of reading comprehension difficulties.
Linear model
The estimates and p-values for each BReg step are presented in Appendix D for RF and Appendix E for RC. In the final RF model (), four significant predictors remained: gender, letter knowledge (spring), number counting (spring), and RAN. The model explained 32% of the variance in Grade 9 RF. In the final RC model (), five significant predictors remained: maternal education level, gender, reading words (spring), RAN, and vocabulary. The model explained 39% of the variance in Grade 9 RC.
Table 7. Estimates and the p-values of the final multiple regression model with backward deletion for the prediction of reading fluency difficulties.
Table 8. Estimates and the p-values of the final multiple regression model with backward deletion for the prediction of reading comprehension difficulties.
Using the regression equation with estimated coefficients for the significant predictors of RF and RC, we calculated predictive values for each individual, representing the predicted probability that the individual belongs to the lowest 10% of the respective distribution. These predictive values first were used for the ROC curves, and then for comparing the models. Similar to the MLP, ROC curves were produced using 30% of the data to examine the model’s ability to predict RF or RC difficulties (). The ROC curves suggested good accuracy in identifying RF and RC difficulties; the area under the curve was .72 (p < .001, 95%CI .607 – .822) for RF and .75 (p < .001, 95%CI .664 – .828) for RC. Based on the ROC analysis, for RF when the sensitivity was .82 the 1-specificity was ranging from .62 to .64 and the precision was ranging from .10 to .11. For RC, when the sensitivity was .82 the 1-specificity was ranging from .41 to .46 and the precision was ranging from .20 to .22. (See also, for the corresponding sensitivity, specificity, and precision estimates for different cutoff values and for specificity and precision values corresponding to specific sensitivity values).
Mixture model
Nine latent profile solutions were tested and compared, each testing a different number of profiles (1 through 9; ). The model with eight profiles was considered the best-fitting model, as VLMR and LMR indicated that the models with more than eight profiles were not significantly better. The average latent class probabilities for belonging to a profile were very high, suggesting that the eight profiles were very distinct: .95 for Profile 1; .94 for Profile 2; .92 for Profile 3; .99 for Profile 4; .99 for Profile 5; .98 for Profile 6; .99 for Profile 7; and .99 for Profile 8.
Table 9. Fit Indices for latent profile analyses.
As and show, the eight identified profiles included two profiles with below-average scores in all kindergarten skills and six groups with average or above-average scores. Profile 1 had low scores in all cognitive skills (particularly in phonological awareness, letter knowledge, and number counting) and had family risk for RD. Profile 2 also had below-average scores in all kindergarten assessments, but not as low as in Profile 1, and did not have family risk for RD. Furthermore, Profile 5 had average cognitive skills, but below-average reading skills. Each individual’s profile membership was saved.
Table 10. Means and standard errors for each profile for the kindergarten and home environment measures.
Figure 5. Latent profiles of cognitive and home environment factors assessed in kindergarten.
Cross-tabulation and a chi-square test were conducted between the profile membership variable and the RF difficulty () and RC difficulty () variables using the testing data (the same 30% as in MLP). The proportions of RF difficulty differed between the latent profiles [χ2(7) = 23.51, p < .01]. Similarly, the proportions of RC difficulty differed between the latent profiles [χ2(7) = 36.53, p < .001]. The adjusted standardized residuals indicated that both RF difficulties (adj. residual 4.06) and RC difficulties (adj. residual 5.04) were more common in Profile 1 than they would have been by chance.
Table 11. Crosstable with the latent profiles and the reading fluency difficulties.
Table 12. Crosstable with the latent profiles and the reading comprehension difficulties.
Comparison of the three models
Next, we compared the three models’ ability to predict RF or RC difficulties. The prediction scores and latent class information from the three models were used as independent variables and the dichotomous RF/RC variables as dependent in the logistic regression model. The chi-square test was used to reveal which model provided a prediction of reading difficulty that had additional information in relation to other models when trying to predict RD. The comparisons were performed using the 30% of data used for the testing model in the MLP.
For RF, the chi-square test indicated that the MLP increased the prediction over BReg [χ2(1) = 21.46, p < .001], while the BReg did not increase the prediction over MLP [χ2(1) = .58, p = .45]. The MLP increased the prediction over LPA [χ2(1) = 17.70, p < .001], while the LPA did not increase the prediction over MLP [χ2(7) = 6.13, p = .52]. The LPA did not increase the prediction over the BReg [χ2(7) = 12.88, p = .08]. Also, the BReg did not increase the prediction over LPA [χ2(1) = 3.57, p = .06]. Furthermore, because the results indicated that the MLP was providing the most information, we examined whether the MLP could provide more information than the other two methods combined. The results indicated that the MLP increased the prediction over the LPA and the BReg combined [χ2(1) = 14.28, p < .001].
For RC, the chi-square test indicated that the MLP increased the prediction over BReg [χ2(1) = 22.21, p < .001], while the BReg did not increase the prediction over MLP [χ2(1) = .47, p = .49]. The MLP increased the prediction over LPA [χ2(1) = 23.47, p < .001], while the LPA did not increase the prediction over MLP [χ2(7) = 7.79, p = .35]. The LPA increased the prediction over the BReg [χ2(7) = 16.58, p < .05]. Also, the BReg increased the prediction over LPA [χ2(1) = 10.53, p < .01]. Finally, the MLP increased the prediction over the LPA and the BReg combined [χ2(1) = 14.05, p < .001].
In addition to the chi-square tests, the ROC curves for the BReg and MLP for RF () and RC () suggest that for both skills, MLP had greater power to predict RF and RC difficulties. For RF, the area under the curve for the MLP was .79, while for the BReg, it was .72. For RC, the area under the curve for the MLP was .83, while for the BReg, it was .75.
Discussion
The complexity of risk and protective factor patterns in RD challenge the early identification of at-risk children. It is critical that we find methods that can handle the complexity of multiple interacting predictors to ensure that children are provided with timely support. The present study aimed to compare three models – linear (BReg), mixture (LPA), and neural networks (MLP) – based on their accuracy in predicting adolescent RD with multiple kindergarten-age variables. Furthermore, we examined whether the three models identified the same or different set of kindergarten-age predictors of Grade 9 RF and RC difficulties. The linear model was used as a basis because of its regular use in reading research. The mixture model is another often utilized method which was included because, unlike the linear model, it can identify the patterns or profiles of individuals among multiple variables that may signal heightened risk for RD. Neural networks models, although widely used in other fields, have been rarely used in reading research so far. The results indicated that MLP was more informative in predicting RF and RC difficulties than the other two models, a finding in line with the notion that neural networks are a powerful tool for predictive modeling.
Accuracy in predicting RD
All the models significantly predicted Grade 9 RF and RC scores with the kindergarten-age variables. LPA identified a group that had considerably higher risk for RD and both BReg and MLP predicted significant amounts of variance in the Grade 9 RD. Utilizing the same data employed for the testing model in MLP (30% of the data), the area under the curve for the MLP was .79 for RF and .83 for RC, while for the BReg, it was .72 for RF and .75 for RC. A value between .70 and .80 is considered acceptable, while a value between .80 and .90 is considered excellent (Mandrekar, Citation2010). Even though the results from the MLP and BReg were both considered acceptable (for RC, the MLP produced excellent results), it seems that the MLP classification was somewhat more accurate. Comparing the MLP, LPA, and BReg showed that neither LPA nor BReg provided any additional information for predicting either RF or RC difficulties over the MLP. In contrast, the MLP provided additional information over the other two methods, both for RF and RC. In fact, the MLP was found to be even more informative in predicting RF and RC difficulties than the combination of information from the other two models. Although, to the best of our knowledge, there are no previous studies comparing the use of these models for the prediction of RD, the findings were in line with our initial hypotheses expecting MLP to show high accuracy based on previous studies’ findings in other fields that have used neural networks for prediction (e.g., Alzheimer’s: Lu et al., Citation2018; ADHD: Kuang & He, Citation2014; autism: Heinsfeld et al., Citation2018; biomedicine: Mamoshina et al., Citation2016; Parkinson’s: Choi et al., Citation2017; psychiatry: Vieira et al., Citation2017).
Linear models generally have been the dominant statistical models because their functions can be solved quickly, usually in one step, and their solutions are unique and represent a global optimum (i.e., the best possible solution among all solutions). Furthermore, the model fit works with relatively small samples, and the testing can be well-understood (Durstewitz et al., Citation2019). Compared with linear models, neural networks are more time-consuming and complicated, and it is often even impossible to identify the global optimum (Goodfellow et al., Citation2016). They also require large amounts of data for the training of the parameters (Durstewitz et al., Citation2019) and are more difficult to interpret (Urban & Gates, Citation2021). However, regardless of these difficulties, they can identify complex patterns in data and make very accurate predictions compared with linear models (Durstewitz et al., Citation2019). Furthermore, neural networks continue to work when the number of variables is larger than the sample size and in cases in which many weak factors correlated with each other influence the phenomenon (Urban & Gates, Citation2021). Another great benefit of the neural networks model is that the trained neural networks model can be generalized and used to perform the same task with new inputs (Cichy & Kaiser, Citation2019). In RD prediction models, as in ours, there are typically many kindergarten-age predictors which are correlated with each other. These correlations cause collinearity problems in the linear models but not in the MLP model. This may have contributed to the better performance of the MLP over the BReg. Another possible reason of why the MLP performed better than the BReg in the identification of RD is that the MLP can identify linear, non-linear, and interactional effects (for example, several combinations of the independent variables building cumulative risk) or a combination of these which the BReg cannot identify.
Important kindergarten factors for predicting adolescent RD
Among the three models, some consensus was reached on which factors are the most important for predicting adolescent RF or RC difficulties. Unfortunately, while the MLP model provides information on which are the most important factors for identifying RD, it does not provide information on whether the effects of these factors are statistically significant. Overall, three factors emerged as the most important for predicting RF difficulties from the MLP: RAN, gender, and letter knowledge (spring). The same three factors, with the addition of number counting (spring), emerged as the most significant from the BReg. For RC, RAN, letter knowledge (spring), and vocabulary emerged as the most important factors from the MLP. From the BReg, RAN, gender, vocabulary, reading words (spring), and maternal education level were the most significant. The LPA indicated that both RF and RC difficulties were more common in Profile 1 than in the other profiles. In Profile 1, children had low scores in all kindergarten cognitive skills, and they also had family risk for RD. For the LPA, the comparison with the profiles found that those belonging to Profile 1 were male, had family risk for RD and had significantly lower scores in all cognitive skills than those belonging to the other profiles.
Both the MLP and BReg suggested that RAN was an important factor in predicting RF and RC difficulties. This is in line with previous studies that have reported RAN’s significance as a predictor of RF (Georgiou et al., Citation2016; Landerl et al., Citation2019), particularly in more transparent orthographies such as Finnish (Eklund et al., Citation2018; Kairaluoma et al., Citation2013). Considering the association between word reading fluency skills and RC (see also, Florit & Cain, Citation2011), and that RAN is among the best predictors of reading fluency (e.g., Eklund et al., Citation2018; Georgiou et al., Citation2016; Landerl et al., Citation2019), it is not surprising that RAN also emerged as an important predictor of RC. Even though decoding’s predictive power drops over time (e.g., Florit & Cain, Citation2011), previous studies have reported that RF remains a significant factor in predicting adolescent RC (García & Cain, Citation2014; Manu et al., Citation2021; Stanley et al., Citation2018; Torppa et al., Citation2018). Thus, it is likely that RAN’s effect on RC found in this study is mediated via RF (e.g., Eklund et al., Citation2018). In addition to RAN, letter knowledge emerged as an important factor in predicting RF difficulties by both the MLP and BReg, which is in accordance with several previous studies (e.g., Clayton et al., Citation2020; Manu et al., Citation2021).
Interestingly, BReg and LPA suggested that number counting may also be an important factor in predicting RF difficulties, which is noteworthy considering that number-counting skills usually are not included in predicting RF difficulties. However, studies that have included number counting in the prediction of RF skills have suggested that it could be a significant additional predictor (Bernabini et al., Citation2021; Koponen et al., Citation2016). Finally, vocabulary was found to be an important factor in predicting RC difficulties by both the MLP and BReg. This is also in accordance with previous studies suggesting that RC is heavily reliant on oral language comprehension skills, such as vocabulary (e.g., Petscher et al., Citation2018; Psyridou et al., Citation2018). Weaknesses in oral language comprehension can manifest years before a child learns to read, suggesting a possible causal link from oral language skills to later RC difficulties (e.g., Eklund et al., Citation2018; Petscher et al., Citation2018; Psyridou et al., Citation2018).
Unlike previous studies, task-avoidant behavior (Georgiou et al., Citation2010; Hirvonen et al., Citation2010), shared parent-child book reading, and the teaching literacy skills at home (e.g., Khanolainen et al., Citation2020; Mol & Bus, Citation2011; Silinskas et al., Citation2020a) were not identified as important factors. Similarly, unlike previous studies (e.g., Snowling & Melby-Lervåg, Citation2016; Torppa et al., Citation2011), neither the MLP nor BReg found family risk to be a significant predictor of RF difficulties in our data. One possible reason, at least for family risk, may be that it was related to poor cognitive skills and the inclusion of cognitive skills in the predictive models hide its effect on RD. As the LPA indicates, those belonging to Profile 1 and had the lowest scores in cognitive skills in kindergarten also had family risk for RD. Another possible reason could be the measure used to assess family risk in this study: a child was considered as having family risk if either the mother or father reported some or clear RD. This assessment method is not as sensitive as a more formal assessment, considering that in another Finnish sample, parental RD has been found to predict RF over and above children’s cognitive skills (Torppa et al., Citation2011). Family risk may have emerged as a predictor among those in Profile 1 from the LPA because the LPA focuses only on similarities and differences in respect to the kindergarten-age factors and does not include reading skills. Finally, both the MLP and BReg identified gender as an important factor for RF and RC. Many previous studies have reported that females outperform males in reading and that more males are identified with RD than females (e.g., Psyridou et al., Citation2021; Quinn & Wagner, Citation2015).
This study has certain limitations that need to be addressed. First, we only used one measure to assess RC. A more extensive assessment could have yielded a more reliable assessment of RC and, subsequently, better predictions. Second, the assessment of listening comprehension was not optimal and the reliability estimate was quite low. Such low reliability could be one reason why listening comprehension did not emerge as an important factor for predicting RC difficulties. Thus, the results regarding the strongest predictors of RC should be interpreted with caution, as it is likely that they are underestimating listening comprehension’s predictive value. Third, our sample had missing values. We balanced the imputed cases between the training and testing models by running the analysis multiple times, but not having missing values would have been optimal. The handling of missing cases did not follow the same approach across the three models. For the neural networks, we used single imputation (an expectation-maximization algorithm in SPSS) while for the linear model and the mixture model we used data without imputing the missing values. Imputation was conducted for the neural networks model because the MLP could not be performed with missing values. The linear and the mixture models on the other hand do not have such kind of limitation and can handle missingness, hence no need to use imputed data. For the linear and mixture models we used a full information maximum likelihood estimator (MLR estimator in Mplus). With this method we reach accurate standard errors while imputed data produces biases in standard errors. If we were to use imputed data for the linear and mixture models, we would have obtained equal parameter estimates to the MLR method used now but downward biased standard errors. This is because single imputation decreases the variability by adding the most plausible value to the data. Moreover, we think that it is important to use the way which is considered the best for handling missing data for each individual method as this is also the manner in which they are used in empirical papers that do not aim to compare methods against each other. Fourthly, the family risk variables were based on self-reports with a single question. This assessment may not have provided an accurate evaluation of parental reading skills and, thus, underestimating the predictive power of parental reading skills. In addition, RF or RC difficulty was defined as scoring in the lowest 10% of the RF or RC distribution, respectively. The selection of the cutoff matters as they are always somewhat arbitrary, and the outcomes of the studies might also be affected by the chosen cutoff (Psyridou et al., Citation2020). However, although the use of cutoffs is likely to lead to uncertainties in research findings because of measurement error (Branum-Martin et al., Citation2013; Francis et al., Citation2005; Psyridou et al., Citation2020), it is also a practical tool for the identification of children with RD. Internationally, different research groups use different cutoffs such as the lowest 10%, lowest 25%, 1SD below the mean, 1.5SD below the mean (e.g., Catts et al., 2012: 1SD, Esmaeeli et al., Citation2019: lowest 20%; Etmanskie et al., Citation2016: 25th percentile, Snowling et al., Citation2021, p. 10th percentile). The large sample of the present study allowed the selection of a rather strict cutoff for the identification of RD. Finally, in this study we compared three models on their accuracy in predicting RD and we identified that the MLP was more accurate than both the LPA and BReg models. Future research should examine how other models (e.g., random forest, LASSO regression) compare with neural networks models.
Conclusions
Overall, the results of this study suggest that the neural networks model (MLP) was the most accurate method compared with the linear (BReg) and mixture (LPA) models for the early prediction of adolescent RF and RC difficulties. MLP was found to be superior even when compared with the combination of LPA and BReg. Thus, the results indicate that the use of deep neural networks for early RD identification purposes in the case of data with multiple interacting predictors looks promising. Possible reasons for the better performance of the neural networks could be that the neural networks models do not run into collinearity problems compared to the linear models. This allows the inclusion of a much broader set of predictors. In addition, the neural networks models can identify non-linear effects which the linear models cannot identify. This could also lead to the identification of more complex patterns in the data and as such better performance of the model. For example, the neural network approach could handle many more variables than the ones we have used here, e.g., more information about home, preschool, early school, or non-cognitive psychological factors, which holds a promise for even better prediction of RD. After careful development of a trained model, this method maybe could be used ultimately in schools to aid in early identification of children at risk of developing RD.
With respect to the further use of neural networks for predicting RD, some practical and ethical considerations must be made. First, when training models with many parameters on small sample sizes, it can be difficult to identify a solution that can be generalized to the larger population (Whelan & Garavan, Citation2014). Training the model in different data sets may be necessary to make it more generalizable (Durstewitz et al., Citation2019). As Appendices B and C show, the correlation between the training and testing models for RF and RC changes depending on the part of the data used. Second, machine learning entails using a trained model to make predictions for new inputs; thus, training the model is critical because later predictions will be only as good as the data used for training. Biased data, intentionally or unintentionally, can lead to biased results (Ouchchy et al., Citation2020; Stahl, Citation2021). As researchers, we must be aware of the models and data used for training. Third, while this type of modeling opens the door to predicting RD early, indicating potential for early support, this early prediction also increases the risk of students encountering discrimination, labeling, and being left behind due to an algorithms result. Although neural networks seemed to provide a more accurate prediction, it was still far from being 100% accurate; therefore, false positive and false negative classifications still occurred. However, accuracy could be improved by adding more data. In this study, we predicted RF and RC difficulties at one time point (Grade 9) using kindergarten-age factors. Assessing reading skills at more than one time point, particularly during the early phases of reading development, likely would improve the accuracy in predicting adolescent RD. Furthermore, the inclusion of a broader and more reliable battery of measures might help improve predictions of RD. However, even if prediction accuracy were to rise sharply, in practice, the neural networks model should serve merely as one tool among many when early screening and support decisions are made concerning individuals. We also must remember that early identification is useful and ethically fully justified only if it is followed by adequate support.
In conclusion, neural networks seem to be a valid method for identifying those at risk for RD early. MLP was more accurate than both the LPA and BReg models. In the past, linear and mixture models have been used most often for this purpose, but machine learning models, such as the neural networks model described in this study, seem to be more powerful, exceeding both the linear and mixture models as well as their combination.
Supplemental Material
Download Zip (120.9 KB)Disclosure statement
No potential conflict of interest was reported by the author(s).
Supplementary material
Supplemental data for this article can be accessed online at https://doi.org/10.1080/10888438.2022.2095281
Additional information
Funding
References
- Aro, M. (2017). Learning to read finnish. In L. T. W. Verhoeven & C. A. Perfetti (Eds.), Reading acquisition across languages and writing systems: An international handbook (1st ed., pp. 416–436). Cambridge University Press.
- Aro, T., Eklund, K., Eloranta, A.-K., Närhi, V., Korhonen, E., & Ahonen, T. (2019). Associations between childhood learning disabilities and adult-age mental health problems, lack of education, and unemployment. Journal of Learning Disabilities, 52(1), 71–83. https://doi.org/10.1177/0022219418775118
- Asparouhov, T., & Muthen, B. (2008). Multilevel mixture models. In G. R. Hancock & K. M. Samuelsen (Eds.), Advances in latent variable mixture models (pp. 27–51). Information Age Publishing.
- Bernabini, L., Bonifacci, P., & de Jong, P. F. (2021). The relationship of reading abilities with the underlying cognitive skills of math: A dimensional approach. Frontiers in Psychology, 12, 577488. https://doi.org/10.3389/fpsyg.2021.577488
- Branum-Martin, L., Fletcher, J. M., & Stuebing, K. K. (2013). Classification and identification of reading and math disabilities: The special case of comorbidity. Journal of Learning Disabilities, 46(6), 490–499. https://doi.org/10.1177/0022219412468767
- Caravolas, M., Lervåg, A., Mikulajová, M., Defior, S., Seidlová-Málková, G., & Hulme, C. (2019). A cross-linguistic, longitudinal study of the foundations of decoding and reading comprehension ability. Scientific Studies of Reading, 23(5), 386–402. https://doi.org/10.1080/10888438.2019.1580284
- Choi, H., Ha, S., Im, H. J., Paek, S. H., & Lee, D. S. (2017). Refining diagnosis of Parkinson’s disease with deep learning-based interpretation of dopamine transporter imaging. NeuroImage: Clinical, 16, 586–594. https://doi.org/10.1016/j.nicl.2017.09.010
- Cichy, R. M., & Kaiser, D. (2019). Deep neural networks as scientific models. Trends in Cognitive Sciences, 23(4), 305–317. https://doi.org/10.1016/j.tics.2019.01.009
- Clayton, F. J., West, G., Sears, C., Hulme, C., & Lervåg, A. (2020). A longitudinal study of early reading development: Letter-sound knowledge, phoneme awareness and RAN, but not letter-sound integration, predict variations in reading development. Scientific Studies of Reading, 24(2), 91–107. https://doi.org/10.1080/10888438.2019.1622546
- Denckla, M. B., & Rudel, R. G. (1976). Rapid “automatized” naming (R.A.N): Dyslexia differentiated from other learning disabilities. Neuropsychologia, 14(4), 471–479. https://doi.org/10.1016/0028-3932(76)90075-0
- Dunn, L. M., & Dunn, L. M. (1981). Peabody picture vocabulary test—Revised. American Guidance Service.
- Durstewitz, D., Koppe, G., & Meyer-Lindenberg, A. (2019). Deep neural networks in psychiatry. Molecular Psychiatry, 24(11), 1583–1598. https://doi.org/10.1038/s41380-019-0365-9
- Eklund, K., Torppa, M., Sulkunen, S., Niemi, P., & Ahonen, T. (2018). Early cognitive predictors of PISA reading in children with and without family risk for dyslexia. Learning and Individual Differences, 64, 94–103. https://doi.org/10.1016/j.lindif.2018.04.012
- Erbeli, F., Hart, S. A., Wagner, R. K., & Taylor, J. (2018). Examining the etiology of reading disability as conceptualized by the hybrid model. Scientific Studies of Reading, 22(2), 167–180. https://doi.org/10.1080/10888438.2017.1407321
- Esmaeeli, Z., Kyle, F. E., & Lundetræ, K. (2019). Contribution of family risk, emergent literacy and environmental protective factors in children’s reading difficulties at the end of second-grade. Reading and Writing, 32(9), 2375–2399. https://doi.org/10.1007/s11145-019-09948-5
- Etmanskie, J. M., Partanen, M., & Siegel, L. S. (2016). A longitudinal examination of the persistence of late emerging reading disabilities. Journal of Learning Disabilities, 49(1), 21–35. https://doi.org/10.1177/0022219414522706
- Fawcett, T. (2006). An introduction to ROC analysis. Pattern Recognition Letters, 27(8), 861–874. https://doi.org/10.1016/j.patrec.2005.10.010
- Florit, E., & Cain, K. (2011). The simple view of reading: Is it valid for different types of alphabetic orthographies? Educational Psychology Review, 23(4), 553–576. https://doi.org/10.1007/s10648-011-9175-6
- Francis, D. J., Fletcher, J. M., Stuebing, K. K., Lyon, G. R., Shaywitz, B. A., & Shaywitz, S. E. (2005). Psychometric approaches to the identification of LD: IQ and achievement scores are not sufficient. Journal of Learning Disabilities, 38(2), 98–108. https://doi.org/10.1177/00222194050380020101
- García, J. R., & Cain, K. (2014). Decoding and reading comprehension: A meta-analysis to identify which reader and assessment characteristics influence the strength of the relationship in English. Review of Educational Research, 84(1), 74–111. https://doi.org/10.3102/0034654313499616
- Georgiou, G. K., Manolitsis, G., Nurmi, J. E., & Parrila, R. (2010). Does task-focused versus task-avoidance behavior matter for literacy development in an orthographically consistent language? Contemporary Educational Psychology, 35(1), 1–10. https://doi.org/10.1016/j.cedpsych.2009.07.001
- Georgiou, G. K., Parrila, R., & Papadopoulos, T. C. (2016). The anatomy of the RAN-reading relationship. Reading and Writing, 29(9), 1793–1815. https://doi.org/10.1007/s11145-016-9653-9
- Goodfellow, I., Bengio, Y., & Courville, A. (2016). Deep learning. MIT Press. http://www.deeplearningbook.org
- Graves, A., Mohamed, A. R., & Hinton, G. (2013, May). Speech recognition with deep recurrent neural networks. In 2013 IEEE International Conference on Acoustics, Speech and Signal Processing (p. 6645–6649). https://doi.org/10.1109/ICASSP.2013.6638947
- Hamilton, L. G., Hayiou-Thomas, M. E., Hulme, C., & Snowling, M. J. (2016). The home literacy environment as a predictor of the early literacy development of children at family-risk of dyslexia. Scientific Studies of Reading, 20(5), 401–419. https://doi.org/10.1080/10888438.2016.1213266
- Heinsfeld, A. S., Franco, A. R., Craddock, R. C., Buchweitz, A., & Meneguzzi, F. (2018). Identification of autism spectrum disorder using deep learning and the ABIDE dataset. NeuroImage: Clinical, 17, 16–23. https://doi.org/10.1016/j.nicl.2017.08.017
- Hinton, G. E. (2007). Learning multiple layers of representation. Trends in Cognitive Sciences, 11(10), 428–434. https://doi.org/10.1016/j.tics.2007.09.004
- Hirvonen, R., Georgiou, G. K., Lerkkanen, M. K., Aunola, K., & Nurmi, J. E. (2010). Task‐focused behaviour and literacy development: A reciprocal relationship. Journal of Research in Reading, 33(3), 302–319. https://doi.org/10.1111/j.1467-9817.2009.01415.x
- Kairaluoma, L., Torppa, M., Westerholm, J., Ahonen, T., & Aro, M. (2013). The nature and factors related to reading difficulties among adolescents in a transparent orthography. Scientific Studies of Reading, 5(5), 315–332. https://doi.org/10.1080/10888438.2012.701257
- Khanolainen, D., Psyridou, M., Silinskas, G., Lerkkanen, M. K., Niemi, P., Poikkeus, A. M., & Torppa, M. (2020). Longitudinal effects of the home learning environment and parental difficulties on reading and math development across grades 1–9. Frontiers in Psychology, 11, 2735. https://doi.org/10.3389/fpsyg.2020.577981
- Koponen, T., Aunola, K., Ahonen, T., & Nurmi, J. E. (2007). Cognitive predictors of single-digit and procedural calculation skills and their covariation with reading skill. Journal of Experimental Child Psychology, 97(3), 220–241. https://doi.org/10.1016/j.jecp.2007.03.001
- Koponen, T., Salmi, P., & Nurmi, J.-E. (2016). Counting and rapid naming predict the fluency of arithmetic and reading skills. Contemporary Educational Psychology, 44, 83–94. https://doi.org/10.1016/j.cedpsych.2016.02.004
- Kuang, D., & He, L. (2014, November). Classification on ADHD with deep learning. In 2014 International Conference On Cloud Computing And Big Data (pp. 27–32). IEEE.
- Landerl, K., Freudenthaler, H. H., & Georgiou, G. K. (2019). Phonological awareness and rapid automatized naming as longitudinal predictors of reading in five alphabetic orthographies with varying degrees of consistency. Scientific Studies of Reading, 23(3), 220–234. https://doi.org/10.1080/10888438.2018.1510936
- LeCun, Y., Bengio, Y., & Hinton, G. (2015). Deep learning. Nature, 521(7553), 436–444. https://doi.org/10.1038/nature14539
- Lerkkanen, M.-K., Poikkeus, A.-M., & Ketonen, R. (2006). ARMI—Lukuja kirjoitustaidon arviointimateriaali 1: Luokalle. WSOY.
- Lerkkanen, M.-K., Eklund, K., Löytynoja, H., Aro, M., & Poikkeus, A. M. (2018). YKÄ Lukuja kirjoitustaidon arviointimenetelmä yläkouluun.[YKÄ—Reading test for lower secondary school]. Niilo Mäki Instituutti.
- Lindeman, J. (2000). ALLU—Ala-asteen lukutesti [ALLU reading test for primary school]. University of Turku, Centre for Research on Learning.
- Little, R. J. A. (1988). A test of missing completely at random for multivariate data with missing values. Journal of the American Statistical Association, 83(404), 1198–1202. https://doi.org/10.1080/01621459.1988.10478722
- Lu, D., Popuri, K., Ding, G. W., Balachandar, R., & Beg, M. F. (2018). Multimodal and multiscale deep neural networks for the early diagnosis of Alzheimer’s disease using structural MR and FDG-PET images. Scientific Reports, 8(1), 1–13. https://doi.org/10.1038/s41598-018-22871-z
- Mamoshina, P., Vieira, A., Putin, E., & Zhavoronkov, A. (2016). Applications of deep learning in biomedicine. Molecular Pharmaceutics, 13(5), 1445–1454. https://doi.org/10.1021/acs.molpharmaceut.5b00982
- Mandrekar, J. N. (2010). Receiver operating characteristic curve in diagnostic test assessment. Journal of Thoracic Oncology, 5(9), 1315–1316. https://doi.org/10.1097/JTO.0b013e3181ec173d
- Manu, M., Torppa, M., Eklund, K., Poikkeus, A. M., Lerkkanen, M. K., & Niemi, P. (2021). Kindergarten pre-reading skills predict grade 9 reading comprehension (PISA reading) but fail to explain gender difference. Reading and Writing, 34(3), 753–771. https://doi.org/10.1007/s11145-020-10090-w
- McArthur, G., Badcock, N., Castles, A., & Robidoux, S. (2021). Tracking the relations between children’s reading and emotional health across time: Evidence from four large longitudinal studies. Reading Research Quarterly, 57(2), 555-585. https://doi.org/10.1002/rrq.426
- Melby-Lervåg, M., Lyster, S. A. H., & Hulme, C. (2012). Phonological skills and their role in learning to read: A meta analytic review. Psychological Bulletin, 138(2), 322–352. https://doi.org/10.1037/a0026744
- Mnih, V., Kavukcuoglu, K., Silver, D., Rusu, A. A., Veness, J., Bellemare, M. G., … Hassabis, D. (2015). Human-level control through deep reinforcement learning. Nature, 518(7540), 529–533. https://doi.org/10.1038/nature14236
- Mol, S. E., & Bus, A. G. (2011). To read or not to read: A meta-analysis of print exposure from infancy to early adulthood. Psychological Bulletin, 137(2), 267–296. https://doi.org/10.1037/a0021890
- Nation, K., Cocksey, J., Taylor, J. S., & Bishop, D. V. (2010). A longitudinal investigation of early reading and language skills in children with poor reading comprehension. Journal of Child Psychology and Psychiatry, 51(9), 1031–1039. https://doi.org/10.1111/j.1469-7610.2010.02254.x
- Nevala, J., & Lyytinen, H. (2000). Sanaketjutesti. Niilo Mäki Instituutti & Jyväskylän yliopiston lapsitutkimuskeskus. Differentiate word test
- OECD. (2010). PISA 2009 results: Learning trends: Changes in student performance since 2000. https://doi.org/10.1787/9789264091580-en
- Ouchchy, L., Coin, A., & Dubljević, V. (2020). AI in the headlines: The portrayal of the ethical issues of artificial intelligence in the media. AI & SOCIETY, 35(4), 927–936. https://doi.org/10.1007/s00146-020-00965-5
- Pennington, B. F. (2006). From single to multiple deficit models of developmental disorders. Cognition, 101(2), 385–413. https://doi.org/10.1016/j.cognition.2006.04.008
- Petscher, Y., Justice, L. M., & Hogan, T. (2018). Modeling the early language trajectory of language development when the measures change and its relation to poor reading comprehension. Child Development, 89(6), 2136–2156. https://doi.org/10.1111/cdev.12880
- Psyridou, M., Eklund, K., Poikkeus, A. M., & Torppa, M. (2018). Reading outcomes of children with delayed early vocabulary: A follow-up from age 2–16. Research in Developmental Disabilities, 78, 114–124. https://doi.org/10.1016/j.ridd.2018.05.004
- Psyridou, M., Tolvanen, A., Lerkkanen, M. K., Poikkeus, A. M., & Torppa, M. (2020). Longitudinal stability of reading difficulties: Examining the effects of measurement error, cut-offs, and buffer zones in identification. Frontiers in Psychology, 10, 2841. https://doi.org/10.3389/fpsyg.2019.02841
- Psyridou, M., Tolvanen, A., de Jong, P. F., Lerkkanen, M. K., Poikkeus, A. M., & Torppa, M. (2021). Developmental profiles of reading fluency and reading comprehension from grades 1 to 9 and their early identification. Developmental Psychology, 57(11), 1840. https://doi.org/10.1002/rrq.426
- Puglisi, M. L., Hulme, C., Hamilton, L. G., & Snowling, M. J. (2017). The home literacy environment is a correlate, but perhaps not a cause, of variations in children’s language and literacy development. Scientific Studies of Reading, 21(6), 498–511. https://doi.org/10.1080/10888438.2017.1346660
- Quinn, J. M., & Wagner, R. K. (2015). Gender differences in reading impairment and in the identification of impaired readers: Results from a large-scale study of at-risk readers. Journal of Learning Disabilities, 48(4), 433–445. https://doi.org/10.1177/0022219413508323
- Ricketts, J., Lervåg, A., Dawson, N., Taylor, L. A., & Hulme, C. (2020). Reading and oral vocabulary development in early adolescence. Scientific Studies of Reading, 24(5), 380–396. https://doi.org/10.1080/10888438.2019.1689244
- Sanfilippo, J., Ness, M., Petscher, Y., Rappaport, L., Zuckerman, B., & Gaab, N. (2020). Reintroducing dyslexia: Early identification and implications for pediatric practice. Pediatrics, 146(1) . https://doi.org/10.1542/peds.2019-3046
- Schatschneider, C., Wagner, R. K., Hart, S. A., & Tighe, E. L. (2016). Using simulations to investigate the longitudinal stability of alternative schemes for classifying and identifying children with reading disabilities. Scientific Studies of Reading, 20(1), 34–48. https://doi.org/10.1080/10888438.2015.1107072
- Schiefele, U., Schaffner, E., Möller, J., & Wigfield, A. (2012). Dimensions of reading motivation and their relation to reading behavior and competence. Reading Research Quarterly, 47(4), 427–463. https://doi.org/10.1002/RRQ.030
- Sénéchal, M., Lefevre, J. A., Thomas, E. M., & Daley, K. E. (1998). Differential effects of home literacy experiences on the development of oral and written language. Reading Research Quarterly, 33(1), 96–116. https://doi.org/10.1598/RRQ.33.1.5
- Silinskas, G., Sénéchal, M., Torppa, M., & Lerkkanen, M.-K. (2020a). Home literacy activities and children’s reading skills, independent reading, and interest in literacy activities from kindergarten to Grade 2. Frontiers in Psychology, 11. https://doi.org/10.3389/fpsyg.2020.01508
- Silinskas, G., Torppa, M., Lerkkanen, M. K., & Nurmi, J. E. (2020b). The home literacy model in a highly transparent orthography. School Effectiveness and School Improvement, 31(1), 80–101. https://doi.org/10.1080/09243453.2019.1642213
- Silver, D., Huang, A., Maddison, C. J., Guez, A., Sifre, L., Van Den Driessche, G., … Hassabis, D. (2016). Mastering the game of go with deep neural networks and tree search. Nature, 529(7587), 484–489. https://doi.org/10.1038/nature16961
- Snowling, M. J., & Melby-Lervåg, M. (2016). Oral language deficits in familial dyslexia: A meta-analysis and review. Psychological Bulletin, 142(5), 498–545. https://doi.org/10.1037/bul0000037
- Snowling, M. J., Nash, H. M., Gooch, D. C., Hayiou‐Thomas, M. E., & Hulme, C., & Wellcome Language and Reading Project Team. (2019). Developmental outcomes for children at high risk of dyslexia and children with developmental language disorder. Child Development, 90(5), e548–e564. https://doi.org/10.1111/cdev.13216
- Snowling, M. J., Moll, K., & Hulme, C. (2021). Language difficulties are a shared risk factor for both reading disorder and mathematics disorder. Journal of Experimental Child Psychology, 202, 105009. https://doi.org/10.1016/j.jecp.2020.105009
- Spencer, M., Wagner, R. K., Schatschneider, C., Quinn, J. M., Lopez, D., & Petscher, Y. (2014). Incorporating RTI in a hybrid model of reading disability. Learning Disability Quarterly, 37(3), 161–171. https://doi.org/10.1177/0731948714530967
- Stahl, B. C. (2021). Ethical Issues of AI. Artificial Intelligence for a Better Future, 35. https://doi.org/10.1007/978-3-030-69978-9_4
- Stanley, C. T., Petscher, Y., & Catts, H. (2018). A longitudinal investigation of direct and indirect links between reading skills in kindergarten and reading comprehension in tenth grade. Reading and Writing, 31(1), 133–153. https://doi.org/10.1007/s11145-017-9777-6
- Statistics Finland. (2007). Statistical databases. Retrieved March 1, 2019, from www.stat.fi/tup/tilastotietokannat/index_en.html
- Torppa, M., Eklund, K., van Bergen, E., & Lyytinen, H. (2011). Parental literacy predicts children’s literacy: A longitudinal family risk study. Dyslexia, 17(4), 339–355. https://doi.org/10.1002/dys.437
- Torppa, M., Eklund, K., Sulkunen, S., Niemi, P., & Ahonen, T. (2018). Why do boys and girls perform differently on PISA reading in Finland? The effects of reading fluency, achievement behaviour, leisure reading and homework activity. Journal of Research in Reading, 41(1), 122–139. https://doi.org/10.1111/1467-9817.12103
- Urban, C. J., & Gates, K. M. (2021, April 1). Deep learning: A primer for psychologists. Psychological Methods, 26(6), 743-773. https://dx.doi.org/10.1037/met0000374.
- van Bergen, E., van der Leij, A., & de Jong, P. F. (2014). The intergenerational multiple deficit model and the case of dyslexia. Frontiers in Human Neuroscience, 8, 346. https://doi.org/10.3389/fnhum.2014.00346
- van Bergen, E., Bishop, D., van Zuijen, T., & de Jong, P. F. (2015). How does parental reading influence children’s reading? A study of cognitive mediation. Scientific Studies of Reading, 19(5), 325–339. https://doi.org/10.1080/10888438.2015.1050103
- van Bergen, E., van Zuijen, T., Bishop, D., & de Jong, P. F. (2017). Why are home literacy environment and children’s reading skills associated? What parental skills reveal. Reading Research Quarterly, 52(2), 147–160. https://doi.org/10.1002/rrq.160
- Vauras, M., Mäki, H., Dufva, M., & Hämäläinen, S. (1995). Diagnostiset testit 2. Kuullun ja luetun ymmärtäminen. In Listening and reading comprehension]. Diagnostic tests 2. Oppimistutkimuksen keskus, Turun yliopisto.
- Vieira, S., Pinaya, W. H., & Mechelli, A. (2017). Using deep learning to investigate the neuroimaging correlates of psychiatric and neurological disorders: Methods and applications. Neuroscience and Biobehavioral Reviews, 74, 58–75. https://doi.org/10.1016/j.neubiorev.2017.01.002
- Whelan, R., & Garavan, H. (2014). When optimism hurts: Inflated predictions in psychiatric neuroimaging. Biological Psychiatry, 75(9), 746–748. https://doi.org/10.1016/j.biopsych.2013.05.014
- Zhang, X., Nurmi, J.-E., Kiuru, N., Lerkkanen, M.-K., & Aunola, K. (2011). A teacher-report measure of children’s task-avoidant behavior: A validation study of the behavioral strategy rating scale. Learning and Individual Differences, 21(6), 690–698. https://doi.org/10.1016/j.lindif.2011.09.007