
ABSTRACT
Profound changes in Arctic sea-ice, a growing desire to utilize the Arctic’s abundant natural resources, and the potential competitiveness of Arctic shipping routes, all provide for increased industry marine activity throughout the Arctic Ocean. This is anticipated to result in further challenges for maritime safety. Those operating in ice-infested waters require various types of information for sea-ice and iceberg hazards. Ice information requirements depend on regional needs and whether the stakeholder wants to avoid ice all together, operate near or in the Marginal Ice Zone, or areas within the ice pack. An insight into user needs demonstrates how multiple spatial and temporal resolutions for sea-ice information and forecasts are necessary to provide information to the marine operating community for safety, planning, and situational awareness. Although ship-operators depend on sea-ice information for tactical navigation, stakeholders working in route and capacity planning can benefit from climatological and long-range forecast information at lower spatial and temporal resolutions where the interest is focused on open-water season. The advent of the Polar Code has brought with it additional information requirements, and exposed gaps in capacity and knowledge. Thus, future satellite data sources should be at resolutions that support both tactical and planning activities.
Introduction: environmental and socio-economic changes in the Polar regions
The Polar regions are undergoing dramatic changes, with Arctic sea-ice winter maximum and summer minimum extents decreasing steadily since the 1980s, with the 12th lowest summer minima occurring within the last 12 years (Fetterer et al., Citation2017; Meier et al., Citation2018), and summer navigation seasons lengthening (Stroeve & Notz, Citation2018). Localized winter openings of the pack ice (Moore et al., Citation2018) anticipate similar future trends with increasing water temperatures (McFarland, Citation2018) and demonstrate how unstable and vulnerable the Arctic ice pack is becoming. As the ice cover becomes thinner and more dynamic, it is more susceptible to oceanic and atmospheric forcings. Pack ice fracturing is observed to be increasing during winter, contributing to further deformation and thermodynamic melt (Hwang et al., Citation2017; Itkin et al., Citation2017; Stroeve et al., Citation2014).
In the Antarctic, sea-ice was slightly expanding overall (Comiso et al., Citation2017; Parkinson & Cavalieri, Citation2012) with consecutive record highs for the annual maximum in 2012 through 2014. However, in 2016 the extent plunged to unprecedented low levels and has remained below average (Turner et al., Citation2017), apparently caused by a shift in regional modalities and resulted in the re-emergence of the Weddell Polynya (Carsey, Citation1980; Doddridge & Marshall, Citation2017; Swart et al., Citation2018). Nevertheless, there is still a substantial variation between the summer minimum and winter maximum extents in both hemispheres with large areas of seasonal ice cover. This is also found in a number of sub-polar seas including the Baltic and Caspian Seas, and the Great Lakes, often with regional lower salinity characteristics (Granskog et al., Citation2006; Kosarev, Citation2005). The Labrador Sea is unusual due to the preponderance of icebergs. Around the Antarctic, icebergs have been recorded at sub-polar latitudes in the South Atlantic and South Pacific sectors (Burrows, Citation1976; Morgan & Budd, Citation1978).
Sea-ice changes have affected socio-economic activity, driving new levels of activity involving established and new stakeholders. The use of trans-Arctic shipping routes and areas of interest for tourism is expected to increase with the longer open-water seasons (Melia et al., Citation2016; Smith & Stephenson, Citation2013). With the finalization of the International Maritime Organization (IMO) Polar Code (PC) (IMO, Citation2014) and construction of new ice class ships, increasing activity in all economic sectors is expected (Deggim, Citation2018; Jensen, Citation2016; OECD, Citation2018). Additionally, the PC now mandates that ‘ships shall have the ability to receive up-to-date information including ice information for safe navigation’ and requires a risk assessment methodology, POLARIS, to determine the limitations for ice operations (IMO, Citation2014). Ships will require more detailed sea-ice and weather information, encouraging numerous new ice information providers (Knol et al., Citation2018; Lamers, Duske, et al., Citation2018; Melia et al., Citation2016). However, navigating ice-covered areas requires both broad and precise knowledge of ice conditions depending on the region and type of activity.
In order to produce appropriate products for users, it is necessary to define suitable spatial and temporal scales. In meteorology, short-, medium-, and long-term temporal resolution can be considered a few days, a week or ten days, and from a month to seasonal, respectively. A spatial resolution of 10 km in numerical weather prediction (NWP) is usually categorized as a high resolution. Definition of low, medium, or high resolution in the satellite remote sensing community depends on the data provider or user. For example, satellites using passive microwave (PMW) images are considered low resolution for navigational purposes, but high resolution for NWP (Montmerle, Citation2018). Tactical navigation will require high spatial (meter-scale) and temporal (hourly or daily) resolution in near-real time (NRT), to enable the best decisions and avoiding hazardous conditions. Voyage planning, logistics, and infrastructure development requires longer time scales (monthly, seasonal, annual, and decadal) to prepare for future ice conditions. This group can also benefit from real-time, historical (climatological), and forward-looking (forecast) information.
Previous studies identified services providing information and forecasts to support ice navigation and planning (Hamilton & Stroeve, Citation2016; Knol et al., Citation2018; Lovecraft et al., Citation2013). However, the rate of growth of users and information providers is potentially exceeding the understanding that is needed from both groups to work together effectively. Information providers face challenges with the uptake and usability of their products when these are either hosted on platforms that are new and not well known; are potentially technically inaccessible for some users; information is not in a user-friendly format; it is not clear how to interpret the information, particularly its uncertainty; or possibly the products are not developed with the user in mind, and therefore may not be applicable (EU-PolarNet, Citation2018). We summarize sea-ice information and potential forecast needs and challenges for Polar Regions stakeholders, including the operational, geopolitical and local requirements, and the need for varying levels of spatial (meters to kilometers) and temporal (hourly to annual) resolutions.
Increasing activity in ice-covered regions
State-of-the-art climate models forecast declining sea-ice cover in response to a warming climate caused by increases in greenhouse gases (Hamilton & Stroeve, Citation2016; Massonnet et al., Citation2012; Stroeve et al., Citation2012). Navigation will likely become easier as the sea-ice cover shrinks and thinning continues (Melia et al., Citation2016; Smith & Stephenson, Citation2013; Smith et al., Citation2011). The thinning and loss of perennial ice continues, and could introduce areas of instability where consolidated ice was previously expected (Kwok, Citation2018). Ice retreat and advance begin earlier and end later, respectively, so that first-year ice (FYI) has less time to thicken throughout the winter is more susceptible to summer melting (Stroeve et al., Citation2014, Citation2018). This trend will allow seaways to have longer transit seasons in the future. It is unclear whether the recent decrease in the Antarctic ice-cover is permanent or part of Southern Hemisphere climatic cyclicity (Marshall et al., Citation2004; Turner et al., Citation2017).
The use of Arctic routes is presently a commercial risk for shipping companies as there is uncertainty regarding the ice risk, leading to potential damage for ships and delays (Humbert & Raspotnik, Citation2012), with certain types of vessel (i.e. container) often unwilling to risk delays to maintain a specific schedule, and greater insurance costs. The development of shipping routes remains tied directly to natural resources, and for the Northern Sea Route (NSR), the future economic security of the Russian Federation. There is an ongoing assessment to evaluate if it is more cost-effective to use these Arctic routes due to requiring more infrastructure including icebreaker capacity, higher risks for search and rescue (SaR) and disaster preparedness, and improved bathymetric and sea-ice information (Aksenov et al., Citation2017; Barents Observer, Citation2018, December 5). Arctic commercial shipping is primarily destinational for community resupply or resource extraction using bulk carriers, tankers and LNG carriers, and not container traffic. Experts generally agree that it will remain this way for the foreseeable future (Ellis & Brigham, Citation2009).
An increase in polar expedition tourism is anticipated with reduced sea-ice facilitating access to unique locations featuring exotic wildlife and interesting historical connections. In the Arctic, the season ranges from April to September and operations are expected to extend further west through the Northwest Passage (NWPS), eastward toward Novaya Zemlya, and to the North Pole. Cruises seek out concentrations of wildlife near the Marginal Ice Zone (MIZ), and the Arctic coastlines feature a multitude of sites of historical interest that educate the visitor in understanding the local inhabitants extreme endurance and ability to thrive under difficult conditions. In the Antarctic the season is from October to March, and cruise ships are expected to travel further south along the Antarctic Peninsula and into the Ross Sea. Many new locations are associated with coastlines that provide a dramatic backdrop to activities, including narrow causeways and fjords where the sea-ice and iceberg regime can change rapidly to hazardous.
The MIZ and ice edge are also important for fisheries in both hemispheres, with accurate mapping and forecasting being critical. The Barents and Bering Seas have high activity all year round with frequent vessel casualties. Recent examples include a shrimp trawler, Northguider, grounding in the Hinlopen Strait, Svalbard during December 2018 (Barents Observer, Citation2018, December 31), and numerous crab fishery boats in the Bering Sea lost due to vessel icing (NIOSH, Citation2017). The Bering crab fishery has a high activity with a limited entry system for quota shareholders who then harvest until their quota share is filled. In 2016, the harvested value in Alaska totaled approximately $250 million with the majority (almost $216 million) produced by the Bering Sea and Aleutian Islands (McDowell, Citation2017). In the Antarctic, the krill and Patagonian Toothfish fisheries have most activity during summer months using ice-strengthened vessels that can cope with light ice conditions, but can get trapped by heavier ice, for example the Antarctic Chieftain incident in February 2015 (Telegraph, Citation2015).
Overview of routes of operations and seasonal ice conditions
The main Arctic transportation routes include the NSR, Canadian Archipelago (CA) Waters including the NWPS, and Svalbard and Greenland coasts. The Arctic Bridge (AB) links the European Arctic (EA) to Canada, and the NSR to the Pacific. A Transpolar Sea Route (TSR) across the North Pole is expected to become a suitable route during ice-free summers (Dawson et al., Citation2018; Farré et al., Citation2014; Rodrigue, Citation2017) ((a)). Resource extraction occurs in the Barents and Beaufort Seas, and Russian Pechora and Kara Seas. The Nordic (Barents, Norwegian, Greenland, and Icelandic) Seas and Bering Sea are key fisheries and routes for passenger vessels. Operations in these regions begin as seasonal ice retreats in the summer. Studies from the last 7 years show an increase in the NSR and closer to the North Pole. Leisure and passenger vessels are expected to seek new areas of interest in the eastern NWPS (AECO, personal communication, April, 10, 2017; gCaptain, Citation2018; NASA Earth Observatory, Citation2018). How much drifting multiyear ice will affect northern routes in the future remains uncertain.
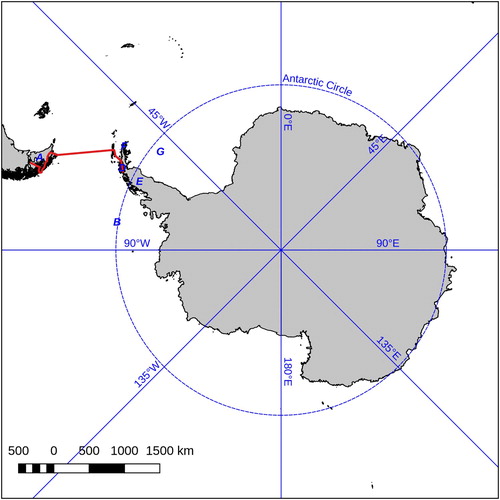
Figure 1. (a) Main Arctic routes for the Sub-Polar Seas, Canadian Arctic (CA), and the Northern Sea Route (NSR). In the sub-polar seas, ice formation typically starts in the Bay of Bothnia (A) and develops toward the Gulf of Finland (B), but in mild winters both areas see only partial ice cover. In severe winters, sea-ice reaches the central Baltic Sea (C) and the Kattegat (D) and Skaggerak (E) between Denmark, Norway and Sweden. The season ends starting with melt from the south, and by early May there is normally only ice remaining ice remains in the northern Bay of Bothnia, which disappears by June. In the Canadian Arctic, the main route for deep draft vessels links the Beaufort Sea (F) to Baffin Bay (G) through the Parry Channel (H). The western part of this is affected by persistence of ice in summer, and instrusions through the Queen Elizabeth Islands (I). Routes for shallow draft vessels through sounds connecting to Queen Maud Gulf (J) normally open up in summer, and the Hudson Bay (K) and Strait (L) are also only seasonally affected. The Northern Sea Route typically only sees residual sea ice in summer, ‘massifs’, in the East Siberian (M) and Laptev (N) Seas. (b). Main Antarctic routes from southern Chile and Argentina (A) to the western Bellingshausen Sea. (B). Ice formation during the high travel season is predominantly encountered in small channels and fjords in the Bransfield Strait (C) and Gerlache (D) Strait along the Antarctic Peninsula (E), in the Antarctic Sound (F), and Weddell Sea (G).
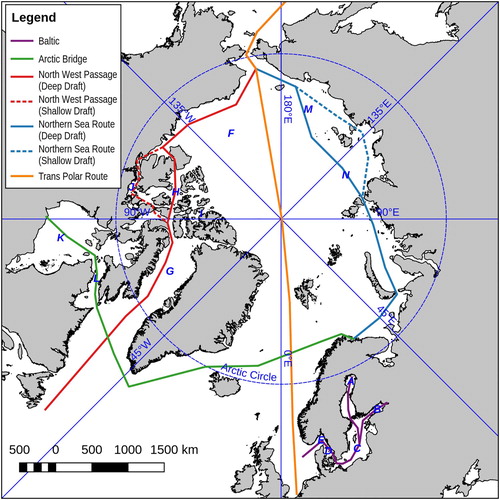
Operations and sea-ice conditions in sub-polar seas differ to those in the Arctic. The Baltic is critical for seaborne trade, with varied cargoes being transported through sea-ice to Finland during an average winter (HELCOM AIS). Cargo and passenger vessels follow a main trajectory through the Baltic, stopping at main ports along the way, whereas fishing and service vessels are distributed throughout. Other areas, such as the Labrador coast and large inland bodies of water (i.e. Great Lakes and Caspian Sea), feature some settlements and resource extraction that are otherwise isolated except by seaborne transport, thus operations continue throughout seasonal sea-ice cover.
The CA that includes numerous straits, sounds, bays, and inlets, is a highly heterogeneous region for summer ice conditions. Some regions present a significant interannual variability, in both the actual occurrence and duration of an open water season, and they are often observed in the central part which covers a large part of the NWPS. During the summer months, the remaining sea-ice in the CA becomes highly mobile as a result of winds and currents, causing ice concentrations to vary in a nonlinear manner. The NWPS does not open every year although the frequency of opening and duration of the open water season has seen an increasing trend since the mid-2000s (Figures (a) and ).
Figure 2. Interannual comparison (2002–2018) of the trafficability of the NWP and NSR for the two months period August 1 to September 30. The examined routes are marked as a red line. Trafficability was examined for any of the possible route options. Defined trafficability stages are ‘Closed with ice’ means that even a Polar Class 6 vessel could not traverse the passage. ‘Ice free’ means that retrospectively even a ship with no ice class could have made the traverse. ‘Intermediate stage’ would have required a Polar Class 6 ship for the traverse. Judgement of the trafficability stage was done on the basis of AMSR-2 sea-ice concentration data and MODIS optical images.
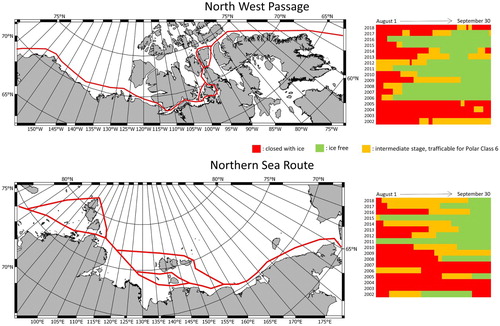
Alternatively, in the NSR, a number of regions of perennial ice cover, referred to as ice ‘massifs’ (Marchenko, Citation2012), are maintained throughout the summer, yet, some areas show low or ice-free passages for parts of the year. The Kara and Chukchi Seas clear first, followed by the Laptev and East Siberian Seas (ESS) ((a) and ). Ice disappears from offshore areas, with inshore ice replenished by discharge from river estuaries and blockages from massifs persisting later (Gascard et al., Citation2017). Most areas of the Kara, Laptev, and Chukchi Seas are clear by July, with the ice edge remaining well to the north. Residual ice is most likely to remain in the ESS where a tongue of perennial ice is often observed extending south from the main ice pack. Icebergs remain an issue in the western part of the NSR, around Severnaya Zemlya and east of Novaya Zemlya (Nakanowatari et al., Citation2018).
The Antarctic sea-ice area experiences larger seasonal changes than the Arctic, reaching its largest extent in September when an average ∼18 million km2 circumpolar ring of sea-ice encloses the entire continent and reducing to a minimum of ∼3 million km2 in February. Only the western coastline of the Antarctic peninsula remains ice-free most years (Parkinson & Cavalieri, Citation2012; Wadhams, Citation2000). The ice cover is heterogenous, with recurring polynyas all around the Antarctic continent. Sea-ice melt differs regionally where in regions with large polynyas, sea-ice retreats southward from the outer sea-ice edge and northward from the shelf-line (Wadhams, Citation2000). In contrast to the Arctic, there are few locations such as the Weddell Sea where sea-ice survives the melt season and transforms into multi-year ice. The Antarctic Treaty prohibits resource extraction, thus activities are limited to expedition cruise ship and extreme recreational tourism, logistical supply to research bases and fisheries. Activity is concentrated on the western side of the peninsula between December and April, as the lightest sea-ice conditions can be found there; however, ships can encounter ice in small channels and fjords ((b)). Additionally, all Antarctic waters carry a high risk of icebergs all year round. There are also an increasing number of ships going into Antarctic Sound and the Weddell Sea (Bender et al., Citation2016).
Methods
This paper collates combined experiences and knowledge of the authors on stakeholder and end-user feedback over the past decade. Conclusions from previous reports, funded by the European Commission (EC) and the European Space Agency (ESA) assessing user-needs assessments and stakeholder needs, are compared with recent documented feedback user surveys and workshops organized and conducted by the national ice mapping and research agencies. These show consistent agreement in the monitoring requirements for maritime safety in ice-covered water and these are reviewed here. The number of studies addressing sea-ice information provision demonstrates this is an important issue for the information and forecast provider community. However, challenges remain as to which user requirements should be addressed, and how these should be fulfilled. Sources for user feedback have been assembled by various funding agencies, research and operational institutes both independently and in collaboration. Efforts to determine user requirements have been primarily driven in the sphere of European scientific development, beginning with the joint EC and ESA programme Global Monitoring for Environment and Security (GMES) that evolved into the present Copernicus global monitoring programme. The authors were engaged in preparing a number of these reports (ACCESS, Citation2012; Goodwin et al., Citation2004; McDowell Group, Citation2017; Polarview Earth Observation Limited, Citation2016a, Citation2016b; Seina et al., Citation2013; SIDARUS, Citation2011) and these are listed in .
Table 1. Participating partners in European Space Agency (ESA), European Commission (EC), and consultancy reports specifying end-user needs for information provision to support maritime activities.
In addition, there have been a number of unpublished surveys, originating from national ice charting agencies and recent project workshops, including SALIENSEAS and KEPLER (EU-PolarNet, Citation2018; Lamers, Knol, et al., Citation2018). Inputs from personal communications with representative industries have also been included. A list of these workshop reports and unpublished surveys are shown here as .
Table 2. Participating partners in workshop reports and unpublished surveys.
The aim of combining previous and current user and stakeholder feedback is to present a framework that ice information providers and developers can use to prepare for future needs and contribute to safe navigation.
Types of stakeholders and end-users
Sea-ice information, ocean, and meteorological provision should be aimed at providing guidance and accurate information for safety and environmental protection at all spatial and temporal resolutions. Stakeholders that use sea-ice and iceberg information to support operations cover a wide range of different applications, but can be broadly distributed into three main groups.
First, there are those who want to avoid all ice or need dates of ice retreat and return for a region in order to manage their activities. These users have activities that are affected by the presence of sea-ice or icebergs, typically due to vessel or equipment limitation and the associated safety factor needed for safe operation. These include those engaged in resource extraction and development of infrastructure, particularly where equipment has not been designed for ice-covered regions and non-ice reinforced recreational craft that need to be able to stay clear of ice. The current state of satellite coverage for the Polar Regions allows for long-term outlooks, operational ice charts, and other regional satellite-derived daily sea-ice coverage maps that provide an indication of areas where ice is likely to be encountered. These assist when planning transits on a daily frequency and for the upcoming season but details needed for tactical or navigational information, such as leads and pressure ridges, are not normally included in derived operational products.
The next type of user can require specialized ice information, as their focus is in areas near or within the MIZ and require more detailed information to maximize their margin of safety. Of particular interest is accurate mapping of the sea-ice edge, areas of ice separated from the main pack, and iceberg-infested waters. This group includes fisheries, for which the MIZ is a biologically active area, expedition cruise ships, and researchers interested in collecting sea-ice data, exploring ocean and atmosphere exchanges and interactions, and hydrographic or seismic surveying ships which often need 100% ice-free areas where even very small patches of ice (<100 m) can disturb planned surveys.
The third type of user is highly specialized and wants to operate in, on, or under continuous sea-ice cover. These require more detailed sea-ice information, particularly rheology, thickness, ice type, ice age, snow depth, and ice motion to maintain a level of safety. This includes specialized commercial trade, transport of logistics in fjords and along coastlines, particularly in Svalbard and by indigenous peoples in Greenland and the Canadian Archipelago, icebreakers maintaining navigation on the NSR and NWPS, Canadian and Alaskan Arctic Waters, or McMurdo Sound in Antarctica, explorers crossing the ice, ice runways for air logistics, SaR, and long-duration ice camps for research.
Another type of stakeholder does not use sea-ice information themselves directly for operations, but as an input for other products that are then utilized by the groups described above. These intermediate users include producers of weather and climate forecast models and require a broad synoptic and daily overview with low spatial resolution (>1 km). However, requirements vary with either global or regional application and are likely to be more demanding in future with higher resolution regional models featuring resolutions <1 km or Finite Element Method (FEM) variable triangular gridding (Rampal et al., Citation2016).
Insight into stakeholder and user needs
There is great interest in identifying and providing support for stakeholder needs. Yet, requirements vary depending on the type of stakeholder, season, ice conditions, and capabilities of the ship or platform to receive and understand the information. Whether it is vessel construction, planning requiring months or year lead times, voyage planning, or NRT tactical activities, users need to make decisions on how to proceed. This is especially critical for infrastructures ability to withstand expected sea-ice conditions. For those working near ice-infested waters, sea-ice information needs to be accessible; its relevance well understood; suitable spatial and temporal resolutions available; low bandwidth, and should have the ability to be visualized to efficiently aid users making informed decisions.
User requirements for sea-ice information and forecasts
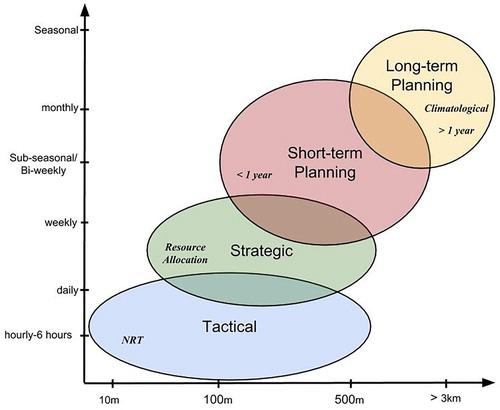
Information is primarily provided from remotely sensed data because satellites are able to observe at multiple temporal and spatial resolutions over large areas. However, the relationship between the two is a trade-off where the ability to monitor at higher spatial resolutions yields smaller footprints, thus lower spatial coverage and vice versa (Meier & Stroeve, Citation2008). Expanding volumes of satellite data allow information providers to generate copious sea-ice-derived products, yet sending the relevant information can be a critical issue that is overlooked. Users often desire high-resolution data in NRT, but their ability to obtain it is a trade-off where factors include data transmission limitations and cost. Customers will use easy and familiar products in preference to new products until experience allows them to have confidence in the information and its limitations, quick access to the information when needed. It is not always clear to users which new products are available, how to distinguish differences between products, and how to use the data and format. In the Barents Sea, there has been interest in the ice edge due to the proximity of energy company exploration activities, with the different parties drawing ice edge products and using them to illustrate their argument (Rommetveit, Citation2017; Steinberg & Kristoffersen, Citation2017). This has introduced confusion between products used for climatological studies and those intended for tactical purposes, though both are valid for planning purposes. In order to identify what is useful for different stakeholders, it is important to acknowledge the scales required for varying operations, locations, and seasonal ice conditions ().
Figure 3. Schematic illustrating an example of the range of typical spatial and temporal scales of information required by users.
Forecasts are used by stakeholders to plan future activities and provide guidance in gaps of sporadic satellite coverage. A principal obstacle for the use of forecasts for navigation and planning is a misunderstanding between providers and stakeholders on what they think is needed. Feedback from users express the desire to have uncertainties, which is not always easy to include due to the difficulties of accurately assessing critical initial conditions for the weather, sea-ice, and oceanographic parameters (Clements et al., Citation2011; EU-Polarnet, Citation2018). This results in forecasts that have not always been developed with the needs of the user community in mind, despite users articulating their needs well, potentially limiting their usefulness for tactical or strategic activities. Along with technical challenges there is also a knowledge aggregation problem with many stakeholders not knowing how they would use seasonal-scale forecasts. While sub-seasonal forecasts remain an important informational component of maritime operations, there is little understanding of what contributions long-term forecasts can make, due to the lack of familiarity. In the case of the Bering Sea crab fishery, sub-seasonal forecasts are used for navigation and planning purposes during the harvest season (October–February). Drift and SIC are particularly important because they help identify relevant locations, and when equipment damage may occur. Bering Sea crabbers are familiar with the informational content of sub-seasonal forecasts but have little understanding of how seasonal scale forecasts might be used for planning and operations. The inability to meet user needs is often attributed to the main fundamental factors; (1) absence of technology (sensors incapable of providing the accuracy to real-life data that users require), and (2) lack of cooperation, harmonization, and standards at the national or international level.
Ice information for different stages of activity and planning
Remote sensing signatures of sea-ice vary seasonally, regionally, and with different types of satellite sensors. Different frequencies provide the ability to interpret surface characteristics, which can be significantly influenced by snow loading, and freezing, and melting phases (Sandven et al., Citation2006; Webster et al., Citation2018). When providing sea-ice information for users, it is important to consider types of ice expected to be present during all parts of the season in order to resolve ambiguities in remote sensing data.
Information requirements are determined by different stages of activity and planning. Most activity occurs during the summer and is affected by the timing of the spring melt or autumn freeze-up conditions. The predictability of the ice advance and retreat is important for planning and can vary regionally. Where activity takes place in regions that perennial ice is likely to be present in, the probability of multiyear ice and ridge intrusions is useful. Ice information needs during the early phase of voyage planning require good knowledge of the duration of season, its start and end dates, and a measure of the uncertainty through historical information for probability, iceberg density information, and preferably ice type, concentration and average ice conditions for a specific area (EU-Polarnet, Citation2018). Attempts at seasonal prediction are still experimental (Melia et al., Citation2017; Onarheim et al., Citation2015).
Early Phase: A decision needs to be made at this phase whether ice is potentially a factor, determining if ice-class vessels are needed, or if activity should commence in ice-free summer conditions. Historical conditions are useful to ascertain the probability of the start and end dates of the ice-free season and its duration. This takes the form of low-resolution synoptic overviews, either from ice charts, or more likely, derived from PMW sea-ice concentration (SIC) data (Lavergne et al., Citation2019; Stroeve et al., Citation2016). Information on ice type, such as multiyear ice or icebergs, is also useful.
The length of the open water season varies interannually according to the severity of the season and depending on the geographical area. Ocean currents can cause some areas to be ice-free almost year round, while others have near continuous ice cover and are only ice-free in more benign years. In the EA, for example, warm water from the Norwegian Current ensures that the western Barents Sea and west coast of Svalbard are nearly always ice-free. However, part of the Transpolar Drift, when directed east of Spitsbergen, and in its main continuation of the East Greenland Current ensure that the east coasts of Svalbard and Greenland see a longer ice cover than elsewhere (Renner et al., Citation2014). The general atmospheric circulation must also be included and prolonged winds from a particular direction will cause earlier or later open water conditions. This can occur in the Fram Strait, when southerly winds aid ice-free navigation north of Svalbard and Greenland by blocking the Transpolar Drift. Alternatively, northerly winds can result in a rapid closing of open water areas, particularly flaw leads along the Greenland coast, and the Whalers Bay polynya north of Svalbard. Extended periods of cold in Svalbard and Greenland also aid the formation of sea-ice in fjords and shallow coastal waters. In the Pacific sector, the open water season is dominated by a retreat of sea-ice in the summer away from the coastlines toward the shelf break. Advection of ice in the Beaufort Gyre can result in an interrupted season with ice approaching the Alaska coast. Ice massifs can also linger in sectors of the NSR, typically where ridges have grounded anchoring it in place and preventing its dispersion (Marchenko, Citation2012).
Late Phase: Toward the late planning stage and into the period of the activity, greater detail and more frequent information updates are needed. This is available through the use of high-resolution satellite sensors, particularly all-weather synthetic aperture radar (SAR), or alternatively through NRT observational information. During icebreaker operations NRT SAR images are used to identify open leads in the ice cover. In the summer, due to ambiguities in the surface caused by melt, cloud-free optical satellite imagery can also play a role but is not always reliable due to cloud cover. In particular, it is necessary for users to know the age of ice (World Meteorological Organization (WMO) stage of development) and locations of multiyear ice, deformation in the form of ridging and rubble fields, and floe sizes. These, coupled with frequent temporal updates to observe ice dynamics, are essential for determining safe passage. Other properties, including sea-ice and snow cover thickness, and ice strength, would also be useful but are more difficult to derive with any level of accuracy from satellite data. Thickness can be derived from satellite radar and laser altimetry, but only if assumptions are made as to the snow cover thickness since this can only be estimated approximately and at coarse resolution through PMW radiometers (Comiso et al., Citation2003). Ice strength is more difficult, as this cannot be observed directly and has to be deduced through a time series of observations of sea-ice drift and calculation in theoretical models (Ungermann et al., Citation2017).
Parameters can be estimated through forecast modeling that includes a degree of data assimilation, for example PIOMAS, but are still very much experimental (Schweiger et al., Citation2011). Research-level information products require further, and preferably continuous, validation by in situ observation networks (i.e. WMO Global Cryosphere Watch (GCW) program (WMO, Citation2015)). Forecasts can be divided into long (climate), medium (sub-seasonal 5–10 days) to seasonal (3 months), and short (daily to weekly) range lead times. For stakeholders, these equate to long-term planning and business perspectives (climate prediction, 1–10 years), also referred to as strategic, immediate planning (sub-seasonal) referred to as operational, and basic security of people and operations (weather forecast horizon) known as tactical. Particularly in the early or planning phase, various forecasts are essential although there must be a certain level of confidence included for them to be useful for decision-making.
How users make decisions
In the shipping industry, decisions are influenced not only by the season, and the presence of ice along a shipping route, but also by economical and geopolitical considerations. Various factors can lead to the decision of whether vessels can navigate predetermined routes within the open water season, or if there is a need to extend the shipping season (e.g. community resupply vessels). Commodity market prices, annual tonnage targets, and resource life-cycle continue to govern decision-making for Arctic transits (EU-Polarnet, Citation2018; Lamers, Duske, et al., Citation2018). In terms of long-term strategic planning, historical data are typically used to assess the feasibility of a navigation route by determining the duration of the shipping season based on vessel ice class. Ice atlases and ice charts are used to provide a broad picture of ice conditions, namely the average timing of ice retreat and advance. Satellite imagery and local ice charts can be used to assess specific ice-related challenges such as deformation features in the ice cover (rubble and ridges), recurrence of dynamic processes (pressure and shearing), and inclusions of glacial or old ice within the pack (Fequest, Citation2002). This information helps to define possible areas for travel and the average length of the shipping season, leading to the creation of a commercial model that will be crucial in deciding if the project is financially viable. Once this early planning stage is completed, decisions can be made for defining shipping schedules.
Decisions are also made on the tactical scale by navigators and those in activities that support daily operations. Currently, ice information products are essential for planning and adjusting routes on a daily basis. These products should include user-friendly routine ice information, NRT satellite imagery (if applicable), as well as short-range oceanographic and meteorological data (i.e. wind and air temperatures) and ice forecasts. Ice forecasts are ideal for navigators to understand forecasted ice drift and pressure for continuous routing adjustment and searching for openings or areas of minimal ice cover. In commercial shipping, the objective is to complete a voyage safely while avoiding delays, reducing fuel consumption, and eliminating the risk of encountering ice that could lead to besetment or damage to the vessel.
Following International Polar Year (IPY) there has been an increased recognition of the sea-ice information needs of local communities in the Arctic. Activities, including subsistence hunting and transportation between settlement sites, have relied on a stable fast ice cover that is changing through climate change (Laidler et al., Citation2009). A number of initiatives have been developed to provide updated information products and allow local communities to collect their own in situ observations, including SmartICE in the Canadian Archipelago, which allows people traveling by dog sled to record sea-ice thickness through electromagnetic induction sensors (Bell et al., Citation2014). Design, construction, and maintenance of instrumentation systems are performed by the communities themselves and they ensure the local communities have access to up-to-date and accurate information, plus have a stake in its continuity.
Availability of sea-ice information from service providers
Low spatial (∼3–25 km) and high temporal resolution PMW satellites provide synoptic coverage of both hemispheres and can yield sea-ice information, such as SIC, ice age, ice motion, and timing of ice retreat and advance (Inoue, Citation2008; Liu et al., Citation2019; Shokr & Sinha, Citation2015; Waseda et al., Citation2018). The data do not accurately resolve the MIZ, ice edge, and coastal locations due to coarse spatial resolutions and also underestimate the true ice-fraction once melt begins. For these reasons, the dataset is good for planning and providing an overview for many users, but for navigation and tactical purposes, this scale does not effectively capture main areas where many users travel (Aksenov et al., Citation2017). For vessels with an ice class of PC1 or PC2, meaning they can travel through medium FYI and old ice, this type of lower resolution information can be adequate because this type of user is prepared for all ice types and can safely navigate through pack ice.
High spatial resolution (<1 km) data, such as SAR and optical (visible and infrared), provide good information on sea-ice features including sea-ice ridges, leads and deformed ice. However, these sensors do not have comprehensive coverage unless compiled, mosaicked, or interpolated through model data assimilation but can support tactical navigation needs and planning purposes, depending on whether or not users require knowledge of ice floes such as dimensions, ice classification, and features. This additional level of detail further adds to the communications bandwidth problem at high latitudes, which is why the compression of sea-ice rheology information through ice-charts is relevant. However, given the highly variable nature of these features, long-term planning is limited. The provision of more detailed information can aid the passage of vessels with lower ice classes in ice-encumbered areas, but at greater risk. The user should be aware of inherent ice dynamics and the risk of becoming beset and prepared to navigate to safe areas.
Iceberg tracking with the sole use of satellites is more challenging, particularly for smaller icebergs ranging in size from growlers and bergy bits (<1 m – >5 m) to larger icebergs (∼<200 m), with the minimum size that is detectable being dependent on the spatial resolution of the satellite sensor and the sea state. Most high-resolution satellites are unable to accurately identify smaller icebergs from ships and other surface features (Akbari & Brekke, Citation2018; Hughes & Wagner, Citation2015; Mazur et al., Citation2017). Effective tracking requires good intercomparison with in situ observations, shipborne radar, satellite (or airborne such as helicopter or Unmanned Aerial System [UAS]) detections, and iceberg forecast models. Depending on the cloud cover, optical satellite data may not be available. Open water detection of icebergs is seen as routine, but can be limited by high sea states (Power et al., Citation2001). Detection within pack ice is difficult, due to the surrounding radar that returns from ice edges and ridges. More recently, the capability of some SAR sensors to provide fully polarimetric data has allowed improved classification of icebergs within sea-ice, and the reliability of this would be enhanced by a multi-frequency approach, particularly with the addition of lower frequency, L-band, SAR information (Johansson et al., Citation2018; Singha et al., Citation2018). This differs from the standard single polarization, Constant False Alarm Rate (CFAR) approach where a pixel comparison is made with the characteristics of the surrounding background (Buus-Hinkler et al., Citation2014). Where observations are combined with an iceberg drift and deterioration model (Kubat et al., Citation2005, Citation2007), tracking and improved filtering of false targets becomes theoretically possible and is the subject of further research. This new approach could also allow for improvements to confidence mapping of icebergs where information can be tailored for specific users who are only interested in potential icebergs in their trajectory or relevant to their operational area.
Gaps in knowledge for sea-ice information needs and forecasts
Sea-ice data information gaps
There are significant gaps in the ability to provide accurate information for sea-ice-covered areas that. in turn, affects the provision of forecasts. Although PMW has been routinely used, it is only in the past 15 years that large volumes of NRT SAR imaging have become widely available. However, as this increase in the amount of data runs into the satellite communications bandwidth limitations, more advanced techniques are required to convert and reduce it to manageable and understandable information products. A key information gap is the provision of detailed and accurate snow depth and sea-ice thickness information, particularly during the spring and summer seasons. Snow depth is a critical parameter for accurately measuring sea-ice thickness from satellites (Liston et al., Citation2018). It is also increasingly important, even for high ice class vessels (PC1 and PC2), due to the observation of ‘Antarctification’ in the Arctic with a seasonal sea-ice covered by a heavier snow layer (Granskog et al., Citation2017) where the snow layer acts as a cushion reducing the efficiency of ice-breaking vessels (Mironov et al., Citation2012). Also not observable using current satellite technologies, is the distribution of ridge sizes and keel depths. These affect the ability of vessels to operate in ice, and forecasting ability due to ridges being a feature of sea-ice roughness and altering the drag coefficient (Tsamados et al., Citation2014). While SIC is now routinely assimilated into forecast models (Lindsay & Zhang, Citation2006; Wang et al., Citation2013), parameters, including sea-ice pressure, stress, and strength, are also not readily observable leading to a key data assimilation gap for models. For ice of land origin and icebergs, many areas lack reliable climatologies from observations. Although there is a large volume of SAR satellite images, there has been no overarching attempt to process this consistently for iceberg detection because it requires a more robust validation through the use of observation data and drift forecasts to filter out false detections.
Forecast information gaps
With these critical information gaps, the lack of decent routine quality observations introduces corresponding challenges in the ability to provide accurate forecasts or to validate them to provide meaningful measures of confidence or uncertainty. Additionally, it is difficult to formulate proper model evaluations specific for different users because sea-ice and weather forecasting models will require the improved snow depth and sea-ice thickness in order to generate forecasts that better capture temperature, weather, and ice variables (Caya et al., Citation2010; Prasad et al., Citation2018). Only recently have there been some attempts to devise other metrics for comparing model forecast data with observations that could also be applied to automated products derived from satellite data, such as the integrated ice-edge error (IIEE) (Goessling et al., Citation2016; Zampieri et al., Citation2018). This is surprising, given the widespread use of observation data for forecast initialization and, more recently, forcing through data assimilation. Data assimilation into numerical models is achieved through a number of schemes that can be broadly categorized into so-called 3D-Var, for initialization of a 3D-matrix of parameters at single point in time, and 4D-Var, where the parameters are further ‘nudged’ toward the observed values through time. A typical 3D-Var technique involves optimal interpolation (Gandin, Citation1966; Wang et al., Citation2013), and when expanded to include the temporal aspect in 4D-Var, Kalman filtering as used in the Copernicus TOPAZ4 forecasts (Sakov et al., Citation2012). The more complex techniques of 4D-Var incur a much greater computational cost, thus limiting their widespread deployment until recently. In nearly all cases, analysis includes minimization of a cost function (Hestenes & Stiefel, Citation1952; Saad & Schultz, Citation1986). However, the increase in the availability of computational resources has also allowed forecasts to develop from purely deterministic, where one scenario is forecast using the, hopefully, most accurate set of initialization data, to probabilistic. For probabilistic forecasts, a range of different input values are used covering the distribution of possible scenarios. This results in a number of end results, which can be used to produce a probability of an occurrence, for example the position of the ice edge. However ensemble predictions, because of their greater computation cost, although widely used in weather and climate forecasting, are rarely used in operational sea-ice predictions. Thus, there is an unfamiliarity for most stakeholders in using and understanding the information that they portray that limits the ability to assess their utility.
Discussion and future needs
Feedback from the last 10 years remains consistent regarding the spatial and temporal scales that marine users require for sea-ice and iceberg information. The challenge for the ice information provision community is to produce relevant data products, which include sea-ice parameters at the high spatial resolution needed for these users, and deliver it over communications links with restricted bandwidth. In addition, different types of information, over a longer forecast range, are required to adapt to climate change and the retreat of Arctic sea-ice cover. This also highlights the need for different types of model, and better climate forecasting to address issues such as coastal erosion and greater risk to small fishing boats due to increasing wave height (Waseda et al., Citation2018). Changes in the pack ice and dynamic conditions expected in the MIZ will result in a need for new approaches to sea-ice information provision and forecasts (Eicken, Citation2013). This will include integrating requirements for improved data on sea-ice rheology and small-scale features, winds, and ocean currents (Aksenov et al., Citation2017). In addition, better coordination with support services in preparation for a changing Arctic will need the incorporation of information about optimal shipping routes and voyage planning based on probability forecasts and model projections, improved knowledge of accessibility of ships transit for specific areas, improvements in technology and infrastructure, and higher bandwidth communication with information providers and stakeholders (Farré et al., Citation2014; Stephenson et al., Citation2011).
Another challenge is determining how to optimally process large volumes of data, especially the vast quantities of Earth Observation (EO) data. There is increasingly a role for smaller, specialized entities, including private companies, to provide additional bespoke information products either as a public service or for commercial gain. However, increased information, temporal availability, and improved spatial detail result in greater data volumes, and the question then arises of how can this be transmitted to users in remote areas? If data can be transmitted it is important to know if users are in a position to receive it and make use of it. Although improved satellite communications coverage is expected to be available for the high latitudes of the Arctic and Antarctic (Barents Observer, Citation2018, March 27), it is still unclear when it will be ready or what costs to the user are involved. Presently high bandwidth solutions, like Iridium NEXT, are prohibitively expensive for most users. This is likely to change as more providers enter the market with further innovations, for example Highly Elliptical Orbiting (HEO) communications systems such as the constellation funded by Norway for launch in 2023. In preparation for ship operators, planners, and other new operators to be able to receive and benefit from new developments in technology when traveling through ice-encumbered areas, the assessment of on-board systems should also be considered. An Electronic Navigational Chart (ENC) provides the data component of an Electronic Chart Display Information System (ECDIS), which is under review as an approved aid to navigation, as a platform for ice information in standard formats, and supported by The International Hydrographic Organization (IHO) (Falkingham, Citation2014). An ideal ice information system on board a ship could include, but not limited to, all of the above-mentioned products on demand with the following criteria in .
Table 3. Recommendations for ice information systems to be implemented on vessels and potential informationprovision resources.
Improved dialogue between service providers and stakeholders
It is essential to acknowledge that information product development for users requires dialogue between service providers and stakeholders. Main outcomes from user responses for the research community were challenges in using the same terminology (Eicken, Citation2013), standard format, and integrating stakeholders during the development process (EU-Polarnet, Citation2018). These are issues that have been highly under-represented, but is now the subject of several European projects including SALIENSEAS (http://salienseas.com/) and the EU KEPLER project (https://kepler-polar.eu/) that will help identify how to make the best use of the information and communication currently available and recommend further infrastructure improvements. SIPN2 is implementing an iterative knowledge development process to introduce and subsequently identify user preferences to address challenges with users’ understanding of seasonal forecasts, including a survey currently underway for organization members to begin identifying areas of operation where seasonal forecasts can contribute. Along with collating background information about vessels, experience, and harvest practices, respondents are also being asked how long-term forecasts can be used to support an array of planning and operations-related activities. Information from the survey will then be used to inform the design of a best-worst scaling (BWS) exercise. This is a method which allows for the systematic collection of preference data that is commonly used in social science-related research. In this instance the Bering Sea crabbers will identify activities where seasonal forecasts are most and least likely to make a positive contribution. Through this process it will be possible to develop a ranked list of planning and operations activities that can be used by SIPN2 team members as they develop the content and presentation of the forecast product. In addition, the iterative approach also identifies those areas where seasonal scale is not needed which enhances efficiency and allows the research team to focus resources on high value areas of need.
Presence of new satellite sensors
Major advances have been made with the widespread, and freely available, NRT SAR imaging from the European Sentinel-1 constellation that has improved products for end-users with navigation, planning, and forecasts. This provides nearly daily, and sometimes twice daily, coverage of key areas in the Arctic. Yet critical gaps remain at lower latitudes including southern Greenland, and for the Antarctic and areas of the Arctic outside of the European sector, where coverage is more sporadic. Pan-Arctic coverage is expected to be a possibility with the launch of the Canadian Radarsat Constellation Mission (RCM) in February 2019 although issues remain to be resolved which are discussed further in the following section. Data volumes are vast, so research efforts are underway to make more use of automated processing (Koubarakis et al., Citation2019). However, challenges with ambiguities in classification remain from fundamental limitations with the sole use of microwave sensors to monitor sea-ice and it is, therefore, necessary to combine SAR with other sources of data. PMW can augment areas not covered by SAR; however, it operates at similar frequencies and has a lower resolution. This can be valuable for planning and forecasts, but unsuitable to provide information on sea-ice features smaller than ∼3 km necessary for tactical purposes. Optical and infrared are preferable, as these are at a resolution similar to SAR but a key drawback is that they cannot see through clouds which are prevalent around the MIZ areas in the summer. To get around these issues, an integrated approach incorporating all relevant satellite (and in situ) information and forecast modeling can be useful. The data assimilation techniques available now allow for different types of input information, with sporadic temporal and spatial coverage (Houtekamer & Mitchell, Citation2001), and a forecast model, along with satellite derived sea-ice drift information, can also provide a tracking capability where ice is followed from one satellite image to the next (Thomas et al., Citation2008). This allows for reducing uncertainty by building up a detailed picture of the sea-ice properties from multiple satellite sensors and its development from one ice type to another monitored.
Next steps and new technologies for derived products
These issues demonstrate some fundamental aspects forecast and sea-ice provision services need to consider when developing information products specific for stakeholders and end-users. Although processing large data volumes can be overwhelming, the challenge lies with providing the best information on the scales necessary for all users at any given time. To overcome some of these challenges, Machine Learning, and Artificial Intelligence, can play a role in the automatic analysis, but this is dependent on good quality satellite information and ground truth information for training the systems and to maintain validation. Real intelligence is also needed to incorporate these factors into an overall system. Automatic classification of sea-ice is improved by access to fully-polarimetric, multi-frequency SAR (Singha et al., Citation2018). Currently the majority of SAR sensors, and all those used for routine operational monitoring, are in C-band (frequency 4–8 GHz). The ‘C’ is also sometimes referred to as ‘compromise’ because it represents a compromise between the size of the antenna aperture, which decreases with frequency and attenuation of the radar signal through rain and clouds which increases with frequency (Doerry, Citation2004). Unfortunately, as snow cover is present on sea-ice, a lower frequency is required for greater penetration depth and detection of deformation features. The use of L-band (frequency 1–2 GHz) when combined with C-Band, has shown promise with improving monitoring sea-ice features deemed critical for tactical and navigation operations (Casey et al., Citation2016; Dierking & Busche, Citation2006; Dierking & Dall, Citation2007; Howell et al., Citation2018; Johansson et al., Citation2018), though an antenna length of ∼10 meters makes for a more difficult satellite post-launch deployment. In situ observations (i.e. ship-based, buoy, and drones) are needed to provide the ground truth for certain parameters and aid in confidence mapping, provision of NRT information, and improved initialization of forecasts. Sea-ice forecast models are reaching a complexity whereby they are able to parameterize or recreate sea-ice dynamics and characteristics (Rae et al., Citation2015; Rampal et al., Citation2016; Vancoppenolle et al., Citation2012). In particular, the ability to extend forecasts into the seasonal timescale requires the use of improved sea-ice thickness measurements that could be provided by altimetry (i.e. CryoSat-2 (Blockley & Peterson, Citation2018), Sentinel-3, ICESat-2 (Schweiger et al., Citation2011), PMW interferometry (SMOS) (Mu et al., Citation2018)), and thermal infra-red optical imaging. Short-range forecasts require accurate weather forecasting with, ideally, a fully coupled ocean-ice-atmosphere model to cover the 24 hours to 7 days period as this time-frame is generally preferred for sub-seasonal planning that allows users to reduce their immediate risks. Here more in situ observations and a better understanding of ocean-ice-atmosphere fluxes and boundary layer physics are necessary (Jung et al., Citation2016). While there has been research into inverse modeling of raw values (Lee et al., Citation2017; Remund & Long, Citation2003) to provide model outputs directly comparable with the satellite observations, the additional parameterizations to calculate these still require detailed understanding of the processes involved. Drift measurements, both in situ from buoys and derived from satellites (Löptien & Axell, Citation2014; Schweiger & Zhang, Citation2015) especially high-resolution SAR (Karvonen, Citation2012; Korosov & Rampal, Citation2017) and optical, are another underutilized resource that could improve drift forecasts. The modeling community relies on PMW and deems it essential for forecast model initialization (Liu et al., Citation2019). However, its usage may also result in a forecast of the future PMW product. Its replacement by higher resolution products of greater accuracy, particularly for areas of the MIZ, may assist in providing forecasts results with greater accuracy (Caya et al., Citation2010; Meier et al., Citation2015; Zampieri et al., Citation2018). Finally, more transparent assessment using readily understandable metrics of forecast skill will generate trust with stakeholders (Zampieri et al., Citation2018).
Acknowledgements
We also acknowledge the contributions and assistance from EU-PolarNet, SALIENSEAS project, Arctic Expedition Cruise Operators (AECO), International Association of Antarctic Tourism Operators (IAATO), Arctic Frontiers, International Ice Charting Working Group (IICWG), Climate and Cryosphere Project (CliC), Richard Hall, Tim Keane, and Duke Snider.
Disclosure statement
No potential conflict of interest was reported by the author(s).
Additional information
Funding
References
- ACCESS. (2012). Assessment of current monitoring and forecasting requirements from users and international providers of services. ACCESS Arctic Climate Change, Economy and Society, Deliverable D, 2.14.
- Akbari, V., & Brekke, C. (2018). Iceberg detection in open and ice-infested waters using C-band polarimetric synthetic aperture radar. IEEE Transactions on Geoscience and Remote Sensing, 56(1), 407–421. https://doi.org/10.1109/TGRS.2017.2748394
- Aksenov, Y., Popova, E., Yool, A., George Nurser, A. J., Williams, T., Bertino, L., & Bergh, J. (2017). On the future navigability of Arctic sea routes: High-resolution projections of the Arctic ocean and sea ice. Marine Policy, 75, 300–317. https://doi.org/10.1016/j.marpol.2015.12.027
- Barents Observer. (2018, December 31). Drama in Arctic waters as trawler runs aground at Svalbard, by Staalesen, A.
- Barents Observer. (2018, December 5). Explosive growth in Russian Arctic shipping, by Staalesen, A.
- Barents Observer. (2018, March 27). Two new satellites to boost Norway’s Arctic internet, by Staalesen, A.
- Bell, T., Briggs, R., Bachmayer, R., & Li, S. (2014, September 14–19). Augmenting Inuit knowledge for safe sea-ice travel — The SmartICE information system. 2014 Oceans - St. John's, St. John's, NL. IEEE. https://doi.org/10.1109/OCEANS.2014.7003290
- Bender, N. A., Crosbie, K., & Lynch, H. J. (2016). Patterns of tourism in the Antarctic Peninsula region: A 20-year analysis. Antarctic Science, 1, 1–10. https://doi.org/10.1017/S0954102016000031
- Blockley, E. W., & Peterson, K. A. (2018). Improving Met office seasonal predictions of Arctic sea ice using assimilation of CryoSat-2 thickness. The Cryosphere, 12(11), 3419–3438. https://doi.org/10.5194/tc-12-3419-2018
- Burrows, C. J. (1976). Icebergs in the Southern Ocean. New Zealand Geographer, 32(2), 127–138. https://doi.org/10.1111/j.1745-7939.1976.tb01164.x
- Buus-Hinkler, J., Qvistgaard, K., & Krane, K. A. H. (2014, July 13–18). Iceberg number density — Reaching a full picture of the Greenland waters. 2014 IEEE Geoscience and Remote Sensing Symposium, Quebec City , QC (pp. 270–273). IEEE. https://doi.org/10.1109/IGARSS.2014.6946409
- Carsey, F. D. (1980). Microwave observation of the weddell Polynya. Monthly Weather Review, 108(12), 2032–2044. https://doi.org/10.1175/1520-0493(1980)108<2032:MOOTWP>2.0.CO;2
- Casey, J.-A., Howell, S., Tivy, A., & Haas, C. (2016). Separability of sea ice types from wide swath C- and L-band synthetic aperture radar imagery acquired during the melt season. Remote Sensing of Environment, 174, 314–328. https://doi.org/10.1016/j.rse.2015.12.021
- Caya, A., Buehner, M., & Carrieres, T. (2010). Analysis and forecasting of sea ice conditions with three-dimensional variational data assimilation and a coupled ice–ocean model. Journal of Atmospheric and Oceanic Technology, 27(2), 353–369. https://doi.org/10.1175/2009JTECHO701.1
- Clements, M., Hendry, D., Katz, R., & Lazo, J. (2011, July 8). Economic value of weather and climate forecasts. In The Oxford handbook of economic forecasting. Oxford University Press. Retrieved June 1, 2020, from https://www.oxfordhandbooks.com/view/10.1093/oxfordhb/9780195398649.001.0001/oxfordhb-9780195398649-e-21
- Comiso, J. C., Cavalieri, D. J., & Markus, T. (2003). Sea ice concentration, ice temperature, and snow depth using AMSR-E data. IEEE Transactions on Geoscience and Remote Sensing, 41(2), 243–252. https://doi.org/10.1109/TGRS.2002.808317
- Comiso, J. C., Gersten, R. A., Stock, L. V., Turner, J., Perez, G. J., & Cho, K. (2017). Positive trend in the Antarctic sea ice cover and associated changes in surface temperature. Journal of Climate, 30(6), 2251–2267. https://doi.org/10.1175/JCLI-D-16-0408.1
- Dawson, J., Pizzolato, L., Howell, S., Copland, L., & Johnston, M. (2018). Temporal and spatial patterns of ship traffic in the Canadian Arctic from 1990 to 2015+Supplementary Appendix1: Figs. S1–S7 (See Article Tools). Arctic, 71, 1–113. https://doi.org/10.14430/arctic4698
- Deggim, H. (2018). The international code for ships operating in Polar waters (Polar Code). https://doi.org/10.1007/978-3-319-78425-0_2
- Dierking, W., & Busche, T. (2006). Sea ice monitoring by L-band SAR: An assessment based on literature and comparisons of JERS-1 and ERS-1 imagery. IEEE Transactions on Geoscience and Remote Sensing, 44(4), 957–970. https://doi.org/10.1109/TGRS.2005.861745
- Dierking, W., & Dall, J. (2007). Sea-ice deformation state from synthetic aperture radar imagery—Part I: Comparison of C-and L-band and different polarization. IEEE Transactions on Geoscience and Remote Sensing, 45(11), 3610–3622. https://doi.org/10.1109/TGRS.2007.903711
- Doddridge, E. W., & Marshall, J. (2017). Modulation of the seasonal cycle of Antarctic sea ice extent related to the southern annular mode. Geophysical Research Letters, 44(19), 9761–9768. https://doi.org/10.1002/2017GL074319
- Doerry, A. W. (2004, August). Atmospheric loss considerations for synthetic aperture radar design and operation. Radar Sensor Technology VIII and Passive Millimeter-wave Imaging Technology VII, Orlando, FL (Vol. 5410, pp. 17–28). International Society for Optics and Photonics. https://doi.org/10.1117/12.542327
- Eicken, H. (2013). Arctic sea ice needs better forecasts. Nature, 497(7450), 431–433. https://doi.org/10.1038/497431a
- Ellis, B., & Brigham, L. (2009, April). Arctic Marine Shipping Assessment 2009 Report. Arctic Council, second printing.
- EU-PolarNet. (2018). Minutes of stakeholder dialogue at Arctic Frontiers Conference. EU-PolarNet, EU H2020 Coordination and Support Action, Grant Agreement 652641, Deliverable D4.11.
- Falkingham, J. (2014). Joint Technical Commission for Oceanography and Marine Meteorology (JCOMM) Expert Team on Sea Ice (ETSI) Electronic Chart Systems Ice Objects Catalogue, Version 5.2. Approved by the JCOMM Expert Team on Sea Ice at its 5th Meeting.
- Farré, A. B., Stephenson, S. R., Chen, L., Czub, M., Dai, Y., Demchev, D., Efimov, Y., Graczyk, P., Grythe, H., Keil, K., Kivekäs, N., Kumar, N., Liu, N., Matelenok, I., Myksvoll, M., O'Leary, D., Olsen, J., Pavithran, S. A. P., Petersen, E., … Wighting, J. (2014). Commercial Arctic shipping through the Northeast passage: Routes, resources, governance, technology, and infrastructure. Polar Geography, 37(4), 298–324. https://doi.org/10.1080/1088937X.2014.965769
- Fequest, D. (2002). MANICE: Manual of standard procedures for observing and reporting ice conditions. Environment Canada.
- Fetterer, F., Knowles, K., Meier, W., Savoie, M., & Windnagel, A. K. (2017). Sea Ice Index, Version 3. Boulder, CO: NSIDC (National Snow and Ice Data Center). Retrieved January 15, 2019, from https://doi.org/10.7265/N5K072F8
- Gandin, L. S. (1966). Objective analysis of meteorological fields, Leningrad, Gidromet; Jerusalem, Israel Program for Scientific Translation, 1965. https://doi.org/10.1002/qj.49709239320
- Gascard, J. C., Riemann-Campe, K., & Gerdes, R. (2017). Future sea ice conditions and weather forecasts in the Arctic: Implications for Arctic shipping. Ambio, 46, 355–367. https://doi.org/10.1007/s13280-017-0951-5
- gCaptain. (2018, April 12). Researchers Map Seven Years of Arctic shipping. Retrieved January 12, 2019.
- Goessling, H. F., Tietsche, S., Day, J. J., Hawkins, E., & Jung, T. (2016). Predictability of the Arctic sea ice edge. Geophysical Research Letters, 43, 1642–1650. https://doi.org/10.1002/2015GL067232
- Goodwin, H., Sandven, S., & Tangen, H. (2004). ICEMON: Data needs and availability prospectus: Deliverable No.C12. Sea ice monitoring for marine operation safety, climate research, environmental management and resource exploitation in Polar Regions. Global Monitoring for Environmental Services (GMES). ESA ESRIN Contract No. 17060/03/I-IW.
- Granskog, M., Kaartokallio, H., Kuosa, H., Thomas, D. N., & Vainio, J. (2006). Sea ice in the Baltic Sea – A review. Estuarine, Coastal and Shelf Science, 70(1–2), 145–160. https://doi.org/10.1016/j.ecss.2006.06.001
- Granskog, M. A., Rösel, A., Dodd, P. A., Divine, D., Gerland, S., Martma, T., & Leng, M. J. (2017). Snow contribution to first-year and second-year Arctic sea ice mass balance north of Svalbard. Journal of Geophysical Research: Oceans, 122(3), 2539–2549. https://doi.org/10.1002/2016JC012398
- Hamilton, L. C., & Stroeve, J. (2016). 400 predictions: The SEARCH Sea Ice Outlook 2008–2015. Polar Geography, 39(4), 274–287. https://doi.org/10.1080/1088937X.2016.1234518
- Hestenes, M. R., & Stiefel, E. (1952). Methods of conjugate gradients for solving linear systems. Journal of Research of the National Bureau of Standards, 49(6), 409–436. https://doi.org/10.6028/jres.049.044
- Houtekamer, P. L., & Mitchell, H. L. (2001). A sequential ensemble Kalman filter for atmospheric data assimilation. Monthly Weather Review, 129(1), 123–137. https://doi.org/10.1175/1520-0493(2001)129<0123:ASEKFF>2.0.CO;2
- Howell, S., Komarov, A. S., Dabboor, M., Montpetit, B., Brady, M., Scharien, R., Mahmud, M., Nandan, V., Geldsetzer, T., & Yackel, J. (2018). Comparing L- and C-band synthetic aperture radar estimates of sea ice motion over different ice regimes. Remote Sensing of Environment, 204, 380–391. https://doi.org/10.1016/j.rse.2017.10.017
- Hughes, N., & Wagner, P. (2015). Knowledge and forecasts of Sea Ice extent and icebergs - “Barents Sea SE” and “Jan Mayen.” METNO_OED Report 26-20152.
- Humbert, M., & Raspotnik, A. (2012). The future of arctic shipping along the transpolar Sea route. The Arctic Yearbook (pp. 281–307).
- Hwang, B., Wilkinson, J., Maksym, E., Graber, H. C., Schweiger, A., Horvat, C., Perovich, D. K., Arntsen, A. E., Stanton, T. P., Ren, J., & Wadhams, P. (2017). Winter-to-summer transition of Arctic sea ice breakup and floe size distribution in the Beaufort Sea. Elementa Science of the Anthropocene, 5, 40. https://doi.org/10.1525/elementa.232
- Inoue, J. (2008). Application of Aerosondes to melt-pond observations over Arctic sea ice. Journal of Atmospheric and Oceanic Technology, 25, 327–334. doi.org/10.1175/2007JTECHA955.1
- International Maritime Organization. (2014). Resolution MSC.385(94) (adopted on 21 November 2014) International Code For Ships Operating In Polar Waters (Polar Code).
- Itkin, P., Spreen, G., Cheng, B., Doble, M., Girard-Ardhuin, F., Haapala, J., Hughes, N., Kaleschke, L., Nicolaus, M., & Wilkinson, J. (2017). Thin ice and storms: Sea ice deformation from buoy arrays deployed during N-ICE2015. Journal of Geophysical Research: Oceans, 122(6), 4661–4674. https://doi.org/10.1002/2016JC012403
- Jensen, Ø. (2016). The international code for ships operating in Polar waters: Finalization, adoption and law of the sea implications. Arctic Review on Law and Politics, 7(1), 60–82. https://doi.org/10.17585/arctic.v7.236
- Johansson, M., Brekke, C., Spreen, G., & King, J. (2018). X-, C-, and L-band SAR signatures of newly formed sea ice in Arctic leads during winter and spring. Remote Sensing of Environment, 204, 162–180. https://doi.org/10.1016/j.rse.2017.10.032
- Jung, T., Gordon, N. D., Bauer, P., Bromwich, D. H., Chevallier, M., Day, J. J., Dawson, J., Doblas-Reyes, F., Fairall, C., Goessling, H. F., Holland, M., Inoue, J., Iversen, T., Klebe, S., Lemke, P., Losch, M., Makshtas, A., Mills, B., Nurmi, P., … Yang, Q. (2016). Advancing Polar prediction capabilities on daily to seasonal time scales. Bulletin of the American Meteorological Society, 97(9), 1631–1647. https://doi.org/10.1175/BAMS-D-14-00246.1
- Karvonen, J. (2012). Operational SAR-based sea ice drift monitoring over the Baltic Sea. Ocean Science, 8(4), 473–483. https://doi.org/10.5194/os-8-473-2012
- Knol, M., Arbo, P., Duske, P., Gerland, S., Lamers, M., Pavlova, O., Sivle, A. D., & Tronstad, S. (2018). Making the Arctic predictable: The changing information infrastructure of Arctic weather and sea ice services. Polar Geography, 41(4), 279–293. https://doi.org/10.1080/1088937X.2018.1522382
- Korosov, A. A., & Rampal, P. (2017). A combination of feature tracking and pattern matching with optimal parametrization for Sea Ice drift retrieval from SAR data. Remote Sensing, 9(3), 258. https://doi.org/10.3390/rs9030258
- Kosarev, A. N. (2005). Physico-geographical conditions of the Caspian Sea. In A. G. Kostianoy & A. N. Kosarev (Eds.), The Caspian Sea environment: The handbook of environmental chemistry (pp. 5–31). Springer.
- Koubarakis, M., Bereta, K., Bilidas, D., Giannousis, K., Ioannidis, T., Pantazi, D.-A., Stamoulis, G., Haridi, S., Vlassov, V., Bruzzone, L., Paris, C., Eltoft, T., Krämer, T., Charalabidis, A., Karkaletsis, T., Konstantopoulos, S., Dowling, J., Kakantousis, T., Datcu, M., … Fleming, A. (2019, March 26–29). From Copernicus big data to extreme earth analytics [Visionary Paper presentation]. 22nd International Conference on Extending Database Technology (EDBT 2019), Lisbon, Portugal.
- Kubat, I., Sayed, M., Savage, S. B., & Carrieres, T. (2005). An operational model of iceberg drift. International Journal of Offshore and Polar Engineering, 15(2).
- Kubat, I., Sayed, M., Savage, S. B., Carrieres, T., & Crocker, G. (2007, July 1–6). An operational iceberg deterioration model. The 17th International Offshore and Polar Engineering Conference. International Society of Offshore and Polar Engineers, Lisbon, Portugal.
- Kwok, R. (2018). Arctic sea ice thickness, volume, and multiyear ice coverage: Losses and coupled variability (1958–2018). Environmental Research Letters, 13(10), 105005. https://doi.org/10.1088/1748-9326/aae3ec
- Laidler, J., Ford, G., Gough, J., Ikummaq, W., Gagnon, T., Kowal, A., Qrunnut, S., & Irngaut, C. (2009). Travelling and hunting in a changing Arctic: Assessing Inuit vulnerability to sea ice change in Igloolik. Nunavut Climate Change, 94(3–4), 363–397. https://doi.org/10.1007/s10584-008-9512-z
- Lamers, M., Duske, P., & Bets, L. V. (2018). Understanding user needs: A practice-based approach to exploring the role of weather and sea ice services in European Arctic expedition cruising. Polar Geography, 41(4), 262–278. https://doi.org/10.1080/1088937X.2018.1513959
- Lamers, M., Knol, M., Müller, M., Blair, B., Jeuring, J., Rasmussen, T., & Sivle, A. (2018). Enhancing the saliency of climate services for marine mobility sectors in European Arctic seas (SALIENSEAS). Stakeholder Advisory Group Workshop Report. Wageningen University, 28 p.
- Lavergne, T., Sørensen, A. M., Kern, S., Tonboe, R., Notz, D., Aaboe, S., Bell, L., Dybkjær, G., Eastwood, S., Gabarro, C., Heygster, G., Killie, M. A., Brandt Kreiner, M., Lavelle, J., Saldo, R., Sandven, S., & Pedersen, L. T. (2019). Version 2 of the EUMETSAT OSI SAF and ESA CCI sea-ice concentration climate data records. The Cryosphere, 13(1), 49–78. https://doi.org/10.5194/tc-13-49-2019
- Lee, Y. J., Yeong, K. C., & Ewe, H. T. (2017, July 23–28). An inverse model for sea ice physical parameter retrieval using simulated annealing. 2017 IEEE International Geoscience and Remote Sensing Symposium (IGARSS), Fort Worth, TX (pp. 683–686).
- Lindsay, R. W., & Zhang, J. (2006). Assimilation of ice concentration in an ice–ocean model. Journal of Atmospheric and Oceanic Technology, 23(5), 742–749. https://doi.org/10.1175/JTECH1871.1
- Liston, G. E., Polashenski, C., Rösel, A., Itkin, P., King, J., Merkouriadi, I., & Haapala, J. (2018). A distributed snow evolution model for Sea Ice applications (SnowModel). Journal of Geophysical Research: Oceans, 123, 3786–3810. https://doi.org/10.1002/2017JC013706
- Liu, J., Chen, Z., Hu, Y., Zhang, Y., Ding, Y., Cheng, X., Yang, Q., Nerger, L., Spreen, G., Horton, R., Inoue, J., Yang, C., Li, M., & Song, M. (2019). Towards reliable Arctic sea ice prediction using multivariate data assimilation. Science Bulletin, 64(1), 63–72. https://doi.org/10.1016/j.scib.2018.11.018
- Löptien, U., & Axell, L. (2014). Ice and AIS: Ship speed data and sea ice forecasts in the Baltic Sea. The Cryosphere, 8, 2409–2418. https://doi.org/10.5194/tc-8-2409-2014
- Lovecraft, A. L., Meek, C., & Eicken, H. (2013). Connecting scientific observations to stakeholder needs in sea ice social–environmental systems: The institutional geography of northern Alaska. Polar Geography, 36(1–2), 105–125. https://doi.org/10.1080/1088937X.2012.733893
- Marchenko, N. (2012). Russian Arctic Seas: Navigational conditions and accidents, 274 pp. Springer. ISBN 978-3-642-22125-5.
- Marshall, G. J., Stott, P. A., Turner, J., Connolley, W. M., King, J. C., & Lachlan-Cope, T. A. (2004). Causes of exceptional atmospheric circulation changes in the southern Hemisphere. Geophysical Research Letters, 31, L14205. https://doi.org/10.1029/2004GL019952
- Massonnet, F., Fichefet, T., Goosse, H., Bitz, C. M., PhilipponBerthier, G., Holland, M. M., & Barriat, P.-Y. (2012). Constraining projections of summer Arctic sea ice. The Cryosphere, 6(6), 1383–1394. https://doi.org/10.5194/tc-6-1383-2012
- Mazur, A., Wåhlin, A., & Krężel, A. (2017). An object-based SAR image iceberg detection algorithm applied to the Amundsen Sea. Remote Sensing of Environment, 189, 67–83. https://doi.org/10.1016/j.rse.2016.11.013
- McDowell Group. (2017). The ECONOMIC VALUE of Alaska's seafood industry (p. 38). https://www.alaskaseafood.org/wp-content/uploads/2015/10/AK-Seadfood-Impacts-Sep2017-Final-Digital-Copy.pdf
- McFarland, H. (2018). Bering strait: An overview of winter 2018 sea ice conditions. International Arctic Research Center (IARC) and NOAA summary.
- Meier, W., Bhatt, U. S., Walsh, J., Blanchard-Wrigglesworth, E., Wayand, E., Thoman, R., Massonnet, F., Zhang, J., Serreze, W. M., Stroeve, J., Hamilton, L. C., Bitz, C. M., Overland, J. E., Eicken, H., Wiggins, H. V., Wang, M., Bieniek, P., Little, J., Kurths, J., … Stoudt, S. (2018). 2018 Sea ice outlook interim post-season report.
- Meier, W., Fetterer, F., Stewart, J. S., & Helfrich, S. (2015). How do sea-ice concentrations from operational data compare with passive microwave estimates? Implications for improved model evaluations and forecasting. Annals of Glaciology, 56(69), 332–340. https://doi.org/10.3189/2015AoG69A694
- Meier, W., & Stroeve, J. (2008). Comparison of sea-ice extent and ice-edge location estimates from passive microwave and enhanced-resolution scatterometer data. Annals of Glaciology, 48(1), 65–70. https://doi.org/10.3189/172756408784700743
- Melia, N., Haines, K., & Hawkins, E. (2016). Sea ice decline and 21st century trans-Arctic shipping routes. Geophys. Res. Lett, 43(18), 9720–9728. https://doi.org/10.1002/2016GL069315
- Melia, N., Haines, K., Hawkins, E., & Day, J. J. (2017). Towards seasonal Arctic shipping route predictions. Environmental Research Letters, 12(8), Article 084005. https://doi.org/10.1088/1748-9326/aa7a60
- Mironov, Y., Klyachkin, S., Benzeman, V., Adamovich, N., Gorbunov, Y., Egorov, A., Yulin, A., Panov, V., & Frolov, S. (2012). Ice phenomena threatening Arctic shipping (A. Tunik, Ed.), 197 pp. Backbone Publishing. ISBN: 0984786422.
- Montmerle, T. (2018, August). Statement of guidance for high-resolution numerical weather prediction (NWP). World Meteorological Organization, Rolling Review of Requirements and Statements of Guidance, Global Observing System (GOS), IPET-OSDE-3. http://www.wmo.int/pages/prog/www/OSY/GOS-RRR.html
- Moore, G. W. K., Schweiger, A., Zhang, J., & Steele, M. (2018). What caused the remarkable February 2018 north Greenland polynya? Geophysical Research Letters, 45, 13342–13350. https://doi.org/10.1029/2018GL080902
- Morgan, V. I., & Budd, W. F. (1978). The distribution, movement and melt rates of Antarctic icebergs. In A. A. Husseiny (Ed.), Iceberg utilization (pp. 220–228). Pergamon. https://doi.org/10.1016/B978-0-08-022916-4.50025-X
- Mu, L., Yang, Q., Losch, M., Losa, S., Ricker, R., Nerger, L., & Liang, X. (2018). Improving sea ice thickness estimates by assimilating CryoSat-2 and SMOS sea ice thickness data simultaneously: CryoSat-2 and SMOS Sea Ice thickness data assimilation. Quarterly Journal of the Royal Meteorological Society, 144, 529–538. https://doi.org/10.1002/qj.3225
- Nakanowatari, T., Inoue, J., Sato, K., Bertino, L., Xie, J., Matsueda, M., Yamagami, A., Sugimura, T., Yabuki, H., & Otsuka, N. (2018). Medium-range predictability of early summer sea ice thickness distribution in the east Siberian Sea based on the TOPAZ4 ice–ocean data assimilation system. The Cryosphere, 12(6), 2005–2020. https://doi.org/10.5194/tc-12-2005-2018
- NASA Earth Observatory. (2018, March). Shipping responds to Arctic ice decline. Retrieved January 28, 2019.
- National Institute for Occupational Safety and Health (NIOSH). (2017). Commercial fishing fatality summary - Alaska Region.
- Onarheim, I. H., Eldevik, T., Årthun, M., Ingvaldsen, R. B., & Smedsrud, L. H. (2015). Skillful prediction of Barents Sea ice cover. Geophysical Research Letters, 42(13), 5364–5371. https://doi.org/10.1002/2015GL064359
- Organisation for Economic Co-operation and Development. (2018). Shipbuilding market developments, Q2 2018, by C. Steidl, L. Daniel, and C. Yildiran.
- Parkinson, C. L., & Cavalieri, D. J. (2012). Antarctic sea ice variability and trends, 1979–2010. The Cryosphere, 6(4), 871–880. https://doi.org/10.5194/tc-6-871-2012
- Polarview Earth Observation Limited. (2016a). ESA Polaris: User needs and high-level requirements for the next generation of observing systems for the Polar regions. D2.1: Gaps and Impact Analysis Report.
- Polarview Earth Observation Limited. (2016b). ESA Polaris: user needs and high-level requirements for the next generation of observing systems for the Polar regions. Summary Report.
- Power, D., Youden, J., Lane, K., Randell, C., & Flett, D. (2001). Iceberg detection capabilities of RADARSAT synthetic aperture radar. Canadian Journal of Remote Sensing, 27(5), 476–486. https://doi.org/10.1080/07038992.2001.10854888
- Prasad, S., Zakharov, I., McGuire, P., Power, D., & Richard, M. (2018). Estimation of sea ice parameters from sea ice model with assimilated ice concentration and SST. The Cryosphere, 12(12), 3949–3965. https://doi.org/10.5194/tc-12-3949-2018
- Rae, J., Hewitt, H., Keen, A., Ridley, J., West, A., Harris, C., Hunke, E., & Walters, D. (2015). Development of Global Sea Ice 6.0 CICE configuration for the Met Office global coupled model. Geoscientific Model Development Discussions, 8(3), 2529–2554. https://doi.org/10.5194/gmdd-8-2529-2015
- Rampal, P., Bouillon, S., Ólason, E., & Morlighem, M. (2016). neXtSIM: A new Lagrangian sea ice model. The Cryosphere, 10(3), 1055–1073. https://doi.org/10.5194/tc-10-1055-2016
- Remund, Q. P., & Long, D. G. (2003). Large-scale inverse Ku-band backscatter modeling of sea ice. IEEE Transactions on Geoscience and Remote Sensing, 41(8), 1821–1833. https://doi.org/10.1109/TGRS.2003.813495
- Renner, A. H. H., Gerland, S., Haas, C., Spreen, G., Beckers, J. F., Hansen, E., Nicolaus, M., & Goodwin, H. (2014). Evidence of Arctic sea ice thinning from direct observations. Geophysical Research Letters41(14), 5029–5036. https://doi.org/10.1002/2014GL060369
- Rodrigue, J.-P. (2017). The geography of transport systems (4th ed.). Routledge. 440 pages. ISBN 978-1138669574.
- Rommetveit, A. (2017). Iskantdramaet. [The Ice Edge Drama]. yr.no Magazine, 2017-07-01. Retrieved, February 2, 2019, from https://www.yr.no/magasin/iskantdramaet-1.13560889
- Saad, Y., & Schultz, M. H. (1986). GMRES: A generalized minimal residual algorithm for solving nonsymmetric linear systems. SIAM Journal on Scientific Computing, 7(3), 856–869. https://doi.org/10.1137/0907058
- Sakov, P., Counillon, F., Bertino, L., Lisæter, K. A., Oke, P. R., & Korablev, A. (2012). TOPAZ4: an ocean-sea ice data assimilation system for the north Atlantic and Arctic. Ocean Science, 8(4), 633–656. https://doi.org/10.5194/os-8-633-2012
- Sandven, S., Johannessen, O., & Kloster, K. (2006). Sea Ice monitoring by remote sensing. In R. A. Meyers & P. M. Mather (Eds.), Encyclopedia of analytical chemistry. https://doi.org/10.1002/9780470027318.a2320
- Schweiger, A., Lindsay, R., Zhang, J., Steele, M., & Stern, H. (2011). Uncertainty in modeled Arctic sea ice volume. Journal of Geophysical Research, 116, C00D06. https://doi.org/10.1029/2011JC007084
- Schweiger, A., & Zhang, J. (2015). Accuracy of short-term sea ice drift forecasts using a coupled ice-ocean model. JGR Oceans, 120(12), 7827–7841. https://doi.org/10.1002/2015JC011273
- Seina, A., Veijola, K., Berglund, R., Porthin, M., & Walker, N. (2013). Improvement of maritime safety in the Baltic Sea through enhanced situation awareness (ISABELIA). D1: User/Stakeholders overview and User Requirements. ARTES-20 - 9B.015 - AO.7057.
- Shokr, M., & Sinha, N. (2015, April 17). Sea ice: Physics and remote sensing. American Geophysical Union. ISBN:9781119027898.
- SIDARUS. (2011). Sea ice downstream services for Arctic and Antarctic users and stakeholders (SIDARUS). D1.1. User requirement review document. Seventh Framework Programme FP7-SPACE-2010-1 Stimulating the development of downstream GMES Services.
- Singha, S., Johansson, M., Hughes, N., Hvidegaard, S., & Skourup, H. (2018). Arctic Sea ice characterization using spaceborne fully polarimetric L-, C-and X-band SAR with validation by airborne measurements. IEEE Transactions on Geoscience and Remote Sensing, 56(7), 3715–3734. https://doi.org/10.1109/TGRS.2018.2809504
- Smith, L., Agnew, J., & Stephenson, S. (2011). Divergent long-term trajectories of human access to the Arctic. Nature Climate Change, 1(3). https://doi.org/10.1038/nclimate1120
- Smith, L. C., & Stephenson, S. R. (2013). New trans-Arctic shipping routes navigable by mid-century. Proceedings of the National Academy of Sciences, 110(13), E1191–E1195. https://doi.org/10.1073/pnas.1214212110
- Steinberg, P., & Kristoffersen, B. (2017). The ice edge is lost … nature moved it: Mapping ice as state practice in the Canadian and Norwegian north. Transactions (Institute of British Geographers), 42(4), 625–641. https://doi.org/10.1111/tran.12184
- Stroeve, J. C., Crawford, A. D., & Stammerjohn, S. (2016). Using timing of ice retreat to predict timing of fall freeze-up in the Arctic. Geophysical Research Letters, 43(12), 6332–6340. https://doi.org/10.1002/2016GL069314
- Stroeve, J. C., Kattsov, V., Barrett, A., Serreze, M., Pavlova, T., Holland, M., & Meier, W. N. (2012). Trends in Arctic sea ice extent from CMIP5, CMIP3 and observations. Geophysical Research Letters, 39(16), L16502. https://doi.org/10.1029/2012GL052676
- Stroeve, J. C., Markus, T., Boisvert, L., Miller, J., & Barrett, A. (2014). Changes in Arctic melt season and implications for sea ice loss. Geophysical Research Letters, 41(4), 1216–1225. https://doi.org/10.1002/2013GL058951
- Stroeve, J., & Notz, D. (2018). Changing state of Arctic sea ice across all seasons. Environmental Research Letters, 13(10), 1–23. https://doi.org/10.1088/1748-9326/aade56
- Stroeve, J., Schroder, D., Tsamados, M., & Feltham, D. (2018). Warm winter, thin ice? The Cryosphere, 12(5), 1791–1809. https://doi.org/10.5194/tc-12-1791-2018
- Swart, S., Campbell, E. C., Heuze, C. H., Johnson, K., Lieser, J. L., Massom, R., Mazloff, M., Meredith, M., Reid, P., Sallee, J.-B., & Stammerjohn, S. (2018). Return of the Maud rise Polynya: Climate litmus or sea ice anomaly? [in “State of the Climate in 2017”]. Bulletin of the American Meteorological Society, 99(8), S188–S189. https://doi.org/10.1175/2018BAMSStateoftheClimate.1
- Telegraph. (2015, February 12). Ice breaker rushes to free stranded fishing vessel stuck in thick Antarctic ice by J. Pearlman.
- Thomas, M., Geiger, C. A., & Kambhamettu, C. (2008). High resolution (400 m) motion characterization of sea ice using ERS-1 SAR imagery. Cold Regions Science and Technology, 52(2), 207–223. https://doi.org/10.1016/j.coldregions.2007.06.006
- Tsamados, M., Feltham, D. L., Schroeder, D., Flocco, D., Farrell, S. L., Kurtz, N., Laxon, S. W., & Bacon, S. (2014). Impact of variable atmospheric and oceanic form drag on simulations of Arctic sea ice. Journal of Physical Oceanography, 44(5), 1329–1353. https://doi.org/10.1175/JPO-D-13-0215.1
- Turner, J., Phillips, T., Marshall, G. J., Hosking, J. S., Pope, J. O., Bracegirdle, T. J., & Deb, P. (2017). Unprecedented springtime retreat of Antarctic sea ice in 2016. Geophysical Research Letters, 44(13), 6868–6875. https://doi.org/10.1002/2017GL073656
- Ungermann, M., Tremblay, B., Martin, Torge, L., & Losch, M. (2017). Impact of the ice strength formulation on the performance of a sea ice thickness distribution model in the Arctic. Journal of Geophysical Research: Oceans, 122(3), 2090–2107. https://doi.org/10.1002/2016JC012128
- Vancoppenolle, M., Bouillon, S., Fichefet, T., Goosse, H., Lecomte, O., Maqueda, M. A. M., & Madec, G. (2012). The Louvain-la-Neuve sea Ice Model. Note du Pole de mod ^ elisation de l’Institut Pierre-Simon Laplace No 31. ISSN No 1288-1619.
- Wadhams, P. (2000). Ice in the ocean. CRC Press, 364pp., ISBN 9789056992965.
- Wang, K., Debernard, J., Sperrevik, A. K., Isachsen, P. E., & Lavergne, T. (2013). A combined optimal interpolation and nudging scheme to assimilate OSISAF sea-ice concentration into ROMS. Annals of Glaciology, 54(62), 8–12. https://doi.org/10.3189/2013AoG62A138
- Waseda, T., Webb, A., Sato, K., Inoue, J., Kohout, A., Penrose, B., & Penrose, S. (2018). Correlated increase of high ocean waves and winds in the ice-free waters of the Arctic ocean. Scientific Reports, 8(1), 4489. https://doi.org/10.1038/s41598-018-22500-9
- Webster, M., Gerland, S., Holland, M., Hunke, E., Kwok, R., Lecomte, O., Massom, R., Perovich, D., & Sturm, M. (2018). Snow in the changing sea-ice systems. Nature Climate Change, 8(11). https://doi.org/10.1038/s41558-018-0286-7
- World Meteorological Organization. (2015, January 24). -No. 1157. Seventeenth World Meteorological Congress, Geneva 25 May-12 June, 2015. Annex VIII. Annex to paragraph 4.2.6.28. Global Cryosphere Watch (GCW) Implementation Plan, Version 1.6 (pp. 624–654).
- Zampieri, L., Goessling, H., & Jung, T. (2018). Bright Prospects for Arctic Sea Ice prediction on Subseasonal time scales. Geophysical Research Letters, 45(18), 9731–9738. https://doi.org/10.1029/2018GL079394