
ABSTRACT
Shorefast sea ice provides an important platform for winter and spring travel between coastal Arctic communities unconnected by road networks. In the past two decades, local Arctic residents have reported thinning and earlier breakup of shorefast ice. Despite these assertions, however, there are few quantitative assessments of how these changes have impacted travel on sea ice. In this study, we use high-resolution satellite remote sensing and transportation modeling to assess snow mobile travel in Uummannaq Fjord, Greenland. Following classification of satellite imagery, we generate optimal least-cost travel routes according to surface types present in the fjord. We then estimate distance and duration of snowmobile travel potential between communities from 1985 through 2019. We find that snowmobile travel in Uummannaq Fjord has potentially become slower and more unpredictable in recent years (2014–2019) relative to thirty years prior (1985–2000), with greater changes for communities located more proximal to the shorefast ice edge. Our results also suggest that reductions in on-ice snow cover impede snowmobile travel more than fractures do. Overall, our analysis demonstrates how remote sensing and transportation modeling may be used to quantify the community-scale impacts of changing shorefast ice conditions and has potential to help manage localized climate-related risk.
1. Introduction
Most people in Greenland reside in coastal towns and villages, with no permanent roads connecting them. Flying is expensive, intermittent, and weather dependent, so much of the travel between communities takes place on the ocean. During summer, boats are the dominant form of ocean travel but when sea ice forms during winter and spring, snowmobiles and dogsleds become the primary mode of transport for many Arctic coastal communities, providing convenient and inexpensive access to other settlements as well as to hunting and fishing grounds and cultural sites (Gearheard et al., Citation2006, Citation2011; Laidler et al., Citation2009; Mahoney et al., Citation2014; Vahl & Kleemann, Citation2019).
Rapidly warming Arctic surface air temperatures present challenges to on-ice travel. Arctic residents report that sea ice is now thinner, less structurally robust, and breaks up earlier than in previous decades (Baztan et al., Citation2017; Gearheard et al., Citation2006; Huntington, Citation2000; Mahoney et al., Citation2014), reducing the reliability and season length for snowmobile and dogsled travel (Baztan et al., Citation2017; Gearheard et al., Citation2006; Laidler, Citation2006). While some of this travel may be replaced by boats, reductions in on-ice travel threaten the continuity of some traditional activities such as dogsledding, seal hunting and ice fishing which are central to the health, food-security social well-being, and cultural identity of many Arctic peoples (Ford et al., Citation2019; Gearheard et al., Citation2006; George et al., Citation2004; Gibson & Schullinger, Citation1998; Huntington, Citation2000; Laidler, Citation2006; Laidler et al., Citation2009).
Despite its importance for local people, few studies have quantitatively assessed the impacts of climate change on over-ice travel. Most scientific studies of Arctic transport have investigated changes to maritime transportation in response to declining pack ice (Pizzolato et al., Citation2014, Citation2016; Smith & Stephenson, Citation2013; Stephenson et al., Citation2011; Stewart et al., Citation2007). These studies rely on regional ice charts, coarsely gridded satellite data, or climate models to quantify changing sea ice concentration and thickness at the pan-Arctic scale. Yet these products cannot resolve changes in sea ice relevant for local residents, particularly those which occur within narrow fjords and along complex coastlines (Baztan et al., Citation2017; Cooley et al., Citation2020; Huntington, Citation2000; Mahoney et al., Citation2014). Furthermore, Cooley et al. (Citation2020) show that shorefast coastal sea ice near communities is often uncorrelated with broad-scale measures of sea ice extent in the open ocean. The limitations of current sea ice data products at scales relevant to local residents produces a disconnect between scientific and local, customary and Indigenous knowledge (Baztan et al., Citation2017; Ford et al., Citation2019; Huntington, Citation2000; Laidler, Citation2006).
Potential to reduce this disconnect between scientific understanding and local experiences is afforded by high-resolution optical satellite imagery, which can be used to investigate coastal sea ice conditions at a fine spatial scale (Muckenhuber et al., Citation2016). The reflective properties of ice and snow in the visible and near-infrared wavelengths enable detection of key factors that make sea ice suitable for travel. Fractures and leads (which present obstacles to on-ice travel) are easily distinguishable (Yang et al., Citation2019) and fresh snow (which is optimal for on-ice travel) is brighter than bare sea ice (Yang et al., Citation2019). The availability of long-term (∼30 years), high-resolution (∼10 s of meters) archives of optical satellite imagery is now unprecedented, with the NASA series of Landsat satellites providing 30 m spatial resolution imagery since 1979. More recently the European Space Agency's (ESA) Sentinel-2A and -2B satellites launched in 2015 and 2017, respectively, now offer near-daily 10 m spatial resolution optical imagery globally.
In this study, we investigate the use of Landsat and Sentinel optical satellite imagery for quantifying changes in shorefast sea ice conditions and consequent associated on-ice transportation accessibility potential between six communities in Uummannaq Fjord, western Greenland from 1985 through 2019 (). Uummannaq Fjord represents an ideal study site as it exemplifies several sea ice-related challenges affecting Arctic people and their rapidly changing environments. There are no permanent roads between these six communities and many people depend on shorefast ice as a platform for subsistence hunting and fishing, travel between towns, and traditional activities in the season spanning December through June (; Baztan et al., Citation2017). To conduct this investigation, we map and characterize shorefast sea ice surface conditions using Landsat and Sentinel satellite imagery, then combine these data with a least-cost transportation model (Smith & Stephenson, Citation2013; Stephenson et al., Citation2011) to estimate how snowmobile travel distance/duration potentials among Uummannaq Fjord communities have changed over the period 1985–2019.
Figure 1. Uummannaq Fjord and the six communities examined in this study. Uummannaq (population 1255) is the largest community and serves as a regional hub. Background image is a Sentinel-2 NIR image from 19 March 2018. Inset shows the location of Uummannaq Fjord in western Greenland with the location of Sentinel-2 satellite image tiles marked with a red square.
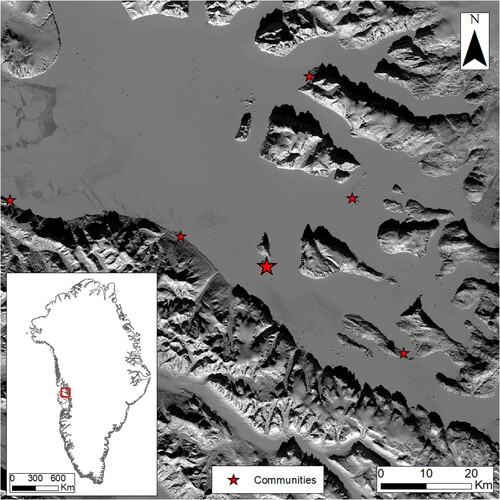
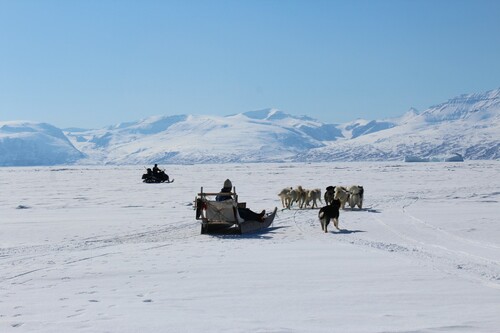
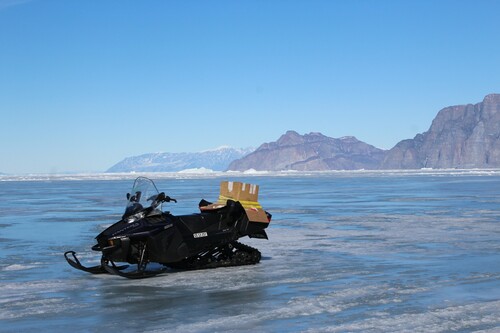
Figure 2. Snowmobiles and dogsleds are common modes of transportation on shorefast ice in Uummannaq Fjord. Here from April 2019. Credit: S.Cooley.
2. Methods and data
2.1. Study area
Uummannaq Fjord has a population of about 2300 inhabitants spread across six communities: Ikerasak, Niaqornat, Qaarsut, Saattut, Ukkusissat, and Uummannaq, with the latter a regional hub where the majority of people in the region live (Baztan et al., Citation2017).
Two additional settlements, Illorsuit and Nuugaatsiaq in the northwest part of the fjord, were previously inhabited but abandoned after being struck by a landslide-triggered tsunami in 2017 (Simonsen, Citation2018). Illorsuit and Nuugaatsiaq were therefore not included in the analysis. Almost all sea ice in Uummannaq Fjord is shorefast, meaning that it is attached to the shoreline and immobile (WMO, Citation2014). Based on visual inspection of satellite images, we found no evidence for drift ice entering the fjord; a finding that was confirmed by local residents in the town of Uummannaq. The only case when drift ice is present in the fjord is when the shorefast ice breaks up into floes which are rapidly exported from the fjord in a matter of days. These floes are dangerous to travel on and very rarely traversed. It is important to note that shorefast ice in Uummannaq Fjord differs from shorefast ice in other regions of the Arctic, such as in Utqiaġvik, Alaska, because it is constrained on three sides by the fjord walls rather than on one side of an exposed coastline. The ice in Uummannaq Fjord is therefore mostly flat, unfractured, and easily accessed from the land. Since shorefast ice is (1) the dominant type of ice present in Uummannaq Fjord and (2) the dominant type of ice used by local people, we use the terms ‘shorefast ice’ and ‘sea ice’ interchangeably hereinafter.
Shorefast ice forms in Uummannaq Fjord each year in November/December, although in some recent years (2011, 2016), as late as February (Cooley et al., Citation2020). The seaward edge of shorefast ice in Uummannaq Fjord varies annually but usually ends approximately 60–70 km west of Uummannaq (Figure S2). During a typical spring, the ice edge retreats episodically until the entire fjord is ice-free, which usually occurs by the end of May (Cooley et al., Citation2020). However, annual surface air temperatures in Uummannaq Fjord warmed by nearly 2°C between 2000 and 2010 (Howat et al., Citation2010) and subsurface ocean temperatures (depth of 150–600 m) increased by 1.6°C between 1995 and 1998 (Holland et al., Citation2008). These changes are corroborated by local residents of Uummannaq Fjord, who have expressed concern about changing ice conditions which are altering their travel routines (Baztan et al., Citation2017).
2.2. Satellite remote sensing
To investigate shorefast sea ice conditions in Uummannaq Fjord, we use Level-1 Top-Of-Atmosphere (TOA) satellite imagery from the Sentinel-2A/B satellites (https://sentinel.esa.int/web/sentinel/missions/sentinel-2), and Level-1 TOA imagery from the Landsat-5, 7 and 8 satellites (https://www.usgs.gov/core-science-systems/nli/landsat) archived with Google's Cloud Storage (https://cloud.google.com/storage/docs/public-datasets/landsat) (Table S1). Sentinel-2 visible to shortwave infrared band data are acquired from two polar-orbiting satellites, Sentinel-2A (launched in June 2015), and Sentinel-2B (launched in March 2017). Due to orbit convergence these two satellites provide near-daily 10 m resolution imagery at 70°N. NASA Landsat images have a coarser spatial (30 m) and temporal resolution (∼16 days) but far longer historical archives spanning 1985 to the present, enabling longer term analysis. The high spatial and spectral resolution of both technologies allow accurate discrimination of snow, ice, and open water within Uummannaq Fjord. While cloud cover renders many images unusable, a total of 130 Landsat-5 (1985–1999), 270 Landsat-7 (1999–2015), 170 Landsat-8 (2013–2015), and 105 Sentinel-2 (2016–2019) images were analyzed in this study, yielding a combined total of 675 Landsat and Sentinel-2 satellite images with less than 50% cloud cover over the period 1985–2019 (see Section 2.3). While Synthetic-Aperture Radar (SAR) data is not compromised by cloud cover and provides high-resolution imagery, optical satellite imagery is more suited for the purpose of this study because it has a longer-term record.
2.3. Satellite data pre-processing and classification
Prior to analysis, all satellite products were re-projected to UTM 22N, screened for cloud cover, and masked to remove terrestrial land areas. We flagged cloud-obscured pixels by applying the Fmask algorithm developed by Zhu and Woodcock (Citation2012), further improved for use with Sentinel-2 by Frantz et al. (Citation2018) with the Cloud Displacement Index (CDI). As is typical for optical satellite imagery in Arctic regions, cloud cover substantially reduced the number of usable images. We therefore excluded images with >50% total cloud cover. We masked land from the images by retaining only those pixels contained within the Greenland Ice Mapping Project (GIMP) ocean mask (Howat et al., Citation2014). We excluded all Landsat-7 images acquired after 2003 due to failure of Landsat-7′s Scan Line Corrector (SLC) sensor.
Sentinel-2 and Landsat image pixels were classified into three surface types (snow, ice, and water) based on reflectance values in the near-infrared (NIR) wavelengths. We used the 843 nm band for Sentinel-2 images and the 760–900 nm, 770–900, and 850–880 nm for the Landsat-5, -7 and -8 images, respectively (a and b), due to the strong reflectance distinction between snow, ice, and water in the near-infrared wavelengths (Hall et al., Citation1995). The threshold values for separating each surface type were determined manually for each image through a frequency analysis of fjord pixel values using histograms of reflectance values. The high spatial resolution of these images allows for an approximate confirmation of surface type reflectance values using the cursor value and visual interpretation. The presence of shadows due to the low angle of the sun early in the season affected histogram values and made it challenging to discriminate snow and ice from water in some cases. As a result, we excluded all February images from further analysis.
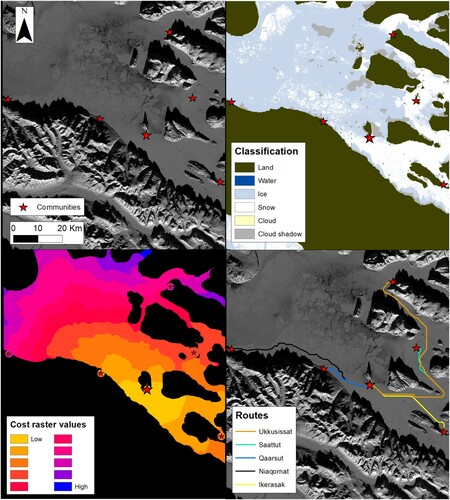
Figure 3. Sentinel-2 image of Uummannaq Fjord on 1 March 2017, displayed as (a) raw NIR band image; (b) classified surface types present in the fjord; (c) modeled cost-distance map illustrating how different surface types and distances influence travel cost between Uummannaq and surrounding communities; (d) optimal least-cost routes generated by the transportation model, showing cheapest (i.e. fastest) routes between Uummannaq and neighboring communities on 1 March 2017.
2.4. Computation of optimal travel route distance and duration
We quantified travel route distance and duration between communities using a least-cost path generation model in ArcMap. The first stage of this process involves assigning a cost value to the different surface types according to the difficulty of travel. Snow pixels were assigned a low value (=1) since snow provides a smooth surface for snowmobile and dogsled travel. Sea ice without snow cover was assigned a slightly higher cost value (=4) than sea ice with snow cover because bare sea ice surface tends to be rougher and requires traveling at a slower speed. All values were chosen based on personal experience of the research team while based in this community in Spring 2019. When traveling on the snowmobile during fieldwork, we found that the same route would take approximately four times longer during bare ice conditions than on snow-covered ice.
Because snowmobile or dogsled travel is not possible in open water, ocean pixels were assigned a null cost value meaning it was impossible for a route to be generated on pixels classified as ocean. Our model does not take into account other physical impediments such as icebergs or pressure ridges which could also increase travel distance and duration. However, while icebergs are present in the fjord, the additional distance required to avoid an iceberg is generally small in comparison to the total route distance. We also found no evidence of pressure ridges in Uummannaq Fjord during fieldwork in 2019, nor in examination of our high-resolution satellite imagery. Finally, in conversations with local people during fieldwork, we learned that traveling near land was usually avoided because shorefast ice immediately along coastal margins tends to be thinner. We therefore applied a buffer of 1 km from the coastline (excluding around communities), to avoid path generation near land, where people are unlikely to travel.
In the second stage, we computed optimal travel routes between Uummannaq and the other, smaller communities in the fjord by minimizing the cost distance and path using the cost distance and cost path tools in ArcGIS version 10.7. The cost distance tool calculates the least-accumulative cost between each pixel and the source feature (in this case the town of Uummannaq) based on the surface type (cost value) of each pixel in the cost raster. This tool also generates a cost back link raster which is a direction raster that identifies the least-cost path to return from any cell to the source. The cost path tool then uses the cost-distance raster in combination with the cost back link raster to generate the time- and distance-optimized path routes from the destinations to the source. Although people also sometimes travel directly between smaller communities, the primary routes are to and from Uummannaq, where the majority of people reside, and the greatest amount of goods and services are available. Finally, we computed distance and duration from the optimal travel route by assigning nominal travel speeds to each pixel value within the generated paths. Based on personal communications with local residents, we assigned nominal travel speeds of 40 km/hr across smooth, snow-covered sea ice and 25 km/hr across rougher, snow-free sea ice.
The described least-cost path generation modeling was applied to 675 classified Landsat-5, -7, -8 and Sentinel-2A, -2B images from 1985 through 2019. Acquisition of optimal travel distances and durations was restricted to the months of March, April, and May due to exclusion of satellite images from February (due to low sun angle, see previous section). Only a handful of routes were retrieved by our model in June, suggesting that sea ice has typically broken up by then, a finding corroborated by Cooley et al. (Citation2020). From personal experience of the research team in the community, we learned that people do sometimes travel in June, however, the lack of sufficient image data prevents us from applying our analysis for this month. Due to time gaps caused by SLC failure in Landsat-7 between 2003 and 2013 and paucity of Landsat-5 images from 1990 to 2000, we focused our analysis on four discrete and relatively data-rich time periods spanning three years each, hereafter termed Period 1 (1988 through 1990), Period 2 (2000 through 2002), Period 3 (2014 through 2016), and Period 4 (2017 through 2019).
3. Results
Our analysis demonstrates that sea ice travel time in Uummannaq Fjord can vary substantially based on ice conditions (Table S2). For example, the mean travel distance to Niaqornat, the furthest community from Uummannaq, is 69 km and takes 1 hr 57 min, on average, by snowmobile. However, the standard deviation (SD) in distance and duration is ±6.6 km and ±23 minutes, respectively, suggesting that the trip often differs by ±10–20% depending on the sea ice conditions. Likewise, travel to/from Ukkusissat, the second furthest from Uummannaq, has a mean distance and duration of 57 km and 1 hr 39 min with a standard deviation of ±9.4 km and ±21 minutes. Statistics for the other communities can be found in Table S2. These findings are consistent with broader large-scale analyses of coastal sea ice adjacent to many Arctic communities which experience large interannual variability in springtime air temperatures and associated sea ice conditions (Cooley et al., Citation2020). While we did not expect our shorefast ice results from within Uummannaq Fjord to be well-correlated with regional drift ice extent (Cooley et al., Citation2020), time series of sea ice extent in Baffin Bay provide useful context of both the large interannual variability in ice extent and also the decadal-scale decline in springtime sea ice (Figure S1).
When averaging across all five communities for all months (mean = 75 min, 44.2 km), we find that travel distance and duration in the two most recent periods (2014–2016 and 2017–2019) were respectively 7 minutes and 0.9 km longer than the two earlier periods (1988–1990 and 2000–2002). Likewise, the variability in travel distance and duration was highest for the two most recent periods in comparison with earlier periods. The standard deviation of travel distance and duration averaged 6.6 km and 17 minutes in the periods 2014–2016 and 2017–2019 but only 4.1 km and 15 minutes in the periods 1988–1990 and 2000–2002. Our results therefore indicate that, over the last five years, travel on sea ice has become slightly more inconvenient and slightly less predictable in comparison to the early 1990s and 2000s.
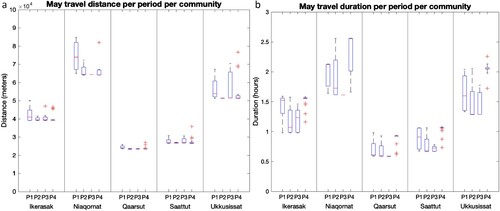
For all communities, we find consistent increases in May travel duration between the period 1988–1990 and the period 2017–2019 (mean increase = 14 min, p = 0.10). According to our results, it averaged 21 minutes longer to travel between Uummannaq and Niaqornat in 2017–2019 than it did in 1988–1990 (p = 0.16). Likewise, it averaged 24 minutes longer to travel from Uummannaq to Ukkusissat between the same time periods (p = 0.10). Interestingly, travel distances do not exhibit the same trends as travel durations.
This suggests that between 1988–1990 and 2017–2019, sea ice travel during May was slowed predominantly by a reduction in snow cover, rather than more ice fractures necessitating longer travel distances. These results are perhaps unsurprising given that the snowmelt-season in Uummannaq Fjord usually begins in May. Our results therefore suggest that earlier melting of winter snow cover on sea ice has somewhat impeded snowmobile travel during our study period.
In contrast, we find no consistent patterns in travel duration for March and April. In March, the period 2000–2002 had the shortest average travel duration and period 2014–2016 had the longest (+6.6 mins), whereas in April the longest average travel duration occurred in the period 1988–1990 and the shortest in the period 2017–2019 (−8.4 mins). However, we note that the difference in travel duration between these periods for these months is relatively small. The lack of appreciable change in travel duration indicates that climate change has likely not substantially impeded snowmobile travel in March and April during our study period.
At the individual community level, we find that settlements distant from Uummannaq have experienced greater changes in sea ice travel distance and duration than proximal communities. Niaqornat, the furthest community from Uummannaq (; 68.5 km), experienced an 18% increase in mean May travel duration between the 1988–1990 and 2017–2019 periods. Our model generated the least number of travel paths for this community, and it commonly lacks viable routes in late spring due to ice disappearance, or in some years, ice not forming at all. Similarly, Ukkusissat, which is the third-nearest community to the ice edge (68 km) and second-furthest from Uummannaq (56.9 km), experienced a 25% increase in mean travel duration during May between the 1988–1990 and 2017–2019 periods. This is likely due to these settlements being located closer to the shorefast ice edge (about 11 and 68 km away for Niaqornat and Ukkusissat, respectively), due to their location in the fjord (). In contrast, Ikerasak, which is located deeper inside the fjord and only 41 km (36 km in aerial distance) from Uummannaq, experienced only minimal changes in travel duration (8%) during our study period. This suggests that on-ice travel connectivity between Uummannaq and Ikerasak may be less vulnerable to changes in sea ice conditions than other, more remote communities in Uummannaq Fjord ().
Figure 4. Box plots summarizing averaged optimal March travel routes for Period 1 (P1, 1988–1990), Period 2 (P2, 2000–2002), Period 3 (P3, 2014–2016), and Period 4 (P4, 2017–2019) for travel between Uummannaq and each of the other communities. (a) travel distance and (b) travel duration. Niaqornat lacks data in Period 3 due to lack of sufficient cloud free satellite imagery, and some scenes not covering this part of the fjord.
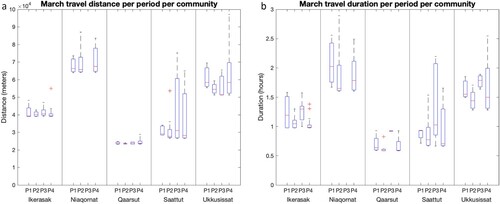
Figure 5. Same as , except for the month of April. (a) April travel distance (b) April travel duration.
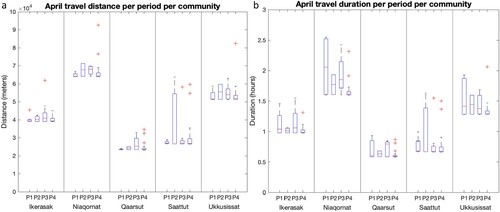
Figure 6. Same as , except for the month of May. (a) May travel distance and (b) May travel duration.
4. Discussion
By combining satellite remote sensing with a least-cost transportation model, we quantify and attribute impediments to on-ice snowmobile travel among Uummannaq Fjord communities over the period 1985–2019. Despite high overall variability in sea ice conditions, we find that snowmobile travel has become both longer and more unpredictable in recent years, particularly during the month of May. These findings suggest that, even over our relatively short study period, climate change has affected access to on-ice snowmobile travel in Uummannaq Fjord.
4.1. Key findings
The observed change in snowmobile accessibility appears to be predominantly due to reduced snow cover, rather than increased opening of fractures. Snow-free sea ice demands slower travel by snowmobile than snow-covered sea ice, and we do not observe many fractures within the Sentinel and Landsat satellite images analyzed here. It is possible that our classification misses fractures narrower than the resolution of the satellite imagery (10–30 m pixel size). However, the dark contrast of water versus ice in near-infrared imagery should still permit sub-pixel detection of open leads, particularly in Sentinel imagery (Yang et al., Citation2019). Furthermore, small fractures (<1–3 m) can be bridged with a sheet of metal/wood or driven over provided the snowmobile maintains sufficient speed. We are confident, therefore, that our remotely sensed observations are broadly representative of local experiences, and we will corroborate this with local residents in future visits to Uummannaq ().
Figure 7. This snowmobile was incapacitated due to overheating on bare shorefast ice in Uummannaq Fjord, May 2019. Lack of snow cover increases difficulty of snowmobile travel over shorefast sea ice. Credit: S. Cooley.
Our analysis finds that communities further from Uummannaq (i.e. Niaqornat and Ukkusissat) have experienced greater changes in snowmobile travel distance and duration than proximal communities (e.g. Ikerasak). Niaqornat is located close to the perennial shorefast ice edge and therefore tends to be affected by breakup earlier in the season than the other communities. Ukkusissat is also closer to the ice edge than other communities, and its access is geographically complex. There are three different ways of getting from Ukkusissat to Uummannaq (d) and the state of the ice and retreat of the ice edge determines which routes are possible to travel. Routes generated in the inner fjord, where ice is likely to persist later, are longer than in the outer fjord, and our estimated least-cost distances and durations change accordingly. For both communities, our modeling suggests that the impacts of climate change on the extent, snow cover, break up, and variability of sea ice may have greater consequences than others if they become increasingly disconnected from Uummannaq in spring, due to earlier seasonal disappearance of shorefast sea ice.
4.2. Limitations
This study is exploratory in nature and has several limitations, both in data availability and in interpretation of community impacts. With regard to data availability, our overall study period (1985–2019) has intermittent sampling gaps due to the relatively long repeat cycles of Landsat satellite orbits (16 days), cloud cover and the SLC failure of Landsat-7 between 2003 and 2013. Almost no satellite images were acquired during this period, and some data-poor gaps also occur during other periods. We mitigated this limitation by defining four shorter study periods for which the most satellite images were acquired, but the remaining gaps are unresolvable. Since 2015, however, this challenge has been greatly reduced by the launch of Sentinel satellites which observe Uummannaq Fjord more frequently. For example, we mapped sea ice conditions 51 times in Period 4 (2017–2019), a three-fold increase in observation capacity over Period 1 (1988–1990). Looking forward, even more frequent monitoring will become available using growing archives of high-resolution CubeSat images (Cooley et al., Citation2019). In general, these growing archives optical satellite imagery, combined with maturing Arctic transportation accessibility models (e.g. Chen et al., Citation2020; Pizzolato et al., Citation2014, Citation2016; Smith & Stephenson, Citation2013; Stephenson et al., Citation2011; Stewart et al., Citation2007), offer a powerful research tool for investigating sea ice travel among remote Arctic communities at local (as well as regional and pan-Arctic) scales.
4.3. Future research
While remote sensing can identify some major factors that determine viability and speed of snowmobile travel (in particular presence of sea ice, snow cover, and fractures) there are other factors which may also be important that are not considered here. Snowmobile travel is dangerous where sea ice is thin, but it is not possible to determine sea ice thickness from optical satellite imagery. The viability of snowmobile travel depends on other environmental conditions such as visibility, wind speed, and air temperature (Ford et al., Citation2019). The choice to travel on ice is also closely intertwined with tolerance of risk and level of experience which differs between individual travelers (Gearheard et al., Citation2006).
While we have yet to collect more qualitative data and quantify how these factors affect viability of on-ice travel, we aim to do so in our future work by incorporating knowledge from local residents (c.f. Ford et al., Citation2019). Furthermore, a reduction in snow cover in the late season could further impact the positive feedback of climate change on ice melting and break-up through decreased albedo. Earlier snow melt in a warming climate would expose the bare ice sooner, which absorbs heat more effectively, leading to a faster and earlier melting and break-up of the ice (Curry et al., Citation1995). This would affect the length of the ice travel season. Finally, while snowmobiles are the dominant form of transport, dog sleds and automobiles are also used for on-ice travel in Uummannaq Fjord. We did not consider these alternate transport modes in our analyses, mainly because we have yet to constrain the travel speeds of automobiles and dog sleds in Uummannaq Fjord.
There are also gaps in our implicit assumptions about the ability to interpret socio-cultural impacts of physical phenomena from satellite images and geospatial modeling. For example, our inference of decreasing community connectivity in westerly communities is complicated by the reality that reduced access to snowmobiles may be compensated by increased boat travel. Snowmobiles and boats have different costs and may require different forms of collaboration to allow access to these forms of travel. On-ice travel and ocean travel vary in convenience and access for travelers, and some subsistence activities, such as seal hunting and ice fishing, are only possible on sea ice. Our findings thus provide only an initial starting point for conversations with local residents to discuss potentially complex relationships between transportation modes, subsistence, and cultural activities. In future work, we hope to explore the interactions of physical sea-ice change with other social, economic, and environmental pressures facing residents of Uummannaq Fjord and other distributed populations in Greenland. These conversations will emphasize personal and joint community experiences of multiple stressors that may influence decisions to stay or leave smaller settlements – and the role climate change-induced changes in sea ice may or may not have in such decisions.
5. Conclusion
This study assessed the viability of snowmobile travel over sea ice in Uummannaq Fjord from 1985 through 2019 by combining satellite remote sensing with a least-cost transportation model (Stephenson et al., Citation2011). On average, we find that travel distance, travel duration, and variability in both metrics were greater in the two most recent study periods (2014–2016 and 2017–2019) than the earliest period (1988–1990). We observe the greatest changes in May, which we attribute to reduced snow cover causing slower snowmobile travel over bare sea ice. Our findings therefore suggest that even over our relatively short study period, climate change has made sea ice travel in Uummannaq Fjord less convenient and more unpredictable. Communities further from Uummannaq and closer to the ice edge that have experienced greater changes in sea ice travel distance and duration than proximal communities. How these changes interact with other stressors is complex and requires further study.
Supplementary_Material
Download MS Word (1.2 MB)Acknowledgements
We are grateful to A. Andreasen, Uummannaq Polar Institute, and the Uummannaq Children's Home for providing lodging and fieldwork support, and to P. Kreutzmann and M. Johansen for sharing local knowledge and for their assistance in the field. This research was classified as exempt by Brown University's Institutional Review Board.
Disclosure statement
No potential conflict of interest was reported by the author(s).
Additional information
Funding
References
- Baztan, J., Cordier, M., Huctin, J., & Zhu, Z. (2017). Life on thin ice: Insights from Uummannaq, Greenland for connecting climate science with Arctic communities. Polar Science, 13, 100–108. https://doi.org/https://doi.org/10.1016/j.polar.2017.05.002
- Chen, J., Kang, S., Chen, C., You, Q., Du, W., Xu, M., Zhong, X., Zhang, W., & Chen, J. (2020). Changes in sea ice and future accessibility along the Arctic Northeast passage. Global and Planetary Change, 195, 103319. https://doi.org/https://doi.org/10.1016/j.gloplacha.2020.103319
- Cooley, S. W., Ryan, J. C., Smith, L. C., Horvat, C., Pearson, B., Dale, B., & Lynch, A. H. (2020). Coldest Canadian Arctic communities face greatest reductions in shorefast sea ice. Nature Climate Change, 10(6), 533–538. https://doi.org/https://doi.org/10.1038/s41558-020-0757-5
- Cooley, S. W., Smith, L. C., Ryan, J. C., Pitcher, L. H., & Pavelsky, T. M. (2019). Arctic-Boreal Lake dynamics revealed using CubeSat imagery. Geophysical Research Letters, 46(4), 2111–2120. https://doi.org/https://doi.org/10.1029/2018GL081584
- Curry, J. A., Schramm, J. L., & Ebert, E. E. (1995). Sea ice-albedo climate feedback mechanism. Journal of Climate, 8(2), 240–247. https://doi.org/https://doi.org/10.1175/1520-0442(1995)008<0240:SIACFM>2.0.CO;2
- Ford, J. D., Clark, D., Pearce, T., Berrang-Ford, L., Copland, L., Dawson, J., New, M., & Harper, S. L. (2019). Changing access to ice, land and water in Arctic communities. Nature Climate Change, 9(4), 335–339. https://doi.org/https://doi.org/10.1038/s41558-019-0435-7
- Frantz, D., Haß, E., Uhl, A., Stoffels, J., & Hill, J. (2018). Improvement of the Fmask algorithm for Sentinel-2 images: Separating clouds from bright surfaces based on parallax effects. Remote Sensing of Environment, 215, 471–481. https://doi.org/https://doi.org/10.1016/j.rse.2018.04.046
- Gearheard, S., Aporta, C., Aipellee, G., & O’Keefe, K. (2011). The Igliniit project: Inuit hunters document life on the trail to map and monitor Arctic change. The Canadian Geographer / Le Géographe Canadien, 55(1), 42–55. https://doi.org/https://doi.org/10.1111/j.1541-0064.2010.00344.x
- Gearheard, S., Matumeak, W., Angutikjuaq, I., Maslanik, J., Huntington, H. P., Leavitt, J., Kagak, D. M., Tigullaraq, G., & Barry, R. G. (2006). “It’s not that simple”: A collaborative comparison of sea ice environments, their uses, observed changes, and adaptations in Barrow, Alaska, USA, and Clyde River, Nunavut, Canada. AMBIO: A Journal of the Human Environment, 35(4), 203–211. https://doi.org/https://doi.org/10.1579/0044-7447(2006)35[203:INTSAC]2.0.CO;2
- George, J. C., Huntington, H., Brewster, K., Eicken, H., Norton, D., & Glenn, R. (2004). Observations on shorefast ice dynamics in Arctic Alaska and the responses of the Iñupiat hunting community. Arctic, 57(4), 363–374. www.jstor.org/stable/40512640. https://doi.org/https://doi.org/10.14430/arctic514
- Gibson, M. A., & Schullinger, S. B. (1998). Answers from the Ice Edge: The consequences of climate change in the Bering and Chukchi Seas. Greenpeace, Arctic Network. 32p.
- Hall, D. K., Riggs, G. A., & Salomonson, V. V. (1995). Development of methods for mapping global snow cover using moderate resolution imaging spectroradiometer data. Remote Sensing of Environment, 54(2), 127–140. https://doi.org/https://doi.org/10.1016/0034-4257(95)00137-P
- Holland, D., Thomas, R., de Young, B., Ribergaard, M. H., & Lyberth, B. (2008). Acceleration of Jakobshavn Isbræ triggered by warm subsurface ocean waters. Nature Geoscience, 1(10), 659–664. https://doi.org/https://doi.org/10.1038/ngeo316
- Howat, I., Box, J., Ahn, Y., Herrington, A., & McFadden, E. (2010). Seasonal variability in the dynamics of marine-terminating outlet glaciers in Greenland. Journal of Glaciology, 56(198), 601–613. https://doi.org/https://doi.org/10.3189/002214310793146232
- Howat, I., Negrete, A., & Smith, B. (2014). The Greenland ice mapping project (GIMP) land classification and surface elevation data sets. The Cryosphere, 8(4), 1509–1518. https://doi.org/https://doi.org/10.5194/tc-8-1509-2014
- Huntington, H. P. (2000). Native observations capture impacts of sea ice changes. Witness the Arctic: Chronicles of the NSF Arctic Sciences Program, 8(1), 1–2. https://www.arcus.org/files/witness-the-arctic/2000/1/pdf/wta2000_v08i01.pdf
- Laidler, G. J. (2006). Inuit and scientific perspectives on the relationship between sea ice and climate change: The ideal complement? Climatic Change, 78(2-4), 407–444. https://doi.org/https://doi.org/10.1007/s10584-006-9064-z
- Laidler, G. J., Ford, J. D., Gough, W. A., Ikummaq, T., Gagnon, A. S., Kowal, S., Qrunnut, K., & Irngaut, C. (2009). Travelling and hunting in a changing Arctic: Assessing Inuit vulnerability to sea ice change in Igloolik, Nunavut. Climatic Change, 94(3-4), 363–397. https://doi.org/https://doi.org/10.1007/s10584-008-9512-z
- Mahoney, A. R., Eicken, H., Gaylord, A. G., & Gens, R. (2014). Landfast sea ice extent in the Chukchi and Beaufort Seas: The annual cycle and decadal variability. Cold Regions Science and Technology, 103, 41–56. https://doi.org/https://doi.org/10.1016/j.coldregions.2014.03.003
- Muckenhuber, S., Nilsen, F., Korosov, A., & Sandven, S. (2016). Sea ice cover in Isfjorden and Hornsund, Svalbard (2000–2014) from remote sensing data. The Cryosphere, 10(1), 149–158. https://doi.org/https://doi.org/10.5194/tc-10-149-2016
- Pizzolato, L., Howell, S. E. L., Dawson, J., Laliberté, F., & Copland, L. (2016). The influence of declining sea ice on shipping activity in the Canadian Arctic. Geophysical Research Letters, 43(23), 12,146–12,154. https://doi.org/https://doi.org/10.1002/2016GL071489
- Pizzolato, L., Howell, S. E. L., Derksen, C., Dawson, J., & Copland, L. (2014). Changing sea ice conditions and marine transportation activity in Canadian Arctic waters between 1990 and 2012. Climatic Change, 123(2), 161–173. https://doi.org/https://doi.org/10.1007/s10584-013-1038-3
- Simonsen, S. (2018). Afgørelsesbreve til borgere fra Illorsuit og Nuugaatsiaq. Naalakkersuisut. Government of Greenland. https://naalakkersuisut.gl/da/Naalakkersuisut/Nyheder/2018/08/2108_agoerelsesbrev.
- Smith, L. C., & Stephenson, S. R. (2013). New trans-Arctic shipping routes navigable by midcentury. Proceedings of the National Academy of Sciences, 110(13), E1191–E1195. https://doi.org/https://doi.org/10.1073/pnas.1214212110
- Stephenson, S., Smith, L., & Agnew, J. (2011). Divergent long-term trajectories of human access to the Arctic. Nature Climate Change, 1(3), 156–160. https://doi.org/https://doi.org/10.1038/nclimate1120
- Stewart, E., Howell, S., Draper, D., Yackel, J., & Tivy, A. (2007). Sea ice in Canada’s Arctic: Implications for cruise tourism. Arctic, 60(4), 370–380. https://doi.org/https://doi.org/10.14430/arctic194
- Vahl, B., & Kleemann, N. (2019). Greenland in figures 2019. Statistics Greenland. http://www.stat.gl/publ/en/GF/2019/pdf/Greenland%20in%20Figures%202019.pdf
- World Meteorological Organization (WMO). (2014). WMO sea-ice nomenclature, terminology, codes and illustrated glossary. WMO No. 259.
- Yang, K., Smith, L. C., Sole, A., Livingstone, S. J., Cheng, X., Chen, Z., & Li, M. (2019). Supraglacial rivers on the northwest Greenland Ice Sheet, Devon Ice Cap, and Barnes Ice Cap mapped using Sentinel-2 imagery. International Journal of Applied Earth Observation and Geoinformation, 78, 1–13. https://doi.org/https://doi.org/10.1016/j.jag.2019.01.008
- Zhu, Z., & Woodcock, C. (2012). Object-based cloud and cloud shadow detection in Landsat imagery. Remote Sensing of Environment, 118, 83–94. https://doi.org/https://doi.org/10.1016/j.rse.2011.10.028