
Abstract
Objectives: The objectives of this study were to evaluate demographic/clinical characteristics and treatment/transportation decisions by emergency medical services (EMS) for patients with hypoglycemia and link EMS activations to patient disposition, outcomes, and costs to the emergency medical system. This evaluation was to identify potential areas where improvements in prehospital healthcare could be made. Methods: This was a retrospective analysis of the National Emergency Medical Services Information System (NEMSIS) registry and three national surveys: Nationwide Emergency Department Sample (NEDS), National Hospital Ambulatory Medical Care Survey (NHAMCS), and Medical Expenditure Panel Survey (MEPS) from 2013, to examine care of hypoglycemia from the prehospital and the emergency department (ED) perspectives. Results: The study estimated 270,945 hypoglycemia EMS incidents from the NEMSIS registry. Treatments were consistent with national guidelines (i.e., oral glucose, intravenous [IV] dextrose, or glucagon), and patients were more likely to be transported to the ED if the incident was in a rural setting or they had other chief concerns related to the pulmonary or cardiovascular system. Use of IV dextrose decreased the likelihood of transportation. Approximately 43% of patients were not transported from the scene. Data from the NEDS survey estimated 258,831 ED admissions for hypoglycemia, and 41% arrived by ambulance. The median ambulance expenditure was $664 ± 98. From the ED, 74% were released. The average ED charge that did not lead to hospital admission was $3106 ± 86. Increased odds of overnight admission included infection and acute renal failure. Conclusions: EMS activations for hypoglycemia are sizeable and yet a considerable proportion of patients are not transported to or are discharged from the ED. Seemingly, these events resolved and were not medically complex. It is possible that implementation and appropriate use of EMS treat-and-release protocols along with utilizing programs to educate patients on hypoglycemia risk factors and emergency preparedness could partially reduce the burden of hypoglycemia to the healthcare system.
Introduction
Community paramedicine programs take healthcare into the patient’s home (Citation1). This expanded role of emergency medical services (EMS) professionals helps to bolster healthcare resources and access for rural communities. It helps urban areas reduce the demand on busy emergency departments (EDs) by proactively providing healthcare and education for those with chronic diseases who frequently end up in the ED (Citation1, Citation2).
Hypoglycemia is a major complication of insulin therapy leading to approximately 100,000 ED visits annually in the United States (US). Documented reasons for these ED visits largely include incorrect insulin dose or type and/or simple human error (i.e., not eating soon after taking a rapid-acting insulin, not adequately adjusting the insulin dose to cover a meal, or confusing a rapid-acting insulin for a long-acting insulin) (Citation3). Hypoglycemia as a complication of insulin therapy is only a subset of all hypoglycemic events, and its impact on the healthcare system is not completely realized by the surveillance of ED visits for adverse drug events only. Parsaik et al. found in a county in Minnesota that hypoglycemia events requesting EMS places significant burden on medical resources (Citation4). Their study found that approximately 5% of all EMS calls were for hypoglycemia. Furthermore, Moffet et al. reported from a county in California that of EMS calls from 2013 to 2015 for hypoglycemia or low blood glucose levels, 13.5% were not transported to the ED presumably because transport was unnecessary (Citation5). Based on an online tool of the National Emergency Medical Services Information System (NEMSIS) database, Moffet et al. also reported that nationally among EMS calls for hypoglycemia as many as 37% were not transported to the ED (Citation5).
National EMS clinical guidelines are available to help guide EMS personnel as to when it is medically appropriate to not transport a patient to the ED after a hypoglycemic event, also called, “treat and release” (Citation6, Citation7). Only two commercial insurance companies, United Healthcare and Anthem, have recently allowed coverage for ambulance “treat and release” encounters (Citation8, Citation9). As healthcare reimbursement is rapidly changing from a volume-based to a value-based model, understanding EMS treatments for hypoglycemia, as well as their reasons for “treat and release” versus transportation to the ED, and finally ED disposition will help inform appropriate EMS policy changes and support growing coverage for these ambulance runs.
To date, there are no population-based studies on EMS activations for hypoglycemia linked to treatment, transportation, disposition in ED, and cost. The purpose of this study is to evaluate demographic/clinical characteristics, treatment, and transportation by EMS for patients with hypoglycemia through a retrospective analysis of the 2013 NEMSIS database and then link those EMS activations to disposition, outcomes, and cost in the ED (using Nationwide Emergency Department Sample [NEDS], Medical Expenditure Panel Survey [MEPS], and National Hospital Ambulatory Medical Care Survey [NHAMCS]) to identify a potential area where improvements in prehospital healthcare could be made through an expanded role of EMS professionals.
Methods
Study Design
This study is a retrospective analysis of the NEMSIS registry and three complex surveys, NEDS, NHAMCS, and MEPS from 2013, to examine hypoglycemia from various perspectives ().
Table 1. Summary of the data sources utilized to study U.S. hypoglycemia in 2013, from EMS, ED, and inpatient information
National Emergency Medical Services Information System
The annual NEMSIS Public-Release Research Dataset provides a uniform national EMS registry to act as a repository for EMS patient-care data in the US. In 2013, 48 states, the District of Columbia, and three territories submitted EMS patient-care reporting information to the NEMSIS national registry (Citation10). It is a valuable resource for evaluating 9-1-1 initiated EMS care in the US and can be used to conduct in-depth descriptions of the care offered to specific populations (Citation11, Citation12).
Using the NEMSIS data, our analysis included the following cohorts:
Three cohorts to capture EMS use of hypoglycemic-related medications, based on the NEMSIS “Medications Given/Recoded” field. As EMS providers report medications using a free-text field, the “Medications Given/Recoded” field corrects spellings and classifies medications into concise groups. Within this study, dextrose denotes when this field indicated Dextrose-50 use (more than 93% of the records). These cohorts were based on National EMS clinical guidelines for hypoglycemia, which indicate that oral glucose should be given if the patient is conscious. If the patient is unconscious, intravenous (IV) dextrose or glucagon should be given with IV dextrose being the first choice:
Oral glucose/None group was defined if “Medication Given/Recoded” included only oral glucose or nothing given
Dextrose group was defined if “Medication Given/Recoded” included dextrose alone or dextrose and oral glucose
Glucagon group was defined if the “Medication Given/Recoded” included glucagon alone, or glucagon and oral glucose, or glucagon and dextrose, or glucagon and oral glucose and dextrose
Two main patient disposition cohorts:
Transport group included subgroups: treated and transported by EMS, treated and transported by law enforcement, treated and transported by private vehicle, treated and transferred care to another EMS unit if the primary role of the initial unit is rescue or transport
No transport group included subgroups: no treatment required, patient refused care, treated and released, treated and transferred care to another EMS unit if the primary role of the initial unit is supervisor or nontransport
Nationwide Emergency Department Sample
NEDS is the largest all-payer ED database in the US, yielding national estimates of ED encounters. The 2013 version of the NEDS includes discharges from 950 hospital-based EDs in 30 states (Citation13) and approximates a 20% stratified sample of US hospital-based EDs. NEDS utilizes records from 1) the Healthcare Cost and Utilization Project (HCUP) State Emergency Department Databases (SEDD), and 2) the State Inpatient Databases (SID). The NEDS includes ED charge information for more than 75% of patients in the sample, including individuals covered by Medicaid, private insurance, and the uninsured.
Two cohorts within NEDS were (1) ED visit in which the patient is treated and released; and (2) ED visit in which the patient is admitted as an inpatient.
National Hospital Ambulatory Medical Care Survey
National Hospital Ambulatory Medical Care Survey (NHAMCS) is another source of ED information, from the Centers for Disease Control (CDC) and their National Center for Health Statistics (NCHS). For the ED component of the survey, findings are based on a nationally representative sample of visits to noninstitutional general and short-stay hospitals, exclusive of federal, military, and Veterans Administration hospitals, located in the 50 states and the District of Columbia. NCHS provides details on the methodology of data collection and processing (Citation14). Although substantially smaller in observed sample size compared to NEDS, NHAMCS provides information such as whether patients arrived by ambulance, and both surveys are designed to be nationally representative.
Medical Expenditure Panel Survey
The Medical Expenditure Panel Survey (MEPS) is a nationally representative household survey of the US civilian noninstitutionalized population sponsored by the Agency for Healthcare Research and Quality. It includes data on medical conditions, health status, health insurance coverage, and healthcare costs and spending. Patients were selected for this study using Clinical Classification Software (CCS) for the International Classification of Diseases, Ninth Revision (ICD-9) values corresponding to “diabetes mellitus without complication” or “diabetes mellitus with complication.” Charges and expenditures for ambulance transport were estimated using ambulance expenses from patients with diabetes, since ambulance expenditures are not assigned ICD-9 codes in MEPS. Expenditures in MEPS correspond to the direct payments for care provided during the year, including out-of-pocket payments and payments by private insurance, Medicaid, Medicare, and other sources (Citation15).
Population and Setting
To study hypoglycemia within the EMS setting, the primary analysis of NEMSIS included all EMS activations in which dispatch recorded a complaint of “diabetic problem” followed by a primary or secondary impression of “diabetic symptoms (hypoglycemia).” In the ED setting, data on any patient using ED and/or hospital services for severe hypoglycemia per the Ginde algorithm were included in analyses (Citation16), as previously demonstrated in NEDS (Citation17) and NHAMCS (Citation18).
Key Outcome Measures
Among hypoglycemic EMS activations in NEMSIS, the analyses focused on two topics: 1) the use of medications such as glucagon, IV dextrose, and other treatments to quantify and understand how EMS personnel treat patients assessed as having hypoglycemia in relation to known EMS clinical guidelines; and 2) patient transport status, such as subsequent transport by emergency responders, transport by personal vehicle, or no transport to evaluate healthcare resource utilization and costs. NEDS provided the opportunity to study factors, such as diagnoses, associated with a hospital inpatient stay rather than being treated and released from the ED. NHAMCS provided estimates of the rate of arriving by ambulance. Finally, MEPS provided expenditure and charge information for ambulances, ED, and hospital inpatient.
Analytical Methods
To estimate the number of events from complex surveys, such as NEDS, NHAMCS, and MEPS, survey weights (each observation is weighted to represent the entire US sample) were used; however, national estimates from the NEMSIS registry utilized a ratio using NHAMCS estimates. To estimate the US 2013 total number of events in NEMSIS, we utilized the ratio of a national count of EMS transports to ED divided by the NEMSIS EMS transports, which is derived by (2013 NHAMCS; 18.9 million patients arrived at hospitals via ambulances) divided by (2013 NEMSIS; 12.6 million patients contained in NEMSIS were treated and transported to hospitals). Therefore, NEMSIS counts were multiplied by this ratio of approximately 1.5006 to provide national estimates, based on the assumption that NEMSIS captured 66.6% (the inverse of the ratio) of the nation’s EMS responses.
Classification and Regression Trees (CART) were used to identify significant, independent variables related to “medication use (glucagon/IV dextrose/others)” as the response/outcome variable (Citation19). Although many classification methods are available, CART was chosen because of its decision-tree nature mimicking the triage process of evaluating patients, its ability to generate optimal cutoffs from both categorical and continuous variables, and its interpretability. The dataset was divided into two groups, one for model building and the other for model validation. If the tree split was generated by the model-building group with Chi-square p < 0.05, and the same split was significant in the model-validation group, then the split was maintained in the final tree. All variables were then included in a multivariable logistic model to evaluate the significance of their adjusted odds ratios (ORs) and to generate 95% confidence intervals (CIs). The multivariable logistic models’ overall performance was quantified using Area Under the Receiver Operating Characteristic (AUROC) curves, ranging from 50% (random classifier) to 100% (perfect accuracy).
Analysis of complex survey designs, such as NEDS, NHAMCS, and MEPS, utilized strata, clusters, and sampling weights for estimation of summary statistics and hypothesis tests. Multivariable logistic regression was performed to assess risk factors for complex survey data.
Summary statistics of continuous variables within the text are presented as mean (or percentage) ± standard error. All calculations utilized SAS version 9.4 (SAS Institute, Inc., Cary, NC, USA).
Results
EMS Responses to 9-1-1 Hypoglycemia Events: Treatment and Disposition
The 9-1-1 events in the primary analysis included 180,561 events (0.8% of all NEMSIS records) dispatched for “diabetes” with primary or secondary provider’s impression of hypoglycemia. The projected national estimate based on NEMSIS coverage would be 270,945 hypoglycemia EMS incidents in 2013. Overall key summary statistics for NEMSIS hypoglycemia are presented in .
Table 2. Summary statistics from NEMSIS and NEDS hypoglycemia patients
EMS documented use of medications by cohort was as follows: oral glucose/none 68.2% (only oral glucose 6.8%; none 61.3%), dextrose 26.2% (only dextrose 24.7%; with oral glucose 1.5%), and glucagon 5.7% (only glucagon 3.5%; with oral glucose 0.9%; with dextrose 1.2%; with both oral glucose and dextrose 0.1%).
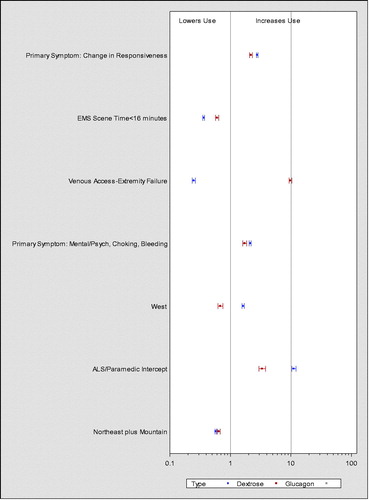
The CART analysis indicated that the initial variable key to medication use (i.e., glucagon, dextrose, or neither) is a certain primary symptom, “change in responsiveness.” All other primary symptoms, such as breathing problems, were less likely to receive glucagon and dextrose. Next in increasing likelihood was that Advanced Life Support (ALS) care (Levels 1 and 2) and Paramedic Intercept were more likely to use glucagon and dextrose than Basic Life Support (BLS). Then, within this group of ALS providers, if there was no failure to venous access an extremity, dextrose was used more often. If there was a failure of venous access to an extremity, glucagon increased in likelihood of use.
These results are echoed in the adjusted ORs of the multivariable logistic regression model (), in which the odds of glucagon and dextrose use both increased with “change in responsiveness” as primary symptom, ALS/Paramedic Intercept, a group of other primary symptoms (Mental/Psych, Choking, and Bleeding) selected by CART, and EMS scene times >16 minutes. Two US regions were associated with lower odds of both glucagon and IV dextrose use, the Northeast and Mountain. The main distinguishing difference between the odds of glucagon use versus the odds of dextrose use was the failure of an extremity venous access, which increased the odds of glucagon use (OR = 9.9; 95% CI, 9.4–10.4), but decreased the odds of dextrose use (OR = 0.25; 95% CI, 0.23–0.27). In addition, dextrose use odds were greater in the West region of the US (OR = 1.6; 95% CI, 1.6–1.7), but lower odds for glucagon use (OR = 0.68; 95% CI, 0.62–0.75). The AUROCs for multivariable logistic models were 75.7% for glucagon and 77.3% for the dextrose model.
Figure 1. Odds ratios and 95% confidence intervals from two multivariable logistic regression models: Emergency medical services (EMS) use of (1) glucagon and (2) dextrose in National Emergency Medical Services Information System (NEMSIS) 2013.
The next focus among the EMS hypoglycemia sample was comparing patients who required transportation compared with those who did not (). Those classified as transported include Treated/Transported by EMS (53.5%), Treated/Transported by Law Enforcement (0.05%), Treated/Transported by Private Vehicle (0.1%), Treated, Transferred Care to another EMS Unit (Rescue or Transport; 2.8%). The nontransported group include No Treatment Required (3.1%), Patient Refused Care (17.7%), Treated and Released (20.0%), and Treated, Transferred Care to another EMS Unit (Nontransport or Supervisor; 2.3%).
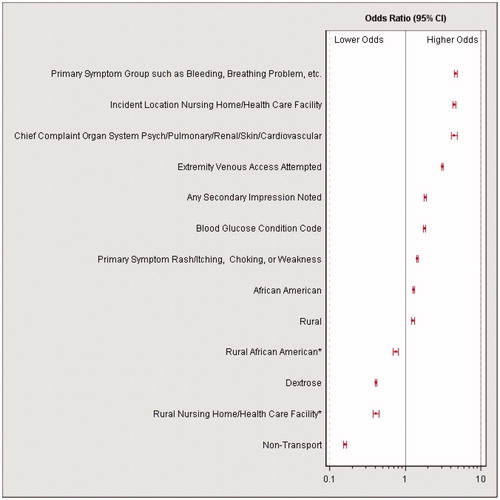
The initial variable in CART to discriminate transported and nontransported patients was based on primary symptoms. Those with the primary symptoms of Bleeding, Breathing Problem, Device/Equipment Problem, Diarrhea, Drainage/Discharge, Fever, Malaise, Mass/Lesion, Nausea/Vomiting, Pain, Palpitations, Swelling, or Wound were transported at a very high rate of 84.2%. When the primary symptoms were Rash/Itching, Choking, Weakness, Mental/Psych, Change in responsiveness, or None, 53.8% were transported. In the multivariable logistic regression (), the three factors with the largest odds of transport were the primary symptoms combined by CART as noted above with the transport rate of 84.2%; OR = 4.6; 95% CI, 4.4–4.8), whether the location included Non-Rural Nursing Homes (OR = 4.4; 95% CI, 4.2–4.7), and if chief concern organ system was Psych, Pulmonary, Renal, Skin, or Cardiovascular (which were combined by CART; OR = 4.4; 95% CI, 4.0–4.9). Two variables decreased the odds of transport significantly, dextrose use (OR = 0.41, 95% CI, 0.40–0.42) and primary unit role of nontransport (OR = 0.16; 95% CI, 0.15–0.17). After adjusting for interactions and other risk factors, the overall effect of rural setting increased odds of transport (OR = 1.3; 95% CI, 1.2–1.3). The AUROC for the multivariable logistic models for transport was 75.7%.
Figure 2. Odds ratios and 95% confidence intervals from a multivariable logistic regression model to assess odds of emergency medical services (EMS) transport in National Emergency Medical Services Information System (NEMSIS) 2013. *CART indicated two significant interactions, rural African Americans and Rural Nursing Home/Health Care Facility.
Emergency Department Visits for Hypoglycemia and Disposition
Based on the NEDS, there was an estimated 258,831 ED admissions for hypoglycemia in 2013. NHAMCS estimated that 41.1% ± 8.2% arrived by ambulance or approximately 106,303 applied that fraction to the NEDS values. By comparison with NHAMCS, NEMSIS sample size of EMS events transported to the hospital, extrapolated to the entire nation would be 137,195 (Destination of “Hospital” for n = 91,428, multiplied by the extrapolation fraction).
Within NEDS, of the patients with hypoglycemia in the ED, 0.02% ± 0.007% died in the ED, and 0.23% ± 0.02% died in the hospital. Of the remaining patients, 73.7% ± 0.6% were treated and released, 24.9% ± 0.6% admitted to the same hospital, 1.2% ± 0.09% transferred to another short-term hospital, and 0.1% ± 0.03% were not admitted, destination unknown.
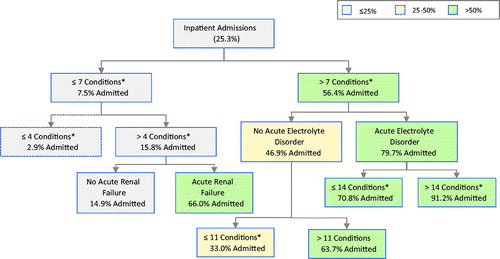
Initially, the two groups of interest in NEDS, ED “treated and released” vs. “admitted to the same hospital” are presented (). CART analyses indicated the important role of “number of conditions” in influencing whether or not a hypoglycemic patient was admitted to the hospital (). Number of conditions is a count of the number of both acute and chronic comorbidities documented at the time of the ED hypoglycemia event, based on the CCS classification system of ICD-9 codes. Among patients with seven or fewer conditions, hospital admission rate was only 7.5% ± 0.4%, whereas those with eight or more conditions have 56.4% ± 1.3% chance of admission. Within the low hospital admission risk group with seven or fewer conditions, 66.0% ± 3.7% were admitted within a subgroup of five or more conditions if one of the conditions is acute renal failure. The subgroup with the highest hospital admission rate was one with more than 14 conditions, of which one was acute fluid and electrolyte disorders, with an admission rate of 91.2% ± 0.8%. As number of conditions increased in patients with hypoglycemia, the probability of hospital admission increased. If short-term conditions are not included in this count, as the number of long-term conditions increased, the rates of hospital admission increased with a steeper slope and plateaued at about 10 long-term conditions.
Figure 3. Classification tree from Nationwide Emergency Departments (NEDS) to identify emergency department (ED) hypoglycemia patients that are admitted to the hospital, rather than treated and released. *Number of Conditions is the total number of acute and chronic conditions coded.
The multivariable logistic model reflected the role of the number of short- and long-term conditions, indicating that for each number of conditions added, the adjusted odds of being admitted increased 20% (OR = 1.2; 95% CI, 1.16–1.25). If the conditions were long term, the odds increased another 18% beyond this per long-term condition (OR = 1.2; 95% CI, 1.1–1.3). Some specific conditions increased the odds of hospital admission beyond the counts, including acute bacterial infection/unspecified site (OR = 7.7; 95% CI, 5.7–10.5), acute and unspecified renal failure (OR = 5.8; 95% CI, 4.7–7.1), acute fluid and electrolyte disorders (OR = 4.1; 95% CI, 3.7–4.6), and chronic deficiency and other anemia (OR = 3.1; 95% CI, 2.5–3.8). Total number of “E codes” (the ICD-9-Clinical Modification [CM] supplemental section to describe the external causes of injuries and poisonings) did not increase chances of admission, but the specific E code, “adverse effects of medical drugs,” did increase the odds (OR = 2.2; 95% CI, 1.9–2.5) and the variable “injury by poisoning” also increased the odds of admission (OR = 2.2; 95% CI, 1.9–2.6). In the multivariable model, chronic kidney disease (CKD) reduced the odds of admission, (OR = 0.87; 95% CI, 0.78–0.97), but in univariate analyses without adjusting for other factors, CKD was associated with higher odds. Therefore, CKD, after adjusting for overall number of long-term and non-long-term conditions, may have less impact on admission than other chronic conditions. Lastly, the primary ICD-9 code for “primary hypoglycemia, unspecified” was rarely used (4.1% of hypoglycemia cases), but when it was used, the odds of admission were reduced (OR = 0.06; 95% CI, 0.04–0.09) compared to the other primary codes such as the commonly used “Diabetes with other specified manifestations.” The AUROC for the multivariable model for inpatient stay was 90.7%.
Although MEPS does not have the specificity to define hypoglycemia events, MEPS can provide high-level estimates of prevalence, expenditures, and charges. Based on MEPS, 25,664,185 ± 799,523 noninstitutionalized individuals had diagnosed diabetes in 2013. Of these, 821,764 ± 125,679 (3.2% ± 0.5%) patients experienced ambulance expenditures. The estimated number of patients who experienced both ambulance expenditures and ED expenditures was 65,697 ± 25,170 (0.26% ± 0.10%) in 2013.
Of patients with diabetes in MEPS who used ambulances in 2013, the average ambulance expenditure was $1244 ± $324, with a median of $664 ± $98 (). These are ambulance expenditures for any reason for patients with diabetes. If patients had an ED event for diabetes during 2013, their ambulance transport expenditure averaged $3706 ± $2814, with a median of $814 ± $301.
Table 3. MEPS and NEDS estimates of 2013 charges and expenditures for ambulances, ED events, and subsequent inpatient stays for hypoglycemia or diabetes related events
Regarding ED use, MEPS estimates that 456,148 ± 71,783 (1.8% ± 0.3%) of patients with diabetes had at least one ED visit with a primary reason related to diabetes in 2013, with or without ambulance transport. Of these, MEPS estimates that 65,905 ± 34,174, or 0.26% ± 0.13% of all those with diabetes, had multiple diabetes-related ED visits in 2013. Utilizing NEDS hypoglycemia events in the ED, the average facility charges for an hypoglycemia ED event that did not lead to a hospital admission was $3106 ± $86, whereas the facility charges for hypoglycemia events that lead to a hospital admission averaged $2041 ± $77 in the ED, and $25,963 ± $722 for the combined ED and inpatient facility charges, or an 8-fold increase over nonadmission hypoglycemia ED visits. MEPS analysis of diabetes-related ED visits indicate an additional physician charge of $425 ± $73 for nonadmission ED events. If patients were admitted to the hospital, MEPS physician charges averaged $587 ± $119 in the ED and $401 ± $175 for inpatient stays.
Discussion
This study evaluated patient characteristics, treatment, and transport by EMS for hypoglycemia using NEMSIS, and then utilized nationally representative databases that focus on EDs and their inpatient admissions to understand disposition and outcome, as well as cost after treatment in the ED. The findings indicate that management of hypoglycemia by EMS is in line with national EMS clinical guidelines (National Model EMS Clinical Guidelines Version 2.0, i.e., largely oral glucose, or IV dextrose, and if an IV is not accessible, glucagon).
Reasons for nontransport reveal that the hypoglycemic event was likely treated successfully on-site with dextrose or glucagon and that a patient did not have other symptoms that would need further evaluation in the ED or warrant hospitalization for an acute medical event or exacerbation of an existing comorbidity. A rural setting led to an increased likelihood of transport which is likely the “rural paramedic paradox,” whereby paramedics are least available in the rural communities where they may be most needed (Citation20, Citation21).
The NEDS data indicate that a majority of patients in the ED for hypoglycemia are released from the ED and are not admitted solely for hypoglycemia but for hypoglycemia in combination with multiple varied acute conditions.
Diabetic emergencies (i.e., both hypoglycemia and hyperglycemia) constitute 3 to 4% of EMS activations (Citation22). Hypoglycemia is the most common diabetic emergency (Citation17). Considering the MEPS and NEDS estimates on costs of facilities and nonadmission physician charges, diabetic emergencies, specifically hypoglycemia, are associated with considerable resource use that has a significant economic burden.
This study sought to identify the characteristics of those patients who required admission or additional services in the ED in an attempt to help identify those patients whom EMS could safely treat and release. In 2003, Lerner et al. reported a prospective study that evaluated a structured treat-and-release protocol for patients with hypoglycemia treated by paramedics (Citation23). The study observed 36 patients representing 38 events. No complications were reported after discharge for 35 (92%) of the events; 2 patients developed recurrent hypoglycemia but did not require further emergency care. The authors concluded that patients with uncomplicated hypoglycemic events can be treated successfully by paramedics and released.
According to the National Association of EMS physicians (Citation24), “When EMS systems that possess adequate educational, medical direction, and quality improvement resources choose to implement EMS-initiated non-transport policies (including, but not limited to, treat-and-release protocols, termination of resuscitation, or on-site care for mass gatherings), third-party payers should consider the relative cost savings associated with providing on-scene care without subsequent transport, and provide fair and reasonable reimbursement for those services.” To date of this writing, only two commercial payers provide reimbursement for ambulance response and treatment, no transport.
The evolution of EMS from a reactive entity to a proactive practice (i.e., interacting with patients before they become acutely symptomatic and need to call 9-1-1) of educating the community about hypoglycemia prevention, risk factors, symptom recognition, and treatment is a possibility. This proactive approach together with growth of community paramedicine represents an opportunity to decrease the economic burden of diabetic emergencies. Community paramedicine and mobile integrated healthcare represent a progressive evolution in the delivery of community-based care that allows role expansion of EMS providers through the use of non-emergent resources in the prehospital setting. Community paramedicine EMS professionals can provide medical assessment and preventive healthcare education tailored to the medical needs of the patient while connecting them with appropriate social services resources.
Limitations
The National NEMSIS database represents a registry of EMS activations, rather than a registry of patients receiving care. This is particularly true since multiple emergency resources may respond to the same 9-1-1 call and submit a patient care report to the NEMSIS repository. The other national datasets utilized in this study are patient-based (MEPS) or ED event-based (NEDS and NHAMCS). This difference in dataset focus does not affect the integrity of the study since each dataset was analyzed separately, and NEMSIS queries focused on data within each record (e.g., oral glucose administered within a record). Although NEMSIS data are very complete for some variables, missing data and use of null values occur more often for others (Citation11). NEMSIS also does not take into consideration data held within the EMS narrative and, for example, where no treatment was coded does not necessarily mean that treatment was not given but rather a possible limitation of improper documentation. Predictive ability, as measured by AUROCs, ranged between 75 and 78% for NEMSIS results, midway between random and perfect prediction. NEMSIS data does not include comorbidities, which contribute so much to the predictive ability. However, extensive information about the patient’s comorbidities may be limited during an emergency encounter. NEDS does not provide individual identification variables; therefore, individuals may appear multiple times in the database, which cannot be accounted for in the analysis. Although the complex survey design attempts to adjust for potential biases, MEPS and NHAMCS have household and institutional nonresponse/participation of those selected for study inclusion and involve smaller sample sizes than NEMSIS and NEDS. Multicollinearity among the independent variables exists, but the datasets used for modeling (NEMSIS and NEDS) have large sample sizes that generally ameliorate this statistical issue.
Although the four data sources used in this study cover US hypoglycemia health care from EMS to ED to inpatient care, these data each represent different stages of the process and do not follow the patients from EMS activation through to hospital utilization. The financial information available from each data source also differs, in that NEMSIS and NHAMCS do not provide such, NEDS provides charges but not a cost to charge ratio, and MEPS provides both charges and expenditures, but does not provide ICD-9 coding for ambulance events. Therefore, we cannot provide MEPS ambulance financial metrics to allow specificity that they are clearly related to the patients treated by EMS for hypoglycemia events.
Conclusion
EMS activations for hypoglycemia are common, about one every 2 minutes in the US, as estimated by NEMSIS. Hypoglycemia events are appropriately managed by EMS providers in a manner consistent with established National Model EMS Clinical Guidelines. More than 40% of patients were treated and released at the scene and more than 70% were ultimately released from the ED. The median charges from ambulance to ED range from approximately $900 to near $3000 per call. There is an opportunity here to substantially reduce the economic burden of hypoglycemia and improve health outcomes.
References
- Minnesota Department of Health Office of Rural Health and Primary Care Emerging Professions Program. Community paramedic toolkit. December 2016 [accessed 18 June 2018]. http://www.health.state.mn.us/divs/orhpc/workforce/emerging/cp/2016cptoolkit.pdf.
- U.S. Department of Health and Human Services Health Resources and Services Administration Office of Rural Health Policy. Community paramedicine evaluation tool. March 2012 [accessed 18 June 2018]. https://www.hrsa.gov/sites/default/files/ruralhealth/pdf/paramedicevaltool.pdf.
- Geller AI, Shehab N, Lovegrove MC, Kegler SR, Weidenbach KN, Ryan GJ, Budnitz DS. National estimates of insulin-related hypoglycemia and errors leading to emergency department visits and hospitalizations. JAMA Intern Med. 2014;174(5):678–86. DOIhttps://doi.org/10.1001/jamainternmed.2014.136.
- Parsaik AK, Carter RE, Pattan V, Myers LA, Kumar H, Smith SA, Russi CS, Levine JA, Basu A, Kudva YC. Population-based study of severe hypoglycemia requiring emergency medical service assistance reveals unique findings. J Diabetes Sci Technol. 2012;6(1):65–73.
- Moffet HH, Warton EM, Siegel L, Sporer K, Lipska KJ, Karter AJ. Hypoglycemia patients and transport by EMS in Alameda County, 2013-15. Prehosp Emerg Care. 2017;21(6):767–72.
- National Model EMS Clinical Guidelines. Version 2.0. September 2017. NASEMSO Medical Directors Council. [accessed 24 May 2018]. https://nasemso.org/documents/National-Model-EMS-Clinical-Guidelines-2017-Distribution-Version-05Oct2017.pdf.
- Medicare Benefit Policy Manual. Chapter 10: Ambulance Services. [accessed 24 May 2018]. https://www.cms.gov/Regulations-and-Guidance/Guidance/Manuals/downloads/bp102c10.pdf.
- Ambulance Services. UnitedHealthcare® Commercial Coverage Determination Guideline. [accessed 24 May 2018]. https://www.uhcprovider.com/content/dam/provider/docs/public/policies/comm-medical-drug/ambulance-services.pdf.
- Erich E. ‘The Moment We’ve Been Waiting For’: Anthem to Compensate EMS Care Without Transport. Oct 20, 2017 [accessed 24 May 2018]. https://www.emsworld.com/news/218925/moment-weve-been-waiting-anthem-compensate-ems-care-without-transport?utm_source=SLNL-0-48465-289062-&utm_medium=email&utm_campaign=SLNL-0-48465-289062-.
- Dawson DE. National emergency medical services information system (NEMSIS). Prehosp Emerg Care. 2006;10(3):314–16.
- Mann NC, Kane L, Dai M, Jacobson K. Description of the 2012 NEMSIS public-release research dataset. Prehosp Emerg Care. 2015;19(2):232–40.
- Tataris KL, Mercer MP, Govindarajan P. Prehospital aspirin administration for acute coronary syndrome (ACS) in the USA: an EMS quality assessment using the NEMSIS 2011 database. Emerg Med J. 2015;32(11):876–81.
- Agency for Healthcare Research and Quality. NEDS Database Documentation. Healthcare Cost and Utilization Project (HCUP). March 2017. www.hcup-us.ahrq.gov/db/nation/neds/nedsdbdocumentation.jsp.
- Centers for Disease Control and Prevention: National Center for Health Statistics. Ambulatory Health Care Data: Questionnaires, Datasets, and Related Documentation. 2018. http://www.cdc.gov/nchs/ahcd/ahcd_questionnaires.htm.
- Agency for Healthcare Research and Quality. Medical Expenditure Panel Survey [article online]. 2012 [accessed 24 May 2018]. http://meps.ahrq.gov/mepsweb.
- Ginde AA, Blanc PG, Lieberman RM, Camargo CA. Validation of ICD-9-CM coding algorithm for improved identification of hypoglycemia visits. BMC Endocr Disord. 2008;8(1):4.
- Wang J, Geiss LS, Williams DE, Gregg EW. Trends in emergency department visit rates for hypoglycemia and hyperglycemic crisis among adults with diabetes, United States, 2006-2011. PloS One. 2015;10(8):e0134917.
- Ginde AA, Espinola JA, Camargo CA. Trends and disparities in U.S. emergency department visits for hypoglycemia, 1993-2005. Diabetes Care. 2008;31(3):511–13.
- Breiman L, Friedman JH, Olshen RA, Stone CJ. Classification and regression trees. Belmont, CA: Wadsworth International Group; 1984.
- Rowley TD. Solving the paramedic paradox. Rural Health News. 2001;8(3):1–6.
- Patterson DG, Skillman SM, Fordyce MA. Prehospital Emergency Medical Services in rural areas: results from a survey in nine states. Final report #149. Seattle, WA: WWAMI Rural Health Research Center, University of Washington, August 2015 [accessed 18 June 2018]. https://depts.washington.edu/uwrhrc/uploads/RHRC_FR149_Patterson.pdf.
- Maggiore WA. Recognizing & treating hypoglycemia, hyperglycemia & other diabetes-related health problems. J Emerg Med Services. 2013;38:12. [accessed 24 May 2018]. http://www.jems.com/articles/print/volume-38/issue-12/features/recognizing-treating-hypoglycemia-hyperg.html.
- Lerner EB, Billittier AJ 4th, Lance DR, Janicke DM, Teuscher JA. Can paramedics safely treat and discharge hypoglycemic patients in the field? Am J Emerg Med. 2003;21(2):115–20.
- National Association of EMS Physicians. Reimbursement for EMS response, medical care, and transport. Prehosp Emerg Care. 2011;15(4):545.