
Abstract
Introduction: The quality of an Emergency Medical Technician (EMT) or paramedic training program is likely one factor that contributes to a candidate’s success on the National Registry Cognitive Examination. However, program pass rates and their associated geographic location have not previously been evaluated. Our objective was to evaluate the performance of EMT and paramedic programs in the United States, pass rates on the National Registry Cognitive Examinations, and relationship to geography.
Methods: We conducted a cross-sectional evaluation of EMT and paramedic programs’ first and cumulative third attempt pass rates on the National Registry Cognitive Examination in 2015. Included were civilian EMT and paramedic programs with >5 graduates testing for certification. Descriptive statistics were calculated for program pass rates, total graduates testing, and pass rates by National Association of State EMS Officials (NASEMSO) regions.
Results: We included 1,939 EMT programs (6–1,892 graduates testing/program) and 602 paramedic programs (6–689 graduates testing/program). We excluded 262 (11.9%) EMT and 51 (7.8%) paramedic programs with ≤5 graduates testing annually due to unstable estimates of program pass rates. EMT programs in the highest quartile for total number of graduates testing outperformed the lowest quartile in both first attempt (65.7% vs. 61.9%, p < 0.001) and cumulative third attempt pass rates (79.1% vs 72.7%, p < 0.001). This difference was also seen for paramedic programs on first attempt (77.3% vs. 62.5%, p < 0.001) and cumulative third attempt (91.9% vs. 76.9%, p < 0.001). EMT program pass rates for first and cumulative third attempts also varied by NASEMSO region (first: 62–68%; third: 74–78%) with the Great Lakes and West regions outperforming the other regions. Paramedic program pass rates differed by NASEMSO regions as well (first: 65–83%; third: 81–95%) with highest pass rates in the West region.
Conclusions Program performance for both EMT and paramedic programs varies by total number of graduates testing and geographic location. Graduates from larger EMT and paramedic programs have higher first and cumulative third attempt pass rates compared to graduates from smaller programs. Additionally, there is variability in program pass rates across NASEMSO regions for both certification levels. Further evaluation is necessary to better understand the variability in program performance in the United States.
Introduction
The Emergency Medical Services (EMS) system within the United States is designed to facilitate life-saving medical care for patients suffering from a multitude of serious illnesses and injuries (Citation1). In order to deliver high-quality prehospital care, EMS providers must be knowledgeable in the identification and treatment of a wide variety of disease processes and have the critical thinking skills needed for time-sensitive situations (Citation2, Citation3). An individual provider can pursue EMS certification at multiple levels with the majority of EMS providers practicing at the emergency medical technician (EMT) and paramedic levels (Citation4). Since both groups of clinicians represent the first contact for emergency medical care in the United States, it is essential that candidates seeking EMS certification are well prepared by their educational programs for these responsibilities.
There are no direct measures to assess EMT and paramedic program quality, and it is therefore unclear how well these programs prepare their graduates to take on the responsibilities of clinical care. Several evaluations have examined the manner in which programs can enhance the quality of recruitment and training at both the EMT and paramedic levels (Citation5–9). However, no study has specifically identified the metrics that should be used to describe program quality. For that reason, previous attempts to assess program performance and quality have predominantly relied on self-reported metrics such as retention rates, certification pass rates, and successful program completion (Citation8–11). As a surrogate, the Committee on Accreditation of Educational Programs for the EMS Professions (CoAEMSP) utilizes self-reported program retention rates as well as program pass rates on the National Registry Paramedic Cognitive Examination as part of their evaluation of paramedic programs (Citation12). However, these self-reported measures are problematic since an innate conflict of interest may exist. Thus, an external benchmark for program performance is important for transparent measurement of success. One option is to avoid self-reported data and use the National Registry Cognitive Examinations data itself. The National Registry Cognitive Examinations are externally validated standards that define minimal competency of graduates at the EMT and paramedic levels and have been evaluated and accredited by the National Commission for Certifying Agencies (NCCA), the accreditation body of the Institute for Credentialing Excellence (ICE) (Citation13). Assessing performance on this industry standard may be an appropriate first step to evaluating program quality for these certification levels (Citation14, Citation15).
To better understand the overall preparation of EMS certification candidates in the United States, we describe program pass rates for EMT and paramedic programs. Specifically, our objective was to describe program success, as defined by first and cumulative third attempt pass rates on the National Registry Cognitive Examinations, and their association to program class size and geographic location.
Methods
Study Design, Setting and Population
This was a cross-sectional study of program performance on the National Registry Cognitive Examinations for the EMT and paramedic levels for the class of 2015. The National Registry database was queried for the results of all EMT and paramedic candidates who graduated from an initial education program in 2015 and subsequently attempted the National Registry Cognitive Examinations between January 1, 2015 and December 31, 2017. This period was chosen to include the two-year time interval that candidates are allotted to complete their cognitive examination following completion of their EMT or paramedic course. Included in this study are all EMT or accredited paramedic programs who graduated students in the United States, excluding candidates from military programs and those age <18 or >85 years. EMT and paramedic programs with 5 or less graduates testing per year were excluded from analyses to provide more stable year-to-year estimates. This study was approved by the Institutional Review Board of the American Institutes for Research.
EMS initial training in the United States varies based on certification level of the professional. EMT educational programs often occur in vocational and technical setting with a diploma or certificate awarded at successful completion (Citation1). In most states, EMT certification requires completion of a state-approved EMT course (typically 120–150 hours of training) followed by completion of the National EMT Cognitive Examination as well as a state-approved psychomotor skills examination (Citation1). Training occurs initially in classroom settings and transitions to clinical experiences. In comparison, paramedic initial certification training typically occurs at both technical and academic settings and may lead to a diploma, certificate, or a degree (Associate or Bachelor). Paramedic certification requires that the candidate first be certified as an EMT, complete an accredited paramedic course (typically 1,200–1,800 hours of training), and successfully complete the National Paramedic Cognitive and Psychomotor Examinations or similar state-approved examinations (Citation1). Similarly, training occurs in a classroom setting but transitions to a clinical experience with a field capstone internship associated with required competencies (Citation16). An important difference between training at each certification level in the United States is that although EMT programs are state-approved, paramedic programs are accredited by the Commission on Accreditation of Allied Health Education Programs (CAAHEP) after recommendation by CoAEMSP (Citation12). There are no EMT programs accredited by CAAHEP. At both certification levels, candidates are allowed 6 attempts of the National Cognitive Examination after graduation from their course. After the third attempt, candidates are required to complete a refresher course before attempts 4 through 6 (Citation14, Citation15).
Measurements and Outcome
Our primary outcome was the first and cumulative third attempt pass rates for both EMT and paramedic programs on the National Registry Cognitive Examinations. A program’s first attempt pass rate provides an estimate of a program graduate’s success at their first experience with the examination (e.g., immediately after program completion) while the program’s cumulative third attempt pass rate provides an estimate of a program graduate’s overall potential to successfully pass the examination before the need for a refresher course. The National Registry Cognitive Examinations for the EMT and paramedic levels are computer adaptive tests (CAT) (Citation14, Citation15). Traditional testing methods give each candidate the same set of test items; however, in CAT examinations, calibrated items of varying difficulties are delivered to match the cognitive ability of each candidate. The examination ends when it has been determined with 95% confidence that a candidate’s cognitive ability is either above or below the passing standard (Citation17).
Program demographics including National Registry Cognitive Examination pass rates, number of testing graduates, and geographic locations were obtained from the National Registry’s database. We used number of testing graduates as a surrogate for program class size since the National Registry database does not contain data on program attrition and only maintains data on graduates who test. Overall program pass rates were calculated from the combined data of each individual candidate who graduated from the 2015 class. Candidates who received a passing score on their first, second, or third attempt on the examination were defined as successful. Examinations labeled as incomplete in the dataset were treated as unsuccessful. A candidate receives an incomplete on the examination if they are unable to complete the number of items in the allotted time frame. We also collected demographic information about candidates at each program including age, sex, and race/ethnicity.
Geographic distribution of EMT and paramedic programs were assessed as programs within specific NASEMSO regions (Citation18). These geographical regions were used since these are the commonly used distributions set by state officials for areas of the country with similar EMS systems of care and collaborative partnerships. States were divided into the predefined East, Great Lakes, South, Western Plains, and West regions. Overall first and cumulative third attempt pass rates per region were assessed.
Data Analysis
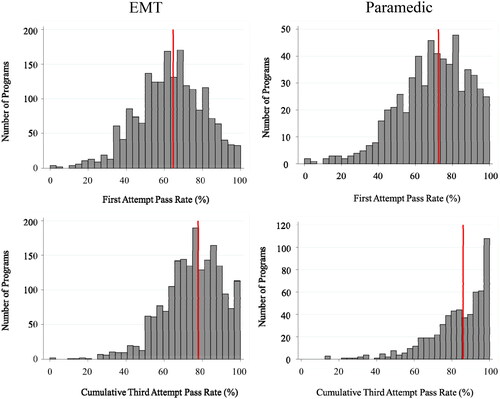
Program performance was assessed both descriptively and comparatively by class size (number of testing graduates) and geography. Descriptively, histograms were created showing both EMT and paramedic program first and cumulative third attempt pass rates. The national first and cumulative third attempt pass rates on a candidate level, rather than a program level, were included for comparison at each certification level from published National Registry data (Citation19). For the EMT certification level, the first and cumulative third attempt pass rate benchmarks based on candidate level pass rates (e.g., average pass rate across all certification examinees) were 64.6% and 77.8%, respectively. On the candidate level for paramedics, these benchmarks were 72.4% and 86.0% for the first and cumulative third attempt pass rates, respectively.
The impact of class size on program success was also evaluated. Programs were divided into quartiles by number of graduates testing from programs. The first and cumulative third attempt pass rates for programs in these quartiles were examined using Kruskal–Wallis testing with Dunn’s post hoc analysis with Bonferroni correction (Citation20).
Regional variability was assessed using Kruskal–Wallis testing to compare first attempt and cumulative third attempt pass rates between NASEMSO regions. All analyses were carried out using STATA IC version 16.1 (StataCorp LP, College Station, TX).
Results
A total of 2,201 EMT programs and 653 paramedic programs had graduates who attempted the National Registry EMT and Paramedic Cognitive Examinations, respectively. As part of this analysis, programs with 5 or less graduates testing for certification were excluded due to unstable estimates. This resulted in exclusion of 262 programs (11.9%) at the EMT certification level and 51 programs (7.8%) at the paramedic certification level. We analyzed 1,939 EMT programs and 602 paramedic programs.
On the candidate level, the 1,939 EMT programs accounted for 63,455 students. EMT candidates were 64% male with a median age of 23 years (IQR 20, 29). The 602 paramedic programs accounted for 10,526 students, 77% were male with a median age of 27 years (IQR 24, 32).
Annual number of graduates testing varied dramatically for both EMT and paramedic programs (). Median annual graduates sitting for the National Registry Cognitive Examination was 47 graduates (IQR 18, 116) for EMT programs and 36 graduates (IQR 22, 58) for paramedic programs. There was a large range in graduates testing as noted in the EMT program quartiles (6 to 1,892 graduates testing annually) and for paramedic program quartiles (6 to 689 graduates testing annually). This is particularly dramatic when comparing the lowest (Quartile 1) and highest (Quartile 4) quartiles. The lowest quartile for EMT programs included 455 EMT programs with 6–17 graduates testing per year whereas the highest quartile included 489 programs with 116–1,892 graduates testing per year. In comparison, for paramedic programs, the lowest quartile contained 146 paramedic programs with 6–21 graduates testing per year and the highest quartile contained 155 programs with 58–689 graduates testing per year.
Table 1. Characteristics of the included programs at the EMT and paramedic level.
Distributions of first attempt and cumulative third attempt pass rates were noted to be different for EMT and paramedic programs (). For EMT program pass rates, the first attempt pass rate closely fit a normally distributed pattern and then skewed to the left as is expected for high stakes certification examinations. A similar trend is noted in the paramedic programs, but the leftward skew is more dramatic from the first pass to cumulative third attempt pass rates. However, one consistent trend was noted concerning the percent of programs below national benchmark (individual pass rate). Greater than 53% and 56% of EMT programs had first attempt and cumulative third attempt program pass rates that were below the benchmark, respectively. Similarly, for paramedic programs, 52% and 50% of programs had pass rates below the overall benchmark for both first attempt and cumulative third attempt pass rates, respectively.
Figure 1. Distributions of program first attempt and cumulative third attempt pass rates for emergency medical technician (EMT) and paramedic programs. The red line indicates the national individual first and third pass rate benchmark for comparison.
Potential differences in pass rates of programs with larger number of graduates testing annually in comparison to those with small enrollments were also evaluated (). EMT programs in the highest quartile (Quartile 4) for graduates testing had a median first attempt pass rate greater than the lowest quartile (Quartile 1) (p < 0.001). This difference was also noted for the cumulative third attempt pass rate where EMT programs in the highest quartile had a median cumulative third attempt pass rate of 79.1% compared to those in the lowest quartile at 72.7% (p < 0.001). Concerning paramedic programs, the highest quartile for annual graduates testing had a median first attempt pass rate of 77.3% compared to programs in the lowest quartile at 62.5% (p < 0.001). Paramedic programs in the highest quartile had a median cumulative third attempt pass rate of 91.9% compared to those in the lowest quartile at 76.9% (p < 0.001).
Table 2. EMT and Paramedic Program first and cumulative third pass rates overall and by total graduates testing annually comparing programs in the highest and lowest quartiles.
First and cumulative third attempt pass rates for EMT and paramedic programs were also analyzed regionally utilizing NASEMSO nomenclature ( and ). For EMT programs, there was regional variability for both first and cumulative third pass rates with the West region having the highest first and third cumulative pass rates followed closely by the Great Lakes region (p < 0.001) (Appendix 1). Similarly, there was regional variability amongst paramedic programs for both first and cumulative third attempt pass rates (p < 0.001) (Appendix 2). The West region had the highest first and cumulative third pass rate being at least 6 percentage points higher than any other region. Detailed data on median pass rates per region with interquartile ranges are reported in Appendices Citation1 and 2.
Figure 2. Regional variability in emergency medical technology (EMT) program first (1st pass) and cumulative third attempt pass rates (3rd pass). Programs were divided into National Association of State EMS Officials (NASEMSO) regions.
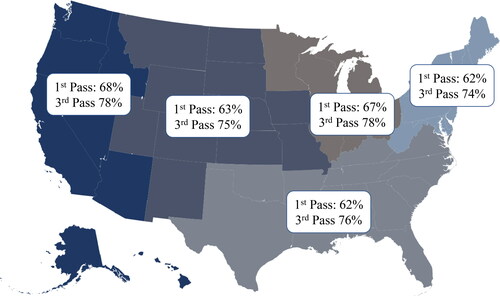
Figure 3. Regional variability in paramedic program first (1st pass) and cumulative third attempt pass rates (3rd pass). Programs were divided into National Association of State EMS Officials (NASEMSO) regions.

Discussion
In this study, we examine EMT and paramedic program performance, finding that programs with the highest annual enrollment outperformed programs with lower enrollment. This difference in performance was present not only for first attempt pass rates, but also for cumulative third attempt pass rates. This demonstrates a consistent advantage for graduates from programs with high enrollment. Given the small size of programs in the lowest quartile, this may represent issues regarding limitations in funding and associated educational infrastructure. In contrast, these small programs may also be in rural areas that depend on those programs to supply and maintain the EMS workforce and provide critical access to prehospital care. Therefore, further evaluation is necessary to understand the association between annual program enrollment and program pass rates throughout the United States.
One critically important consideration that is not captured in this study was the significant proportion of EMT and paramedic programs that have low numbers of graduates testing. Specifically, 262 EMT programs (11.9%) and 51 paramedic programs (7.8%) had less than 5 graduates testing for their certification. As part of the methods in this study, to maintain stable program pass rate estimates, these programs were excluded since a single candidate’s performance could have a significant impact on a program’s overall pass rate. However, recognition of the sizeable number of programs in the United States that have low numbers of testing graduates is a critical characteristic of EMS education programs.
The appropriate benchmark to define low or high performing programs is unclear. In this evaluation, we used the national average for individual candidates, where we noted many—especially EMT programs—had first attempt pass rates below this benchmark. Margolis et al. previously defined high performing programs as achieving a first attempt pass rate on the National Registry Cognitive Examination of ≥75% compared to low performing programs with a first attempt pass rate of <75% (Citation6, Citation7). When this definition is applied, an even smaller proportion of programs meet the criteria to be considered high performing with 25% of EMT programs and 41% of paramedic programs included. The reason for these differences between EMT and paramedic program pass rates is unclear but may be due to the types of students being recruited to programs (e.g., minimum requirements for entry to paramedic programs) or the potential benefit of many paramedic programs being part of a degree program. Another important factor may be the accreditation of paramedic programs, which helps consistently set minimum standards for faculty, resources, and learning experiences that EMT programs may not have to meet. Accredited paramedic programs, in comparison to non-accredited programs, have a greater odds of first pass success on the National Registry Paramedic Cognitive Examination (OR: 1.51, 95% CI: 1.31–1.73) (Citation11, Citation12). The impact of accreditation on EMT certification is unknown since EMT programs do not currently have a pathway to accreditation in the United States.
Additionally, program pass rates also varied by geographic region. Our data show that EMT and paramedic programs in the West region outperformed programs in other regions. It is currently unclear the specific reasons for regional variability in program performance, but this may be due to distribution of programs in rural and urban environments. Further evaluation will be necessary to identify the impact and cause of regional program variability in EMS education.
Overall, these data on EMT and paramedic program performance in the United States highlights several areas of possible improvement. The impact of program enrollment on success should raise awareness on possible challenges in small programs such as curriculum delivery, infrastructure, and financial support. Additionally, the differences in regional performance highlight possible disparities in funding and infrastructure that require further evaluation. These are all important avenues of future research and quality improvement for the EMS education community.
Limitations
One limitation of this evaluation is that data from only one graduation year (2015) was included. Therefore, we describe one class of EMT and paramedic candidates and could not account for year-to-year variation. Furthermore, the use of candidates attempting the National Registry Cognitive Examinations does not capture programs where many students started but either did not finish or did not test or graduates who may have satisfied a state-based certification examination. We also limited our evaluation to candidates’ first three attempts on the National Registry Cognitive Examinations as remedial education is required should a candidate fail 3 attempts. Inclusion of additional attempts would confound the association between initial training provided by their EMT or paramedic program and candidate performance on the examination since candidates may obtain their remedial education from a different educational program. We also excluded small programs (≤5 graduates testing annually) due to unstable pass rate estimates. This may mean we excluded programs that differed in some substantial way. Thus, the results may not be as applicable to these extremely small programs. On the candidate level, there is inherent selection bias given that some students never complete their educational program to become eligible to take their respective examination, and some eligible candidates never test. Finally, this is an observational study of program performance using an available dataset that does not have specific program characteristics; therefore, the underlying reasons behind the variability in programs could not be assessed.
Conclusions
Program performance for both EMT and paramedic programs varies by total number of graduates testing and geographic location. Graduates from larger EMT and paramedic programs have higher first and cumulative third attempt pass rates on the certification examination compared to graduates from smaller programs. Additionally, there is variability in program pass rates across NASEMSO regions for both certification levels. Further evaluation is necessary to better understand the variability in program performance in the United States.
References
- National Association of State EMS Officials. National EMS scope of practice model 2019 (Report No. DOT HS 812-666); 2019 [accessed 2021 Feb 22]. https://www.ems.gov/pdf/National_EMS_Scope_of_Practice_Model_2019.pdf.
- National Highway Traffic Safety Administration. National EMS core content (Report No. DOT HS 809-898) Washington, DC; 2005 [accessed 2021 Feb 22]. https://www.ems.gov/pdf/education/EMS-Education-for-the-Future-A-Systems-Approach/National_EMS_Core_Content.pdf.
- National Highway Traffic Safety Administration. EMS education agenda for the future: a systems approach. Washington, DC; 2000 [accessed 2021 Feb 22]. https://www.ems.gov/pdf/education/EMS-Education-for-the-Future-A-Systems-Approach/EMS_Education_Agenda.pdf.
- Rivard MK, Cash RE, Mercer CB, Chrzan K, Panchal AR. Demography of the national emergency medical services workforce: a description of those providing patient care in the prehospital setting. Prehosp Emerg Care. 2021;25(2):213–20. doi:10.1080/10903127.2020.1737282.
- Margolis GS, Romero GA, Fernandez AR, Studnek JR. Strategies of high-performing paramedic educational programs. Prehosp Emerg Care. 2009;13(4):505–11. doi:10.1080/10903120902993396.
- Margolis GS, Studnek JR, Fernandez AR, Mistovich J. Strategies of high-performing EMT-basic educational programs. Prehosp Emerg Care. 2008;12(2):206–11. doi:10.1080/10903120801906911.
- Renkiewicz GK, Hubble MW. The attrition condition: use of a preparatory course to reduce EMT course attrition and improve performance on North Carolina certification exams. Prehosp Emerg Care. 2015;19(2):260–6. doi:10.3109/10903127.2014.967429.
- Fernandez AR, Studnek JR, Margolis GS. Estimating the probability of passing the national paramedic certification examination. Acad Emerg Med. 2008;15(3):258–64. doi:10.1111/j.1553-2712.2008.00062.x.
- Fernandez AR, Studnek JR, Cone DC. The association between Emergency Medical Technician-Basic (EMT-B) exam score, length of EMT-B certification, and success on the National Paramedic Certification Exam. Acad Emerg Med. 2009;16(9):881–6. doi:10.1111/j.1553-2712.2009.00504.x.
- Dickison P, Hostler D, Platt TE, Wang HE. Program accreditation effect on paramedic credentialing examination success rate. Prehosp Emerg Care. 2006;10(2):224–8. doi:10.1080/10903120500541126.
- Rodriguez S, Crowe RP, Cash RE, Broussard A, Panchal AR. Graduates from accredited paramedic programs have higher pass rates on a national certification examination. J Allied Health. 2018;47(4):250–4.
- Committee on Accreditation of Educational Programs for the Emergency Medical Services Professions. Standards and guidelines for the accreditation of educational programs in the emergency medical services professions; 2015 [accessed 2021 Feb 22]. https://coaemsp.org/caahep-standards-and-guidelines.
- Excellence IfC. Accreditation; 2021 [accessed 2021 Feb 22]. https://www.credentialingexcellence.org/Accreditation.
- National Registry of Emergency Medical Technicians. National Registered Paramedics 2020 [accessed 2021 Feb 22]. https://www.nremt.org/Paramedic/Certification.
- National Registry of Emergency Medical Technicians. Emergency Medical Technicians (EMT); 2020 [accessed 2021 Feb 22]. https://www.nremt.org/EMT/Certification.
- Committee on Accreditation of Educational Programs for the Emergency Medical Services Professions. Interpretations of the commission on accreditation of allied health education programs standards and guidelines; 2015 [accessed 5 Mar 2021]. https://coaemsp.org/caahep-standards-and-guidelines.
- National Registry of Emergency Medical Technicians. Cognitive exams—general information; 2020 [accessed 2021 Feb 22]. https://www.nremt.org/Document/cognitive-exams.
- National Association of State EMS Officials. NASEMSO regions as of January 24, 2020; 2020 [accessed 2021 Feb 22]. https://nasemso.org/wp-content/uploads/NASEMSO-Regions.pdf.
- National Registry of Emergency Medical Technicians. National registry data, dashboard, & maps; 2020 [accessed 2021 Feb 22]. https://www.nremt.org/maps.
- Dinno A. Nonparametric pairwise multiple comparisons in independent groups using Dunn's test. Stata J. 2015;15(1):292–300. doi:10.1177/1536867X1501500117.
