
ABSTRACT
In this study, we used the Rasch measurement to investigate the fairness of the listening section of a national computerized high-stakes English test for differential item functioning (DIF) across gender subgroups. The computerized test format inspired us to investigate whether the items measure listening comprehension differently for females and males. Exploring the functioning of novel task types including multimodal materials such as videos and pictures was especially interesting. Firstly, the unidimensionality and local independence of the data were examined as preconditions for DIF analysis. Secondly, the authors explored the performance of female and male students through DIF analysis using the Rasch measurement. The uniform DIF analysis showed that 25 items (out of 30 items) displayed DIF and favored different gender subgroups, whereas the effect size was not meaningful. The non-uniform DIF analysis revealed several items exhibiting DIF with a moderate to large effect size, favoring various gender and ability groups. Explanations for DIF are hypothesized. Finally, implications of the study regarding test development and fairness are discussed.
Introduction
In this study, we examined whether any of items functioned differentially for females and males in the listening section of the Finnish Matriculation Examination (ME) English test, administered in spring 2018. Contrary to traditional audio-only listening tests, in multimodal listening tests the tasks also include audio-visual materials (see Wagner & Ockey, Citation2018). The computerized test format and the new curriculum (Finnish National Agency for Education, Citation2015) have encouraged ME test developers to include video and pictures in the listening tests (Von Zansen, Citation2019). Although the listening construct of the ME language tests (The Matriculation Examination Board, Citation2020) justifies using a range of materials, audio-visual input is still an exception in most high stakes listening tests (Wagner & Ockey, Citation2018). The computerized listening test investigated in this study included one video-based task, one picture-based item and supporting pictures (theme/content) in five tasks (Abitreenit, Citation2018; see also Appendix 1). With this study we are participating in the long-term discussion on using multimodal texts in listening tests (see Wagner & Ockey, Citation2018).
Zumbo (Citation2007) classified three main approaches to differential item functioning (DIF) analysis. This study relates mostly to the first trend, in which concerns about item and test bias fairness, are essential in the context of high-stakes decision making (Zumbo, Citation2007). Some key ideas of the second trend (Zumbo, Citation2007) are also relevant for this study, as the authors are interested in uniform and non-uniform DIF and dimensionality of items (see also Aryadoust et al., Citation2011). Follow-up studies to this paper belong to the third trend, in which researchers focused on the causes of DIF and according to Zumbo, more research is needed (Zumbo, Citation2007).
Fairness and justice are key concepts in test validation research. Fairness relates to psychometric matters that are internal to the test, whereas justice deals with external policy-related issues (McNamara et al., Citation2019). Fairness can be conceptualized both in highly sophisticated or more technical terms (Fan & Knoch, Citation2019), while justice refers to the level of society in promoting positive values and beneficial consequences to the test-taking community (Kunnan, Citation2018, pp. 80–81). Justice and fairness jointly serve as basic principles for the overarching concept of validity dating back to several previous models deriving from the seminal construct defined by Messick (Citation1989). In the validity frame by Kunnan (Citation2018) fairness comprises several sub-principles, among which our study primarily addresses the absence of bias. A test is unbiased when it is free of differential performance by different test taker groups of similar ability in terms of variables such as gender, parents’ educational background, region and so forth (Kunnan, Citation2018, p. 97).
As Ferne and Rupp (Citation2007, p. 15) explained, DIF exists when different groups of students do not have an equal probability of receiving the same item score after being numerically matched on a measure of the construct that the item is targeting. Thus, DIF techniques are used to detect potentially biased items in a language test (see Ferne & Rupp, Citation2007; McNamara et al., Citation2019; Zumbo, Citation2007).
However, detecting an item with DIF does not absolutely mean that the item is unfair (Boone et al., Citation2014, p. 275). Nevertheless, if the test has high construct validity, the order and spacing of items should not move around as a result of different subgroup (Boone et al., Citation2014, p. 276). Moreover, with a further elaborated model of non-uniform differential item functioning, it is possible to gain more fine-grained information about potential bias across sub-groups, such as low- and high-ability females and males (Ferne & Rupp, Citation2007; McNamara et al., Citation2019; Zumbo, Citation2007).
DIF analysis can reveal construct-irrelevant variance that results from different subgroups such as gender (Zhu & Aryadoust, Citation2019), mother tongue (Zhu & Aryadoust, Citation2020), age (Banerjee & Papageorgiou, Citation2016) or accentedness of speech (Harding, Citation2012). In general, listening has been scrutinized less than reading in the DIF framework, assumingly due to the complexity of the construct (Min & Aryadoust, Citation2021). The focus of this paper, gender, as a potential source of DIF is considered to be a relative permanent attribute of a test-taker and has therefore been the object of investigation more frequently than other characteristics. Designing fair and adequate tests for gender groups with various cognitive and other attribute necessitates continuing scrutiny in both types, the uniform and non-uniform DIF (Zhu & Aryadoust, Citation2019).
Usually, if an item favors speakers of certain language groups or gender, measures can be taken to prevent erroneous decisions and unintended consequences of the test outcome (McNamara et al., Citation2019). After identifying an item with potential DIF, also qualitative methods (i.e., analyzing the text of the item) are used before deciding whether to retain or exclude an item from a test (Boone et al., Citation2014, p. 282).
The context of the study
The aim of this paper is to investigate the fairness of a high stakes listening comprehension test regarding gender. The context of the study is the Finnish Matriculation Examination (ME) that is administered at the end of general upper secondary education when students are around 18 years of age (The Matriculation Examination Board, Citationn.d.). The tests results are mainly used in deciding on admission to higher education institutions. The purpose of the ME language tests is to measure how well the students have achieved the learning goals determined in the National Core Curriculum for upper secondary education (Finnish National Agency for Education, Citation2015). The curriculum (Finnish National Agency for Education, Citation2015) emphasizes multiliteracy, so audiovisual materials have been added to the listening tasks of the computerized language tests.
Two doctoral dissertations have dealt with the listening tests of the ME language tests. Anckar (Citation2011) investigated the processes and strategies behind students’ (n = 218) performance on 17 multiple-choice items from a French listening test (spring 2002) by using short written introspection. Anckar (Citation2011) found several reasons for selecting the correct or wrong option in a multiple-choice question: some problematic items seemed to fail to measure the targeted construct. Von Zansen (Citation2019) compared the use of audio-only versus multimodal materials in a Swedish listening test, mimicking the upcoming computerized test version. No major differences were found between the experimental conditions on the level of the whole test, although in a few items, the audio-visual input might have distracted the students in an unintended way. The overall superiority of males compared to females in advanced syllabus English was recently detected in a study by Hilden et al., Citation2021 that inspired scrutiny into potentially unfair differential item functioning that materialized in the study at hand.
The ME language tests encompass four sections: reading, listening comprehension, writing, and grammar including vocabulary (The Matriculation Examination Board, Citation2020). All the tasks and items are designed from the start of each test round and published afterward; there is no item bank. Thus, upper secondary schools tend to practice for the tests by using tests from previous test occasions.
One of the approaches to investigate DIF is the Rasch-based method. In this study, Rasch analysis helps the authors to evaluate the construct validity of the 30-item listening test (25 multiple-choice, five open-ended). Application of Rasch theory provides important guidance for test developers because of test security, The Matriculation Examination Board (Citationn.d.) does not pretest its language tests that are administered twice a year and taken by over 30,000 upper secondary school students every year.
DIF is a regular procedure in well-established professional tests, often conducted by commercial or other test providers which are external to educational systems, such as IELTS (Alavi et al., Citation2018) and TOEFL (Aryadoust, Citation2017). External tests are rare in Finland, where the only large-scale and high-stakes language tests are the National Certificates of Language Proficiency (Citationn.d.) and the ME at the end of upper secondary education that do not customarily employ DIF analyses.
The absence of scientific DIF studies in the Finnish language testing context is striking. In fact, only one article has addressed DIF in a high-stakes context, currently known as National Certificates of Language Proficiency (Takala & Kaftandjieva, Citation2000) revealing a slight gender bias in the vocabulary items. Therefore, it is of paramount importance to update the Finnish DIF research with timely analyses.
Research questions
The assessment procedures should be of high quality and all stakeholders should be treated fairly. In this study we have addressed the following research question: Do the listening test items in the Finnish Matriculation Examination English test administered in spring 2018 exhibit gender-based DIF? The research question relates to measurement bias which can be detected with DIF analysis. We investigated whether the items in the listening test define a different scale as a function of gender. We compared gender-based subgroups (females/males) to investigate whether the pattern of items i.e., the order and spacing of items along the trait, is the same for all subgroups, or if it changes (Boone et al., Citation2014, p. 274). In other words, we investigated whether the listening test (consisting of 30 items) functions in the same way for female and male students.
Moreover, as recommended by McNamara et al. (Citation2019), we analyzed dimensionality and examined local independence of test items, which are requirements for Rasch measurement (Aryadoust et al., Citation2020). The items should measure the same trait (unidimensionality) and unexplained variances in the items (i.e., error) should not correlate with each other (local independence of test data).
Methods
The data for this study were provided for research purposes by the Matriculation Examination Board in 2019. The data consist of test performance data from 20,189 students who took the first computerized English test (advanced syllabus) of the ME in spring 2018. The test consisted of 115 test items, of which 30 items belonged to the listening section.
In this paper, we focused on the 30 items of the listening section (25 multiple-choice and five open-ended items) of the test. From the students’ background information, we used gender as the only background variable in the analyses of this study. The data include 12,109 (60%) female and 8 061 (40%) male students. For the DIF analyses, only students who reported their gender being “female” or “male” were selected (18 blanks and one student with “other” gender were omitted from the analysis).
Of the computerized listening test, the functioning of the new task types, the video-based task (task 3, items 3.1–3.4) and the picture-based multiple-choice (item 5.1) interested us. In the listening test, zero or two points were awarded for each multiple-choice item and zero, three or six points (partial credit scoring) for each open-ended item. Because of issues related to copyright, the item questions were published by Abitreenit (Citation2018). Appendix 1 summarizes the tasks in the listening section.
The ME language tests and listening construct
In the ME language tests, listening skill is measured by presenting the candidate with various tasks that include studio recorded or authentic speech that vary by theme, text type and duration. The candidates hear the passages once, twice or several times. Some texts can be multimedia comprising still pictures or video clips. The tasks address recognizing main ideas, focal details or examples, as well as drawing conclusions or making interpretations (The Matriculation Examination Board, Citation2020). Item writers are instructed to design half of the number of items at the B2.1 target level, in which students can follow long passages of speech and complex argumentation. Task design is based on the objectives, themes, text types and multimodal delivery defined in the core curriculum (Finnish National Agency for Education, Citation2015). The tasks are revised and accepted jointly by members of the Language section.
In other words, the updated listening construct (The Matriculation Examination Board, Citation2020) of the computerized ME tests includes abilities to process and comprehend both aural input and nonverbal information (see Wagner & Ockey, Citation2018). This is justified, since in real-world listening contexts, listeners can usually see the speaker and use the nonverbal components such as gestures, facial expressions and background contextual information available in the situation (Wagner & Ockey, Citation2018). However, test developers have not reached consensus on how nonverbal components change the construct or perhaps improve the listening performance (Von Zansen, Citation2019; Wagner & Ockey, Citation2018).
Using the Rasch model for DIF analysis
Although various DIF detection methods exist (see Raquel, Citation2019), the Rasch model is often used to analyze DIF in language tests (McNamara et al., Citation2019). The Rasch approach allows detection of both uniform and non-uniform DIF (Aryadoust et al., Citation2011; Linacre, Citation2021a; McNamara et al., Citation2019).
Test data of the ME language tests are usually analyzed by using classical test theory (CTT). In CTT, which is based on analyzing raw scores, item difficulty depends on the particular group of students being tested and person ability is connected with the difficulty of the items used in the test (McNamara et al., Citation2019). However, the abilities of students in a group may vary from group to group. Moreover, using raw scores can lead to incorrect conclusions due to the nonlinearity of the raw data, which can be avoided by converting the ordinal data to linear measures with the help of Rasch software (Boone et al., Citation2014). In Rasch analysis, a student’s ability is related to item difficulty by estimating, how probable it is for a student with a certain ability to achieve a certain score in an item of a given difficulty (McNamara et al., Citation2019, p. 25).
In this study, students’ raw item scores from the listening section of the test were analyzed using the Winsteps computer program (version 4.7.1.0, Linacre, Citation2021b). Descriptive statistics for the test data including mean value, standard deviation, skewness and kurtosis for each item were calculated using IBM SPSS Statistics 25 for Windows.
Rasch analysis
In addition to descriptive statistics, data quality was explored with the help of Rasch analysis that also gave us information about the measurement requirements of the Rasch model (see Boone et al., Citation2014, pp. 176–184). In the Rasch measurement, fit statistics indicate how accurately or predictably data fit the model (Linacre, Citation2002). The most common range for interpreting mean square (MNSQ) fit statistics is 0.5–1.5 (Aryadoust et al., Citation2020), which is recommended by Linacre (Citation2002).
The infit and outfit MNSQ statistics have an expectation 1.0 and range from 0 to infinity. MNSQs larger than 1.0 show underfit to the Rasch model, which means that the data are not as predictable as expected. For example, an MNSQ of 1.3 shows that there is 30% more randomness (also called “noise”) which can be caused by lucky guessing. MNSQ values smaller than 1.0 show overfit to the Rasch model, which means that the data are more predictable than expected. For example, an MNSQ of 0.7 shows 30% less randomness in the data than expected, meaning that they are too predictable. High MNSQs go hand in hand with low MNSQs since the values are forced to average near 1.0 (Wright & Linacre, Citation1994). Moreover, MNSQs of less than 1.0 cause inflated reliability statistics (Boone et al., Citation2014, p. 166).
In CTT, Cronbach’s alpha and KR-20 are commonly used as reliability coefficients (McNamara et al., 2009). In this paper, we used Rasch-based reliability indices (person reliability, item reliability and person separation, item separation) to evaluate reliability of the listening test. The reliability index computed by Winsteps has a maximum of 1.0 whereas the separation index has no limit. Person reliability depends on the sample size, students’ ability range and test length, while item reliability depends on the item’s difficulty range and the size of the student sample (Boone et al., Citation2014).
The starting point for Rasch measurement analysis is the assumption of unidimensionality. Unidimensionality means that the test items relate to the same trait (see Boone et al., Citation2014). In other words, in the context of this study, the 30 items of the listening section of the English test should all measure the listening ability. Following Aryadoust et al. (Citation2011) and Boone and Staver (Citation2020), we used principal component analysis of residuals (PCAR) to investigate unidimensionality. In Rasch measurement, the residuals are discrepancies between the observed data and the data expected by the Rasch model. With PCAR, possible secondary dimensions are investigated from the residuals (Aryadoust et al., Citation2020, p. 5).
Another requirement for Rasch measurement is local independence (Linacre, Citation2021a). The unexplained variances in the items should not correlate with each other. Local dependency can be examined by investigating correlations between the residuals of the test items. Regarding local independence, together with fit statistics, we investigated it with correlation analysis of linearized residuals (see Aryadoust et al., Citation2011). Linacre (Citation2021a, p. 682) states that the different dimensions are statistically the same if the disattenuated correlations of the person measures are near 1.0. Finally, it is worth mentioning, that unidimensionality and local independence are relative concepts that tend to be interrelated (Fan & Bond, Citation2019).
DIF analysis
In this study, we ran a gender-based DIF analysis to investigate if the female and male students with equal overall ability have the same likelihood to answer the item correctly. It is important to keep in mind that from the measurement perspective alone, it does not mean that the test is biased if the student performance is different as a function of gender (Boone et al., Citation2014). That is, detecting that males perform better than females does not mean that the item exhibits DIF.
To compare test performance data of different subgroups, we conducted a DIF analysis to evaluate the stability of the items of the listening test (see Boone et al., Citation2014). The difference in difficulty of the item between two groups is called DIF Contrast (Linacre, Citation2021a). DIF Contrast ≥ .43 means slight to moderate DIF if the p ≤ .05 (Linacre, Citation2021a). Moreover, we investigated the order (easy – difficult) and spacing (how much easier – more difficult) of items when comparing test performance data of different subgroups (Boone et al., Citation2014, p. 276).
Following Linacre (Citation2021a) we used the Rasch-Welch test, which models the item difficulty according to the item type. Welch t expresses the DIF significance as a Welch’s (Student’s two-sided) t-statistic (Linacre, Citation2021a, p. 447).
When an item evenly favors a subgroup (say, male students over female students with equal ability), it is called uniform DIF (UDIF), whereas non-uniform DIF (NUDIF) occurs when the item favors only certain ability subgroups (for example, high-performing males over high-performing females). (See Ferne & Rupp, Citation2007; McNamara et al., Citation2019). NUDIF can also be called Differential Score Functioning or Differential Step Functioning (Linacre, Citation2021a) or Crossing DIF (Ferne & Rupp, Citation2007), since there is a point at which the favoring of one subgroup reverses.
For investigating UDIF and NUDIF, we used item characteristic curves (ICCs) in addition to the measures calculated by Winsteps (Linacre, Citation2021b). UDIF occurs when ability level and group level membership do not interact, while NUDIF occurs when they do (McNamara et al., Citation2019, pp. 160–161). In other words, if the slopes of the subgroups (males and females) differ and intersect, the item exhibits NUDIF.
Results
To give an overview of the listening test, we first present the Wright map () which places the items on the same measurement scale as the ability of the students. As recommended by Ferne and Rupp (Citation2007), we then start with information on the goodness of fit of the statistical models that are used as baseline models for the DIF analyses. After that we present results of the reliability analysis, then results concerning unidimensionality and local independence. Finally, we present results of the DIF analyses, first the findings of the UDIF analysis and after that the results of the NUDIF analysis.
Figure 1. Calibration of items.
shows where items are located in relation to the ability of the students. On the left side of the picture, each hashtag represents 90 students and each dot 1–89 students. The measurement scale is in logits (from −2 to +2). On the right side of the pictures are the 30 items of the listening test. For example, “Q6_2airp” means item 6.2 of the “Airplane Contrails” task. The listening tasks are available online via Abitreenit (Citation2018) while Appendix 1 gives an overview of the tasks. In the Wright map, “M” shows the location of the mean, “S” the standard deviation from the mean, and “T” the location of two standard deviations (Boone & Staver, Citation2020, p. 224). The more-able students are the higher up hashtags while less-able students are at the bottom. Similarly, the more difficult items are located higher up on the right side of the picture and easier ones at the bottom of the scale.
The difficulty of items ranges from −0.79 logits (item 1.3) to +0.97 (item 6.2). The person ability measures range from −1.36 to +2.84. The means show that the listening test is fairly easy, since students get higher scores compared to the difficulty level of items. The mean for the difficulty level of the items is zero while the mean for students’ ability is above zero (0.41). There are few or no items matching the students with higher ability listening skills. In contrast, there are plenty of easy items for less-able students. Moreover, some items are equal in difficulty with other items (see for instance, items 2.4, 5.4, 6.4, 7.2) especially below the mean where most students landed.
Fit statistics
Descriptive statistics and Rasch measurement results are presented in . Of the multiple-choice questions, item 1.3 was the easiest while item 6.2 was the most difficult. Of the five open-ended questions, item 7.4 was the easiest and item 7.5 the most difficult. The skewness coefficients imply normality when they fall between –2 and +2. As shows, the skewness coefficients for items 1.3, 5.1, 5.3 and 5.5 are slightly below the limit. The kurtosis coefficients range between –2 and +4 implying that the shape of the distribution is not severely non-normal (Kline, Citation2015, pp. 76– 77). All but one of the items had Outfit MNSQs within the acceptable range (0.5–1.5, see Linacre, Citation2002), yet one item (3.2) had the MNSQ slightly above the upper limit (1.53). All point-measure correlations for test items were positive.
Table 1. Descriptive statistics and Rasch measurement
Reliability analysis
The person reliability of the listening test is 0.82 and the item reliability 1.0. The person reliability means that the listening test discriminates the sample into two or three levels (Linacre, Citation2021a, p. 709). High item reliability depends on item difficulty variance and person sample size (Linacre, Citation2021a, p. 709). High item reliability and large item separation of the test (58.36) imply that the sample (n = 20,189) is large enough to distinguish between items of different difficulty (Linacre, Citation2017).
The person separation is 2.16. If the person separation were lower (< 2) with a large sample size like in this study, the listening test might not be sensitive enough to separate high performers from low performers and more items would be needed (Linacre, Citation2021a). Moreover, low item separation (< 3) could reveal problems related to construct validity, for example, indicating that the person sample is not large enough to confirm the item difficulty hierarchy of the listening test (Linacre, Citation2021a).
Unidimensionality and Local Independence
The PCAR indicates that the Rasch model (raw variance explained by people and items) explains 36.7% (17.4 Eigenvalues) of the observed variance, while the first component of the residuals explains 3.7% (1.8 Eigenvalues) of the observed variance. This finding supports unidimensionality, since the Eigenvalue of the first contrast is small, less than 2.0 (Linacre, Citation2021a, p. 603). This implies that the observed noise is random and there is no evidence of a possible secondary dimension (Boone & Staver, Citation2020). Furthermore, no patterns of loadings (Linacre, Citation2021a, p. 603) were found when reviewing the standardized residual first contrast plot (see ). Moreover, no clusters were found when comparing the wordings of items appearing at the top of the plot () with the items appearing at the bottom of the plot (Boone & Staver, Citation2020; Linacre, Citation2021a).
Figure 2. Principal component analysis.
The disattenuated correlations all approach 1.0 (correlations 0.9–1.0), which provides evidence of local independence (Linacre, Citation2021a, p. 420). Moreover, all the standardized residual correlations provided by Winsteps (Linacre, Citation2021b) are negative (between −0.9 and −0.14) which indicates that local independence is not compromised in this analysis. In conclusion, we found evidence supporting unidimensionality and local independence by examining fit statistics (presented earlier), PCAR, disattenuated correlations, standardized residual correlations while also reviewing the content of the items.
UDIF by gender
presents a UDIF analysis of the items. In the UDIF analysis, we observed 25 items (83% of all items) with significant DIF (p ≤ .05). Twelve items (items 1.1, 4.1, 4.2, 4.3, 5.1–5.5, 6.4, 7.3, 7.4) favor male students while 13 items (items 1.2, 2.1, 2.2, 2.3, 2.4, 3.2, 3.4, 5.6, 6.2, 6.3, 7.1, 7.2, 7.5) favor female students. As the shows, for most of the items (all items except items 1.3, 3.1, 3.3, 4.4, 6.1) the Welch t value exceeds the significance level value of 1.96 (d.f. = infinite, p = .05, see Linacre, Citation2021a, p. 734). Although most of the items exhibit potential DIF as a function of gender (p ≤ .05), none of the items have DIF Contrast ≥ 0.43. As described earlier (see the DIF Analysis section), the DIF Contrast should be ≥ 0.43 for DIF to be moderate (Linacre, Citation2021a).
Table 2. UDIF Analysis of Items
Moreover, dividing the DIF Contrast by the number of items gives an estimation of the DIF impact on person measures (McNamara et al., Citation2019, companion website). Dividing the largest DIF Contrast (0.35, see item 6.4) observed in the data by the number of items (a total of 30 items) in the listening test (0.35/30 ≈ 0.01) shows us that the DIF impact on person abilities in the gender groups is not noticeable. This means that although the relative location of an item is different between females and males, the statistical difference (effect size of DIF) is not meaningful.
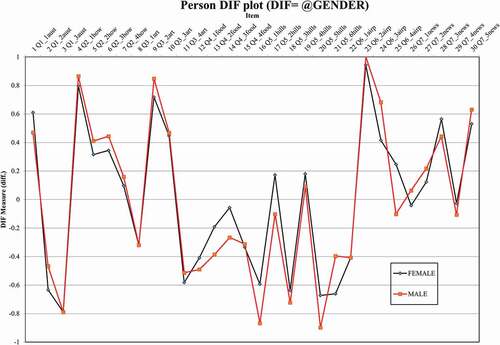
shows the results of UDIF analysis for all the 30 items of the listening test. Generally, the gender differences in difficulty measures are small. In other words, the items do not exhibit much gender-based DIF.
Figure 3. Uniform differential item functioning.
NUDIF by gender
After the UDIF analysis, we divided the gender groups (female/male) into high- and low-performing subgroups where both strata had equally long range of the ability measure (F1 = female students with lower ability, F2 = female students with higher ability, M1 = male students with lower ability, and M2 = male students with higher ability, see Linacre, Citation2021a, pp. 577, 684).
In the NUDIF analysis, of the total of 90 comparisons between lower ability females and other subgroups (F1-F2, F1-M1, F1-M2), we observed 15 instances (in 11 items) with DIF Contrast ≥ 0.43 logits, which is significant difference according to the Rasch Welch t-test (p <.01). Similarly, of the total 90 comparisons between lower ability males and other the subgroups (M1-F1, M1-F2, M1-M2), we observed nine instances (in seven items) with DIF Contrast ≥ 0.43 logits, which is significant difference according to the Rasch Welch t-test (p <.01). presents all 24 instances (in different items) when the DIF size observed in the NUDIF analysis is noticeable (≥ 0.43) (see the “DIF Contrast” column). Most of the items displaying NUDIF are the same in both comparisons (items 2.1, 3.1, 3.2, 3.4, 4.2, 5.5). Some items display NUDIF only in comparisons conducted with either lower ability females (F1: items 3.3, 6.2, 6.3, 6.4) or lower ability males (M1: item 5.6).
Table 3. Non-uniform DIF Analysis
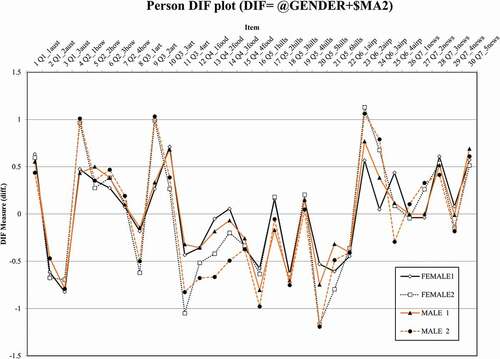
shows the results of the NUDIF analysis.
Figure 4. Non-uniform differential item functioning.
For example, shows the item characteristic curve (ICC) of item 2.1 displaying NUDIF shows that the dashed line with dots (females) and the solid line with crosses (males) intercept at about −0.2 logits on the x axis. The plain solid line is the Rasch model curve. Before this point, the lower ability males have a higher probability of getting this item right, but from that point on, females with higher ability measures (>-0.2) are more likely to get this item right.
Figure 5. Item characteristic curve of item 2.1.
For another example, see ; the ICC of the item 3.2 displaying NUDIF shows that the dashed line with dots (females) and the solid line with crosses (males) intercept first at 0.0 and then at about 0.45 logits on the x axis. The lower ability females (<0.45) have a higher probability of getting this item right than males. But for students with ability measures >0.45 logits, the situation is the opposite; the item starts to favor males.
Figure 6. Item characteristic curve of item 3.2.
Although results of the NUDIF analysis indicate that 12 items exhibit gender-based DIF when the students are divided into high- and low-performing females and males, the differences in the ICCs are not always notable. In , the ICC of item 3.4 where the dashed line with dots (female) is slightly above the solid line with crosses (males) and the DIF Contrast is 0.73, between M1 and F2 subgroups (p < .01).
Figure 7. Item characteristic curve of item 3.4.
Discussion
The recent transition in the ME language tests to a computerized test format provided an excellent opportunity to explore how novel task types function in relation to diverse groups of students. Our research question concerned measurement bias, which we investigated through gender-based DIF analysis. Before that, we found evidence to support the assumptions of uni-dimensionality and local independence of the test data, which are requirements for Rasch-based DIF analysis. Moreover, the reliability analysis provided evidence of the high reliability of the listening test investigated in this study. Overall, the data fit the Rasch model well and the analysis did not reveal severe problems related to construct validity of the listening test. Moreover, the listening test seems to measure the same trait (listening ability) even though multimodal materials (video and pictures) have been added to the test (Abitreenit, Citation2018; see also Appendix 1).
On balance, we observed that 83% of the listening items exhibit potential uniform DIF as a function of gender. Of the 30 items, we found 12 items favoring male students while 13 items favored female students. Similarly, Park (Citation2008) detected DIF in 13 items, six in favor of males and seven for females, in the English listening part of the 2003 Korea College Scholastic Ability Test that consisted of 17 multiple-choice questions. In this study, tasks related to science (task 4, items 4.1– 4.3) and football (task 5, items 5.1– 5.5) seem to favor males while task 2 (items 2.1– 2.4) about speech communications seems to favor females. Nevertheless, although the relative locations of these items were different between females and males, the effect size of DIF was not big enough. This indicates that the gender-based uniform DIF (UDIF) observed in most of the items does not seem to be very alarming in practice.
Turning to the non-uniform DIF (NUDIF) analysis, we first compared lower ability females (F1) and other subgroups, namely, higher ability females (F2), lower ability males (M1) and higher ability males (M2). As a result, we observed 15 instances in 11 items displaying NUDIF with a significant effect size. We then compared lower ability males (M1) with other subgroups (M1-F1, M1-F2, M1-M2) and observed nine instances (in seven items) displaying NUDIF with significant effect size. Six of the items displaying NUDIF were the same for both comparisons (see ). Of the novel task types (see Appendix 1 and Abitreenit, Citation2018) the video-related items 3.1– 3.4 displayed NUDIF. Conversely, the multiple-choice question in which the options were given as pictures (item 5.1) did not display NUDIF.
Explanations can only be hypothetical, but it is possible that the fairly large outfit MNSQs of four items displaying possible NUDIF (items 2.1, 3.2, 6.2, 6.3; Outfit MNSQs 1.29–1.53) are the result of lucky guessing (Wright & Linacre, Citation1994). Lucky guessing is one potential cause of DIF found in previous research (e.g., Aryadoust, Citation2012; Aryadoust et al., Citation2011). At lower levels, guessing may play a role, while at higher levels, the overall proficiency, not only in English, but also in other subjects may contribute to the correct response. With reference to items related to science (e.g., task 4, items 6.2 and 6.3), males tend to take tests in science subjects more often than females, as stated by Kupiainen et al. (Citation2018). Also, Raquel (Citation2019) suggests that text topic familiarity and familiarity with item type could cause DIF.
Furthermore, national evaluations at the end of compulsory basic education have repeatedly revealed group-wise gaps in equality of the overall proficiency between gender subgroups (Härmälä et al., Citation2019). Explanations for the male dominance in English encompass males’ interest in online games and media consumption, so that their proficiency is mostly gained outside school activities (Härmälä et al., Citation2014). Finnish males’ versatile use of digital devices is connected with higher performance in the PISA reading test (Leino et al., Citation2019). Yet in many cases, the sources of DIF remain unresolved or hypothetical and call for in-depth analysis of the item content (see Zumbo, Citation2007).
Based on the findings in this study, although we identified items displaying DIF and explained why DIF might occur, we cannot claim that the listening test would be unfair for a group of students (Raquel, Citation2019). The results show DIF cancellation, i.e., some items favor females while other items favor males. There are methods for investigating whether the DIF items have had impact on person measures (Raquel, Citation2019). One limitation of this study is the lack of post hoc analysis examining impact of DIF at the test level. Another limitation of this study is that the data received for this article did not include information on the distractors (wrong answer options) in the multiple-choice questions. It might be useful to explore which distractors functioned poorly (see also Anckar, Citation2011).
We do think that investigating the quality of a high-stakes test is especially important when introducing new testing methods such as computerized test format or using multimodal materials in a listening test. As Boone et al. (Citation2014) state, disregarding the fact that the item functions differently as a function of gender, can jeopardize the validity of conclusions that are made based on analyzing the test performance data. Moreover, Ferne and Rupp (Citation2007) emphasize that in terms of test fairness in a high-stakes context, it is vital to consider the existence of NUDIF when determining cut scores.
Test developers aim to design valid and reliable measurement instruments that function in the same manner for all subgroups of students (e.g., males and females). Since ME language tests cannot be pretested, reaching this goal should be carefully verified by analyzing the test performance data. In the ME language tests, removing items that display gender-based DIF from the listening section (the so-called purification approach, see Ferne & Rupp, Citation2007) is not feasible, but these items could be treated as different items for females and males from measurement perspective (Boone et al., Citation2014; Tennant & Pallant, Citation2007). Moreover, if ME test administrators were to start building and using an item bank, DIF items should be excluded to prevent possible biased item composites (Takala & Kaftandjieva, Citation2000).
We share the need for further explanatory analyses and reflections on probable causes of DIF with test developers based on existing theory (Ferne & Rupp, Citation2007). Regarding multimodal listening tasks, it might be interesting to group the items based on the explicitness of information content (e.g., explicit/implicit items), strategies that solving the item requires or the type of visual cues available (see Ferne & Rupp, Citation2007; Wagner & Ockey, Citation2018). For example, eye-tracking methods could be used to investigate the viewing behavior and future research should focus on gender-based analyses, as Batty (Citation2020) recommends.
Conclusion
In conclusion, the listening tests of the recently computerized ME language tests include multimodal materials such as videos and pictures. Although the ability to process aural input with nonverbal information is important in real-world listening, we wanted to investigate whether the items of a novel multimodal listening test function differentially for males and females through DIF analysis with Rasch measurement. In this study, we found some items favoring females while other items favored males, yet we did not examine the impact of DIF at the test level. We also considered reasons for DIF, of which lucky guessing and text topic familiarity seem the most plausible. Investigation of unidimensionality and local independence proved to be useful; and no evidence of possible secondary dimension were detected. In other words, the multimodal listening test seems to measure processes related to the same trait.
Acknowledgments
We express our gratitude to the reviewers of The International Journal of Listening for their insightful comments. We would like to thank Dr. Vahid Aryadoust for inspiring us and commenting on this article.
Disclosure statement
Dr. Anna von Zansen worked for the Matriculation Examination Board during the computerization phase of the examination 2013-2016.
Dr. Raili Hilden works as the chair of the Finnish Matriculation Examination Language Section 2016-2021.
References
- Abitreenit. (2018, March 16). The English test of the matriculation examination. Spring 2018, advanced syllabus. http://yle.fi/plus/abitreenit/2018/kevat/EA-fi/EA-fi/index.html
- Alavi, S. M., Kaivanpanah, S., & Masjedlou, A. P. (2018). Validity of the listening module of international English Language Testing System: Multiple sources of evidence. Language Testing in Asia, 8(8), 1–17). https://doi.org/https://doi.org/10.1186/s40468-018-0057-4
- Anckar, J. (2011). Assessing foreign language listening comprehension by means of the multiple-choice format: Processes and products [Doctoral dissertation, University of Jyväskylä]. Jyväskylä Studies in Humanities. http://urn.fi/URN:ISBN:978-951-39-4410-0
- Aryadoust, V., Goh, C. C., & Kim, L. O. (2011). An investigation of differential item functioning in the MELAB listening test. Language Assessment Quarterly, 8(4), 361–385. https://doi.org/https://doi.org/10.1080/15434303.2011.628632
- Aryadoust, V., Ng, L. Y., & Sayama, H. (2020). A comprehensive review of Rasch measurement in language assessment: Recommendations and guidelines for research. Language Testing, 38(1), 6–40. https://doi.org/https://doi.org/10.1177/0265532220927487
- Aryadoust, V. (2012). Differential item functioning in while-listening performance tests: The case of the international English Language Testing System (IELTS) listening module. International Journal of Listening, 26(1), 40–60. https://doi.org/https://doi.org/10.1080/10904018.2012.639649
- Aryadoust, V. (2017). The listening test of the Internet‐Based Test of English as a Foreign Language (TOEFL iBT). In D. L. Worthington & G. D. Bodie (Eds.), The sourcebook of listening research: Methodology and measures (pp. 592–598). John Wiley & Sons, Inc.
- Banerjee, J., & Papageorgiou, S. (2016). What’s in a topic? Exploring the interaction between test-taker age and item content in high-stakes testing. International Journal of Listening, 3(1–2), 8–24. https://doi.org/https://doi.org/10.1080/10904018.2015.1056876
- Batty, A. O. (2020). An eye-tracking study of attention to visual cues in L2 listening tests. Language Testing 38(4) , 511–535. https://doi.org/https://doi.org/10.1177/0265532220951504
- Boone, W. J., Staver, J. R., & Yale, M. S. (2014). Rasch analysis in the human sciences. Springer Science & Business Media.
- Boone, W. J., & Staver, J. R. (2020). Advances in Rasch analyses in the human sciences. Springer.
- Fan, J., & Bond, T. (2019). Unidimensionality and local Independence. In V. Aryadoust & M. Rachelle (Eds.), Quantitative data analysis for language assessment (Volume I): Fundamental techniques (pp. 83–102). Routledge.
- Fan, J., & Knoch, U. (2019). Fairness in language assessment: What can the Rasch model offer? Papers in Language Testing and Assessment, 8(2), 117–142. http://www.altaanz.org/uploads/5/9/0/8/5908292/8_2_s5_fan_and_knoch.pdf
- Ferne, T., & Rupp, A. A. (2007). A synthesis of 15 years of research on DIF in language testing: Methodological advances, challenges, and recommendations. Language Assessment Quarterly, 4(2), 113–148. https://doi.org/https://doi.org/10.1080/15434300701375923
- Finnish National Agency for Education. (2015). Lukion opetussuunnitelman perusteet 2015 [National core curriculum for general upper secondary schools]. Finnish National Agency for Education.
- Harding, L. (2012). Accent, listening assessment and the potential for a shared-L1 advantage: A DIF perspective. Language Testing, 29(2), 163–180. https://doi.org/https://doi.org/10.1177/0265532211421161
- Härmälä, M., Huhtanen, M., & Puukko, M. (2014). Englannin kielen A-oppimäärän oppimistulokset perusopetuksen päättövaiheessa 2013. [Learning outcomes in advanced syllabus English at the end of basic education 2013]. Finnish National Evaluation Centre. Publications 2014: 2.
- Härmälä, M., Huhtanen, M., Puukko, M., & Marjanen, J. (2019). A-Englannin oppimistulokset 7. Luokan alussa 2018. [Learning outcomes in advanced syllabus English at the beginning of grade 7]. Finnish National Evaluation Centre. Publications 13: 2019.
- Hilden, R., von Zansen, A., & Laihanen, E. ( accepted 2021). Studioista steissille - Multimodaaliset kuuntelutehtävät ylioppilastutkinnon pitkien oppimäärien kielikokeissa 2018. [Out to the world from recording studio – Multimodal tasks in the Matriculation Examination language tests of advanced syllabi in 2018]. Suomen ainedidaktinen seura [Finnish Research Association for Subject Didactics].
- Kline, R. B. (2015). Principles and practice of structural equation modeling (4th ed.). Guilford Publishers.
- Kunnan, A. J. (2018). Evaluating language assessments. Routledge.
- Kupiainen, S., Marjanen, J., & Ouakrim-Soivio, N. (2018). Ylioppilas valintojen pyörteissä. Lukio-opinnot, ylioppilastutkinto ja korkeakoulujen opiskelijavalinta. [Undergraduates facing a myriad of choices. Upper secondary education, Matriculation examination and university admission]. Suomen ainedidaktinen tutkimusseura. [Finnish Research Association for Subject Didactics]. https://helda.helsinki.fi/bitstream/handle/10138/231687/Ad_tutkimuksia_14_verkkojulkaisu.pdf?sequence=1
- Leino, K., Ahonen, A. K., Hienonen, N., Hiltunen, J., Lintuvuori, M., Lähteinen, S., Lämsä, J., Nissinen, K., Nissinen, V., Puhakka, E., Pulkkinen, J., Rautopuro, J., Sirén, M., Vainikainen, M.-P., & Vettenranta, J. (2019). PISA 18 ensituloksia: Suomi parhaiden joukossa. (Opetus- ja kulttuuriministeriön julkaisuja; No. 2019:40). Opetus- ja kulttuuriministeriö. http://urn.fi/URN:ISBN:978-952-263-678-2
- Linacre, J. M. (2002). What do infit and outfit, mean-square and standardized mean? https://www.rasch.org/rmt/rmt162f.htm
- Linacre, J. M. (2017, July 26). Zara: Your high item reliability and your large item separation tell us that your sample of persons (N=180) is large [Comment on the online forum post Person Item separation]. Rasch Measurement Forum. https://raschforum.boards.net/post/3660/thread
- Linacre, J. M. (2021a). A user’s guide to WINSTEPS MINISTEP Rasch-model computer programs. https://www.winsteps.com/a/Winsteps-Manual.pdf
- Linacre, J. M. (2021b). WINSTEPS (Version 4.7.1.0) [computer program]. Winsteps.com
- McNamara, T., Knoch, U., & Fan, J. (2019). Fairness, Justice & Language Assessment. Oxford University Press.
- Messick, S. (1989). Validity. In R. L. Linn (Ed.), The American council on education/Macmillan series on higher education. Educational measurement (pp. 13–103). Macmillan Publishing Co, Inc; American Council on Education.
- Min, S., & Aryadoust, V. (2021). A systematic review of item response theory in language assessment: Implications for the dimensionality of language ability. Studies in Educational Evaluation, 68, 100963. https://doi.org/https://doi.org/10.1016/j.stueduc.2020.100963
- National Certificates of Language Proficiency. (n.d.). Finnish national board of education. Retrieved February 15, 2021, from https://www.oph.fi/en/national-certificates-language-proficiency-yki
- Park, G. P. (2008). Differential item functioning on an english listening test across gender. TESOL Quarterly, 42(1), 11–123. https://doi.org/https://doi.org/10.1002/j.1545-7249.2008.tb00212.x
- Raquel, M. (2019). The Rasch measurement approach to differential item functioning (DIF) analysis in language assessment research. In V. Aryadoust & M. Raquel (Eds.), Quantitative data analysis for language assessment (volume I): Fundamental techniques (pp. 103–131). Routledge.
- Takala, S., & Kaftandjieva, F. (2000). Test fairness: A DIF analysis of an L2 vocabulary test. Language Testing, 17(3), 323–340. https://doi.org/https://doi.org/10.1177/026553220001700303
- Tennant, A., & Pallant, J. F. (2007). DIF matters: A practical approach to test if differential item functioning makes a difference. Rasch Measurement Transactions, 20(4), 1082–1084. https://www.rasch.org/rmt/rmt204d.htm
- The Matriculation Examination Board. (2020). Toisen kotimaisen ja vieraiden kielten kokeiden määräykset [Regulations for tests of second national languages and foreign languages]. https://www.ylioppilastutkinto.fi/images/sivuston_tiedostot/Ohjeet/Koekohtaiset/kielikokeet_maaraykset_fi.pdf?v=040320
- The Matriculation Examination Board. (n.d.). Website of the matriculation examination board. Retrieved March 27, 2021, from https://www.ylioppilastutkinto.fi/en/
- von Zansen, A. (2019). Uudenlaista kuullun ymmärtämistä – Kuvan ja videon merkitys ylioppilastutkinnon kielikokeissa [New approaches to assessing listening – Pictures and video in the language tests of the Finnish Matriculation Examination [Doctoral dissertation], University of Jyväskylä]. JYU Dissertations. http://urn.fi/URN:ISBN:978-951-39-7961-4
- Wagner, E., & Ockey, G. (2018). An overview of the use of audio-visual texts on L2 listening. In G. J. Ockey & E. Wagner (Eds.), Assessing L2 listening: Moving towards authenticity (pp. 129–144). John Benjamins Publishing Company.
- Wright, B., & Linacre, J. M. (1994). Reasonable mean-square fit values. https://www.rasch.org/rmt/rmt83b.htm
- Zhu, X., & Aryadoust, V. (2019). Examining test fairness across gender in a computerized reading test: A comparison between A rasch-based DIF-technique and MIMIC. Papers in Language Testing and Assessment, 8(2), 65–90. http://www.altaanz.org/uploads/5/9/0/8/5908292/8_2_s3_zhu_aryadoust.pdf
- Zhu, X., & Aryadoust, V. (2020). An investigation of mother tongue differential item functioning in a high-stakes computerized academic reading test. Computer Assisted Language Learning. https://doi.org/https://doi.org/10.1080/09588221.2019.1704788
- Zumbo, B. D. (2007). Three generations of DIF analyses: Considering where it has been, where it is now, and where it is going. Language Assessment Quarterly, 4(2), 223–233. https://doi.org/https://doi.org/10.1080/15434300701375832
Appendix
Appendix 1. Characteristics of the listening items in the ME English test (Abitreenit, 2018)