
ABSTRACT
Purpose: To develop models to estimate aerobic fitness (VO2max) from PACER performance in 10- to 18-year-old youth, with and without body mass index (BMI) as a predictor. Method: Youth (N = 280) completed the PACER and a maximal treadmill test to assess VO2max. Validation and cross-validation groups were randomly formed to develop and examine accuracy of models. Participants were classified into FitnessGram® Healthy Fitness Zone categories based on measured and estimated VO2max and criterion-referenced validity was evaluated. Results: Multiple correlations between measured and estimated VO2max ranged from .70 to .73, with standard errors of estimate between 6.43 and 6.68 mL·kg−1·min−1. Accuracy with and without BMI was nearly identical. Overall, criterion-referenced validity evidence was moderate. Conclusion: Moderately accurate and feasible models were developed. Minimal improvement in accuracy was noted when BMI was added as a predictor. The model with PACER and age as predictors has a high level of utility for youth fitness testing.
The assessment of aerobic fitness is a central component of most youth fitness tests. The FitnessGram® is the national youth fitness test in the United States and is widely used throughout the world. The Progressive Aerobic Cardiovascular Endurance Run (PACER) is the recommended assessment of aerobic fitness in the FitnessGram® battery as well as by the National Academy of Medicine (formerly the Institute of Medicine [IOM]) for use in youth fitness surveillance (Institute of Medicine, Citation2012). The PACER test (known as the “Bleep Test” or the “Léger Test” in some international batteries) is a 20-m multistage shuttle run that requires participants to maintain the pace set by an audio file, which gets faster each minute (a 15-m version of the test is also available). Participants are encouraged to continue running 20m “shuttles” at the corresponding pace on the audio file until they can no longer maintain the pace. The raw score from the PACER is the total number of laps completed before volitional fatigue and more fit participants will continue longer and run more laps than less fit participants, so the assessment mirrors standard methods used for treadmill-based fitness assessments designed to estimate aerobic capacity (i.e., VO2max).
To increase utility for field-based research, several prediction equations have been developed to estimate VO2max from PACER performance (e.g., Barnett, Chan, & Bruce, Citation1993; Léger, Mercier, Gadoury, & Lambert, Citation1988; Mahar, Guerieri, Hanna, & Kemble, Citation2011; Mahar, Welk, Rowe, Crotts, & McIver, Citation2006; Matsuzaka et al., Citation2004). These studies have typically linked PACER performance to laboratory assessments of aerobic capacity (expressed as mL·kg−1·min−1), but differences in samples, protocols, and analytic methods have made it difficult to compare the equations systematically. The original equation published by Léger et al. (Citation1988) included only speed and age as predictor variables, but subsequent studies have used more robust models that typically included gender terms as well as body mass or body mass index (BMI) (Barnett et al., Citation1993; Mahar et al., Citation2011, Citation2006; Matsuzaka et al., Citation2004). The inclusion of BMI has generally increased the predictive utility of the regression models (Mahar et al., Citation2011), suggesting that it helps to provide more valid estimates of aerobic fitness. This would seem to justify the adoption of more complex models in youth fitness batteries, such as FitnessGram®, but closer examination has revealed some unintended consequences.
For many existing equations, participants with a higher BMI need to run more laps on the PACER in order to get the same estimated VO2max and to meet FitnessGram® criterion-referenced standards for aerobic fitness (Welk, Laurson, Eisenmann, & Cureton, Citation2011) compared to youth with a lower BMI. The overall (or average) error for estimating groups of people is likely lower when BMI is included, but it is difficult for teachers to explain to students that overweight youth need to perform more laps to meet the standards than normal weight youth. Interestingly, the issue is not specific to the PACER equation since the same issue is evident when BMI is included in equations predicting aerobic capacity from mile run performance (Cureton, Sloniger, O’Bannon, Black, & McCormack, Citation1995). In this case, overweight individuals would receive lower estimates of aerobic capacity than normal weight individuals even if they run the same exact time.
This is not a new problem, but it is rather endemic in measurement research due to how aerobic capacity is quantified and how regression models are developed. In models predicting aerobic capacity expressed as VO2max in mL·kg−1·min−1, regression weights for BMI are always negative because the ratio method of correction (i.e., divide by body mass) overcorrects for body mass (Rogers, Turley, Kujawa, Harper, & Wilmore, Citation1995) and because excess body mass tends to impair running performance (Vanderburgh & Mahar, Citation1995). This negative regression weight then leads to the lower predicted VO2max for those with higher BMI. The inclusion of BMI in these models makes sense psychometrically when the goal is to explain the largest amount of variance, but other considerations are equally (or more) important when developing equations for youth fitness batteries, such as FitnessGram®.
An important consideration in a physical education class context is to balance accuracy with feasibility and interpretability. For example, it is problematic for a teacher to try to explain why one student of a particular age and gender would need to run more laps to reach the Healthy Fitness Zone® than another student of the same age and gender. A related consequence to this logically problematic issue is that the very youth who we might want to encourage the most could be demotivated by the situation. The report by the IOM (now the National Academy of Medicine) referenced earlier specifically emphasized the importance of evaluating fitness based on performance and not on anthropometric predictors, so it is important to develop performance-based prediction models suitable for use in youth fitness batteries such as FitnessGram®. The present study addresses this gap by documenting the development and validation of the model currently used in the FitnessGram® to estimate VO2max from PACER performance in 10- to 18-year-old boys and girls. Comparisons are provided between models with and without BMI to help characterize the measurement issues involved in this youth fitness paradox.
Methods
Participants
Participants were 280 children and adolescents (141 girls, 139 boys) aged 10–18 years. The study was approved by the university Institutional Review Board. Written informed consent was obtained from parents/guardians and assent was obtained from participants. Data were examined for outliers; one standardized residual score greater than 2.5 was found and deleted from the analyses.
Procedures
Each participant completed two sessions. For the first session, participants were familiarized to treadmill exercise and the PACER test. Most participants reported previous experience with both the PACER and treadmill exercise. Height, body mass, skinfolds, and one of two aerobic fitness measures (maximal treadmill test or PACER test) were assessed during the first session. The other aerobic fitness measure was completed during the second session and the order of aerobic fitness measures was counterbalanced.
Height was assessed with a wall-mounted stadiometer (Perspective Enterprises, Portage, MI). Body mass (Healthometer, Boca Raton, FL) was measured and body mass index (BMI) was calculated by standard formula. Skinfolds were assessed with Lange skinfold calipers (Cambridge, MD). Percent fat was estimated using the triceps and calf skinfold equations of Slaughter et al. (Citation1988).
The PACER was completed following standard procedures (Meredith & Welk, Citation2010). Participants ran from one starting line to a parallel line 20-m away, while keeping pace with a prerecorded audio cadence. The cadence was set to music, started slowly, and progressively got faster every minute. Participants were asked to keep up with the cadence for as long as possible. The test was terminated when a participant was unable to complete two consecutive laps in the allotted time or voluntarily dropped out due to fatigue. The number of laps completed was recorded. Several authors have reported high (Léger et al., Citation1988; Mahar et al., Citation1997) to moderate (Beets & Pitteti, Citation2006) estimates of reliability for the PACER in participants similar in age to those in the present study.
The graded exercise test was conducted using a Trackmaster (model TMX425C, Carrollton, TX) or Quinton (model Q65, Bothell, WA) treadmill following standard procedures. Different treadmill protocols were used depending on participant age, but participants ran to exhaustion to enable estimation of peak oxygen consumption (VO2max). Treadmill protocols were developed or selected based upon general fitness characteristics for particular ages. For example, younger participants were less likely than older participants to be able to maintain running pace for 3-min stages. Thus, protocols with 1-min stages were used for younger participants (Mahar et al., Citation2011, Citation2006). For participants aged 10 and 11 years, treadmill speed was set at 2.5 mph for the fırst minute and increased by 0.5 mph each minute until 5.0 mph was reached. Treadmill grade was maintained at 0% until 5.0 mph was reached. If a participant did not achieve a maximal effort before 5.0 mph, speed was then maintained and grade was increased by 3% each minute until the participant was no longer able to continue. For girls aged 12 to 16 years, the speed of the treadmill was increased to 5.0 mph within the fırst minute. This speed was maintained for the remainder of the test. For boys aged 12 to 16 years, speed was increased to 5.5 mph within the fırst minute and maintained thereafter. For both girls and boys aged 12 to 16 years, at the beginning of the second minute, the treadmill grade was increased to 2%. Every minute thereafter, the treadmill grade was increased by an additional 2% until the participant was no longer able to continue. Older participants (aged 17–18 years) completed the maximal treadmill test following the Bruce protocol, as this protocol was judged likely to elicit maximal efforts in this age group.
VO2 was assessed using a COSMED K4b2 portable metabolic system (Cosmed SRL, Rome, Italy) for participants aged 10, 11, 15, 16, 17, and 18 years. For participants aged 12–14 years, VO2 was assessed using a Consentius Technologies-ParvoMedics TrueMax 2400 metabolic measurement system (Salt Lake City, UT). Prior to testing, the systems were calibrated using known concentration sample gases. VO2max was accepted as a maximal index if two of the following conditions were satisfıed: participants showed signs of intense effort (e.g., hyperpnea, facial flushing and grimacing, unsteady gait, sweating) (Rowland, Citation1993); peak heart rate reached a value at least 90% of age-predicted maximal heart rate (i.e., 220-age); and respiratory exchange ratio (RER) ≥ 1.0 (Armstrong & Welsman, Citation1994). Heart rate was monitored throughout the test with a Polar heart rate monitor (Polar Electro, Inc., New Hyde Park, NY). Acceptable estimates of reliability of measured VO2max in participants fairly similar in age to those in the present study were reported by Boileau, Bonen, Heyward, and Massey (Citation1977) (r = .87) and by Pivarnik, Dwyer, and Lauderdale (Citation1996) (R = .93).
Validation and cross-validation samples
The full data set was formed from data collection on four age groups (10–11 years, 12–14 years, 15–16 years, and 17–18 years). Data for youth ages 10 to 16 years were described in a previous publication (Mahar et al., Citation2011), but the collection of additional data on older adolescents was important to allow development of a model that covered the entire age range of interest in the FitnessGram® program. To allow cross-validation of the prediction equations developed in this study, validation and cross-validation samples were formed. Approximately one-third of participants were randomly selected for the cross-validation group (n = 93). The remaining participants formed the validation group (n = 187).
Statistical analyses
Multiple regression was used in the validation sample to predict VO2max from the number of laps completed on the PACER, gender, age, and BMI. After examination of scatterplots, a quadratic term for PACER laps was tested. In addition, two interaction terms (i.e., age × gender; gender × PACER laps) were entered into the model to examine whether they contributed signifıcantly to the prediction. The equations developed on the validation sample were applied to the cross-validation sample and to the total sample. The Pearson correlation coeffıcients between measured VO2max and VO2max predicted from the equations developed in the current study were calculated. Prediction error was assessed with two equations. The standard error of estimate (SEE) was calculated as: SEE = SY√1 – R2YY’. The cross-validation SEE (referred to as total error [TE]) was calculated as: TE = √Σ(Y – Y′)2/N. For these equations, Y is measured VO2max and Y′ is VO2max estimated from an equation developed in the current study. Comparison of these two error estimates quantifıed the overestimation or underestimation on prediction accuracy.
Analyses were conducted to determine whether the regression equations developed on the validation and cross-validation samples were the same. Because the intercept and regression coefficients from the equations developed on the cross-validation sample were within the 95% CIs of the equations developed on the validation sample, the validation and cross-validation samples were deemed statistically similar and combined to form a total sample. Regression analyses were performed on the total sample to develop the most robust and representative equations, which are recommended for use. Residual plots are presented to examine regression model assumptions and allow inspection of prediction bias for participants categorized by FitnessGram® standards (Meredith & Welk, Citation2010) for body composition and for aerobic fitness.
The final analyses were conducted in a criterion-referenced framework. Values of measured VO2max and VO2max predicted from each of the previously developed models were categorized using the FitnessGram® standards (Meredith & Welk, Citation2010). The following categories were used: Healthy Fıtness Zone (HFZ); Needs Improvement Zone (NIZ); and Needs Improvement Zone-Health Risk (NIZ–HR). Proportion of agreement, modifıed kappa, and phi coeffıcient between measured and predicted VO2max were calculated.
Results
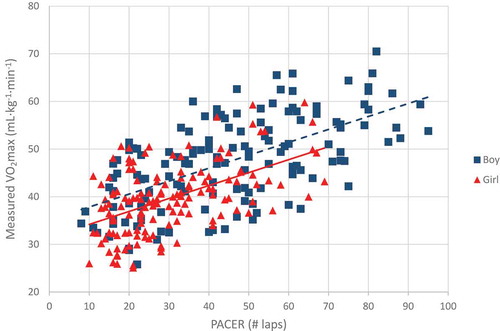
Descriptive statistics are presented in . Validation and cross-validation samples did not differ significantly (p > .05) on any variable. The Pearson correlation between measured VO2max and PACER performance was .65 in both the validation and cross-validation samples. presents the scatterplot between measured VO2max and PACER performance. Zero-order correlations between measured VO2max and predictor variables are presented in .
Table 1. Descriptive statistics (M ± SD) for validation sample, cross-validation sample, and total sample.
Table 2. Zero-order correlations between measured VO2max (mL·kg−1·min−1) and predictor variables for validation sample, cross-validation sample, and total sample.
Figure 1. Scatterplot of measured VO2max and PACER performance.
In the full regression model, gender and the two interaction terms were not statistically significant (p > .05) predictors of VO2max. Further analyses omitted these variables. provides the regression coefficients and accuracy information for regression models developed on the validation sample, cross-validation sample, and total sample. Standardized regression coefficients demonstrated that PACER performance (β = 0.707) was a stronger predictor of VO2max than either age (β = −0.223) or BMI (β = −0.138). All predictors in the models developed on the validation group and total sample contributed significantly (p < .05) to the prediction of measured VO2max.
Table 3. Multiple regression models to estimate VO2max (mL·kg−1·min−1).
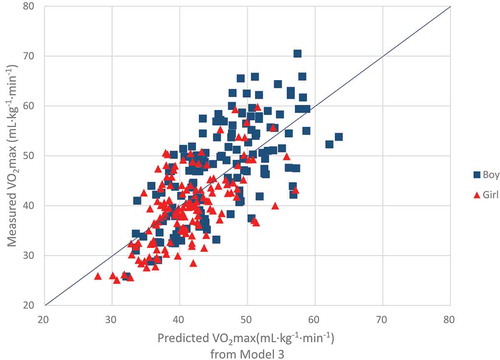
presents the accuracy of the equations developed on the validation group when applied to the cross-validation group and to the total sample. The accuracy of the models was confirmed on both the cross-validation sample and total sample. Mean estimated VO2max did not differ significantly from measured VO2max (p > .05) for any model. Model 2 (PACER and Age as predictors) and Model 3 (PACER, Age, and BMI as predictors) were slightly more accurate (higher correlations and smaller standard errors of estimate) than Model 1 (only PACER as predictor), but the differences in accuracy between Model 2 and Model 3 were trivial. The correlations between measured and estimated VO2max for Model 2 and Model 3 ranged between .70 and .72 and SEEs were nearly identical (approximately 6.5 mL·kg−1·min−1). Scatterplots between measured and predicted VO2max for Model 2 and Model 3 for the total sample are provided in and , respectively.
Table 4. Cross-validation analysis of regression models developed on validation sample applied to cross-validation sample and total sample, (mL·kg−1·min−1).
Figure 2. Scatterplot of measured VO2max and predicted VO2max from Model 2; Model 2: VO2max = 45.619 + (PACER * 0.353) – (Age * 1.121).
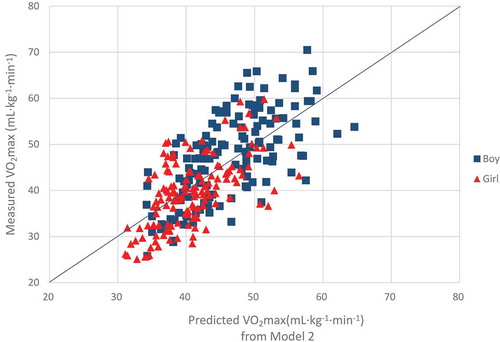
Figure 3. Scatterplot of measured VO2max and predicted VO2max from Model 3; Model 3: VO2max = 49.642 + (PACER * 0.338) – (Age * 0.867) – (BMI * 0.333).
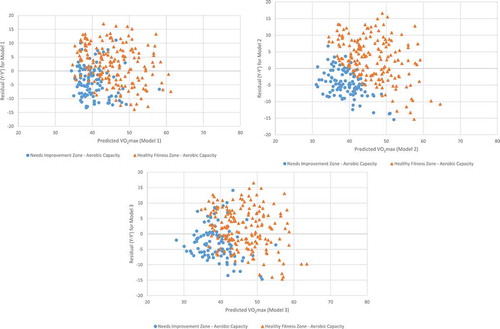
presents residual plots for the three models, with participants identified by body mass index classification (i.e., HFZ v. NIZ). The dispersion of the points generally appears random and even throughout the plots, indicating that the assumptions of linearity and homoscedasticity were met. In addition, these plots generally show no pattern to suggest biased estimates for participants in the HFZ or NIZ. presents residual plots for the three models, with participants identified by aerobic fitness classification (i.e., HFZ v. NIZ). Inspection of these plots suggest a small bias, whereby VO2max was overestimated in a slightly greater proportion of participants classified as NIZ than expected.
Figure 4. Residual plots for regression Models, with participants categorized by FitnessGram body composition standards. a. Residual plot for Model 1, with participants categorized by FitnessGram body composition standards. b. Residual plot for Model 2, with participants categorized by FitnessGram body composition standards. c. Residual plot for Model 3, with participants categorized by FitnessGram body composition standards. Model 1: VO2max = 31.894 + (PACER * 0.309); Model 2: VO2max = 45.619 + (PACER * 0.353) – (Age * 1.121; Model 3: VO2max = 49.642 + (PACER * 0.338) – (Age * 0.867) – (BMI * 0.333).
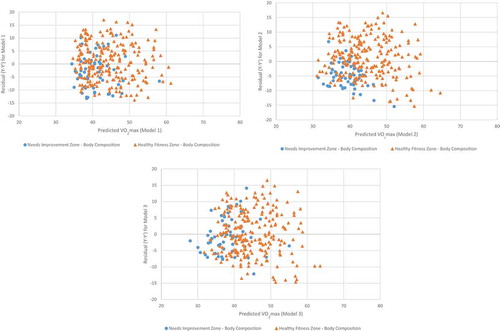
Figure 5. Residual plots for regression Models, with participants categorized by FitnessGram aerobic fitness standards a. Residual plot for Model 1, with participants categorized by FitnessGram aerobic fitness standards. b. Residual plot for Model 2, with participants categorized by FitnessGram aerobic fitness standards. c. Residual plot for Model 3, with participants categorized by FitnessGram aerobic fitness standards. Model 1: VO2max = 31.894 + (PACER * 0.309); Model 2: VO2max = 45.619 + (PACER * 0.353) – (Age * 1.121; Model 3: VO2max = 49.642 + (PACER * 0.338) – (Age * 0.867) – (BMI * 0.333).
Performance of the regression equations in a criterion-referenced framework was examined on the total sample. presents the proportion of agreement, modified kappa, and phi coefficients to examine accuracy of categorization using measured VO2max versus VO2max estimated from the prediction models. Based on measured and estimated VO2max participants were categorized into one of three zones (HFZ, NIZ, or NIZ-HR) based on FitnessGram® criterion-referenced standards (Meredith & Welk, Citation2010). Classification agreement was similar for Model 2 and Model 3, with correct classification of 65% of participants into one of the three categories. presents confusion matrices used to evaluate the categorical estimates of VO2max from the three regression models developed on the total sample. Approximately 62% of participants were categorized into the Healthy Fitness Zone based on measured VO2max. The percentage of participants classified into the Healthy Fitness Zone based on predicted VO2max was similar for all regression models (63–64%). For all prediction models, between 13% and 14% of participants were incorrectly classified into the HFZ and between 12% and 13% of participants who had healthy levels of aerobic fitness were incorrectly classified into one of the NI zones.
Table 5. Classification agreement with measured VO2max (mL·kg−1·min−1; N = 280).
Table 6. Confusion matrices for classification of participants from measured VO2max and VO2max estimated from the three regression models developed on total sample (values indicate number of participants in each cell).
Discussion
The PACER is a popular field test used to estimate aerobic fitness, but debate exists about the appropriateness of specific predictor variables (e.g., BMI) used for field-based research or school fitness programs. Previously published equations were developed with relatively small samples or on samples with small age ranges. The current study, conducted on a large sample of children and adolescents over a wide range of ages, provides validity evidence for the PACER equation currently used in the FitnessGram® national youth fitness test (i.e., Model 2 with PACER laps and Age as predictors). The study also provides novel insights and clarity about the utility of different predictor variables. A major contribution of this study was the development of models that do not include BMI as a predictor to enable fitness to be evaluated purely based on performance. The analyses provided an evaluation of the potential improvement in overall accuracy for group level estimation when a measure of body composition is included as a predictor. Results demonstrated that little improvement in accuracy resulted when BMI was added to the regression model for estimates of VO2max or in overall classification accuracy. However, the accuracy of the equations was only moderate as reflected by standard errors of estimate of approximately 6.5 mL·kg−1·min−1.
Thus, it appears that researchers and practitioners can use the model developed with PACER performance and Age as predictors (without BMI as a predictor) to estimate aerobic fitness nearly as accurately as when BMI is included in the model. This has major implications for practitioners and teachers. As described, a consequence of using BMI as a predictor of VO2max is that participants with higher BMIs would need to complete more laps on the PACER than individuals with lower BMIs in order to achieve the same estimated VO2max. The end result could be that two individuals of the same age and gender complete the same number of laps on the PACER (i.e., equivalent absolute running performance), and the person with the lower BMI may pass the test (i.e., be classified into the HFZ), while the individual with the higher BMI fails the test (i.e., be classified into a NI zone). This situation would place physical education teachers in the difficult situation of trying to explain the subtleties and caveats of regression models to children to justify how two children could perform the same (i.e., run the same number of laps) and yet receive different evaluations of that performance. The ethical dilemma of potentially discouraging overweight youths who might complete the same number of laps as leaner counterparts, but find that they do not meet the HFZ should also be considered. Use of Model 2 (i.e., regression equation without BMI as a predictor) would eliminate this complex situation.
In a review of criterion-related validity evidence for the 20-m multistage shuttle run, Mayorga-Vega, Aguilar-Soto, and Viciana (Citation2015) reported an overall weighted (by sample size) mean correlation between 20-m shuttle run performance and measured VO2max for children of .72. They noted that, in samples of children, 51% of the correlations between shuttle run performance and measured VO2max were ≤ .70. The corresponding value of .65 from the current study is fairly close to the mean reported correlation. Mayorga-Vega et al. also noted that gender and level of VO2max did not substantially alter the value of the criterion-related validity coefficients. In the current study, correlations between measured VO2max and VO2max estimated from Model 2 (PACER performance and Age as predictors) and Model 3 (PACER performance, Age, and BMI as predictors) were only slightly higher for boys than for girls (Model 2: RYY’ = .61 for girls and .66 for boys; Model 3: RYY’ = .63 for girls and .68 for boys).
The overall correlations between measured and estimated VO2max (R ~ .70) were similar to the corresponding correlations reported by Cureton et al. (Citation1995) (R = .71) and Castro-Piñero, Mora, Gonzalez-Montesinos, Sjöström, and Ruiz (Citation2009) (R = .70) for the 1-mile run/walk equation. Burns et al. (Citation2016) reported a correlation of .81 between measured VO2max and VO2max estimated by 1-mile run/walk speed and the age by gender interaction in 13- to 16-year-olds. Notably, the Burns et al. model did not use BMI as a predictor. They noted that the introduction of body composition variables (BMI or percent fat) into the regression models did not increase the proportion of variance explained in aerobic fitness after the other predictors were entered. In the current study, although BMI was a significant predictor of measured VO2max in Model 3, the correlation between BMI and measured VO2max (r = .28) was not high. Few published PACER studies have reported the zero-order correlations between BMI and measured VO2max. In a sample of 90 males and females aged 13 to 16 years, Burns et al. (Citation2016) reported a non-significant correlation of -.18 between BMI and measured VO2max. In the current study, it is likely that the intercorrelation of the predictor variables Age and BMI of r = .40 and the low correlation between BMI and measured VO2max contributed to the failure of BMI to add substantially to the prediction of VO2max.
In some situations, classification accuracy is the most important aspect of the accuracy of field tests of youth fitness, such as when teachers administer the FitnessGram® and categorize participants into one of three fitness zones. The FitnessGram® report provides youths with an estimate of VO2max and the fitness category into which they are classified. Participants with estimated values of VO2max above the criterion-referenced standard for their age and gender are classified into the Healthy Fitness Zone, indicating adequate levels of aerobic fitness for health. Participants with estimated values of VO2max below the criterion-referenced standard are categorized into one of two Needs Improvement zones. Results indicated that criterion-referenced validity evidence was similar for Model 2 (PACER and Age as predictors) and Model 3 (PACER, Age, and BMI as predictors), indicating no meaningful improvement in classification accuracy when BMI is included in the regression model. The overall classification accuracy might be characterized as moderate (Altman, Citation1990; Landis & Koch, Citation1977). This level of confidence in classification accuracy should be considered when interpretive statements are designed.
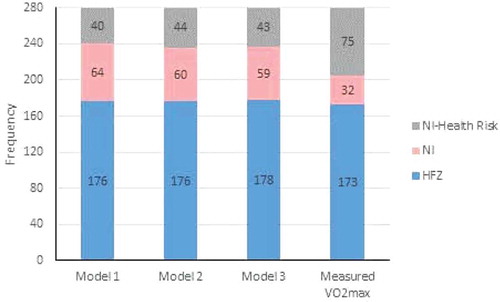
Aerobic fitness is associated with cardiovascular disease risk factors in youth (Ortega et al., Citation2013) and is highly associated with cardiovascular disease mortality in adulthood (Church, LaMonte, Barlow, & Blair, Citation2005). Higher levels of aerobic fitness during childhood are generally associated with higher levels of aerobic fitness during adolescence (Ortega et al., Citation2013) and are also associated with healthier cardiovascular profiles in adulthood (Ruiz et al., Citation2009). Assessment of aerobic fitness during childhood is important for all youth and might be particularly valuable in identifying an at-risk population that could be targeted for an intervention. Because direct measurement of aerobic fitness is time consuming and relatively expensive, field-based tests, like the PACER, provide a valuable alternative. shows that a similar percentage of participants (between 62% and 64%) would be classified into the Healthy Fitness Zone based on direct measurement of aerobic fitness and on PACER estimates of aerobic fitness.
Figure 6. Frequencies of classification by fitness zones for newly developed regression models and measured VO2max. HFZ is Healthy fitness zone, NI is needs improvement zone, NI-health risk is needs improvement-health risk zone. Model 1: VO2max = 31.894 + (PACER * 0.309); Model 2: VO2max = 45.619 + (PACER * 0.353) – (Age * 1.121); Model 3: VO2max = 49.642 + (PACER * 0.338) – (Age * 0.867) – (BMI * 0.333).
Overall, no significant or meaningful differences were found on any variables or on the relationships among variables between the validation and cross-validation groups. Thus, the validation and cross-validation groups were combined into a total sample and regression models were developed on the total sample, similar to the procedures used by Cureton et al. (Citation1995) and Mahar et al. (Citation2006). The models developed on the total sample are recommended for use, as recommended by Staudenmayer, Zhu, and Catellier (Citation2012). Model 2 (PACER performance and Age as predictors) is more practical for use in situations where a large number of participants must be tested than Model 3 (PACER performance, Age, and BMI as predictors) because height and body mass (for calculation of BMI) would not need to be measured. Analyses revealed that minimal loss in predictive accuracy or classification accuracy occurs when using the model without BMI as a predictor. Use of Model 2 also removes the logical and ethical dilemmas of the unintended consequences, which were previously described, of including BMI as a predictor.
Limitations of this study include the administration of the PACER test to individual participants rather than to a group of participants. Although this may have allowed greater assurance that participants provided a maximal effort because of the individual encouragement provided, the PACER is typically administered to a group of participants in a physical education setting. A strength of the current study includes the use of a large age range of youth (10–18 years of age) and a large sample size relative to other criterion-related validity studies of aerobic fitness in youth. This was achieved by combining multiple data sets. It is noted that a larger sample would be preferable to allow additional subgroup analyses. Direct measurement of VO2max by calibrated metabolic systems provided acceptable measures of the criterion measure of aerobic fitness. Two different metabolic systems were used, which can add some variability to measurement of the dependent variable; however, the similar criteria used to judge whether a maximal effort was achieved and the potential increase in generalizability should be considered. In addition, based on the standard deviation of measured VO2max, the sample in the current study exhibited substantial variability in fitness levels, which should provide adequate representation of the population of interest. Finally, the PACER test was conducted indoors, so the effect of weather conditions was not evaluated in the current study.
In summary, regression models to estimate VO2max, with and without BMI as a predictor, were developed. Accuracy of the regression models to estimate VO2max and accuracy of classification into fitness zones were presented. Results demonstrated that minimal improvement in accuracy occurs when BMI is added as a predictor. The model currently used in the FitnessGram®, with PACER performance and Age as predictors, provides practical utility and is as accurate as the model with BMI included as a predictor.
Acknowledgments
This work was partially supported by a grant from The Cooper Institute to the corresponding author. The authors wish to express their appreciation to research assistants Ashley Guerieri, Tyler Hall, Matthew Hanna, Douglas Lloyd, and Hoyong Sung for data collection and participant recruitment.
References
- Altman, D. G. (1990). Practical statistics for medical research. London: Chapman and Hall/CRC.
- Armstrong, N., & Welsman, J. R. (1994). Assessment and interpretation of aerobic fitness in children and adolescents. Exercise and Sport Sciences Reviews, 22, 435–476.
- Barnett, A., Chan, L. Y. S., & Bruce, I. C. (1993). A preliminary study of the 20-m multistage shuttle run as a predictor of a peak VO2 in Hong Kong Chinese students. Pediatric Exercise Science, 5, 42–50. doi:10.1123/pes.5.1.42
- Beets, M. W., & Pitetti, K. H. (2006). Criterionreferenced reliability and equivalency between the PACER and 1-mile run/walk for high school students.. Journal of Physical Activity and Health, 3(Suppl. 2), S21–S33.
- Boileau, R. A., Bonen, A., Heyward, V. H., & Massey, B. H. (1977). Maximum aerobic capacity on the treadmill and bicycle ergometer of boys 11–14 years of age. Journal of Sports Medicine, 17, 153–162.
- Burns, R. D., Hannon, J. C., Brusseau, T. A., Eisenman, P. A., Shultz, B. B., Saint-Maurice, P. F., … Mahar, M. T. (2016). Development of an aerobic capacity prediction model from one-mile run/walk performance in adolescents aged 13–16 years. Journal of Sports Sciences, 34, 18–26. doi:10.1080/02640414.2015.1031163
- Castro-Piñero, J., Mora, J., Gonzalez-Montesinos, J. L., Sjöström, M., & Ruiz, J. R. (2009). Criterion-related validity of the one-mile run/walk test in children aged 8–17 years. Journal of Sports Sciences, 27, 405–413. doi:10.1080/02640410802603889
- Church, T. S., LaMonte, M. J., Barlow, C. E., & Blair, S. N. (2005). Cardiorespiratory fitness and body mass index as predictors of cardiovascular disease mortality among men with diabetes. Archives of Internal Medicine, 165, 2114–2120. doi:10.1001/archinte.165.18.2114
- Cureton, K. J., Sloniger, M. A., O’Bannon, J. P., Black, D. M., & McCormack, W. P. (1995). A generalized equation for prediction of VO2peak from 1-mile run/walk performance. Medicine and Science in Sports and Exercise, 27, 445–451. doi:10.1249/00005768-199503000-00023
- Institute of Medicine. (2012). Fitness measures and health outcomes in youth. Washington, DC: The National Academies Press.
- Landis, R., & Koch, G. G. (1977). The measurement of observer agreement for categorical data. Biometrics, 33, 159–174. doi:10.2307/2529310
- Léger, L. A., Mercier, D., Gadoury, C., & Lambert, J. (1988). The multistage 20 meter shuttle run test for aerobic fitness. Journal of Sports Science and Medicine, 6, 93–101. doi:10.1080/02640418808729800
- Mahar, M. T., Guerieri, A. M., Hanna, M. S., & Kemble, C. D. (2011). Estimation of aerobic fitness from 20-m multistage shuttle run test performance. American Journal of Preventive Medicine, 41(Suppl. 2), S117–S123. doi:10.1016/j.amepre.2011.07.008
- Mahar, M. T., Rowe, D. A., Parker, C. R., Mahar, F. J., Dawson, D. M., & Holt, J. E. (1997). Criterion-referenced and norm-referenced agreement between the mile run/walk and PACER. Measurement in Physical Education and Exercise Science, 1, 245–258. doi:10.1207/s15327841mpee0104_4
- Mahar, M. T., Welk, G. J., Rowe, D. A., Crotts, D. J., & McIver, K. L. (2006). Development and validation of a regression model to estimate VO2peak from PACER 20-m shuttle run performance. Journal of Physical Activity and Health, 3(Suppl. 2), S34–S46. doi:10.1123/jpah.3.s2.s34
- Matsuzaka, A., Takahashi, Y., Yamazoe, M., Kumakura, N., Ikeda, A., Wilk, B., & Bar-Or, O. (2004). Validity of the multistage 20-m shuttle-run test for Japanese children, adolescents, and adults. Pediatric Exercise Science, 16, 113–125. doi:10.1123/pes.16.2.113
- Mayorga-Vega, D., Aguilar-Soto, P., & Viciana, J. (2015). Criterion-related validity of the 20-M shuttle run test for estimating cardiorespiratory fitness: A meta-analysis. Journal of Sports Science and Medicine, 14, 536–547.
- Meredith, M. D., & Welk, G. J. (Eds.). (2010). FitnessGram & ActivityGram test administration manual (Updated 4th ed. ed.). Champaign, IL: Human Kinetics.
- Ortega, F. B., Ruiz, J. R., Labayen, I., Hurtig-Wennlo, A., Harro, J., Kwak, L., … Sjöström, M. (2013). Role of socio-cultural factors on changes in fitness and adiposity in youth: A 6-year follow-up study. Nutrition, Metabolism and Cardiovascular Diseases, 23, 883–890. doi:10.1016/j.numecd.2012.05.008
- Pivarnik, J. M., Dwyer, M. C., & Lauderdale, M. A. (1996). The reliability of aerobic capacity (VO2max) testing in adolescent girls. Research Quarterly for Exercise and Sport, 67, 345–348. doi:10.1080/02701367.1996.10607962
- Rogers, D. M., Turley, K. R., Kujawa, K. I., Harper, K. M., & Wilmore, J. H. (1995). Allometric scaling factors for oxygen uptake during exercise in children. Pediatric Exercise Science, 7, 12–25. doi:10.1123/pes.7.1.12
- Rowland, T. W. (1993). Does peak VO2 reflect VO2max in children?: Evidence from supramaximal testing. Medicine and Science in Sports and Exercise, 25, 689–693.
- Ruiz, J. R., Castro-Piñero, J., Artero, E. G., Ortega, F. B., Sjöström, M., Suni, J., & Castillo, M. J. (2009). Predictive validity of health-related fitness in youth: A systematic review. British Journal of Sports Medicine, 43, 909–923. doi:10.1136/bjsm.2008.056499
- Slaughter, M. H., Lohman, T. G., Boileau, R. A., Horswill, C. A., Stillman, R. J., Van Loan, M. D., & Bemben, D. A. (1988). Skinfold equations for estimation of body fatness in children and youth. Human Biology, 60, 709–723.
- Staudenmayer, J., Zhu, W., & Catellier, D. J. (2012). Statistical considerations in the analysis of accelerometry-based activity monitor data. Medicine and Science in Sports and Exercise, 44(Suppl.), S61–S67. doi:10.1249/MSS.0b013e3182399e0f
- Vanderburgh, P. M., & Mahar, M. T. (1995). Scaling of 2-mile run times by body weight and fat-free weight in college-age men. Journal of Strength and Conditioning Research, 9(2), 67–70.
- Welk, G. J., Laurson, K. R., Eisenmann, J. C., & Cureton, K. J. (2011). Development of youth aerobic-capacity standards using receiver operating characteristic curves. American Journal of Health Promotion, 41(Suppl.), S111–S116. doi:10.1016/j.amepre.2011.07.007