
ABSTRACT
The main aim of this study was to assess the criterion validity of the Sedentary Behavior Questionnaire (SBQ) to measure SB in community-dwelling older adults using thigh-measured accelerometry as the criterion method. 801 participants (75.6 ± 6.1 years old, 57.6% females) provided valid thigh-based accelerometer data (activPAL/Axivity) and completed the SBQ. Criterion validity was assessed using Spearman’s Rho coefficients. Bland–Altman plots, including 95% limits of agreement and Intraclass Correlation Coefficient (ICC), were used to assess the agreement between self-report and device-measured daily SB time. Strength of the association was examined using multiple linear regression. There was a weak correlation (Rho = 0.25, p < .001) between self-reported and device-based SB measures. The SBQ under-estimated daily SB time compared to accelerometry. Our results highlighted an overall weak-to-moderate correlation between measures, with significant differences between each country’s version. Researchers should be cautious when using the SBQ to provide an estimation of SB time in older adults.
Introduction
Reducing sedentary behavior, defined as any waking behavior characterized by an energy expenditure ≤1.5 metabolic equivalents (METs) while in a sitting, reclining or lying posture (Tremblay et al., Citation2017), has been recognized as an important public health target in older adults (De Rezende et al., Citation2014; Sparling et al., Citation2015). Older adult populations exhibit the highest levels of sedentary behavior, spending up to 80% of their waking hours sitting (Giné-Garriga et al., Citation2020; Harvey et al., Citation2015; Wullems et al., Citation2016). Researchers have demonstrated that sitting or lying for prolonged periods of time is negatively associated with health status (Ku et al., Citation2018; Wilson et al., Citation2019). Pavey and colleagues (Citation2015) highlighted that older women who sat 8 to 11 hours/day and those who sat ≥11 hours/day had 1.45 and 1.65 times higher risk of all-cause mortality respectively, compared to older women who sat less than 4 hours per day. High levels of sedentary behavior have also been associated with increased levels of social isolation in older adults (Tully et al., Citation2019). Though the cost of sedentary behavior to the UK national health service has been estimated as £0.8 billion in the 2016–2017 financial year (Heron et al., Citation2019), the actual burden is likely to be higher, considering the broader societal costs associated with sedentary behavior. The negative health consequences of high levels of sedentary behavior appear to hold true even for those who meet the physical activity recommendations of the World Health Organization (WHO), of at least 150 minutes per week of moderate-intensity physical activity, but higher levels of physical activity may ameliorate this effect (Ekelund et al., Citation2016; Katzmarzyk et al., Citation2009; Keith P. Gennuso et al., Citation2013; Patel et al., Citation2010; Van Der Ploeg et al., Citation2012; Van Uffelen et al., Citation2010).
Accurate measurement of sedentary behavior is important in order to facilitate rigorous scientific evaluations of interventions designed to reduce sedentary behavior. Device-based (e.g. hip-worn ActiGraph accelerometer; wrist-worn Axivity accelerometer; and thigh-worn activPAL accelerometer) and self-reported measures (e.g. Sedentary Behavior Questionnaire (SBQ); Measuring Older Adults Sitting Time (MOST); International Physical Activity Questionnaire (IPAQ); LASA Sedentary Behavior Questionnaire) are available. Self-report questionnaires have been predominantly used in large scale studies due to low administration cost and due to providing more information about the context of behavior (e.g. watching television, reading, playing computer/video games, driving/riding in a car). Nevertheless, some limitations such as recall bias and the underestimation of sedentary time are likely with self-reported measures (Aguilar-Farías, Brown, Olds et al., Citation2014a). The SBQ is a self-report instrument developed to evaluate the amount of time doing nine context-specific behaviors on weekdays and weekend days. The English-language version has been validated in overweight adults (Rosenberg et al., Citation2010); an adapted Spanish-language version was validated in patients with fibromyalgia (Munguía-Izquierdo et al., Citation2013); and a Turkish-language version in an adult population (Bakar et al., Citation2018). A recent study compared the Slovenian version of the SBQ (weekdays) against the activPAL3 micro also in an adult population (Kastelic & Šarabon, Citation2019). However, there are currently no studies that have validated the use of the SBQ in older adults. There has also been a lack of validation studies of self-reported sedentary behavior measures in languages other than in English in older adults.
Authors of a recent study have shown minor differences assessing different physical behaviors, as well as both sitting and lying, between three different accelerometers placed at the thigh (ActiGraph GT3X, activPAL micro and the Axivity AX3). Researchers suggested that raw data should be processed and analyzed in an identical manner (Crowley et al., Citation2019). However, some limitations for using accelerometers include their high cost and the added complexity when using them in large cohort studies, including participant’s responsibility to wear the device for at least seven days to provide representative data as shown in previous studies (Hart et al., Citation2011). Older adults have reported additional challenges such as mild skin irritation with continuous wear (Van Der Berg et al., Citation2016), forgetting to replace the belt in the morning after removing it for sleeping and finding the device uncomfortable (Schrack et al., Citation2014). Thus, assessing the validity of self-report questionnaires such as the SBQ is especially relevant in the older adult population.
Therefore, the main aim of this study was to assess the criterion validity of the SBQ to measure sedentary behavior in community-dwelling older adults using thigh and hip accelerometry. Our secondary aim was to validate the English, Spanish, German and Danish versions of the SBQ in the same population.
Materials and methods
Study design & participants
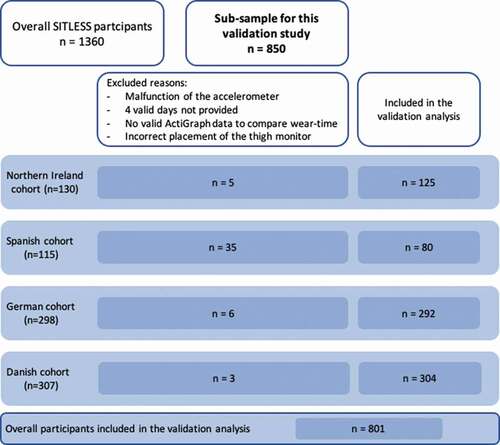
This validation study used a cross-sectional design using baseline data collected from the SITLESS study. Briefly, the SITLESS study was a multi-center pragmatic three-armed randomized controlled trial which aimed to determine whether exercise referral schemes could be enhanced by self-management strategies to reduce sedentary behavior, increase physical activity levels and improve health in the long-term in community-dwelling European older adults (≥65 years old). Full details of the study were described elsewhere (Giné-Garriga et al., Citation2017). All participants gave their informed consent prior to participation. From the overall SITLESS participants (N = 1360), a subsample of 801 participants (mean age 75.6 ± standard deviation 6.1 years old and 57.6% females) who answered all items in the SBQ and provided valid thigh-based accelerometry data in the baseline assessment were included in this validation study (see )
Figure 1. Sample flowchart.
Measurements & procedures
Sedentary behavior questionnaire (SBQ)
The SBQ version used was previously validated against self-reported measures by Rosenberg et al. (Citation2010) in overweight male adults. Data showed an acceptable intraclass correlation coefficient (ICC) for all items and the total scale (range = 0.51–0.93), and significant relationships between SBQ items and the International Physical Activity Questionnaire (IPAQ) sitting time and body mass index (BMI). The SBQ assessed the amount of time spent doing nine context-specific behaviors during weekdays and weekend days, with the question ‘on a typical weekday or weekend day, how much time do you spend (from when you wake up until you go to bed) doing the following?’: watching television; playing computer/video games; sitting while listening to music; sitting and talking on the phone; doing paperwork or office work; sitting and reading a book or magazine; playing a musical instrument; doing arts and crafts; and sitting and driving/riding in a car or train. The possible responses options were: none, 15 minutes or less, 30 minutes, 1 hour, 2 hours, 3 hours, 4 hours, 5 hours, or 6 hours or more. To obtain daily time sitting or lying, weekday hours were multiplied by five and weekend hours were multiplied by two; summed hours per week were divided by seven and finally multiplied by 60 to give minutes in sedentary behavior per day.
Translation process
The translation and adaptation from English language to Spanish, German and Danish was completed following the recommendations of Hambleton (Citation2005). The direct and inverse translation method in each language was completed by two independent bilingual translators to identify any discrepancies between the meaning of the translation and the original questionnaire. After a final consensus, researchers and translators generated the final versions of the questionnaires in Spanish, German and Danish.
Accelerometry
Participants were asked to wear an accelerometer on their dominant thigh continuously (24 hours/day) for seven consecutive days after completion of the SBQ. Two types of thigh accelerometers were used according to their availability at each site. The cohorts from Spain and Germany (n = 372) wore the activPAL3c (PAL technologies, Glasgow, Scotland) and the cohort from Northern Ireland and Denmark (n = 429) wore the Axivity AX3 (AXIVITY Ltd., Newcastle, UK). The activPAL (weighing 9 g and measuring 25x45x5mm) was initialized using activPAL Professional Software (version 7.2.38.2) with a sampling frequency of 20 Hz and a g range of ±2 g and the Axivity (weighing 11 g and measuring 23x32,5x7,6 mm) was initialized using Open Movement OmGui Software (version 1.0.0.43) with a sampling frequency of 50 Hz and a g range of ±8 g. The activPAL and Axivity accelerometers were positioned on the dominant thigh midway between the anterior superior iliac spine and the patellar tendon and attached using a waterproof transparent film (hypoallergenic Tegaderm foam adhesive dressing, 3 M, USA). For the purposes of determining accelerometer wear time for this specific study, participants were also asked to simultaneously wear the ActiGraph wGT3X-BT + (ActiGraph LLC, Pensacola, FL, USA) alongside the thigh accelerometer. The ActiGraph device was placed on the dominant hip using an elastic belt, just above the iliac crest, during waking hours only (removed during nighttime sleep and water-based activities) for seven consecutive days. The ActiGraph wGT3X-BT (weighing 19 g and measuring 46x33x15 mm) was initialized using the ActiLife (version 6.13.4) software with a sampling frequency of 30 Hz and a g range of ±6 g (Robusto & Trost, Citation2012).
Data from both thigh-based accelerometers were pooled together and harmonized. Sedentary behavior time (i.e. combined sitting/lying time) for the Axivity AX3 data was classified using the method described by Skotte et al. (Citation2014). This method uses threshold values of standard deviation of acceleration, angle and also inclination to determine different types of activities, including sedentary behavior (Skotte et al., Citation2014). This method has demonstrated an excellent sensitivity and specificity (93 to 100%) in semi-standardized and free-living settings (Crowley et al., Citation2019). Sedentary behavior time from the activPAL was classified by the activPAL Professional Software (version 7.2.38.2) algorithm because the activPAL3 uses a lower sampling frequency compared to the Axivity (i.e. 20 vs 50 Hz). The activPAL3 also covers a more limited g range (±2 g) compared to the Axivity (±8 g). The assessment of daily sedentary behavior time from each thigh-worn accelerometer was restricted to wear time extracted from the .agd files generated by the hip-worn ActiGraph. Wear time information in the .agd files was identified using the Choi 2011 wear time algorithm using the ActiLife software (Giné-Garriga et al., Citation2020). With a small number of participants, it was observed that while the ActiGraph had been worn, the thigh-based accelerometer had not been worn in conjunction or suffered from a malfunction. In order to exclude these days from the analysis, the output derived from the harmonization process were subsequently manually cleaned by two authors (JJW and MS). The cleaning process ensured only valid days were included (at least four valid days (including one weekend day) and ≥600 minutes/day wear time) as suggested in previous studies (Migueles et al., Citation2017). Daily sedentary time, normalized at a daily level, was then calculated from the thigh-based monitors once the cleaning process had been completed.
Additional data
Additional data were included to describe the sample including age (years), sex (male and female), country (Northern Ireland, Spain, Germany and Denmark), BMI (kg/m2; using the Tanita BC 420 bioelectrical impedance scales and a Seca 213 portable stadiometer) to categorize weight status (normal and underweight: <25 kg/m2; overweight: 25–29.9 kg/m2; obese: >30 kg/m2), Short Physical Performance Battery (SPPB) score to determine low or high physical function (<10 SPPB score or ≥10 SPPB score, respectively) (Guralnik et al., Citation1994) and the Trail Making Test (TMT) (Soukup et al., Citation1998) time to determine cognitive (TMT A; intact <78 seconds; deficient ≥78 seconds)/executive (TMT B; intact ≤180 seconds; mildly reduced ≥181 seconds) function used in several studies (Bowie & Harvey, Citation2006; Roy & Molnar, Citation2013), as well as with an older adult population (Cangoz et al., Citation2009).
Statistical analysis
The chosen analytical approach has been guided by recommendations for validating self-reported behavior (Welk et al., Citation2019). Before conducting analyses, all variables where examined for normality using SShapiro–WilkTest or KKolmogorov–SmirnovTest.
Paired samples t-tests were used to assess the differences in the mean values for daily sitting time between self-reported and device-measured daily sedentary behavior time. Correlations were interpreted as follows: coefficient value between ± 0.50 and ± 1: strong positive/negative linear relationship or correlation; between ± 0.30 and ± 0.49: moderate positive/negative linear relationship or correlation; below ± 0.29: weak positive/negative linear relationship or correlation (Rumsey, Citation2005). Criterion validity was assessed using nonparametric Spearman’s Rho coefficients.
To assess the agreement between daily sedentary behavior time measured by the SBQ compared to the accelerometer estimated sedentary time, Bland–Altman plots (including the 95% limits of agreement) and Intraclass Correlation Coefficients (ICC) were utilized. The mean difference ± 1.96 x the standard deviation of the mean difference was added to the plot to derive the limits of agreement. These limits defined the interval in which differences between methods could be expected for 95% of future measurements in comparable people (Bland & Altman, Citation2007). Differences of the two measures were checked to be normally distributed (Giavarina, Citation2015). Accelerometer estimated sedentary time was used as the criterion measure; a mean difference close to y = 0 was a good indicator of agreement, as was a confidence interval encompassing y = 0, thus indicating higher levels of agreement with the daily sitting time from the SBQ. We considered wide limits of agreement having a mean difference of more than 240 minute/day of sedentary time according to two previous research studies (Aguilar-Farías et al., Citation2014b; Gilbert et al., Citation2016).
The strength of the association between daily sedentary time measured by the SBQ compared to the accelerometer estimated sedentary time was examined using multiple linear regression with age, gender, country of origin, BMI, SPPB score and TMT times for cognitive and executive functioning as adjustment covariates in the same model.
Additional sub-group analyses were conducted to explore possible differences in the validity of SBQ in different languages (English versus Spanish versus German versus Danish); sex (males versus females); age groups (young-old: 65 to 74 years versus middle-old: 75 to 84 versus oldest-old: >85 years); weight status (normal and underweight versus overweight versus obese); physical functioning (low function versus high function); executive and cognitive functioning (intact executive/cognitive function versus reduced executive/cognitive function).
All statistical analyses were performed using IBM SPSS Statistics 26 (SPSS, Inc, an IBM Company, Chicago, IL, USA) and the significance level was set at p< .05.
Results
Out of 850 participants from the SITLESS study who were asked to wear a thigh accelerometer for seven consecutive days, 801 participants (57.6% female and 75.6 ± 6.1 years old) provided valid data for the SBQ and the thigh-based accelerometers. N = 49 participants were excluded as their data did not meet the pre-specified wear time criteria or there were technical problems with data processing.
Demographic characteristics are presented overall and by country in . Approximately 75% of the overall sample size was overweight or obese. The German cohort had the highest percentage of participants with low physical function (male: 71.5% and female: 77.8%) compared to the other three countries (). Executive and cognitive functions were similar across German, Danish and Northern Irish participants, but Spanish participants had lower executive and cognitive function (21.6% and 50.7%, respectively) ().
Table 1. Descriptive characteristics of the sample by gender and country
The criterion validity of the self-report daily minutes spent in sedentary behavior assessed with the SBQ against accelerometer estimated sedentary behavior is shown in . There was a weak correlation (Rho = 0.25, p < .001) between self-reported and device-based measures. Overall, participants reported an average of 472.9 ± 168.5 mins/day of sedentary behavior with the SBQ. Accelerometers measured an average of 545.9 ± 112.9 mins/day from 865.0 ± 68.0 mins/day of wear time during waking hours. The difference between self-reported and accelerometers was 72.90 mins/day (95% CI −85.45, −60.32; p < .001) with the SBQ underestimating sedentary behavior time compared to the accelerometer estimated sedentary behavior.
Table 2. Daily average minutes spent in sedentary behavior overall and by country from the SBQ and activPAL/Axivity [mean ± standard deviation]; 95% CI; Intraclass Correlation Coefficient (Confidence intervals 95%); Rho Spearman’s correlation; and p value
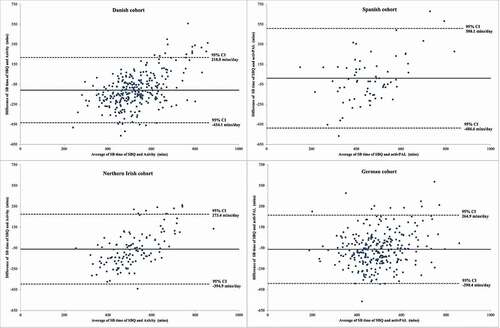
Bland–Altman plots were used to graphically compare the differences between device-based and self-reported measurements (). Overall, participants reported lower daily sitting time using the SBQ with a mean difference of −73.4 mins/day and a wide range of limits of agreement (LoA) (upper LoA = 278.8 mins/day, lower LoA = −425.6 mins/day) compared to the same outcome assessed with the device-based instruments. Divided by country, Northern Irish, German and Danish participants under-reported their time spent in sedentary behavior with a mean difference of −60.7, −62.7 and −108.0 mins/day, respectively (range of upper LoA = 273.4 mins/day, lower LoA = −434.1 mins/day) (). Spanish participants self-reported daily sitting time using the SBQ with a mean difference of 10.75 mins/day although with a wide range of LoA (upper LoA = 508.1 mins/day, lower LoA = −486.6 mins/day) compared to the device-based measured values (). Participants with higher levels of accelerometer measured sedentary behavior tended to overreport their sedentary time in the SBQ; while participants with lower levels of sedentary behavior tended to underreport their sedentary time. This feature can be seen in , markedly for Danish and Northern Irish participants. Overall, ICC data showed a weak agreement between both measures (ICC = 0.32, 95% CI 0.19, 0.43). Weak agreement between measures were also found across each language version ().
Figure 2. Overall Bland-Altman plot. solid line shows the mean different between the two measures; dash lines represent the 95% CI.
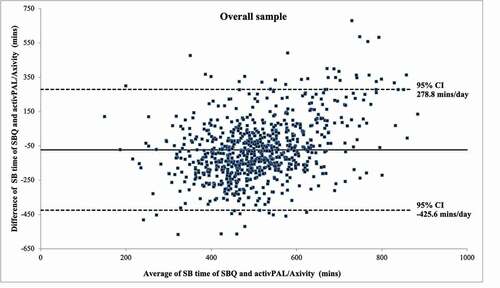
Figure 3. Bland-Altman plot panel by country. Solid line shows the mean different between the two measures; dash lines represent the 95% CI.
shows the multiple linear regression model with daily sedentary behavior time measured with the SBQ and covariates (country, age, gender, BMI, physical function and executive and cognitive functions) that predicted the response variable: accelerometer-measured daily sedentary time. The full model predicted 19% of the total variance. The effect modification was significant in all explanatory variables except for age and cognitive function (TMT A) (p< .05). After adjusting the model separately for each country, the model for the Danish cohort (R2 = 0.23, p< .001), followed by those for German and Northern Irish participants (R2 = 0.16, p< .001; R2 = 0.16, p = .003, respectively) were able to explain the accelerometer-measured daily sedentary time better than the model for the Spanish cohort (R2 = 0.10, p= .567).
Table 3. Multiple linear regression model for daily sedentary time measured with accelerometry adjusted by average minutes spent in sedentary behavior measured with SBQ, center of study, age, gender, BMI, physical function and executive and cognitive functioning in the same model
Criterion validity of each version of the SBQ with the matching language was analyzed separately (). Data from the Danish version showed a moderate correlation (Rho = 0.30, p≤ 0.001) and data from the English, German and Spanish versions showed weak correlations (Rho = 0.28, p< .001; Rho = 0.23, p< .001 and Rho = 0.06, p= .613, respectively).
Correlations between SBQ and the accelerometer estimated sedentary time measures across countries and sub-groups are presented separately. In the Northern Irish cohort (see Supplementary Material 1), higher significant associations were found in the female subgroup (Rho = 0.35, p= .006) and the obese participants (Rho = 0.30, p= .032). Spanish participants (see Supplementary Material 2) showed no significant associations divided by subgroups. However, males and participants with intact executive function showed slightly higher associations than the other subgroups (Rho = 0.39, p= .076; Rho = 0.30, p= .223, respectively). Although associations were weak in the German version, moderate associations were found in different subgroups (see Supplementary Material 3). Those groups that showed slightly higher significant associations were participants with normal and underweight (Rho = 0.45, p< .001) and high physical function (Rho = 0.45, p< .001). The association was weak-to-moderate and almost equivalent in each Danish subgroup (see Supplementary Material 4) but showed slightly higher significant association in female (Rho = 0.39, p< .001) and the low function participants subgroup (Rho = 0.34, p< .001).
Discussion
This is the first study to assess the validity of the SBQ in four different languages (English, Spanish, German and Danish) in an older adult population. Our results showed an overall weak positive correlation between the self-reported measures and the accelerometer estimated sedentary time. However, whenever each version of the SBQ with the matching language was analyzed separately, data of the Danish version showed a moderate correlation while the English, German and Spanish versions showed weak correlations. When overall absolute agreement was assessed, daily minutes in sedentary behavior of the SBQ with the equivalent variable derived from the accelerometer data, suggested a weak agreement between measures.
Similar to other studies, our findings showed an underestimation of 72.90 mins/day between self-reported and accelerometer measures. Kastelic and Šarabon (Citation2019) compared the Slovenian version of SBQ (weekdays) against the activPAL in an adult population and showed an underestimation of the SBQ with a mean difference between measures of −181 mins/day (Kastelic & Šarabon, Citation2019). The Bouchard Activity Record, which is a self-report instrument used to assess all levels of the physical activity spectrum from lying and sitting to vigorous-intensity activity, detected significantly less time in sedentary behavior (487.0 ± 194.3 mins/day) than the activPAL (518.5 ± 147.8 mins/day) (Hart et al., Citation2011). Another questionnaire specific to older adults (e.g. the MOST questionnaire), also underestimated daily sedentary behavior time by 3.6 hours compared to accelerometer-based measures (Gardiner et al., Citation2011). Self-reported measures appear to have poor accuracy and generally provide an underestimation of the time spent in sedentary behavior, especially in older adults (Celis-Morales et al., Citation2012). According to Harvey et al. (Citation2013), 58.9% of the participants (n = 372,550 older adults from seven countries) included in a meta-prevalence analysis of sitting time reported sitting >4 hours per day, 26.6% reported >6 hours per day and just 5% reported over 10 h per day; whereas 67% of these participants were sedentary for more than 8.5 hours per day using objective measures (Harvey et al., Citation2013).
The Bland-Altman plot of overall absolute agreement of daily minutes in sedentary behavior of the different SBQ versions with the equivalent variable derived from the accelerometers data showed a mean difference of −73.45 minutes, and the limits of agreement were (−425 mins to 278 mins), suggesting an overall weak agreement (ICC = 0.32, 95% CI 0.19, 0.43). Our study showed slightly higher agreement between measures compared to another study that found a ICC = 0.014 (95% CI −0.21, 0.26) (Kastelic & Šarabon, Citation2019).
In comparison with other studies, our data displayed slightly higher correlation coefficients than shown in previous SBQ validation-based studies (Bakar et al., Citation2018; Kastelic & Šarabon, Citation2019; Munguía-Izquierdo et al., Citation2013; Rosenberg et al., Citation2010). Bakar et al. (Citation2018) used the self-reported IPAQ as a validity criterion (Craig et al., Citation2003) showing a weak correlation (Rho between −0.026 to 0.144 on weekdays and −0.083 to 0.175 on weekends) (Bakar et al., Citation2018). However, it is important to consider that using another subjective measure as a criterion measure was not ideal. The Slovenian version of the SBQ (weekdays) showed a weak correlation (Rho = 0.01) compared to the activPAL among adult population (Kastelic & Šarabon, Citation2019). Similarly, the Spanish version of the SBQ validated among fibromyalgia patients (Munguía-Izquierdo et al., Citation2013) showed a weak correlation (Rho = 0.06) compared with the SenseWear Pro3 Armband monitor. Rosenberg et al. (Citation2010) showed no correlation for males but a higher association for females (Rho = 0.26) compared to the ActiGraph accelerometer measure. Similarly, Nelson et al. (Citation2019) compared the IPAQ sedentary time question against the ActiGraph device in undergraduate students and also showed a weak correlation (Rho = 0.26). However, these validation studies have used hip-worn accelerometers that are poor at distinguishing between postures. Our study used well-accepted thigh-based accelerometry to measure postural changes which could potentially explain the differences when compared to the other validation studies.
Underestimation of sedentary behavior in older adults could be explained due to a lack of awareness of the many occasions which require time spent sitting down. Memory capacity may also be reduced in some older adults, making it difficult to accurately provide relevant answers for self-reported instruments. A 10-item questionnaire developed for older adults (e.g. LASA Sedentary Behavior Questionnaire), correlated moderately (Rho = 0.35, p< .001) with total objective sedentary time (Visser & Koster, Citation2013). Activities such as napping, hobbies or talking with friends were included in this questionnaire and could explain some of the difference with our results since the SBQ does not include such activities. Time spent in activities such as afternoon napping or chatting after eating could potentially explain the weak association found in the Spanish cohort. Despite some studies highlighting poor associations between questionnaire and accelerometry-measured sedentary behavior, others have shown more moderate correlations. Aguilar-Farías, Brown, Olds et al. (Citation2014a) showed a weak-to-moderate correlation (Rho = 0.28 to 0.33) against the activPAL accelerometer worn by older adults using one single question on weekdays and weekend days: “How many hours each day do you typically spend sitting down while doing things like visiting friends, driving, etc.?”.
In the present study, some differences between versions were apparent. For our analysis, the English, German and Danish versions (Rho = 0.28, 0.25 and 0.30, respectively) showed higher correlations between self-reported and device-based measures than the Spanish version (Rho = 0.06). Differences between versions could potentially be explained due to the small Spanish sample size included in the analysis compared to the other countries. In the current study, higher associations in females in the Danish, English and German versions (Rho = 0.39, 0.35, 0.27, respectively) were found compared to males except in the Spanish version (Rho<0.01). Likewise, in Rosenberg et al.’s (Citation2010), these findings suggest that females report their sedentary behaviors with greater accuracy.
To accurately self-report sedentary behavior, cognitive function, concentration and memory should be intact (Rikli, Citation2000). Munguía-Izquierdo et al. (Citation2013) used the Spanish version of the Mini-Mental State Examination (Blesa et al., Citation2001) to screen cognitive function and excluded those participants with moderate-to-severe cognitive decline. In the current study, the TMT (Soukup et al., Citation1998) was used to assess cognitive functions. The low association found between measures in participants with deficient cognitive function could be explained due to the small percentage of participants in this group (10.7% overall). However, our findings suggest that self-reported sedentary behavior may not be suitable for individuals classified in the ‘cognitively deficient’ group on the TMT.
Assessing sedentary behavior in older adult populations may be challenging (Wullems et al., Citation2016). It is important to accurately measure sedentary behavior to determine its association with health status, to planning effective interventions, and to informing public health policy makers. Capturing its two primary components (posture and energy expenditure) can be challenging. Moreover, there are many factors that can bias the assessment such as an inappropriate criterion measure (e.g. motion sensors instead of direct observation), mode of administration (e.g. interview or self-report), the recall period, and the population being assessed (e.g. children, adults or older adults) (Kang & Rowe, Citation2015). Sedentary behavior is not commonly structured and purposive like physical activity; and it tends to be scattered throughout the day. This may negatively impact participants’ ability to recall accurately the amount of time spent in sedentary
Behaviors (Healy et al., Citation2011). It may also be challenging for researchers and health professionals to design robust strategies to reduce sedentary behavior based on total daily sedentary time (e.g. basic summary measures obtained with objective and self-report instruments). Because the SBQ describes time in sedentary behavior in several context-specific behaviors throughout an entire week (i.e. also including weekend days alongside weekdays), individualized and targeted interventions can more effectively target time spent in these sedentary activities. It is also worth noting that accelerometry assesses both sitting and lying behaviors whereas the SBQ asks specifically for sitting time spent in 4/9 context-specific activities, three of which could be completed lying down and would not be captured with this questionnaire (sitting while listening to music; sitting and talking on the phone; sitting and reading a book or magazine; sitting and driving/riding in a car or train). This would be counted as a limitation of the questionnaire.
Furthermore, the weak correlation could also be explained due to the limited sedentary behavior domains that the SBQ includes, which may not completely align with some daily common activities that older adults tend to do in these countries. Outdoor activities such as playing board games in leisure centers, sitting in a park or in a bar with friends and having long meals in restaurants, should be considered in country-specific SBQ versions due to different environmental conditions (e.g. weather) and cultures.
This is the first study that has attempted to validate the SBQ in older adults. Our results provide initial evidence of the English, Spanish, German and Danish SBQ versions showing a weak relationship against the thigh-based accelerometry measures, a well-accepted criterion standard used to assess sedentary behavior across many studies. However, given the overall weak correlation, further research is needed to include other sedentary behavior-related daily activities older adults may spend time in to get more accurate estimates of total daily sedentary time. Napping (in some cultural-specific domains), eating breakfast, lunch and dinner could be one of the reasons for under-reporting. Also, the SBQ includes some questions that may not be suitable for most older adults, such as playing computer or video games.
The findings of this study suggest that the SBQ may not provide a robust estimation of daily sedentary time in older adults in population-based studies. It is important to consider that older adult populations have generally tended to underestimate their levels of daily sedentary time (Celis-Morales et al., Citation2012; Gardiner et al., Citation2011). The under-reporting of sedentary behavior also suggests that epidemiological studies assessing the relationship between self-reported sedentary time and health outcomes may underestimate the true relationship. Therefore, it is recommended that researchers and clinicians should try to concurrently utilize device-based measures to provide a more accurate estimation of sedentary behavior as well as questionnaires to evaluate specific domains of sedentary time in this population.
Strengths and limitations
The large sample size from four different European countries and the use of thigh-based accelerometry as a criterion measure should be considered strengths of this study. However, when criterion validity was assessed separately by country, the small sample size of the Spanish cohort compared to the other countries should be considered as a limitation that could be biasing the study results. Additionally, several subgroups, such as participants over 85 years old or participants with deficient cognitive function at the TMT, were low percentage in some cohorts. Associations between self-reported and objective measures in those groups should be considered an exploratory analysis due to small sample sizes. Another limitation was that accelerometers account for both sitting and lying behaviors whereas the SBQ specifically assesses sitting time in 4/9 context-specific behaviors, which could partially explain the weak correlation between both tools. Finally, being unable to use the same algorithm to classify sedentary behavior time for both the Axivity and activPAL3 was not ideal.
Supplemental Material
Download Zip (62.3 KB)Acknowledgments
This work was supported by the European Union Horizon 2020 programme with grant number H2020-Grant 634270. The authors declare no conflicts of interest. The authors wish to express their appreciation for all those who volunteered for this study. Consortium members of the participating organizations of the SITLESS project: Antoni Salvà Casanovas, Àlex Domingo, Marta Roqué, and Laura Coll‐Planas: Health and Ageing Foundation of the Autonomous University of Barcelona, Barcelona, Spain; Maria Giné‐Garriga, Miriam Guerra‐Balic, Carme Martin‐Borràs, Javier Jerez‐Roig, Guillermo R. Oviedo, Marta Santiago‐Carrés, Oriol Sansano-Nadal, Manel Font-Farré, and Kelly Ferri: Faculty of Psychology, Education, and Sport Sciences Blanquerna, Ramon Llull University, Barcelona, Spain; Emma McIntosh and Manuela Deidda: Health Economics and Health Technology Assessment, University of Glasgow, Glasgow, United Kingdom; Dietrich Rothenbacher, Michael Denkinger, Katharina Wirth, Dhayana Dallmeier, and Jochen Klenk: Institute of Epidemiology and Medical Biometry, Ulm University, Ulm, Germany; Frank Kee: Centre for Public Health, School of Medicine, Dentistry and Biomedical Sciences, Queen’s University Belfast, Belfast, United Kingdom; Mark A. Tully, Jason J. Wilson, Nicole E. Blackburn, and Ilona McMullan: School of Health Sciences, Ulster University, Northern Ireland, United Kingdom; Paolo Caserotti and Mathias Skjødt: Department of Sport Science and Clinical Biomechanics, University of Southern Denmark, Odense, Denmark; Guillaume Lefebvre: SIEL, Sport Initiative et Loisir Bleu association, Strasbourg, France; Denise González: SIEL, Sport Initiative et Loisir Bleu Association, Barcelona, Spain.
Disclosure statement
This work was supported by the European Union Horizon 2020 programme with grant number H2020-Grant 634270. The authors declare no conflicts of interest.
Supplementary material
Supplemental data for this article can be accessed on the publisher’s website.
References
- Aguilar-Farías, N., Brown, W. J., Olds, T. S., & Peeters, G. M. E. E. (2014a). Validity of self-report methods for measuring sedentary behaviour in older adults. Journal of Science and Medicine in Sport, 18(6), 662–666. https://doi.org/10.1016/j.jsams.2014.08.004
- Aguilar-Farías, N., Brown, W. J., & Peeters, G. M. E. E. G. (2014b). ActiGraph GT3X+ cut-points for identifying sedentary behaviour in older adults in free-living environments. Journal of Science and Medicine in Sport, 17(3), 293–299. https://doi.org/10.1016/j.jsams.2013.07.002
- Bakar, Y., Tugral, A., Ozel, A., Devran Altuntas, Y., & Yakut, Y. (2018). Reliability and validity of sedentary behavior questionnaire in Turkish population: Evaluation of psychometric properties. Middle East Journal of Rehabilitation and Health, 5(2), e63576. https://doi.org/10.5812/mejrh.63576
- Bland, J. M., & Altman, D. G. (2007). Agreement between methods of measurement with multiple observations per individual. Journal of Biopharmaceutical Statistics, 17(4), 571–582. https://doi.org/10.1080/10543400701329422
- Blesa, R., Pujol, M., Aguilar, M., Santacruz, P., Bertran-Serra, I., Hernández, G., Crespo, M. C., & Sol, J. M. (2001). Clinical validity of the “mini-mental state” for Spanish speaking communities. Neuropsychologia, 39(11), 1150–1157. https://doi.org/10.1016/S0028-3932(01)00055-0
- Bowie, C. R., & Harvey, P. D. (2006). Administration and interpretation of the trail making test. Nature Protocols, 1(5), 2277–2281. https://doi.org/10.1038/nprot.2006.390
- Cangoz, B., Karakoc, E., & Selekler, K. (2009). Trail making test: Normative data for Turkish elderly population by age, sex and education. Journal of the Neurological Sciences, 283(1–2), 73–78. https://doi.org/10.1016/j.jns.2009.02.313
- Celis-Morales, C. A., Perez-Bravo, F., Ibañez, L., Salas, C., Bailey, M. E. S., Gill, J. M. R., & Dasgupta, K. (2012). Objective vs. self-reported physical activity and sedentary time: Effects of measurement method on relationships with risk biomarkers. PLoS ONE, 7(5), e36345. https://doi.org/10.1371/journal.pone.0036345
- Craig, C. L., Marshall, A. L., Sjöström, M., Bauman, A. E., Booth, M. L., Ainsworth, B. E., Pratt, M., Ekelund, U., Yngve, A., Sallis, J. F., & Oja, P. (2003). International physical activity questionnaire: 12-Country reliability and validity. Medicine and Science in Sports and Exercise, 35(8), 1381–1395. https://doi.org/10.1249/01.MSS.0000078924.61453.FB
- Crowley, P., Skotte, J., Stamatakis, E., Hamer, M., Aadahl, M., Stevens, M. L., Rangul, V., Mork, P. J., & Holtermann, A. (2019). Comparison of physical behavior estimates from three different thigh-worn accelerometers brands: A proof-of-concept for the Prospective Physical Activity, Sitting, and Sleep consortium (ProPASS). International Journal of Behavioral Nutrition and Physical Activity, 16(1), 65. https://doi.org/10.1186/s12966-019-0835-0
- De Rezende, L. F. M., Rey-López, J. P., Matsudo, V. K. R., & Luiz, O. D. C. (2014). Sedentary behavior and health outcomes among older adults: A systematic review. BMC Public Health, 14(1), 1–9. https://doi.org/10.1186/1471-2458-14-333
- Ekelund, U., Steene-Johannessen, J., Brown, W. J., Fagerland, M. W., Owen, N., Powell, K. E., Yi-Park, S., & Bauman, A. (2016). Does physical activity attenuate, or even eliminate, the detrimental association of sitting time with mortality? A harmonised meta-analysis of data from more than 1 million men and women. The Lancet, 388(10051), 1302–1310. https://doi.org/10.1016/S0140-6736(16)30370-1
- Gardiner, P. A., Clark, B. K., Healy, G. N., Eakin, E. G., Winkler, E. A. H., & Owen, N. (2011). Measuring older adults’ sedentary time. Medicine and Science in Sports and Exercise, 43(11), 2127–2133. https://doi.org/10.1249/MSS.0b013e31821b94f7
- Gennuso, K. P., Gangnon, R. E., Matthews, C. E., Thraen-Borowski, K. M., & Colbert, L. H. (2013). Sedentary behavior, physical activity, and markers of health in older adults. Medicine and Science in Sports and Exercise, 45(8), 1493. https://doi.org/10.1249/MSS.0b013e318288a1e5
- Giavarina, D. (2015). Understanding Bland Altman analysis. Biochemia Medica, 25(2), 141–151. https://doi.org/10.11613/BM.2015.015
- Gilbert, A. L., Lee, J., Ma, M., Semanik, P. A., Di Pietro, L., Dunlop, D. D., & Chang, R. W. (2016). Comparison of subjective and objective measures of sedentary behavior using the yale physical activity survey and accelerometry in patients with rheumatoid arthritis. Journal of Physical Activity & Health, 13(4), 371–376. https://doi.org/10.1123/jpah.2015-0176
- Giné-Garriga, M., Coll-Planas, L., Guerra, M., Domingo, À., Roqué, M., Caserotti, P., Denkinger, M., Rothenbacher, D., Tully, M. A., Kee, F., McIntosh, E., Martín-Borràs, C., Oviedo, G. R., Jerez-Roig, J., Santiago, M., Sansano, O., Varela, G., Skjødt, M., Wirth, K., Klenk, J., Salvà, A. (2017). The SITLESS project: exercise referral schemes enhanced by self-management strategies to battle sedentary behaviour in older adults: Study protocol for a randomised controlled trial. Trials, 18(1), 1–14. https://doi.org/10.1186/s13063-017-1956-x
- Giné-Garriga, M., Sansano-Nadal, O., Tully, M. A., Caserotti, P., Coll-Planas, L., Rothenbacher, D., Roqué-i-figuls, M., Wilson, J. J., Martin-Borràs, C., Skjødt, M., Ferri, K., Farche, A. C., McIntosh, E., Blackburn, N. E., Salvà, A., Roqué-i-figuls, M., & Dallmeier, D. (2020). Accelerometer-measured sedentary and physical activity time and their correlates in European older adults: The SITLESS study. The Journals of Gerontology: Series A, 75(9), 1754–1762. https://doi.org/10.1093/gerona/glaa016
- Guralnik, J. M., Simonsick, E. M., Ferrucci, L., Glynn, R. J., Berkman, L. F., Blazer, D. G., … Wallace, R. B. (1994). A short physical performance battery assessing lower extremity function: Association with self-reported disability and prediction of mortality and nursing home admission. Journals of Gerontology, 49(2), M85-94. https://doi.org/10.1093/geronj/49.2.M85
- Hambleton, R. (2005). Issues, designs, and technical guidelines for adapting tests into multiple languages and cultures. Adapting educational and psychological tests for cross-cultural assessment.
- Hart, T. L., Ainsworth, B. E., & Tudor-Locke, C. (2011). Objective and subjective measures of sedentary behavior and physical activity. Medicine and Science in Sports and Exercise, 43(3), 449–456. https://doi.org/10.1249/MSS.0b013e3181ef5a93
- Harvey, J. A., Chastin, S. F. M., & Skelton, D. A. (2013). Prevalence of sedentary behavior in older adults: A systematic review. International Journal of Environmental Research and Public Health, 10(12), 6645–6661. https://doi.org/10.3390/ijerph10126645
- Harvey, J. A., Chastin, S. F. M. M., & Skelton, D. A. (2015). How sedentary are older people? A systematic review of the amount of sedentary behavior. 23 Journal of Aging and Physical Activity §, Human Kinetics Publishers Inc. 23(3), 471–487. https://doi.org/10.1123/japa.2014-0164
- Healy, G. N., Clark, B. K., Winkler, E. A. H., Gardiner, P. A., Brown, W. J., & Matthews, C. E. (2011). Measurement of adults’ sedentary time in population-based studies. American Journal of Preventive Medicine, 41(2), 216–227. https://doi.org/10.1016/j.amepre.2011.05.005
- Heron, L., O’Neill, C., McAneney, H., Kee, F., & Tully, M. A. (2019). Direct healthcare costs of sedentary behaviour in the UK. Journal of Epidemiology and Community Health, 73(7), 625-629. https://doi.org/10.1136/jech-2018-211758
- Kang, M., & Rowe, D. A. (2015). Issues and challenges in sedentary behavior measurement. Measurement in Physical Education and Exercise Science, 19(3), 105–115. https://doi.org/10.1080/1091367X.2015.1055566
- Kastelic, K., & Šarabon, N. (2019). Comparison of self-reported sedentary time on weekdays with an objective measure (activPAL). Measurement in Physical Education and Exercise Science, 23(3), 227–236. https://doi.org/10.1080/1091367X.2019.1603153
- Katzmarzyk, P. T., Church, T. S., Craig, C. L., & Bouchard, C. (2009). Sitting time and mortality from all causes, Cardiovascular Disease, and Cancer. Medicine and Science in Sports and Exercise, 41(5), 998–1005. https://doi.org/10.1249/MSS.0b013e3181930355
- Ku, P. W., Steptoe, A., Liao, Y., Hsueh, M. C., & Chen, L. J. (2018). A cut-off of daily sedentary time and all-cause mortality in adults: A meta-regression analysis involving more than 1 million participants. BMC Medicine, 16(1), 74. https://doi.org/10.1186/s12916-018-1062-2
- Migueles, J. H., Cadenas-Sanchez, C., Ekelund, U., Delisle Nyström, C., Mora-Gonzalez, J., Löf, M., Labayen, I., Ruiz, J. R., & Ortega, F. B. (2017, September 1). Accelerometer data collection and processing criteria to assess physical activity and other outcomes: A systematic review and practical considerations. Sports Medicine, 47(9), 1821–1845. Springer International Publishing. https://doi.org/10.1007/s40279-017-0716-0
- Munguía-Izquierdo, D., Segura-Jiménez, V., Camiletti-Moirón, D., Álvarez-Gallardo, I. C., Estévez-López, F., Romero, A., & Delgado-Fernández, M. (2013). Spanish adaptation and psychometric properties of the sedentary behaviour questionnaire for fibromyalgia patients: The al-andalus study. Clinical and Experimental Rheumatology, 31(SUPPL.79), 22–33.https://pubmed.ncbi.nlm.nih.gov/23710552/
- Nelson, M. C., Taylor, K., & Vella, C. A. (2019). Comparison of self-reported and objectively measured sedentary behavior and physical activity in undergraduate students. Measurement in Physical Education and Exercise Science, 23(3), 237–248. https://doi.org/10.1080/1091367X.2019.1610765
- Patel, A. V., Bernstein, L., Deka, A., Feigelson, H. S., Campbell, P. T., Gapstur, S. M., Colditz, G. A., & Thun, M. J. (2010). Leisure Time spent sitting in relation to total mortality in a prospective cohort of US adults. American Journal of Epidemiology, 172(4), 419–429. https://doi.org/10.1093/aje/kwq155
- Pavey, T. G., Peeters, G. M. E. E., & Brown, W. J. (2015). Sitting-time and 9-year all-cause mortality in older women. British Journal of Sports Medicine, 49(2), 95–99. https://doi.org/10.1136/bjsports-2012-091676
- Rikli, R. E. (2000). Reliability, validity, and methodological issues in assessing physical activity in older adults. Research Quarterly for Exercise and Sport, 71(sup 2), 89–96. https://doi.org/10.1080/02701367.2000.11082791
- Robusto, K. M., & Trost, S. G. (2012). Comparison of three generations of ActiGraphTM activity monitors in children and adolescents. Journal of Sports Sciences, 30(13), 1429–1435. https://doi.org/10.1080/02640414.2012.710761
- Rosenberg, D. E., Norman, G. J., Wagner, N., Patrick, K., Calfas, K. J., & Sallis, J. F. (2010). Reliability and validity of the Sedentary Behavior Questionnaire (SBQ) for adults. Journal of Physical Activity & Health, 7(6), 697–705. https://doi.org/10.1123/jpah.7.6.697
- Roy, M., & Molnar, F. (2013). Systematic review of the evidence for Trails B cut-off scores in assessing fitness-to-drive. Canadian Geriatrics Journal, 16(3), 1–23. https://doi.org/10.5770/cgj.16.76
- Rumsey, D. J. (2005). Statistics workbook for dummies. For Dummies. ISBN: 8601300478647. https://www.dummies.com/education/math/statistics/how-to-interpret-a-correlation-coefficient-r/
- Schrack, J. A., Zipunnikov, V., Goldsmith, J., Bai, J., Simonsick, E. M., Crainiceanu, C., & Ferrucci, L. (2014). Assessing the “Physical Cliff”: Detailed quantification of age-related differences in daily patterns of physical activity. The Journals of Gerontology. Series A, Biological Sciences and Medical Sciences, 69(8), 973–979. https://doi.org/10.1093/gerona/glt199
- Skotte, J., Korshøj, M., Kristiansen, J., Hanisch, C., & Holtermann, A. (2014). Detection of physical activity types using triaxial accelerometers. Journal of Physical Activity & Health, 11(1), 76–84. https://doi.org/10.1123/jpah.2011-0347
- Soukup, V. M., Ingram, F., Grady, J. J., & Schiess, M. C. (1998). Trail making test: Issues in normative data selection. Applied Neuropsychology, 5(2), 65–73. https://doi.org/10.1207/s15324826an0502_2
- Sparling, P. B., Howard, B. J., Dunstan, D. W., & Owen, N. (2015). Recommendations for physical activity in older adults. BMJ (Online), 350, h100. https://doi.org/10.1136/bmj.h100
- Tremblay, M. S., Aubert, S., Barnes, J. D., Saunders, T. J., Carson, V., Latimer-Cheung, A. E., Chastin, S. F. M., Altenburg, T. M., & Chinapaw, M. J. M. (2017). Sedentary Behavior Research Network (SBRN) – terminology consensus project process and outcome. International Journal of Behavioral Nutrition and Physical Activity, 14(1), 75. https://doi.org/10.1186/s12966-017-0525-8
- Tully, M. A., McMullan, I. I., Blackburn, N. E., Wilson, J. J., Coll-Planas, L., Deidda, M., Caserotti, P., & Rothenbacher, D. (2019). Is sedentary behavior or physical activity associated with loneliness in older adults? Results of the European-Wide SITLESS Study. Journal of Aging and Physical Activity, 1–7. https://doi.org/10.1123/japa.2019-0311
- Van Der Berg, J. D., Stehouwer, C. D. A., Bosma, H., Van Der Velde, J. H. P. M., Willems, P. J. B., Savelberg, H. H. C. M., Schram, M. T., Sep, S. J. S., Van Der Kallen, C. J. H., Henry, R. M. A., Dagnelie, P. C., Schaper, N. C., & Koster, A. (2016). Associations of total amount and patterns of sedentary behaviour with type 2 diabetes and the metabolic syndrome: The Maastricht study. Diabetologia, 59(4), 709–718. https://doi.org/10.1007/s00125-015-3861-8
- Van Der Ploeg, H. P., Chey, T., Korda, R. J., Banks, E., & Bauman, A. (2012). Sitting time and all-cause mortality risk in 222 497 Australian adults. Archives of Internal Medicine, 172(6), 494–500. https://doi.org/10.1001/archinternmed.2011.2174
- Van Uffelen, J. G. Z., Wong, J., Chau, J. Y., Van Der Ploeg, H. P., Riphagen, I., Gilson, N. D., Burton, N. W., Healy, G. N., Thorp, A. A., Clark, B. K., Gardiner, P. A., Dunstan, D. W., Bauman, A., Owen, N., & Brown, W. J. (2010). Occupational sitting and health risks. American Journal of Preventive Medicine, 39(4), 379–388. https://doi.org/10.1016/j.amepre.2010.05.024
- Visser, M., & Koster, A. (2013). Development of a questionnaire to assess sedentary time in older persons - A comparative study using accelerometry. BMC Geriatrics, 13(1), 1. https://doi.org/10.1186/1471-2318-13-80
- Welk, G. J., Bai, Y., Lee, J. M., Godino, J. O. B., Saint-Maurice, P. F., & Carr, L. (2019). Standardizing analytic methods and reporting in activity monitor validation studies. Medicine and Science in Sports and Exercise, 51(8), 1767–1780. https://doi.org/10.1249/MSS.0000000000001966
- Wilson, J. J., Blackburn, N. E., O’Reilly, R., Kee, F., Caserotti, P., & Tully, M. A. (2019). Association of objective sedentary behaviour and self-rated health in English older adults. BMC Research Notes, 12(1), 12. https://doi.org/10.1186/s13104-019-4050-5
- Wullems, J. A., Verschueren, S. M. P., Degens, H., Morse, C. I., & Onambélé, G. L. (2016). A review of the assessment and prevalence of sedentarism in older adults, its physiology/health impact and non-exercise mobility counter-measures. Biogerontology, 17(3), 547–565. https://doi.org/10.1007/s10522-016-9640-1