
ABSTRACT
The aim of this study was to examine the trends in Olympic Games (OLY) and World Long Course Championships (WLC) across three performance categories (1st-3rd, 4th-8th and 9th-16th), and to make predictions for the 2024 OLY. Top 16 rankings were obtained for all OLY and WLC competitions between 2011 and 2019. Linear regression and forecasting models were used to examine trends and predictions. A total of 3,061 individual race results were included. For both genders, significant changes were observed in 13 of 14 Olympic events, with most changes highlighting those events have improved (mean: −0.72% (± 0.81%) for Men; −0.60% (± 0.81%) for Women). For the 2024 predictions, events fall into five groups: improving; declining; converging; diverging; and stable. These results offer insights about trends in times required to be a semi-finalist, finalist, and medalist. This, coupled with the 2024 predictions, may allow high-performance programs to target specific OLY events.
Introduction
The Olympic Games (OLY) and the Fédération Internationale de Natation (FINA) World Long Course Championships (WLC) are the pinnacle of elite swimming competitions. Qualification for such events depends on an athlete achieving a pre-determined qualifying standard, or consideration standard at a designated competition, and/or during a defined period. With finite resources available to most National Governing Bodies (NGBs), effectively identifying athletes who have the potential to achieve international representation is essential in the talent identification (TI) process (Allen et al., Citation2014; Allen et al., Citation2015; Vaeyens et al., Citation2009). Previously, retrospective analyses of top 16 finishers at both the 2008 and 2012 OLY showed that male swimmers improved, on average, by 2.3% and 9.4% in the four and eight years leading to their peak performance, respectively, while females improved by 2.6% and 9.6% in the same time periods (Svendsen et al., Citation2018). Furthermore, Costa et al. (Citation2010) examined the performance stability of male world ranked swimmers across all freestyle (Free) events between the 2004 and 2008 OLY. They reported that performance enhancement was around 0.6% to 1% between seasons leading up to the OLY, and around 3% to 4% for the overall timeframe analyzed. The performance stability (using Cohen’s Kappa Coefficient (k)) based on the overall timeframe was moderate for all Free events (k ≥ 0.43), except in the 50 m Free, where it was low (k = 0.39) (Costa et al., Citation2010). This analysis identifies that there is a progression required to be an elite performer at the OLY; however, what is unknown is what time is required to compete at the OLY.
There is a growing interest in world trends in elite swimming, with retrospective longitudinal research presenting a distinct opportunity “to look to the past to shed light on the future” (Barnett & Ulrich, Citation2021). Data from OLY and WLC finalists between 1992 and 2013 indicate that performances have improved, and the ages of athletes competing have increased, for most events (Konig et al., Citation2014). Both OLY and WLC performances improved across the years for males and females, in all strokes and distances: an extremely large effect was observed for OLY (d = 52.1(± 47.6)) and WLC (d = 20.1(± 8.4)), and especially in the Women’s 100 m and 200 m Breaststroke (Breast) (d = 198) at OLY (Konig et al., Citation2014).
Modeling performance progression has been previously applied to monitor progression in sport performance (Berthelot et al., Citation2008; Nevill & Whyte, Citation2005; Seiler et al., Citation2007). This previous research has highlighted that when modeling performance progression, the acknowledgment of variation is important as progression in performance is never linear. Brammer et al. (Citation2012) stated that a single power curve, one that carries a certain range of error and asymptotically approaches a describable limit, better describes the systematic progression of athletic performance. Brammer and colleagues successfully predicted the outcomes of the 2000 and 2004 OLY with only a few notable outliers. In 2000, the outcome of only one of 26 events exceeded predictions (Men’s 100 m butterfly (Fly)), and in 2004, only two events (Men’s 100 m Fly and 200 m Individual Medley (IM)). Between 1988 and 2004, 87% of all events were successfully predicted; however, at the 2008 OLY, only 34% of the events were predicted by the models. The 2008 OLY were affected by the inclusion of polyurethane suits, which resulted in 10 out of 13 (77%) Men’s and 7 out of 13 (54%) Women’s events recording mean times for the eight finalists that were significantly faster than the predicted outcomes, with some events showing up to five standard deviations away from the predicted mean. Additionally, Stager et al. (Citation2010) tested the accuracy of their predictions by comparing them to actual performances at each of the previous six OLY (1988–2008). They found that events two decades prior to the current competition were shown to have little predictive value on future competitions occurring more than twenty years later. These findings show that many factors can affect the prediction models and that technology and historical data needs to be considered with caution.
The aforementioned studies highlight those performances of elite athletes have progressed throughout the years (Konig et al., Citation2014). Brammer et al. (Citation2012), based on the pre-2008 prediction curve (“super suit” era), predicted that performances in 4 out of 13 men’s and 9 out of 13 women’s events would be faster in 2012 vs. 2008. However, the impact of the “super suit” era resulted in only the women’s 100 m Breast progressing from 2008 to 2012. Therefore, due to the variability of swimming times over the years, and the impact of such technological factors, studies are needed to examine the current performance patterns within elite swimming. Presently, it is not known if the performances required to be a semi-finalist (top 16), finalist (top 8), or a medalist (top 3), have improved, or declined over the last near decade at OLY and WLC level. Recent trends across all OLY events (50 m, 100 m, 200 m, 400 m, 800 m and 1500 m Free; 100 m and 200 m Fly, Backstroke (Back) and Breast; and 200 m and 400 m IM) are unknown, particularly post the banning of “super suits„. The primary aim of this study was to examine, observe and classify performance patterns and trends across the OLY and WLC between 2011 and 2019. A secondary aim was to make performance predictions for the 2024 OLY from the trends observed at OLY and WLC level between 2011 and 2019. This information has the potential to be very informative for coaches and practitioners who are targeting top-level performances at major international events.
Materials and methods
Swimming performances
The results for the top ranked 16 swimmers from the WLC (2011 (Shanghai), 2013 (Barcelona), 2015 (Kazan), 2017 (Budapest), 2019 (Gwangju)) and OLY (2012 (London) and 2016 (Rio)) were obtained through Gracenote Sports (https://www.gracenote.com/sports/global-sports-data/). Data were collated for all individual OLY and WLC events for Men and Women. Non-Olympic events at the WLC were excluded. Across the seven competitions, there were 3,072 (1,536 male/1,536 female) individual race files. The collated data contained the following information for each individual swim: competition; year; event; gender; athlete; nationality; age; result; and rank. Only the OLY and WLC swimmers between 2011 and 2019 were included, as all swimmers competed in FINA approved textile swimwear (i.e., post the “super suit” era). As this study involved secondary analyses of publicly available data, institutional review board approval was not needed nor obtained.
Data were pooled, to create three distinct performance categories, from the OLY and WLC. Data were extracted for both the athlete’s age and performance result, with each variable separated into swimmers ranked 1st-3rd (medalists), 4th-8th (finalists, but not medalists), and 9th-16th (semi-finalists, but not finalists). Where a swimmer was disqualified (DQ’d), they were automatically ranked as either 8th (DQ’d in the final) or 16th (DQ’d in the semi-final) place on the official rankings. For DQ’d athletes, no information relating to either age or result was available. In total, 11 swimmers were DQ’d: 8 Men (6 semi-finalists, 2 finalists) and 3 Women (all finalists).
Statistical analyses
To examine the performance trends between 2011 and 2019, time was set as the dependent variable, with year as the independent variable. Repeated separate linear regression models were created for each combination of sex, event, and performance category. Repeated linear regression models were created for each event and performance category, for Men and Women. The constant reported represents the intercept for 2011 and the estimate for the coefficient for each year from 2011 to 2019. The adjusted r2 was used to determine the variance of the data, with analyses performed on SPSS (v26.0) (SPSS Inc., Chicago, USA). The alpha level was set at 0.05. Further, the model was adjusted for age as a covariate in the regression analyses to highlight results irrespective of the age of the swimmer for each event. The focus of the analyses were on the changes over time, rather than accounting for the effect of age on the progression of time. The same regression model for all events and categories was applied to ensure they were uniform across all events.
There were no competitions in 2010, 2014, and 2018, and with missing time points, a time series approach was not suitable to create predictions for the 2024 OLY. The predictions were created using the exponential smoothing technique forecast function (forecast.ets) in Microsoft Excel 2016 (Microsoft, Washington, USA). The forecast function is a machine learning algorithm that uses additive error, additive trend, and additive seasonality from historical data for its predictions (Held, Moriarty, Richardson, 2019). The target year was 2024, the values were the age-adjusted mean times used in the trend analyses with average aggregation, and the timeline was 2011 to 2019. The forecast algorithm was used to initially test the prediction ability from the historical data period between 2011 and 2017, and subsequently make predictions for 2019. The actual results from 2019 were then compared with the predicted times from the algorithm. The median (IQR) difference between the predicted and actual 2019 times was −0.17% (−0.62%, 0.13%), with the differences deemed to be not statistically significant (p = .919), when assessed using a Mann–Whitney U Test. The negative median difference suggests that, on average, the predicted times are faster than the actual times (i.e., the swimmers were slower by 0.17% than predicted), but that these differences are not statistically significant and very small. In absolute terms (mm:ss.ms), the median (IQR) difference between the predicted and actual 2019 times were 0.43 (0.14, 1.16). The smallest absolute difference was observed for the Men’s 50 m Free rank 9th–16th (predicted = 00:21.97 vs. actual = 00:21.98). Therefore, the accuracy of the predicted times for 2019 provides evidence that the same function could be used to predict times for 2024. Furthermore, these predictions can be updated, as and when results from future OLY and WLC are available.
For illustrative purposes, figures have been created to report the historical data and the predictions for 2024 for all events (available online in Supplementary Figures 1–28). Times for each event and category were plotted for each sex to show the variance from the linear regression and prediction line. Points further away from the line would suggest lower prediction power compared with points closer to the line. Figures were provided to classify observed performance patterns and trends as it is clear that performance trends are complex, not always increasing, and therefore we used this additional categorical approach for illustrative purposes to support our research findings.
Results
The final analyses included 3,061 race results (1,528 Men and 1,533 Women). Men and Women trends across all events are presented in , which indicates the events that have become significantly faster, slower, or have remained the same. Thirteen of the 14 Men’s (all but the 400 m IM) and Women’s (all but the 1500 m Free) events have seen a statistically significant change (positive: an event has become slower; negative: an event has become faster) for at least one the performance categories.
Table 1. Times for 2011 (constant) and significance of slope of competition year, positions by event and gender. Mean percentage difference (2019 vs. 2011) included for each event and performance category
Performance trends
For Men, the times for the 50 m Free, 100 m Breast, 100 m Fly, 200 m Breast, and 800 m Free for each of the three performance categories have become faster. For the 200 m Free and the 200 m IM, those ranked 4th-8th and 9th-16th, have become faster; however, for those ranked 1st-3rd, the times have become slower. Similarly, for the 200 m Back, the time required to be a semi-finalist have become faster, but to be a finalist has not changed, and to be a medalist has become slower. For both the 400 m and the 1500 m Free, the time required to be ranked 9th-16th has become faster, but there has been no change in the time to be ranked 4th-8th or 1st-3rd. It is worth noting that at international level, there are no semi-finals in these events (just heats and finals), which may go some way to explaining why the times for those ranked 9th-16th have improved (i.e., the need to swim fast in the heats, to make it back for a second swim).
In the Women’s 50 m Free, 100 m Back, 100 m Fly, 100 m Free, and 200 m Free improvements were seen across the three performance categories. The 200 m Fly is the only event that has seen a decline in the three performance categories. For the 100 m Breast and the 200 m IM, the times required to be a finalist and a semi-finalist have improved, but the time to be a medalist has remained unchanged. In the 400 m and 800 m Free, the times to be ranked either 1st-3rd, or 4th-8th have improved (with a regression for those ranked 9th-16th), but there has been no change in the 1500 m Free.
also contains the mean percentage difference for all events, comparing performances from 2019, to 2011. For Men and Women, there have been average percentage improvements across all events (−0.72% (± 0.81%) and −0.60% (±0.81%)), for those ranked 1st-3rd (−0.57% (±0.96%) and −0.81% (±0.70%)), for those ranked 4th-8th (−0.73% (±0.76%) and −0.70% (±0.86%)) and for those ranked 9th-16th (−0.88% (±0.71%) and −0.29% (±0.82%)). When examined collectively, it appears as if elite-level swimming has become faster in the last near decade.
Performance predictions
The predicted times for 2024 for the three performance categories are presented in (Men’s events) and (Women’s events). For the Men’s events, predictions showed clear progressions across all performance categories in the 50 m Free, 100 m Fly, Breast and Back, 200 m Breast, 800 m Free, and 1500 m Free. Additionally, improvements were observed for the 100 m Free and 200 m Fly for 1st–3rd, 200 m Back for 9th–16th, 200 m Free, 200 m IM, and 400 m Free for 4th–8th and 9th–16th. While no event showed clear predicted decline across all categories, the 100 m Free for 4th–8th, 200 m Fly for 9th-16th, 200 m Back, Free and IM for 1st-3rd, are all predicted to decline. Predictions to remain constant were observed for the 200 m Fly and Back for 4th–8th and 400 m IM across all performance categories. Events that showed predicted convergence were 200 m Free across all performance categories and the 200 IM for 1st–3rd and 4th–8th and 1500 m Free for 4th–8th and 9th–16th. Only the 200 m Fly showed predicted divergence for Men. For the Women’s events, predicted improvement across all performance categories was observed for the 50 m Free, 100 m Fly, Breast, Back and Free, and 200 m Free and IM. Additionally, predicted improvement were observed for the 200 m Breast for 4th–8th and 9th–16th, 200 m Back for 4th–8th, 400 m and 800 m Free for 1st–3rd and 4th–8th and 400 m IM and 1500 m Free for 1st–3rd. The 200 m Fly showed a predicted decline across all performance categories, with a predicted decline also seen for the 200 m Breast for 1st–3rd, 200 m Back, 400 m Free and 800 m Free for 9th–16th, 400 m IM for 4th–8th and 9th–16th and 1500 m Free for 4th-8th. Predicted stabilization was observed for the 200 m Breast for 1st–3rd, 200 m Back and 400 m IM for 1st–3rd and 9th–16th and 1500 m Free for 9th–16th. Additionally, the Women’s 200 m Breast demonstrated predicted convergence and the 400 m Free, 400 m IM and 800 m Free demonstrated predicted divergence.
Table 2. Age-adjusted mean Men’s times for 2011–2019 (by event and performance category) and predicted times (95% CI) for 2024 based on the available pooled data
Table 3. Age-adjusted mean Women’s times for 2011–2019 (by event and performance category) and predicted times (95% CI) for 2024 based on the available pooled data
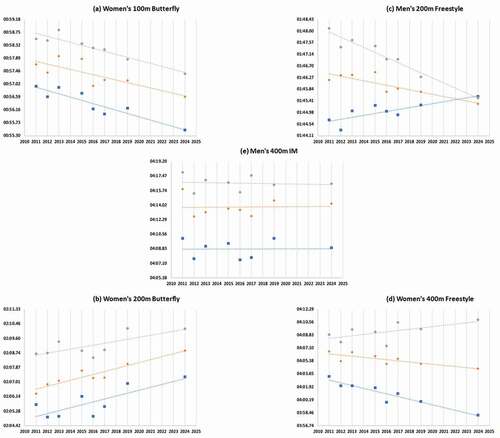
The findings outlined above demonstrate that the predicted times fall into five groups, as illustrated in (graphical representations of the 2024 predictions for all events are available online in Supplementary Figures 1–28). Group one (e.g., Women’s 100 m Fly) is predicted to improve across the three performance categories; group two (e.g., Women’s 200 m Fly) is predicted to decline across the three performance categories; group three (e.g., Men’s 200 m Free) is predicted to converge, where some of the performance categories catch up with, and surpass, the other categories; group four (e.g., Men’s 400 m IM) is predicted to stabilize across the three performance categories; and group five (e.g., Women’s 400 m Free) is predicted to diverge, with performance categories moving in opposite directions.
Figure 1. Figure 1. Five broad groups for predicted times in 2024; a) all performance categories improving (e.g., Women’s 100 m Fly); b) all performance categories declining (e.g., Women’s 200 m Fly); c) performance categories converging (e.g., Men’s 200 m Free); d) performance categories diverging (e.g., Women’s 400 m Free); and e) all performance categories staying stable (e.g., Men’s 400 m IM). Data points are age-adjusted mean times for 2011–2019, with the 2024 data point being the predicted time. Linear trend lines have been added for ease of interpretation. (Rank 1st-3rd = Squares, Rank 4th-8th = Diamonds; Rank 9th-16th = Circles).
Discussion
This study aimed to examine performance trends across the OLY and WLC between 2011 and 2019, and to predict times for the 2024 OLY. The identification of events which present opportunities for fast tracking athletes to international representation may be of interest to NGBs. Recent research has investigated progressions in swimming from 1972 to 2008 and identified large variation in performance progressions in 2008, due to the inclusion of polyurethane suits (Brammer et al., Citation2012). The current analyses revealed that across the majority of OLY events, performance categories have changed over the last near decade, with only two events (Men’s 400 m IM and Women’s 1500 m Free) showing no change across any performance category. Moreover, the time frame included in the current analyses is after “super suits” were banned, which allows for a large portion of the variation seen in 2008, to be accounted for. Furthermore, Brammer and colleagues concluded that their results illustrate those prior results allow for the prediction of future results to a high degree of accuracy, unless a bias is introduced into the competitive environment (i.e. 2008 OLY). With little knowledge known around the current trends in elite swimming, our predictive analyses for the 2024 OLY revealed that events fall into five broad groups: 1) improving; 2) declining; 3) converging; 4) stable; and 5) divergence, and offer NGBs potential benchmark times, for different performance categories.
The results for Men indicated that events such as the 50 m Free, 100 m Breast, 100 m Fly, 200 m Breast, and 800 m Free have progressed throughout the period of 2011–2019. This progression would identify that these events are potentially the most difficult to be successful in, due to the improvements seen across the included years. However, results also highlight events that could provide a less difficult opportunity for athletes and coaches. For example, in the 200 m Free and IM, the times to be ranked 4th-8th and 9th-16th have progressively become faster, but the time required to be ranked 1st-3rd has become slower. This trend can also be seen in other events, such as the 200 m Back, where the time to be a semi-finalist has become faster, but the time required to be a finalist remains unchanged. Like the Men’s events, the Women’s events show progression for the 50 m Free, 100 m Back, 100 m Fly, 100 m Free and 200 m Free, with all showing improvements across the three performance categories. However, in the 100 m Breast and 200 m IM, the required time to be a medalist has not changed across the studied time period, although the times required to be a finalist, or a semi-finalist have become increasingly more difficult.
The clear progression in 50 m and 100 m events for both Men and Women highlights the popularity of the events. This may be a result of the increased professionalization of swimming through competitions such as the International Swim League (ISL) (International Swimming League Ltd., Citation2020), and could also explain the continued progress in sprint events, as swimmers on the ISL circuit have an increased racing demand, thus limiting the time for extended blocks of aerobic development. Additionally, the ISL does not currently include events greater than 400 m, and all racing is done in a short course format. This is also evident in the Women’s Fly events, as although the 100 m Fly is showing progression across all performance categories, a regression can be seen across all performance categories in the 200 m event. Potentially for that reason, this provides an opportunity for athletes to excel in the middle-distance (i.e., 200 m and 400 m) and some of the distance events. For example, the recent inclusion of the Men’s 800 m Free in the OLY program gives athletes who may not be able to progress in the 1500 m Free an opportunity to step down to the 800 m. This is further evident as the Men’s 400 m and 1500 m Free are improving in the 9th–16th positions, but not in the other performance categories.
The 200 m Free and IM are commonplace in most age group programs; however, little progression has been seen in the top end of these events. This plateau for the 200 m Free may be a result of a greater number of multi-eventers and less Free specialists in recent years. However, the plateau in the 200 m IM may be due to the athletes who set these global standards surpassing their peak performance age or even retiring. The same trend can be observed with the Women’s 400 m and 800 m Free improving, but the 1500 m Free staying constant. The Women’s 100 m Breast and 200 m IM have not progressed for those ranked 1st–3rd, suggestive that athletes who set these standards have either surpassed their peak or have retired. It is also important to note that individual sports often see athletes who dominate select events over a period, with athletes such as Katinka Hosszu (200 m and 400 m IM) and Kathleen Ledecky (400 m, 800 m, and 1500 m Free), dominating their signature events. However, despite being the best athletes in said events, their personal bests (which are also the current Long Course World Records) were set between 2015 and 2018 (Fédération Internationale de Natation. Overall rankings, Citation2020). Therefore, progress in such events may depend on a new generation of athlete coming through, which may take a considerable amount of time.
The predicted times for 2024 OLY fall into five broad groups. Events that demonstrate predicted progression and divergence can be highlighted as the most difficult events to win a medal. However, events that show predicted regression, convergence, and no change provide noteworthy opportunities for athletes to become successful at an international level. For Men, events such as 200 m Free and IM, for those ranked 1st–3rd are becoming slower, and athletes who are continuing to progress within the 4th–8th and 9th–16th position may find themselves with an opportunity to be a medalist in the coming years. Similar predictions can be seen for Women, with the 200 m Breast, Back and 400 m IM showing little predicted advances in 1st–3rd position. Additionally, some events are providing opportunities for athletes to break onto the world stage, such as the 200 m Fly and 400 m IM for Men, and the 200 m Fly and Back, 400 m Free and IM and 800 m Free for Women. From this observation, a greater opportunity presents itself for Women than for Men within elite swimming. Previous research by Heazlewood (Citation2006) examined how the predicted mean times for the Free events at the 2000 and 2004 OLY (based on the times achieved at the 1996 OLY) (Lackey & Heazlewood, Citation1998), compared to the actual times from those Games. Results indicated congruence for the Men’s 50 m Free, and the Women’s 50 m and 100 m Free. In all other Free events, the predicted times were faster than actual times, indicating that rate of progression in these events appears to have slowed down based on data up to 1996. This indicates the prediction equations overestimated the rates of improvement. With five broad categories identified in the current analyses for predicted times for 2024, it will be of interest to see how the 2024 predicted times compare to the actual 2024 times. Future work can look to see how these times compare.
There are various potential factors to explain why some events have improved (or are predicted to improve). Previous research by Ganse & Degens (Citation2020), for instance, highlighted that performance can improve due to improvements in technology and sport science, and decline due to a decreased interest in the sport, or poor talent ID practices. However, there are various, potential, factors to explain why some events have declined (or are predicted to decline) such as a greater investment of time and value given to strength training for swimming performance (Crowley et al., Citation2017). Accommodating additional strength training could result in a reduction in aerobic training load. This may explain the lack of progress in some middle-distance events, and to a greater extent, distance events, as the reliance on the oxidative system for success is much greater. Berryman and colleagues provide clear recommendations on how to optimize concurrent training for middle-distance and distance events, with frequency, modality, and sequence being key considerations to improve energy cost of locomotion and time to exhaustion (Berryman et al., Citation2018). Additionally, the type of pool-based training that swimmers are engaging in may be contributing to the trends observed in this study. While the quality vs. quantity debate is a long-standing point of discussion (Aspenes & Karlsen, Citation2012; Nugent et al., Citation2017), the popularity of more race pace oriented training has increased recently, particularly Ultra-Short Race Pace Training (USRPT). While the efficacy of this type of training remains to be fully determined (Nugent et al., Citation2019), it may be that this type of modality is more suited to shorter events, and that long events may require a more traditional training approach (Laursen & Buchheit, Citation2019; Pyne & Sharp, Citation2014).
The current findings may allow NGBs to target certain events (i.e., those that have seen very little change and/or those which are declining) with bespoke training programs, which could enable athletes to be successful in achieving international representation. In addition, NGBs could use the current findings to determine if athletes under their care are “on-track” to be a semi-finalist, a finalist, or a medalist for the 2024 OLY, and offer funding and support at an appropriate level. The primary strength of the current study is the large number of OLY and WLC performances that were included in the analyses, providing a true reflection of what is happening at elite level swimming. In addition, by only including events where FINA approved race suits were allowed (i.e., post 2009), any performance benefit associated with the wearing or not wearing of specific race suits (e.g., polyurethane suits) was negated. On the other hand, predictions were based on results from 2011 onwards, as there were no WLC in 2010, giving a relatively short window of competition. However, Stager et al. (Citation2010) tested the accuracy of their predictions by comparing them to actual performances at each of the previous six OLY (1988–2008). They found that events two decades prior to the current competition were shown to have little predictive value on future competitions occurring more than twenty years later, providing support to our research design. There were no OLY or WLC in either 2014 or 2018, meaning that for the included period (2011–2019), there were two years with no results, limiting the possibilities for time series analyses. It is important to note that while the time to be a finalist will never actually be faster than the time to be a medalist (due to the nature of predictions from retrospective data, this could occur in theory, but not in practice). Overall changes in a short time to provide predictions for 2024 may have wide confidence intervals, and therefore times for 2024 should be considered with caution. Nevertheless, the 2024 predictions could be updated and fine-tuned with swimming performances achieved at Tokyo 2020 OLY (to be held in 2021), Fukuoka WLC (2022) and Doha WLC (2023). Retrospective analyses after the Paris OLY (2024) could be undertaken to compare the predictions put forth in this study, to the actual outcomes, to examine their accuracy and to further refine predictions and expected rates of progression (or regression) for later OLY (e.g., 2028, 2032, etc.). Future research should investigate the application of classification algorithm to identify events for selected athletes based on performance progression, and other environmental factors. This would be like research by Gerrard-Longworth et al. (Citation2020) who demonstrated the effectiveness of a generic classification algorithm across individuals with different BMI, to identify specific activity profiling in weight-loss programs.
Conclusion
Over the last near decade, most swimming events have seen progress in at least one performance category. For both Men and Women, it appears as if 200 m events and down have progressed the most. Very few events have not changed, with only the Women’s 200 m Fly seeing a regression in all three performance categories. If trends continue in the same manner, come 2024, events are predicted to fall into five broad categories: 1) progression; 2) decline; 3) convergence; 4) stable; and 5) divergence. However, the predictions for 2024 were created through a machine learning algorithm based on historical data; therefore, the predictions may need to be interpreted with caution. The results from the current study offer coaches, support staff and athletes alike, an insight into what is required to be a semi-finalist, finalist, and medalist at senior international level.
Acknowledgments
The authors would like to thank Dr Conor Molan for his help with acquiring the data used in the analyses of this study. Data were obtained via Gracenote, through a pre-existing agreement with Sport Ireland.
Disclosure statement
This research did not receive any specific grant from funding agencies in the public, commercial, or not-for-profit sectors. None of the other authors have any conflicts of interest to declare.
Correction Statement
This article has been republished with minor changes. These changes do not impact the academic content of the article.
References
- Allen, S. V., Vandenbogaerde, T. J., & Hopkins, W. G. (2014). Career performance trajectories of Olympic swimmers: Benchmarks for talent development. European Journal of Sport Sciences, 14(7), 643–651. https://doi.org/https://doi.org/10.1080/17461391.2014.893020
- Allen, S. V., Vandenbogaerde, T. J., Pyne, D. B., & Hopkins, W. G. (2015). Predicting a nation’s Olympic-qualifying swimmers. International Journal of Sports Physiology and Performance, 10(4), 431–435. https://doi.org/https://doi.org/10.1123/ijspp.2014-0314
- Aspenes, S. T., & Karlsen, T. (2012). Exercise-training intervention studies in competitive swimming. Sports Medicine, 42(6), 527–543. https://doi.org/https://doi.org/10.2165/11630760-000000000-00000
- Barnett, L. M., & Ulrich, B. D. (2021). The Michigan State University motor performance study, look to the past to shed light on the future. Measurement in Physical Education and Exercise Science, 25(1), 1–6. https://doi.org/https://doi.org/10.1080/1091367X.2020.1860993
- Berryman, N., Mujika, I., Arvisais, D., Roubeix, M., Binet, C., & Bosquet, L. (2018). Strength training for middle- and long-distance performance: A meta-analysis. International Journal of Sports Physiology and Performance, 13(1), 57–63. https://doi.org/https://doi.org/10.1123/ijspp.2017-0032
- Berthelot, G., Thibault, V., Tafflet, M., Escolano, S., El Helou, N., Jouven, X., Hermine, O., & Toussaint, J. F. (2008). The citius end: World records progression announces the completion of a brief ultra-physiological quest. PLoS ONE, 3(2), e1552. https://doi.org/https://doi.org/10.1371/journal.pone.0001552
- Brammer, C. L., Stager, J. M., & Tanner, D. A. (2012). Beyond the “high-tech” suits: Predicting 2012 Olympic swim performances. Measurement in Physical Education and Exercise Science, 16(3), 183–193. https://doi.org/https://doi.org/10.1080/1091367X.2012.700253
- Costa, M. J., Marinho, D. A., Reis, V. M., Silva, A. J., Marques, M. C., Bragada, J. A., & Barbosa, T. M. (2010). Tracking the performance of world-ranked swimmers. Journal of Sports Science & Medicine, 9(3), 411–417. https://www.ncbi.nlm.nih.gov/pmc/articles/PMC3761712/
- Crowley, E., Harrison, A. J., & Lyons, M. (2017). the impact of resistance training on swimming performance: A systematic review. Sports Medicine, 47(11), 2285–2307. https://doi.org/https://doi.org/10.1007/s40279-017-0730-2
- Fédération Internationale de Natation. Overall rankings. 2020. Accessed 30th September 2020. http://www.fina.org/fina-rankings/filter/overall-rankings
- Ganse, B., & Degens, H. (2020). Declining track and field performance trends in recent years in the Austrian best results 1897-2019. Journal of Musculoskeletal & Neuronal Interactions, 21(2), 196-205. https://www.ncbi.nlm.nih.gov/pmc/articles/PMC8185268/
- Gerrard-Longworth, S., Preece, S. J., Clarke-Cornwell, A. M., & Goulermas, Y. (2020). The performance of an algorithm for classifying gym-based tasks across individuals with different body mass index. Measurement in Physical Education and Exercise Science, 24(4), 282–290. https://doi.org/https://doi.org/10.1080/1091367X.2020.1815749
- Heazlewood, T. (2006). Prediction versus reality: The use of mathematical models to predict elite performance in swimming and athletics at the Olympic Games. Journal of Sports Science & Medicine, 5(4), 480–487. https://www.ncbi.nlm.nih.gov/pmc/articles/PMC3861753/
- International Swimming League Ltd. 2020. Accessed 30th September 2020. https://isl.global/
- Konig, S., Valeri, F., Wild, S., Rosemann, T., Rust, C. A., & Knechtle, B. (2014). Change of the age and performance of swimmers across world championships and Olympic games finals from 1992 to 2013 - a cross-sectional data analysis. Springerplus, 3(1), 652. https://doi.org/https://doi.org/10.1186/2193-1801-3-652
- Lackey, G., & Heazlewood, T. (1998). The use of mathematical models to predict elite swimming performance. In N. de Mestre & K. Kumar (Eds.), Fourth conference on mathematics and computers in sport (pp. 79–110). Bond University.
- Laursen, P., & Buchheit, M. (2019). Science and application of high-intensity interval training: Solutions to the programming puzzle. Human Kinetics.
- Nevill, A. M., & Whyte, G. (2005). Are there limits to running world records? Medicine and Science in Sports and Exercise, 37(10), 1785–1788. https://doi.org/https://doi.org/10.1249/01.mss.0000181676.62054.79
- Nugent, F., Comyns, T., Kearney, P., & Warrington, G. (2019). ultra-short race-pace training (USRPT) in swimming: Current perspectives. Open Access Journal of Sports Medicine, 10, 133–144. https://doi.org/https://doi.org/10.2147/OAJSM.S180598
- Nugent, F. J., Comyns, T. M., & Warrington, G. M. (2017). Quality versus quantity debate in swimming: Perceptions and training practices of expert swimming coaches. Journal of Human Kinetics, 57, 147–158. https://doi.org/https://doi.org/10.1515/hukin-2017-0056
- Pyne, D. B., & Sharp, R. L. (2014). Physical and energy requirements of competitive swimming events. International Journal of Sport Nutrition and Exercise Metabolism, 24(4), 351–359. https://doi.org/https://doi.org/10.1123/ijsnem.2014-0047
- Seiler, S., De Koning, J., & Foster, C. (2007). The fall and rise of the gender difference in elite anaerobic performance 1952–2006. Medicine and Science in Sports and Exercise, 39(3), 534–540. https://doi.org/https://doi.org/10.1249/01.mss.0000247005.17342.2b
- Stager, J. M., Brammer, C. L., & Tanner, D. A. (2010). Identification of a bias in the natural progression of swim performance. In P. Kjendlie, R. Stallman, & J. Cabri (Eds.), Biomechanics and medicine in swimming XI (pp. 294–296). Human Kinetics.
- Staub, I., Zinner, C., Bieder, A., & Vogt, T. (2020). Within-sport specialisation and entry age as predictors of success among age group swimmers. European Journal of Sport Science, 20(9), 1160-1167. https://doi.org/https://doi.org/10.1080/17461391.2019.1702107
- Svendsen, I. S., Tonnesen, E., Tjelta, L. I., & Orn, S. (2018). Training, performance, and physiological predictors of a successful elite senior career in junior competitive road cyclists. International Journal of Sports Physiology and Performance, 13(10), 1287-1292. https://doi.org/https://doi.org/10.1123/ijspp.2017-0824
- Vaeyens, R., Gullich, A., Warr, C. R., & Philippaerts, R. (2009). Talent identification and promotion programmes of Olympic athletes. Journal of Sports Sciences, 27(13), 1367–1380. https://doi.org/https://doi.org/10.1080/02640410903110974