
ABSTRACT
Incorporation of the vertical jump (VJ) test in health-related fitness batteries is predicated on the availability of prediction equations to accurately estimate VJ power. The purpose was to develop and validate a generalizable equation to estimate VJ power from VJ height, body mass, age, and sex in 10- to 18-year-olds. The sample (N = 529) performed a VJ test and had VJ power assessed via mechanography. Validation and cross-validation groups were randomly formed to assess accuracy. Results indicated that estimates of VJ power from VJ height and body mass were accurate (R = .93, SEE = 275 Watts). Age and sex did not add substantially to the model. Upon cross-validation, accuracy was maintained. The newly developed model was more accurate than previously published equations. The following equation provides accurate and feasible estimates of VJ power (Watts) = −1354.820 + (35.455*VJ[cm]) + (43.942*body mass[kg]). This equation provides a feasible way to estimate power in field-based settings.
Introduction
Youth health-related fitness tests, such as FitnessGram, have historically focused on assessments of aerobic capacity, body composition, muscular strength and endurance, and flexibility (Plowman et al., Citation2006). Notably absent from this list is an assessment of muscle power, which is related to athletic performance, but has not traditionally been considered a component of health-related fitness (Baumgartner et al., Citation2016). Multiple studies have documented that lower body muscle power, assessed via the vertical jump, is related to bone strength (Henriques-Neto et al., Citation2020; Janz et al., Citation2015). Bone strength, in turn, is associated with reduced risk for fractures (Ammann & Rizzoli, Citation2003); therefore, muscle power is rightly considered a component of health-related physical fitness (Pate & Daniels, Citation2013).
The implications of low bone strength and increased fracture risk are more significant in older adults (Dietzel et al., Citation2015; Hardcastle et al., Citation2014; Zengin et al., Citation2017); however, lower body power has also been associated with bone strength and bone mineral content in youth (Baptista et al., Citation2016; Janz et al., Citation2015; Macdonald et al., Citation2006). Clark et al. (Citation2006) provided prospective evidence that demonstrated bone mass is inversely related to fracture risk in childhood, but the main justification for promoting and assessing musculoskeletal fitness and muscle power early in life is for primary prevention. This is especially important since increasing bone mass early in life can help to reduce risks later in life (Ward et al., Citation2019).
The Institute of Medicine (Institute of Medicine [IOM], Citation2012) emphasized that muscle strength and muscle power are essential components of a comprehensive assessment of youth fitness. This report recommended the long jump for assessment of lower body power. Since that publication, several researchers have provided convincing evidence that vertical jump height and power are associated with bone strength and bone mineral content (e.g., Baptista et al., Citation2016; Janz et al., Citation2015). Advantages of use of the vertical jump for youth fitness testing include a relatively easy to teach movement that is familiar to most youth, a test that allows for multiple assessment techniques (e.g., jump and reach tests using a Vertec or ruler taped to a wall, a contact mat or smart phone application that assesses flight time), and a relatively inexpensive assessment that takes minimal time and can be reliably assessed (e.g., Rogers et al., Citation2019; Yildiz & Fidan, Citation2020). However, a number of measurement challenges must be addressed to enable the test to be effectively employed in youth fitness batteries, such as FitnessGram (Welk et al., Citation2022).
In clinical settings, lower body muscle power is measured using jumping mechanography, that is, jumps performed on ground reaction force platforms which allow for simultaneous and separated right- and left-leg measurements of vertical force (Janz, Baptista, et al., Citation2021; Taani et al., Citation2017); however, this device is expensive and not feasible for use in field-based settings, such as schools. The vertical jump test replicates the same movements as the clinical assessment and provides a sound proxy assessment. Movement during the vertical jump is produced by short-duration, maximal-intensity contraction of lower body musculature, along with associated coordination of the arm swing for vertical jump tests that require a jump and reach. The task directly replicates the needs for power in daily tasks and in many sports played by youth (Van Praagh & Dore, Citation2002). However, to set criterion-referenced health standards, performance on the vertical jump test must be converted into estimates of muscle power.
A number of prediction equations have been developed to estimate muscle power from vertical jump height (e.g., Amonette et al., Citation2012; Canavan & Vescovi, Citation2004; Duncan, Hankey, Lyons, et al., Citation2013; Johnson & Bahamonde, Citation1996; Lara et al., Citation2006; Quagliarella et al., Citation2011; Sayers et al., Citation1999). However, most of these equations have been developed for specific sports populations or adults.
The equations that have been developed specifically for young people (Duncan, Hankey, & Nevill, Citation2013; Gomez-Bruton et al., Citation2019) vary in samples, methods, and protocols so it is difficult to compare results. Gomez-Bruton et al. (Citation2019) developed an equation to estimate peak muscle power from peak vertical jump height and body mass in youth (aged 9–17 years, 119 males, 130 females). Duncan, Hankey, and Nevill (Citation2013) studied a smaller age range of youth (12–16 years; 40 males, 51 females) and reported a model that included vertical jump height, body mass, age, and sex as predictors. Sayers et al. (Citation1999) developed a model to estimate peak power from vertical jump height and body mass on a sample (59 males, 49 females) of college-aged athletes and physical education students. While these studies each have utility, the equations are based on relatively small sample sizes, which may limit generalizability.
Thus, the primary purpose of the current study was to develop and validate a more generalizable equation to estimate lower body muscle power from peak vertical jump height. The present study used a larger sample, but includes similar ancillary predictors (i.e., body mass, age, and sex) to enable comparisons with the past equations. A heterogeneous sample relative to age (10–18 years of age) and stage of physical development was used to develop a robust equation that could be used by practitioners. A secondary purpose was to cross-validate three previously published models that estimated peak muscle power from a countermovement jump and other predictor variables.
Methods
Participants
The sample was from the Lisbon Study for the Development and Evaluation of Musculoskeletal Fitness Standards in Youth which is described in detail by Janz, Baptista, et al. (Citation2021). Briefly, a convenience sample of 529 participants (249 females and 280 males) from 10 to 18 years of age was recruited from three schools in the municipality of Oeiras, Portugal within 10 km from the University of Lisbon. Participants self-reported sex. Age was calculated from date of birth. Informed consent was obtained from all guardians. The study was approved by the University of Lisbon Institutional Review Board (Human Subjects).
Procedures
Measurements were conducted by three trained evaluators, with each evaluator responsible for a single assessment task (i.e., anthropometric measures, vertical jump power, and vertical jump test). Anthropometric measures were conducted following recommended protocols (Marfell-Jones et al., Citation2012). Standing height was measured (nearest mm) using a stadiometer (Seca, Hamburg, Germany) and body mass (nearest 1/10th kg) was measured in a post-prandial state using a physician’s scale (Seca, Hamburg, Germany). Measurements were taken while participants were lightly clothed, but without shoes. Body mass index was calculated (kg/m2).
Vertical jump power (watts, W) was assessed via mechanography (Leonardo Mechanograph, Novotec Medical GmbH, Germany), which used a ground reaction force plate consisting of two plates with corner sensors that detected voltage proportional to applied force. The system measured the time course of ground reaction forces and the velocity of the vertical movements of the center of gravity and then calculated power (W) as the product of force and velocity. All participants performed a vertical countermovement jump with two legs on the ground reaction force plate, hands at the waist, and feet hip-width apart. Participants were instructed to initiate a downward movement and then jump as high as possible using both legs while keeping their hands at their waist. They performed a practice jump and two test jumps. The jumps were initiated after a computer signal (beep). The highest of the two jumps was recorded as peak vertical jump power (VJ Power, W nearest 1/10th) and used for data analysis.
The vertical jump test was performed using a Vertec (Questek Corp, Elgin, IL, U.S.). With feet hip-width apart and hands at the waist, participants were instructed to perform a countermovement jump by bending their knees and then jumping as high as possible while reaching up with their preferred hand. Participants performed one practice jump and two test jumps. The absolute jump height reached by the hand (cm) and the jump height difference between standing height and jumping height (cm) were recorded. The highest value (cm) was used for data analysis.
Validation and cross-validation samples
Validation and cross-validation samples were formed to allow cross-validation of the prediction equations developed in this study. Approximately one-third of participants were randomly selected for the cross-validation group (n = 175). The remaining participants formed the validation group (n = 354).
Statistical analyses
Multiple regression was used in the validation sample to estimate peak VJ power (W) from vertical jump height (cm), body mass (kg), age (years), and sex. Variables were entered hierarchically, in the following order: vertical jump height, body mass, age, sex. The equations developed on the validation sample were then applied to the cross-validation sample and total sample. Pearson correlation coefficients between measured VJ power and estimated VJ power from the equations developed in the current study were calculated. Prediction error was estimated with two equations. The standard error of estimate (SEE) was calculated as SEE = SY√1 = R2YY’. The cross-validation SEE (referred to as total error [TE]) was calculated as: TE = √∑(Y – Y’)2/N. For these equations, Y is measured VJ power and Y’ is VJ power estimated from an equation developed in the current study. Comparison of these two estimates of error quantified the overestimation or underestimation on prediction accuracy.
To determine whether regression equations developed in the validation and cross-validation samples were the same, the intercepts and regression coefficients from these equations were compared. Because the intercepts and regression coefficients from the validation sample were within the 95% CIs of the cross-validation sample, the validation and cross-validation samples were deemed statistically similar and combined to form a total sample, similar to procedures used by Cureton et al. (Citation1995), Mahar et al. (Citation2006), and Mahar et al. (Citation2018). Regression analyses were performed on the total sample to develop the most robust and representative equations. Three previously published equations to estimate VJ power were chosen for comparison, i.e., Duncan, Hankey, and Nevill (Citation2013), Gomez-Bruton et al. (Citation2019), and Sayers et al. (Citation1999). Residual plots (modified Bland-Altman plots) are presented to examine regression model assumptions and allow inspection of prediction bias.
Mean absolute percent errors (MAPE) were calculated as the mean of the absolute difference between measured VJ power and VJ power estimated by the prediction equations divided by measured VJ power, then multiplied by 100. Equivalence testing (Dixon et al., Citation2018; Lakens et al., Citation2018) was used to determine whether each of the prediction models produced estimates statistically equivalent to measured VJ power.
No violations of the linearity, multicollinearity, and homoscedasticity statistical assumptions of multiple regression were found. Observation of a plot of residuals vs. predicted values and of a plot of observed vs. predicted values suggest that the assumption of linearity was not violated. Examination of variance inflation factors (all < 2.5) and tolerance values (all >0.4) suggest that the assumption of multicollinearity was not violated (Bowerman & O’Connell, Citation1990). Examination of a plot of residuals vs. predicted values (as well as plots of residuals vs. predictor variables) indicated no violation of the assumption of homoscedasticity.
Outliers were identified using the median absolute deviation (MAD) method (Leys et al., Citation2013). Using scores outside the median ± 3 (MAD) as the rejection criterion, we identified seven outliers and removed them from all further analyses.
Results
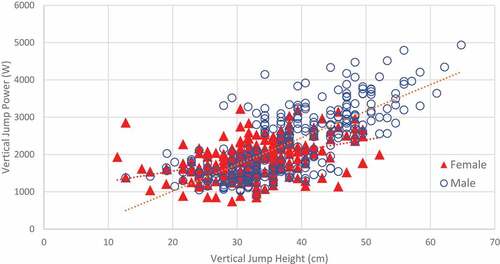
Descriptive statistics are presented in for the validation sample, cross-validation sample, and total sample. Validation and cross-validation samples did not differ significantly (p > .05) on any variable. Zero-order correlations between measured VJ power and predictor variables are presented in . All predictor variables were significantly (p < .05) correlated with measured VJ power. presents the scatterplot between measured VJ power and VJ height. The correlation between measured VJ power and VJ height was .66. provides the intercorrelations among predictor variables.
Table 1. Descriptive statistics (M ± SD) for validation sample, cross-validation sample, and total sample.
Table 2. Zero-order correlations between measured peak vertical jump power (W) and predictor variables for validation sample, cross-validation sample, and total sample.
Table 3. Zero-order correlations among predictor variables for total sample.
Figure 1. Scatterplot between measured vertical jump power and vertical jump height.
In the full regression model, the addition of age and sex as predictors after VJ height and body mass, although statistically significant, explained only an additional 1% of the variance in peak VJ power. Further analyses for the recommended model omitted age and sex variables. provides the regression coefficients and accuracy information for the regression models developed on the validation sample and total sample. Standardized regression coefficients demonstrated that VJ height (β = 0.335) and body mass (β = 0.648) were stronger predictors of peak VJ power than either age (β = 0.110) or sex (β = 0.102). The proportion of variance in peak VJ power explained by the recommended model (VJ height and body mass as predictors) was high and similar to the proportion of variance explained when all four predictors were included in the model (R2 = .87 vs. R2 = .88). The scatterplot between measured and predicted vertical jump power for the recommended model for the total sample is provided in ..
Figure 2. Scatterplot between measured vertical jump power and estimated vertical jump power for the recommended model for the total sample.
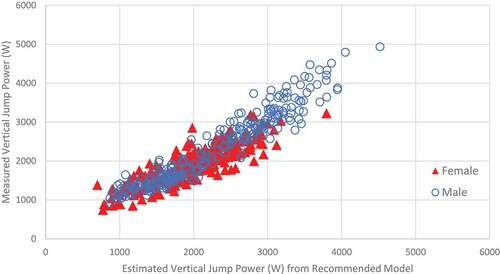
Table 4. Multiple regression models to estimate peak vertical jump power (W).
presents the accuracy of the equations developed on the validation sample when applied to the cross-validation sample. Correlations between measured VJ power and estimated VJ power were similar for all models (range .91 to .93). Using standard 10% equivalence zones, the estimates from the new equation (as well as those from the Duncan, Hankey, and Nevill and Gomez-Bruton et al. models) were statistically equivalent to measured VJ power. Consistent with recommendations from O’Brien (Citation2021), the equivalence bounds in reflect the specific equivalence zone percentage required for the measures to be equivalent to the measured value. The percentages were relatively small (<2%), with the exception of the estimates from the Sayers et al. model which were close to 10%. However, differences were evident in the precision of the estimates. The total error of our model (12.9% of mean measured VJ power) was lower than the corresponding values for the other three models that were cross-validated (range 15.0% to 17.6%). The MAPE values provide an indicator of error at the individual level with values from our model and the Duncan, Hankey, and Nevilll. model both providing estimates close to 1% of measured values.
Table 5. Cross-validation analysis of regression models developed on validation sample on cross-validation sample.
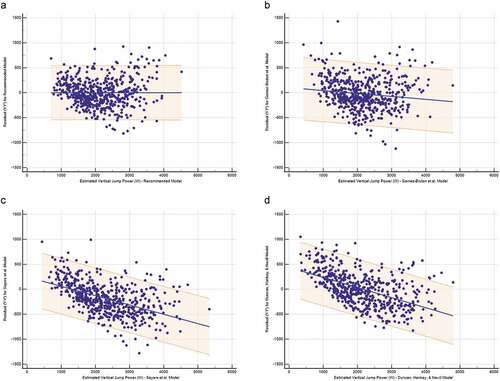
Comparisons were also made between the residual plots for the recommended model developed in the current study and for the three previously published models (). For the model developed in the current study ()) and the Gomez-Bruton et al. (Citation2019) model ()), the dispersion of points appears random and even throughout the plots, indicating that the assumptions of linearity and homoscedasticity were met. Inspection of the residual plot for the Sayers et al. (Citation1999) model ()) suggests a bias, whereby peak VJ power was overestimated in a greater proportion of participants than expected, particularly as peak VJ power increased. For the Duncan, Hankey, and Nevill (Citation2013) model ()), inspection of the residual plot suggests a more complicated interpretation, whereby lower values for VJ power appear to be underestimated and higher values for VJ power appear to be overestimated.
Figure 3. Residual plots for regression models. a. Residual plot for model developed in current study from validation sample. b. Residual plot for Gomez-Bruton et al. (Citation2019) model. c. Residual plot for Sayers et al. (Citation1999) model. d. Residual plot for Duncan, Hankey, and Nevill (Citation2013) model.
Discussion
The current study, conducted on a large sample of youth aged 10–18 years, provides validity evidence for an equation to estimate peak VJ power from vertical jump height and body mass. The developed equation enables performance on the vertical jump to be linked to clinical studies that have demonstrated associations between power and bone strength in youth (Baptista et al., Citation2016; Janz et al., Citation2015). Criterion-referenced standards have been proposed for youth (Baptista et al., Citation2021; Janz, Laurson, et al., Citation2021), but an accurate prediction equation is needed to convert performance to estimates of lower body power.
The developed model provides an accurate and feasible method to assess VJ power for youth from a wide range of ages from both sexes in school-based settings. The use of a single equation for both males and females aged 10 to 18 years is justified as we observed that age and sex only added an additional 1.2% to explained variance in VJ power after vertical jump height and body mass were accounted for. Johnson and Bahamonde (Citation1996) and Sayers et al. (Citation1999) also reported that sex was not a significant predictor of peak power in equations they developed. Thus, there is good evidence to document that the relationship between vertical jump height, body mass, and measured peak power are similar for males and females. Use of a common equation for males and females is efficient and eliminates any need to try to explain differential estimates of peak power for males and females who might have the same body mass and vertical jump height if separate sex-specific equations were used.
A strength of the present study is that direct comparisons were made with previously published models (Duncan, Hankey, & Nevill, Citation2013; Gomez-Bruton et al., Citation2019; Sayers et al., Citation1999). All models provided estimates of peak VJ power that were highly correlated with measured peak VJ power, but the accuracy of the new model was better than the existing models, based on TE and MAPE values. The cross-validation analyses used a separate cross-validation sample, so this allowed a fair comparison of model accuracy as all models were applied to the same independent sample.
The size, age-range, and diversity of the sample is an important consideration in interpreting differences among various prediction equations. Our sample was large, spanned ages 10–18 years, and had an appropriate variability in both vertical jump height and measured VJ power. Gomez-Bruton et al. (Citation2019) reported a sample of 249 participants that ranged from 9 to 17 years of age. Comparison of the samples demonstrated fairly similar descriptive statistics for VJ power (current study: 2,128 ± 760 W; Gomez-Bruton et al.: 2,136 ± 924 W) and vertical jump height (current study: 35.8 ± 8.6 cm; Gomez-Bruton et al.: 34.8 ± 8.1 cm). Sayers et al. (Citation1999) developed their prediction model on an athletic and older sample and this is likely responsible for the prediction bias that resulted when that model was applied to our younger cross-validation sample. The Sayers et al. model overestimated VJ power in the current study and had greater prediction error (i.e., higher TE) than the model developed in the current study. The Sayers et al. model may have utility for a sport-specific sample, but our larger and more diverse sample enables application of the equations developed in the current study to youth aged 10 to 18 years from both sexes.
In addition to having a larger sample size, the current study differed from the comparison studies in how vertical jump height was assessed. We used a Vertec to assess vertical jump height. The Vertec is widely used by schools and sports organizations to assess vertical jump height, which should lend some degree of generalizability to environments in which vertical jump height is assessed in a similar fashion. Vertical jump height was calculated from force vectors during the measurement of VJ power using mechanography in the Gomez-Bruton et al. (Citation2019) study. Thus, Gomez-Bruton et al. did not assess vertical jump height separately from the measurement of VJ power, which potentially limits the generalizability of their findings. In the study by Duncan, Hankey, and Nevill (Citation2013), vertical jump height was calculated from the force signal from a portable force plate platform, derived from the same force signal from which VJ power was calculated. Sayers et al. (Citation1999) used a jump and reach test to assess vertical jump height. This procedure was similar to measurement of vertical jump height using the Vertec, except participants placed a velcro ring on the wall. Although this approach does not measure the change in the center of mass when jumping, it likely is similar to vertical jump height procedures that might be used in schools.
The protocol used in the study was also intentionally selected to match methods that would be more likely in school-based settings. Previous equations to estimate VJ power from vertical jump height have used a countermovement jump and/or a squat jump. The models that were cross-validated in this study each used countermovement jumps. Although Sayers et al. (Citation1999) also published an equation that used a squat jump, that equation was not evaluated in the current study. A countermovement jump likely has greater applicability to most sports than a squat jump and personal observation suggests that students enjoy performing a countermovement jump more than a squat jump. In addition, a countermovement jump is easier for physical education teachers to enforce than a squat jump where it must be assured that each student comes to a stop after bending his or her knees before commencing with the upward movement of the jump. A countermovement jump uses a quick downward movement followed by an immediate upward jumping motion. The countermovement jump, as used in the current study, is completed in a single, fluid motion, which is a more natural movement for children than pausing in a squat position before jumping.
When applying the model, it is important to emphasize that it provides only an estimate of lower body power. However, the errors are similar in magnitude to other field-based tests used in physical education. For example, the PACER and Mile Run/Walk are field-based measures of aerobic capacity. Standard errors of estimate between 10% and 17% of mean measured aerobic capacity have been reported (Burns et al., Citation2016; Cureton et al., Citation1995; Mahar et al., Citation2018). This magnitude of error for field-based measures of health-related fitness emphasizes the importance of sensible interpretations of fitness test scores. Fitness testing can be appropriately used to provide personal information regarding the current level of fitness that can be used to promote involvement in regular physical activity, design individualized fitness development programs, and allow comparisons between past and current fitness tests to provide an indication of trends over time (Meredith & Welk, Citation2010).
Applications in school settings also necessitate a careful understanding of how the variables influence individual reports and feedback. The model developed in the current study has a positive regression coefficient for body mass indicating that heavier individuals will have higher estimates of power for the same performance. The results are consistent with previous research (Duncan, Hankey, & Nevill, Citation2013; Gomez-Bruton et al., Citation2019); however, there are interesting implications for youth fitness testing. In most youth fitness tests, being heavier translates to a disadvantage. For example, to estimate aerobic capacity, running tests like the PACER or 1-Mile Run/Walk are often used. Because additional body mass makes it more difficult to perform well on these tests, individuals who weigh more often do not perform as well as individuals who weigh less. Similarly, additional body mass (especially body fat) is a disadvantage to performance on push-ups, modified pull-ups, curl-ups, and the plank. However, the opposite is true for estimation of VJ power from the equation developed in this study. A higher body mass results in a higher estimate of VJ power, all other things being equal. Therefore, the fact that a person weighs more does not penalize that person when using the newly developed prediction equation. Of course, a higher body mass makes it is more difficult to perform well on the vertical jump.
An advantage of the VJ test for field-based applications is that it is an activity that is familiar to most youth and can be easily and reliably assessed via multiple methods (Rogers et al., Citation2019; Yildiz & Fidan, Citation2020). Studies have also shown VJ test performance is highly correlated with results from the standing long jump test (Castro-Pinero et al., Citation2010; Milliken et al., Citation2008), an alternative test that is used in other international youth fitness batteries (Ruiz et al., Citation2011) and has been endorsed for use in school fitness surveillance (Institute of Medicine, Citation2012). While the present equation is specific to vertical jump performance, established test-equating methods can enable linking between versions and tests (Boiarskaia et al., Citation2011). Previous research has demonstrated the utility of this method for linking performance on the PACER and Mile Run (Saint-Maurice et al., Citation2016). Thus, the development of equations linking vertical jump and standing long jump would be expected to have similar utility. Once equated, the estimated power can be used in the same way to enable links to criterion-referenced standards. This is a critical need for incorporating tests of lower body power into youth fitness batteries, such as FitnessGram. Faigenbaum et al. (Citation2020) argued that to impact youth physical activity levels, the importance of muscular fitness needs greater emphasis in schools. Incorporation of measures of lower body power in health-related fitness tests would send a clear message to youth that muscular fitness is important to health. Furthermore, the ability to assess changes in peak power over time can provide an indication of the effectiveness of training programs.
A major contribution of the study was development of a model to estimate VJ power using a simple field test and minimal equipment. Strengths of the study include a large sample that represents late childhood and adolescence that had peak VJ power directly assessed via mechanography. The sample had wide variability in VJ power and vertical jump height and descriptive statistics were similar to another study conducted on a large sample of children (Gomez-Bruton et al., Citation2019). However, a limitation of the study is that the current sample is likely leaner than the U.S. population of youth (Flegal et al., Citation2010). In addition, individual differences in physical maturation were not considered in development of the prediction models. Several authors reported moderately strong correlations (r ~ .68) between fat-free mass and vertical jump height (Nikolaidis, Citation2014; Perroni et al., Citation2014) in samples of male soccer players that varied widely in age. However, as our purpose was to develop a feasible equation for practitioners, we did not include a measure of fat-free mass. The accuracy of the model developed in this study for sport-specific groups and for tracking changes across time were not examined in the current study, and such research is recommended for future study. It is also noted that although the model developed on the validation sample was cross-validated on an independent sample of participants and shown to be more accurate (i.e., lower TE) than the comparison models, the validation sample, and cross-validation sample were drawn from the same population of youth. It is recognized that this limitation is inherent in all cross-validation studies of this type, but this design may have provided some benefit relative to accuracy for the model developed in the current study.
In summary, the model developed on the total sample is recommended for use, as suggested by Staudenmayer et al. (Citation2012). The recommended model [i.e., VJ Power (W) = −1354.820 + (VJ Height * 35.455) + (Body mass * 43.942)] provides accurate and feasible estimates of VJ power from vertical jump performance and body mass in a large age range of children and adolescents. This equation is suitable for use in field-based settings, such as schools, to estimate VJ power from vertical jump height and body mass.
Disclosure statement
No potential conflict of interest was reported by the author(s).
Additional information
Funding
References
- Ammann, P., & Rizzoli, R. (2003). Bone strength and its determinants. Osteoporosis International, 14(Suppl. 3), S13–S18. https://doi.org/10.1007/s00198-002-1345-4
- Amonette, W. E., Brown, L. E., De Witt, J. K., Dupler, T. L., Tran, T. T., Tufano, J. J., & Spiering, B. A. (2012). Peak vertical jump power estimations in youths and young adults. Journal of Strength and Conditioning Research, 26(7), 1749–1755. https://doi.org/10.1519/JSC.0b013e3182576f1e
- Baptista, F., Mil-Homens, P., Carita, A. I., Janz, K., & Sardinha, L. B. (2016). Peak vertical jump power as a marker of bone health in children. International Journal of Sports Medicine, 37(8), 653–658. http://dx.doi.org/10.1055/s-0042-105290
- Baptista, F., Zymbal, V., & Janz, K. F. (2021). Predictive validity of handgrip strength, vertical jump power, and plank time in the identification of pediatric sarcopenia. Measurement in Physical Education and Exercise Science, 1–10. https://doi.org/10.1080/1091367X.2021.1987242
- Baumgartner, T. A., Jackson, A. S., Mahar, M. T., & Rowe, D. A. (2016). Measurement for evaluation in kinesiology (9th ed.). Jones & Bartlett.
- Boiarskaia, E. A., Boscolo, M. S., Zhu, W., & Mahar, M. T. (2011). Cross-validation of an equating method linking aerobic FITNESSGRAM® field tests. American Journal of Preventive Medicine, 41(4), S124–S130. https://doi.org/10.1016/j.amepre.2011.07.009
- Bowerman, B. L., & O’Connell, R. T. (1990). Linear statistical models: An applied approach (2nd ed.). PWS-Kent.
- Burns, R. D., Hannon, J. C., Brusseau, T. A., Eisenman, P. A., Shultz, B. B., Saint-Maurice, P. F., Welk, G. J., & Mahar, M. T. (2016). Development of an aerobic capacity prediction model from one-mile run/walk performance in adolescents aged 13–16 years. Journal of Sports Sciences, 34(1), 18–26. https://doi.org/10.1080/02640414.2015.1031163
- Canavan, P. K., & Vescovi, J. D. (2004). Evaluation of power prediction equations: Peak vertical jumping power in women. Medicine and Science in Sports and Exercise, 36(9), 1589–1593. https://doi.org/10.1249/01.mss.0000139802.96395.ac
- Castro-Pinero, J., Ortega, F. B., Artero, E. G., Girela-Rejon, M. J., Mora, J., Sjostrom, M., & Ruiz, J. R. (2010). Assessing muscular strength in youth: Usefulness of standing long jump as a general index of muscular fitness. Journal of Strength and Conditioning Research, 24(7), 1810–1817. https://doi.org/10.1519/JSC.0b013e3181ddb03d
- Clark, E. M., Ness, A. R., Bishop, N. J., & Tobias, J. H. (2006). Association between bone mass and fractures in children: A prospective cohort study. Journal of Bone and Mineral Research, 21(9), 1489–1495. https://doi.org/10.1359/jbmr.060601
- Cureton, K. J., Sloniger, M. A., O’Bannon, J. P., Black, D. M., & McCormack, W. P. (1995). A generalized equation for prediction of &OV0312;O2peak from 1-mile run/walk performance. Medicine and Science in Sports and Exercise, 27(3), 445–451. https://doi.org/10.1249/00005768-199503000-00023
- Dietzel, R., Felsenberg, D., & Armbrecht, G. (2015). Mechanography performance tests and their association with sarcopenia, falls and impairment in the activities of daily living - a pilot cross-sectional study in 293 older adults. Journal of Musculoskeletal & Neuronal Interactions, 15(3), 249–256. https://www.ncbi.nlm.nih.gov/pmc/articles/PMC5601237/
- Dixon, P. M., Saint-Maurice, P. F., Kim, Y., Hibbing, P., Bai, Y., & Welk, G. J. (2018). A primer on the use of equivalence testing for evaluating measurement agreement. Medicine and Science in Sports and Exercise, 50(4), 837–845. https://doi.org/10.1249/MSS.0000000000001481
- Duncan, M. J., Hankey, J., Lyons, M., James, R. S., & Nevill, A. M. (2013). Peak power prediction in junior basketballers: Comparing linear and allometric models. Journal of Strength and Conditioning Research, 27(3), 597–603. https://doi.org/10.1519/JSC.0b013e31825d97ac
- Duncan, M. J., Hankey, J., & Nevill, A. M. (2013). Peak power estimation equations in 12- to 16-year-old children. Comparing linear with allometric models. Pediatric Exercise Science, 25(3), 385–393. https://doi.org/10.1123/pes.25.3.385
- Faigenbaum, A. D., MacDonald, J. P., Stracciolini, A., & Rebullido, T. R. (2020). Making a strong case for prioritizing muscular fitness in youth physical activity guidelines. Current Sports Medicine Reports, 19(12), 530–536. https://doi.org/10.1249/jsr.0000000000000784
- Flegal, K. M., Ogden, C. L., Yanovski, J. A., Freedman, D. S., Shepherd, J. A., Graubard, B. I., & Borrud, L. G. (2010). High adiposity and high body mass index-for-age in US children and adolescents overall and by race-ethnic group. American Journal of Clinical Nutrition, 91(4), 1020–1026. https://doi.org/10.3945/ajcn.2009.28589
- Gomez-Bruton, A., Gabel, L., Nettlefold, L., MacDonald, H., Race, D., & McKay, H. (2019). Estimation of peak muscle power from a countermovement vertical jump in children and adolescents. Journal of Strength and Conditioning Research, 33(2), 390–398. https://doi.org/10.1519/JSC.0000000000002002
- Hardcastle, S. A., Gregson, C. L., Rittweger, J., Crabtree, N., Ward, K., & Tobias, J. H. (2014). Jump power and force have distinct associations with cortical bone parameters: Findings from a population enriched by individuals with high bone mass. Journal of Clinical and Endocrinology Metabolism, 99(1), 266–275. https://doi.org/10.1210/jc.2013-2837
- Henriques-Neto, D., Magalhaes, J. P., Hetherington-Rauth, M., Santos, D. A., Baptista, F., & Sardinha, L. B. (2020). Physical fitness and bone health in young athletes and nonathletes. Sports Health, 12(5), 441–448. https://doi.org/10.1177/1941738120931755
- Institute of Medicine(IOM). (2012). Fitness measures and health outcomes in youth. National Academies Press. https://doi.org/10.17226/13483
- Janz, K. F., Baptista, F., Ren, S., Zhu, W., Laurson, K., Mahar, M. T., Pavlovic, A., & Welk, G. J. (2021). Associations among musculoskeletal fitness assessments and health outcomes: The Lisbon study for the development and evaluation of musculoskeletal fitness standards in youth. Measurement for Physical Education and Exercise Science, 1–9. https://doi.org/10.1080/1091367X.2021.2000414
- Janz, K. F., Laurson, K. R., Baptista, F., Mahar, M. T., & Welk, G. J. (2021). Vertical jump power is associated with healthy bone outcomes in youth: ROC analyses and diagnostic performance. Measurement in Physical Education and Exercise Science, 1–9. https://doi.org/10.1080/1091367X.2021.2013230
- Janz, K. F., Letuchy, E. M., Burns, T. L., Francis, S. L., & Levy, S. M. (2015). Muscle power predicts adolescent bone strength: Iowa bone development study. Medicine and Science in Sports and Exercise, 47(10), 2201–2206. https://doi.org/10.1249/mss.0000000000000648
- Johnson, D. L., & Bahamonde, R. (1996). Power output estimate in university athletes. Journal of Strength and Conditioning Research, 10(3), 161–166. https://journals.lww.com/nsca-jscr/toc/1996/08000
- Lakens, D., Scheel, A. M., & Isager, P. M. (2018). Equivalence testing for psychological research: A tutorial. Advances in Methods and Practices in Psychological Science, 1(2), 259–269. https://doi.org/10.1177/2515245918770963
- Lara, A. J., Abian, J., Alegre, L. M., Jimenez, L., & Aguado, X. (2006). Assessment of power output in jump tests for applicants to a sports sciences degree. Journal of Sports Medicine and Physical Fitness, 46(3), 419–424. https://pubmed.ncbi.nlm.nih.gov/16998446/
- Leys, C., Ley, C., Klein, O., Bernard, P., & Licata, L. (2013). Detecting outliers: Do not use standard deviation around the mean, use absolute deviation around the median. Journal of Experimental Social Psychology, 49(4), 764–766. https://doi.org/10.1016/j.jesp.2013.03.013
- Macdonald, H., Kontulainen, S., Petit, M., Janssen, P., & McKay, H. (2006). Bone strength and its determinants in pre-and early pubertal boys and girls. Bone, 39(3), 598–608. https://doi.org/10.1016/j.bone.2006.02.057
- Mahar, M. T., Welk, G. J., & Rowe, D. A. (2018). Estimation of aerobic fitness from PACER performance with and without body mass index. Measurement in Physical Education and Exercise Science, 22(3), 239–249. https://doi.org/10.1080/1091367X.2018.1427590
- Mahar, M. T., Welk, G. J., Rowe, D. A., Crotts, D. J., & McIver, K. L. (2006). Development and validation of a regression model to estimate VO2peak from PACER 20-m shuttle run performance. Journal of Physical Activity & Health, 3(Suppl. 2), S34–S46. https://doi.org/10.1123/jpah.3.s2.s34
- Marfell-Jones, M. J., Stewart, A. D., & de Ridder, J. H. (2012). International standards for anthropometric assessment. Wellington, New Zealand: International Society for the Advancement of Kinanthropometry.
- Meredith, M. D., & Welk, G. J. (Eds.). (2010). FitnessGram & ActivityGram test administration manual. (4th ed. ed.). Updated Human Kinetics.
- Milliken, L. A., Faigenbaum, A. D., Loud, R. L., & Westcott, W. L. (2008). Correlates of upper and lower body muscular strength in children. Journal of Strength and Conditioning Research, 22(4), 1339–1346. https://doi.org/10.1519/jsc.0b013e31817393b1
- Nikolaidis, P. T. (2014). Age-related differences in countermovement vertical jump in soccer players 8-31 years old: The role of fat-free mass. American Journal of Sports Science and Medicine, 2(2), 60–64. http://dx.doi.org/10.12691/ajssm-2-2-1
- O’Brien, M. W. (2021). Implications and recommendations for equivalence testing in measures of movement behaviors: A scoping review. Journal for the Measurement of Physical Behaviour, 4(4), 353–362. https://doi.org/10.1123/jmpb.2021-0021
- Pate, R. R., & Daniels, S. (2013). Institute of Medicine report on fitness measures and health outcomes in youth. JAMA Pediatrics, 167(3), 221–222. https://doi.org/10.1001/jamapediatrics.2013.1464
- Perroni, F., Vetrano, M., Rainoldi, A., Guidetti, L., & Baldari, C. (2014). Relationship among explosive power, body fat, fat free mass and pubertal development in youth soccer players: A preliminary study. Sport Sciences for Health, 10(2), 67–73. https://doi.org/10.1007/s11332-014-0175-z
- Plowman, S. A., Sterling, C. L., Corbin, C. B., Meredith, M. D., Welk, G. J., & Morrow, J. R. (2006). The history of FITNESSGRAM®. Journal of Physical Activity & Health, 3(Suppl. 2), S5–S20. https://doi.org/10.1123/jpah.3.s2.s5
- Quagliarella, L., Sasanelli, L., Belgiovine, G., Moretti, L., & Moretti, B. (2011). Power output estimation in vertical jump performed by young male soccer players. Journal of Strength and Conditioning Research, 25(6), 1638–1646. https://doi.org/10.1519/jsc.0b013e3181d85a99
- Rogers, S. A., Hassmen, P., Hunter, A., Alcock, A., Crewe, S. T., Strauts, J. A., Gilleard, W. L., & Weissensteiner, J. R. (2019). The validity and reliability of the MyJump2 application to assess vertical jumps in trained junior athletes. Measurement in Physical Education and Exercise Science, 23(1), 69–77. https://doi.org/10.1080/1091367X.2018.1517088
- Ruiz, J. R., Castro-Pinero, J., Espana-Romero, V., Artero, E. G., Ortega, F. B., Cuenca, M. M., Jimenez-Pavon, D., Chillon, P., Girela-Rejon, M. J., Mora, J., Gutierrez, A., Suni, J., Sjostrom, M., & Castillo, M. J. (2011). Field-based fitness assessment in young people: The ALPHA health-related fitness test battery for children and adolescents. British Journal of Sports Medicine, 45(6), 518–524. http://dx.doi.org/10.1136/bjsm.2010.075341
- Saint-Maurice, P. F., Anderson, K., Bai, Y., & Welk, G. J. (2016). Agreement between VO 2peak predicted from PACER and One-Mile Run Time-equated laps. Research Quarterly for Exercise and Sport, 87(4), 421–426. https://doi.org/10.1080/02701367.2016.1216067
- Sayers, S. P., Harackiewicz, D. V., Harman, E. A., Frykman, P. N., & Rosenstein, M. T. (1999). Cross-validation of three jump power equations. Medicine and Science in Sports and Exercise, 31(4), 572–577. https://doi.org/10.1097/00005768-199904000-00013
- Staudenmayer, J., Zhu, W., & Catellier, D. J. (2012). Statistical considerations in the analysis of accelerometry-based activity monitor data. Medicine and Science in Sports and Exercise, 44(Suppl.), S61–S67. https://doi.org/10.1249/mss.0b013e3182399e0f
- Taani, M. H., Kovach, C. R., & Buehring, B. (2017). Muscle mechanography: A novel method to measure muscle function in older adults. Research in Gerontological Nursing, 10(1), 17–24. https://doi.org/10.3928/19404921-20161209-03
- Van Praagh, E., & Dore, E. (2002). Short-term muscle power during growth and maturation. Sports Medicine, 32(11), 701–728. https://doi.org/10.2165/00007256-200232110-00003
- Ward, R. C., Janz, K. F., Letuchy, E. M., Peterson, C., & Levy, S. M. (2019). Contribution of high school sport participation to young adult bone strength. Medicine and Science in Sports and Exercise, 51(5), 1064–1072. https://doi.org/10.1249/MSS.0000000000001870
- Welk, G. J., Janz, K. F., Laurson, K., Mahar, M. T., Zhu, W., & Pavlovik, A. (2022). Development of criterion-referenced standards for musculoskeletal fitness in youth: Considerations and approaches by the fitnessgram scientific advisory board. Measurement in Physical Education and Exercise Science, 1–13. https://doi.org/10.1080/1091367X.2021.2014331
- Yildiz, M., & Fidan, U. (2020). The reliability and validity of the Fitjump photoelectric cell system for determining vertical jump height. Measurement in Physical Education and Exercise Science, 24(1), 56–64. https://doi.org/10.1080/1091367X.2019.1673394
- Zengin, A., Pye, S. R., Cook, M. J., Adams, J. E., Rawer, R., Wu, F. C. W., O’Neill, T. W., & Ward, K. A. (2017). Associations of muscle force, power, cross-sectional muscle area and bone geometry in older UK men. Journal of Cachexia, Sarcopenia and Muscle, 8(4), 598–606. https://doi.org/10.1002/jcsm.12198