
ABSTRACT
The use of Open Government Data (OGD) has not kept pace with the expectations as existing OGD infrastructures mainly serve as data repositories. Many OGD infrastructures do not stimulate or support OGD use processes, and there is a lack of research regarding which functionalities can stimulate such processes. The objective of this study is to use a design science approach to evaluate whether metadata, interaction mechanisms, and data quality indicators can improve OGD use. OGD use comprises five main activities, namely searching for and finding OGD, OGD analysis, visualizing OGD, interacting about OGD, and OGD quality analysis. We expect that three OGD key infrastructure elements—metadata, interaction mechanisms, and data quality indicators—allow for improving these five OGD use activities. A prototype of an advanced OGD infrastructure was created, which implements the three OGD infrastructure elements. Three quasi-experiments with a pretest posttest control group design were conducted. The quasi-experiments showed that the prototype facilitated the usability of the novel OGD use functionalities. Our quasi-experiments supported our propositions that metadata, interaction mechanisms, and data quality indicators contribute to making OGD use easier and faster, and enhance the user experience. The infrastructure elements improved OGD use by better enabling searching, analyzing, visualizing, discussing, giving feedback on, and assessing the quality of open data. Hence, we plea for integrating metadata, interaction mechanisms, and data quality indicators in open data infrastructures to advance open data usage.
1. Introduction
The use of Open Government Data (OGD) is still in its infancy. A first wave of OGD infrastructures provides only basic functionalities for uploading and downloading data (Alexopoulos, Spiliotopoulou, and Charalabidis Citation2013; Charalabidis, Loukis, and Alexopoulos Citation2014), whereas merely providing access to information is not enough for actively involving open data users (Jurisch et al. Citation2015). Existing OGD infrastructures have shortcomings such as the limited provision of information about the context in which the data have been created (Alexopoulos, Spiliotopoulou, and Charalabidis Citation2013), the limited opportunity for open data users to participate in improving published data (Alexopoulos, Spiliotopoulou, and Charalabidis Citation2013) (e.g., through cleaning and processing and through social media discussions), and the ranging data quality (Auer et al. Citation2013; Kuk and Davies Citation2011; Petychakis et al. Citation2014).
As a consequence, there is a feeling that OGD is not yet showing its full potential (Jetzek, Avital, and Bjorn-Andersen Citation2014; Novais, Albuquerque, and Craveiro Citation2013; Jetzek Citation2015), and the use of open datasets is low (Bertot, McDermott, and Smith Citation2012; Jurisch et al. Citation2015). At the same time, it has been argued that the next generation of OGD infrastructures may help to overcome a number of barriers for OGD use (Charalabidis, Ntanos, and Lampathaki Citation2011; Zuiderwijk Citation2015). OGD infrastructures may make it easier to use OGD, and in this way they may stimulate the adoption of open data and contribute to attaining the objectives of governmental open data policies. Nevertheless, there is a lack of research regarding which functional elements of OGD infrastructures can stimulate OGD use. The objective of this study is to use a design science approach to evaluate whether three functional elements (metadata, interaction mechanisms, and data quality indicators) can improve OGD use.
This article is organized following the common phases of design science research. Design science research (e.g., Peffers et al. Citation2008; Hevner et al. Citation2004; March and Smith Citation1995) in essence suggests to start with the identification of the problem, which will be done in the following section. Subsequently, objectives of a solution should be identified, which will be done in section three encompassing an overview of potential functional elements for an OGD infrastructure derived from the literature. The design and development of an artefact (building), as well as the evaluation of the artefact are other subsequent elements that design science research commonly incorporates (March and Smith Citation1995). In section four we describe the design of the OGD infrastructure prototype that was created as part of this research, and thereafter the evaluation approach and results are presented in sections five and six. Finally, conclusions regarding the usefulness of the functional OGD infrastructure elements are drawn.
2. Open data use and OGD infrastructures
Despite the availability of a large number of datasets, OGD use is still low (Bertot, McDermott, and Smith Citation2012; Jurisch et al. Citation2015). An OGD infrastructure can be defined as “a shared, (quasi-)public, evolving system, consisting of a collection of interconnected social elements (e.g. user operations) and technical elements (e.g. open data analysis tools and technologies, open data services) which jointly allow for OGD use” (Zuiderwijk Citation2015, 45). To identify which OGD infrastructure elements may improve OGD use, we used the literature to generate an overview of the activities that OGD use comprises. The literature suggests that OGD use activities can be divided into five main categories: searching for and finding OGD, OGD analysis, OGD visualization, interaction about OGD, and OGD quality analysis (see ).
Table 1. A categorization of OGD use.
Next, an overview of the major factors that hinder these OGD use activities is made. The latter is used to select the main activities that we will improve. The literature reveals many factors that complicate each of the five identified OGD use activities. With regard to searching for and finding OGD the literature shows that locating existing OGD is complex and accompanied with high costs (Ding, Peristeras, and Hausenblas Citation2012). Data are offered at many different places (Braunschweig et al. Citation2012a; Conradie and Choenni Citation2014; De Vocht et al. Citation2014), and can sometimes be hard to find (Conradie and Choenni Citation2014; Braunschweig et al. Citation2012a). Open data are fragmented by default (De Vocht et al. Citation2014). Moreover, each discipline has its own terminology, which leads to heterogeneity (Reichman, Jones, and Schildhauer Citation2011). Different terms and vocabularies are often used to describe open datasets (Yannoukakou and Araka Citation2014). Further, search options of many open data infrastructures are limited (Petychakis et al. Citation2014). In addition, Ho and Tang (Citation2001) found that available data and information may become overwhelming in general. Also in the case of open data increasing amounts of data may lead to the situation in which open data users receive too much information. More and more governmental datasets are becoming available for public reuse (Sieber and Johnson Citation2015), and this may lead to the situation in which open data users receive too much information. In sum, it was found that factors hindering searching for and finding OGD are mainly related to data fragmentation, terminology heterogeneity, a lack of search support, and information overload.
As far as OGD analysis is concerned, open datasets may be used for other purposes than those that they were created for initially. Dawes, Pardo, and Cresswell (Citation2004) found that reusing information collected for one purpose for other purposes may potentially result in misuse, misunderstanding, and misinterpretation. This equally applies to the open data field, as open data can be reused for other purposes than they were collected for originally. The fear of drawing false conclusions from open data use is commonly mentioned (Conradie and Choenni Citation2014). Moreover, Alexopoulos, Spiliotopoulou, and Charalabidis (Citation2013) noted that open data infrastructures traditionally do not provide contextual information for the offered datasets. This poses a problem, since a large part of the population lacks knowledge of the context of these data (Foulonneau, Martin, and Turki Citation2014). In addition, Braunschweig and colleagues (2012a) posited that the analysis of data requires the use of different tools. At the same time, Novais, Albuquerque, and Craveiro (Citation2013) pointed at the lack of tools to generate information that can easily be understood by the population. Moreover, it has been argued that most traditional open data infrastructures only supply basic data download and upload functionalities instead of more advanced data analysis tools (Alexopoulos, Spiliotopoulou, and Charalabidis Citation2013; Charalabidis, Loukis, and Alexopoulos Citation2014). The lack of support for data analysis might influence to which extent OGD can be analyzed effectively. In conclusion, we argue that OGD analysis is influenced by the data context, the extent of data interpretation support, data heterogeneity, and data analysis support.
Regarding OGD visualization, several scholars have stated that visualization tools are useful (De Vocht et al. Citation2014) or even necessary for using open data (Shadbolt et al. Citation2012). For instance, visualization tools based on maps can be used to obtain insight in datasets. O’Hara (Citation2012) and Alani and colleagues (2008) specifically pointed at the importance of maps for making sense of data. Open data visualizations may facilitate the processes in which nonexpert users discover and analyze data, find links between them, and obtain insights (Dimou et al. Citation2014). However, the literature also shows that OGD visualization functionalities are barely provided to OGD users by existing OGD portals (Sayogo, Pardo, and Cook Citation2014; Liu, Bouali, and Venturini Citation2014). Thus, complexities related to data visualization are mainly influenced by a lack of data visualization support.
With regard to interaction about OGD, the delivery of open data is characterized by a lack of opportunity for public participation and engagement (Sieber and Johnson Citation2015). For instance, conversations about released data are lacking (idem). Such conversations are also lacking for used data. Moreover, many OGD providers do not know who their external users are (Archer et al. Citation2013). Feedback mechanisms can be used for interaction about OGD. However, Archer and associates (Citation2013) posited that even if feedback mechanisms are offered, this type of feedback is characterized by informal communications as part of institutional collaborations, comments on blogs and replies to tweets. Most governmental agencies do not offer feedback mechanisms for open data (Alexopoulos, Spiliotopoulou, and Charalabidis Citation2013, Archer et al. Citation2013). In addition, most open data infrastructures traditionally do not facilitate the improvement of opened data (e.g., through cleaning and processing) (Alexopoulos, Spiliotopoulou, and Charalabidis Citation2013). We argue that interaction about OGD is affected by two key factors, namely a lack of interaction and a lack of interaction support and tools.
Finally, as far as data quality analysis is concerned, the literature shows that data quality plays an essential role in the use of government portals (Detlor et al. Citation2013). A certain level of data quality is essential for OGD use. Yet, the quality of data varies widely (Kuk and Davies Citation2011; Petychakis et al. Citation2014). Users may be concerned about the quality of open data (Martin Citation2014) and open data often suffer from poor quality, such as inconsistency in terms used in datasets and a lack of granularity (Kuk and Davies Citation2011). Since open data can be reused over time; this can easily affect the quality of the data (Oviedo, Mazon, and Zubcoff Citation2013). Issues related to the poor quality of open data can be a major issue (Karr Citation2008; Whitmore Citation2014). In sum, the literature shows that OGD quality analysis is influenced by factors related to the dependence on the quality of open data, poor data quality, and quality variation and changes. summarizes the identified OGD use categories and the identified factors hindering OGD use.
Table 2. Overview of factors hindering OGD use.
3. Functional elements of the OGD infrastructure
Section two showed that many factors influence and complicate the five identified types of OGD use, while this section identified objectives of a solution. The five types of OGD use may be improved through an OGD infrastructure. Propositions for the design of the OGD infrastructure were created in collaboration with partners from the ENGAGE-project, which was a combination of a Collaborative Project and Coordination and Support Action (CCP-CSA) funded by the European Commission under the Seventh Framework Programme. A design proposition can be defined as “a general template for the creation of solutions for a particular class of field problems” (Denyer, Tranfield, and van Aken Citation2008, 395). The design propositions suggest on a high level which functional infrastructure elements may be used to improve OGD use. For the next generation of OGD infrastructures, we propose three key elements to improve OGD use, namely metadata, interaction mechanisms, and data quality indicators. Although there may be other ways to deal with the hindering factors, these infrastructure elements were found to be critical. The following design propositions were generated:
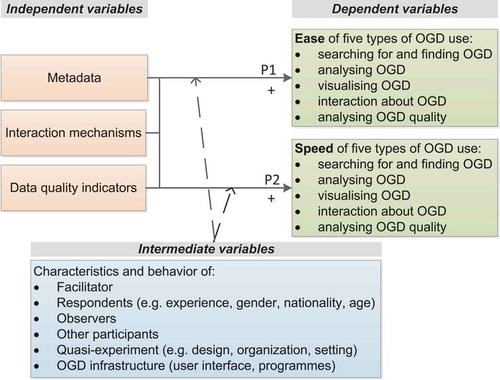
Proposition 1: Metadata, interaction mechanisms, and data quality indicators positively influence the ease of OGD use in the five identified OGD use categories.
Proposition 2: Metadata, interaction mechanisms, and data quality indicators positively influence the speed of OGD use in the five identified OGD use categories.
In the remainder of this section we discuss the different aspects of these design propositions. First, although successful OGD use can be measured through various aspects (e.g., satisfaction, efficiency, or effectiveness), this study focuses on the ease and speed of OGD use. This was done because we endorse the idea that ease and speed of OGD use are the basis for successful OGD use. If OGD use would be very difficult, or if it would take considerable time, we believe that the satisfaction of OGD users will not be high. Likewise, the efficiency and effectiveness of OGD use is not expected to be high if ease and speed of OGD use are insufficient.
Second, metadata may assist in organizing a diversity of content sources, managing content, and describing resources (Duval et al. Citation2002). Metadata can assist in describing, locating, and retrieving resources efficiently and may improve their accessibility (Joorabchi and Mahdi Citation2011). At the same, time metadata provision for open data is often cumbersome (Martin Citation2014). The literature postulates that it is essential for the correct interpretation and use of open data to offer sufficient metadata simultaneously to data (Jeffery Citation2000; Braunschweig et al. Citation2012b) We propose metadata as a mechanism to improve all the five types of OGD use, including searching for and finding OGD, OGD analysis, OGD visualization, interaction about OGD, and assessing the quality of OGD.
Third, different types of interaction mechanisms may affect to which extent users can interact on OGD infrastructures and can engage and collaborate. The interaction between open data providers and users in OGD processes may be stimulated through various functionalities. For example, Dawes and Helbig (Citation2010) and Bertot, McDermott, and Smith (Citation2012) suggested the development of formal feedback mechanisms. Since users may discover and correct errors in the data and communicate such errors and improvements to the data provider and other data users; this type of feedback may lead to continuous improvements to datasets of benefit to all future users of the dataset (Dawes and Helbig Citation2010). Moreover, public agencies can profit from user feedback and engage the public in agency operations to asses which data the public desires and to respond to queries (Bertot, McDermott, and Smith Citation2012). Existing social media may be used to engage people in open datasets (Garbett et al. Citation2011) and to facilitate openness and transparency efforts (Stamati, Papadopoulos, and Anagnostopoulos Citation2015).
Finally, the literature overview showed that open data success depends strongly on the quality of released datasets (Behkamal et al. Citation2014). OGD reuse requires that potential data users can trust that datasets which they want to use are of sufficient quality (O’Hara Citation2012). However, the quality of open data can easily be affected because of the reuse of the data (Oviedo, Mazon, and Zubcoff Citation2013). At the same time the quality of data varies widely (Kuk and Davies Citation2011; Petychakis et al. Citation2014), and also depends on the purpose that one has for the reuse of an open dataset. The quality of OGD may be too low to use them for certain purposes. It is therefore important that OGD users can obtain more insight in the quality of OGD that they want to use.
After the design propositions had been created, we developed design principles to guide the design efforts. Whereas the design propositions had been described on a relatively high level of abstraction, the design principles further refined the design input. Gilb (Citation1997, 165) defined principles as “rules of thumb that guide the choices and actions of engineers.” A literature review regarding metadata, interaction, and data quality was conducted to elicit design principles. Examples of elicited design principles are “metadata facilitate the integration of data and information from heterogeneous sources” (Jeffery Citation2000), “the integration of existing social media may facilitate the engagement of people with open data” (Garbett et al. Citation2011), and “information about the nature of datasets and about factors that determine data quality support the assessment of data quality” (Dawes Citation2010). Based on the elicited design principles, the functional design of the OGD infrastructure was described. The design of the infrastructure is an iterative process, and various iterations took place between the functional design of the OGD infrastructure and the design principles. Examples of defined functions are “upload dataset,” “request data,” and “assess or examine structured data quality ratings.” A selection of these functions was implemented in the prototype design, as described in the following section.
4. Prototype design
Prototyping refers to building a working version of various aspects of a system (Bernstein Citation1996). To be able to evaluate the three OGD infrastructure elements and to further refine the user requirements, a prototype of the infrastructure was developed which was called “ENGAGE.” The prototype was constructed as part of the ENGAGE project, which was a combination of a Collaborative Project and Coordination and Support Action (CCP-CSA) funded by the European Commission under the Seventh Framework Programme. Almost all the functions that we had defined in the functional design were selected for implementation in the prototype, except for “convert data format,” “refer to data,” “link data manually,” “enter an open collaboration group,” “enter a closed collaboration group,” and “compare different quality ratings and reviews.” These six functions were not implemented due to time limitations, because using these functions in the evaluations would be too time-consuming, and because these three functions are not central to the five OGD use activities of searching for and finding OGD, OGD analysis, OGD visualization, interaction about OGD, and OGD quality analysis. provides an overview of the functionalities implemented in the prototype. Screenshots of the prototype are provided in Appendix A .
Table 3. Overview of the implemented prototype functionalities.
A four-tier architecture was implemented in the prototype, including a user interface layer, a presentation logic layer, a business logic layer, and a data access layer. The user interface layer contained the user interface components for the external interfaces, and was used for the communication between end-users and the rest of the system. The presentation logic layer supported workflows for user activities on the ENGAGE prototype and the provision of meaningful information to users of the prototype. In the business logic layer business logic decisions, data processing and process scheduling were enabled, while the data access layer provided access to stored data underlying the user activities.
5. Evaluation methodology: Quasi-experiments
This section aims to evaluate the OGD infrastructure elements that were discussed in section three. The evaluation aimed at examining to which extent the functional infrastructure elements can improve OGD use. In the following sections the evaluation approach and structure using three quasi-experiments with a pretest posttest control group design are described.
5.1. Quasi-experimental approach
We aimed to evaluate the developed prototype in a realistic setting in which participants had to operate the prototype, and at the same time we wanted to control the variables to test our propositions and to ensure that the effects could be attributed to metadata, interaction mechanisms, and data quality indicators. Experiments can be conducted to manipulate variables and observe their effects on other variables (Campbell and Stanley Citation1969, 2). An experiment can be defined as “a study in which an intervention is deliberately introduced to observe its effects” (Shadish, Cook, and Campbell Citation2002, 12), and can be either a true experiment or a quasi-experiment. Quasi-experiments encompass (1) a treatment and a control condition, (2) a pretest and a posttest, and (3) a model that reveals the treatment and the control group effects over time, given no treatment effects (Kenny Citation1975). In quasi-experiments researchers can have control over selecting and scheduling measures, how the participants are assigned nonrandomly, over the type of control group with which the treatment group is compared, and over how the treatment is organized (Shadish, Cook, and Campbell Citation2002). Since it was not possible for our evaluations to randomly assign participants to treatment and control groups, we cannot refer to the evaluations as a true experiments (Campbell and Stanley Citation1969). Therefore we conducted quasi-experiments. shows the variables involved in the quasi-experiments.
Figure 1. Overview of the variables involved in the quasi-experiments.
lists the key characteristics of the quasi-experiments. Two groups of participants participated in the quasi-experiments, namely students and professional open data users. For the students, the quasi-experiments were part of a mandatory course, while the professionals participated in the quasi-experiments as part of a workshop on open data in which they participated voluntarily.
Table 4. Overview of the characteristics of the quasi-experiments.
5.2. Treatment versus control condition
Three groups were given two different infrastructures to test the effect of the introduction of metadata, interaction mechanisms, and data quality indicators. Quasi-experiments were conducted with three groups to ensure that sufficient participants were involved and that the responses to the questionnaire could be analyzed with statistical tests. The other conditions for the treatment groups and the control group remained as equal as possible. The metadata model of the control OGD infrastructure described datasets in Dublin Core fields with additional options from Qualified Dublin Core. These standards are mainly focused on discovery metadata and provide limited information about the context of datasets (Zuiderwijk Citation2015). Metadata fields that were mandatory to complete were title, creator, date created, description, access rights, date available, and audience. Optional metadata fields include contributor(s), subject, spatial coverage, temporal coverage, source, identifier, format, relation, language, and remarks (The Data Seal of Approval Board Citation2013). The control OGD infrastructure allowed for several functionalities related to metadata that the treatment OGD infrastructure also supported, although usually in a more limited way. For instance, tools for visualizing data in tables were available for a limited number of datasets. The treatment OGD infrastructure provided more metadata fields in various categories, and incorporated contextual and detailed metadata, whereas these types of metadata were barely provided by the control infrastructure. provides an overview of the metadata fields incorporated in the treatment OGD infrastructure.
Figure 2. Overview of the metadata fields incorporated in the prototype.
The control OGD infrastructure did not provide interaction mechanisms, and thus it did not facilitate the interaction functionalities that the treatment OGD infrastructure contained. The control OGD infrastructure did provide scores about quality aspects of datasets (e.g., about the completeness of the data and the format in which it was provided) for a number of assessed datasets, in this way also facilitating some data quality functionalities mentioned in section four. At the time of the evaluations, there was no possibility to write a free-text review about the quality of the data or for which purposes it could be used, and this type of functionality was not supported by the control infrastructure.
5.3. Structure of the quasi-experiments
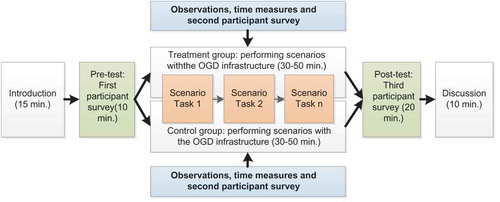
The quasi-experiments were conducted as follows (see ). First, the quasi-experiment was introduced to the participants and instructions were given. Second, a pretest (i.e., the first participant survey) was conducted to measure various background characteristics of the participants, as well as their experience with OGD infrastructures. Third, participants completed scenario tasks as well as a second participant survey about the difficulty of these tasks. While the participants completed the scenarios tasks, time measures and observations were used to obtain additional information. Time measures were used to examine how long it took to conduct the scenario tasks and to investigate whether there were significant differences between the time used to conduct the scenarios by the treatment group and the time used by the control group. The results from the observations have already been described by Zuiderwijk and Janssen (Citation2015) and are outside the scope of this article. Fourth, a posttest was used to measure whether the OGD infrastructure had influenced to which extent the scenario tasks could be completed. Finally, in a plenary discussion the participants were asked which tasks they found most difficult, which tasks they found easiest, and whether they had any suggestions to improve the investigated open data infrastructure. More detailed information about the structure of the quasi-experiments is provided in Appendix B.
Figure 3. Structure of the quasi-experiments.
6. Findings
In this section we report on and discuss the results from the quasi-experiments. First, the results from the reliability analysis of the constructs will be described, followed by an overview of the characteristics of the participants involved in the quasi-experiments. Subsequently it will be described to which extent the two propositions that were developed in section three were supported by the quasi-experiments.
6.1. Reliability analysis
A reliability analysis was conducted to measure the consistency of the constructs of the model, which was required because the different types of OGD use were measured through a number of statements. Cronbach’s Alpha, which is also known as the reliability coefficient, was calculated to obtain information about the reliability of the constructs. Values of 0.7–0.8 are acceptable values for Cronbach’s alpha (Field Citation2005, 668). Murphy and Davidshofer (Citation1988) stated that alpha values below 0.6 are unacceptable, values of 0.7 are low, values between 0.8 and 0.9 are moderate to high, and values around 0.9 are high. Others (e.g., Davis Citation1964; Nunnally Citation1967) have recommended a lower acceptance boundary and believe that Alpha values between 0.5 and 0.6 can still be acceptable. shows the Cronbach alpha values for the five constructs (OGD use activities) that are used in our model for both the pretest and posttest. Except for the open data analysis construct in the pretest, all Cronbach’s Alpha values were moderate (0.726) to high (0.921). Cronbach’s Alpha value for the open data analysis construct in the pre-test is lower (0.633), yet not unacceptable.
Table 5. Reliability analysis of the constructs included in the pretest and posttest (N = 127, 7 = missing).
6.2. Background of the respondents
In total 127 persons participated in the quasi-experiments. Out of the 127 participants, 116 completed the first, second and third participant survey. Eleven persons completed only one or two of these surveys. depicts the key characteristics of the participants. The table shows that in both the control and the treatment group of all the three quasi-experiments and the majority of the participants were male. Although no research has been conducted on the gender of the population of OGD users, we expect that the population of OGD users consists of more men than women. For example, research of Seybert (Citation2007, 1) found that “many more men than women are employed in computing jobs throughout the EU.” The percentage of males per condition (control or treatment) in the quasi-experiments ranged from 65% to 90% and the percentage of females from 10% to 31%. The average age of the 120 participants who provided age information was 27.9 years with a standard deviation of 9.4 (range: 20–65 years old). Participants of the third quasi-experiment were relatively older (µ: 38.7, σ: 12.4, range 21–65) than participants of the first and second quasi-experiment. Additionally there was a small difference between the average age of participants of the first (µ: 21.8, σ: 1.7, range 20–26) and second quasi-experiment (µ: 24.4, σ: 2.0 range 21–32), as participants of the second quasi-experiment were slightly older. The differences in age between the control and treatment groups within the first and second quasi-experiment were relatively small.
Table 6. Characteristics of the participants of the quasi-experiments.
With regard to nationality it was found that all participants of the first quasi-experiment were Dutch, while in the second and third quasi-experiment more nationalities were represented. In the second quasi-experiment, about half of the participants in the treatment group as well as half of the participants in the control group were Dutch, while the other half consisted of participants from other countries. While the number of foreign participants from the Germanic European cluster were relatively equal in the treatment and control group in the second quasi-experiment, differences between the control and treatment group were visible for the Southern Asian cluster (34.4% in the control group versus 5% in the treatment group), the Eastern European cluster (0% in the control group versus 15% in the treatment group) and the Latin European cluster (3.1% in the control group versus 15% in the treatment group). In the third quasi-experiment about 75% of the participants belonged to the Germanic Europe cluster, while most of the other participants belonged to the Anglo cluster (8.3%) or their nationality was not provided (11.1%). The third quasi-experiment only involved one Southern Asian participant. Even though we found that students from the control group were already more positive in the pretest of the fourth and fifth scenario than the treatment groups of students, and the treatment group of students was already more positive than the treatment group of professionals, nationality does not explain these differences. Moreover, the differences in nationalities appear not to have influenced the results of the pretest for the first, second, and third scenario. We conclude that nationality cannot explain the differences between the three quasi-experiments.
In addition, the participants were asked how often they were involved in open data use in daily life. In all quasi-experiments the minority of people indicated that they had never used open data, varying from 10% to 40.6% per cent of the participants within the quasi-experiments. The participants in the control group of the second quasi-experiment seemed to have used open data less often, as more people in this control group had never used open data before compared to the treatment group (40.6% versus 27.5%). Yet, the control group still contained several people who had used open data monthly, weekly and daily. Furthermore, the self-reported level of experience of persons in the control group appeared to be slightly higher than the experience of the participants in the treatment group. Participants who had been involved in open data use were asked to assess their level of experience on a scale from 1 to 10. The average self-reported level of experience varied from 5.8 (control group) and 4.3 (treatment group) in the first quasi-experiment, to 5.1 (control group) and 4.0 (treatment group) in the second quasi-experiment and 6.3 (treatment group) in the third quasi-experiment. Of those participants who had been involved in using open data, most had been involved in using open data for 2 to 5 years (33 participants) or for 5 to 10 years (24 participants). In each quasi-experiment there were participants with different levels of experience.
The number of participants from the first quasi-experiment is too small to statistically analyze the results from this group separately. Since the participants from the first and second quasi-experiment were relatively comparable with regard to gender, age, and experience with open data use, and since both groups contained students from studies in similar directions, the results from the treatment and control groups of the first and second quasi-experiment were combined. We acknowledge that the respondents from these two groups may still be different with regard to certain characteristics that we did not measure. A limitation of this study is that it could not provide insight in this. Although the findings from the control group and treatment group in the first and second quasi-experiment allow for combining them, the findings from the third quasi-experiment will be described separately. This will be done because the differences between age, daily occupation, and experience with open data use were larger for this group, which might have influenced the outcomes of the quasi-experiment.
6.3. The ease of OGD use
In this section it is discussed to which extent metadata, interaction mechanisms, and data quality indicators influenced the ease of OGD use from the perspective of the participant surveys. provides the mean assessment of all the OGD use scenario tasks that were evaluated in the quasi-experiments, as well as the standard deviations. The scenario tasks were rated on a Likert scale from 1 to 7. A mean score of 1 means that respondents strongly disagreed with a statement regarding that scenario, indicating a very negative response. A mean score of 7 means that respondents strongly agreed with a statement regarding the scenario, indicating a very positive response. Mean values around 4 indicate a neutral attitude of the respondent. The means and standard deviations are provided for both the pretest and the posttest for all the involved control and treatments groups.
Table 7. Means and standard deviations of the open data use related scenario tasks on a Likert scale from 1 to 7 (n = 127).
When the results of the pretest for the first three scenarios are compared with the results of the posttest for the first three scenarios, it is observed that the posttest results of the control group are slightly more negative than the pretest results of the control group. This suggests that the control OGD infrastructure functioned slightly worse than the participants had expected based on their experience with other OGD infrastructures. In contrast, the posttest results of the students treatment group were all more positive than the pretest results of this group, except for one functionality (i.e., to use various options to search for data, as the participant were already relatively positive about this functionality in the pretest). For the treatment group of professionals, eight of the eleven posttest results were more positive than the pretest results of this group. For three functionalities the posttest results were more negative than the pretest results, namely for (1) drawing conclusions based on the data that they found, (2) visualizing data in a chart, and (3) visualizing data on a map. These functionalities functioned slightly worse than the participants had expected based on their experience with other existing OGD infrastructures. The problems with data visualizations were illustrated by quotes of the participants. For example, professional open data users stated that they: “didn’t find the visualization tools easy to use,” “the visualizing (chart, graph, map) was a bit difficult to use,” and “the icons for table, graphs and map in the visualization part seem redundant.” In spite of this, the results from treatments groups are still more positive than the results from the control group.
When we compare the mean values from the pretest and the posttest for scenarios 4 and 5, it can be concluded that for the control group the post-test values are clearly lower than the pretest values. For the treatment groups this is the other way around, revealing that the post-test values are all higher than the pretest values. This suggests that the OGD infrastructure used by the control group performed worse than the participants would have expected based on their previous experiences. The prototype performed better than other OGD infrastructures with which participants had experience.
To be able to measure whether the level of difficulty of conducting the scenario tasks was significantly different for the control and treatment groups of students, the Mann-Whitney Test (Mann and Whitney Citation1947) was conducted. The Mann-Whitney test is the nonparametric equivalent of the independent t-test (Field Citation2009, 540), which was used since the sample did not meet the assumptions for parametric tests (the data was not normally distributed), there was one outcome variable (level of difficulty), the type of outcome was continuous (seven-point Likert scale), there was one categorical predictor variable with two categories (whether the participant was in the treatment or the control group), and different participants were used for the treatment and the control group.
The Mann-Whitney test showed that the level of difficulty of scenario tasks related to all five open data scenarios of the student treatment group differed significantly from the level of difficulty of these tasks of the student control group (see ). On average the students in the treatment group found it significantly easier to conduct scenario tasks related to searching for and finding open data (scenario 1), analyzing open data (scenario 2), visualizing open data (scenario 3), interacting about open data (scenario 4), and rating and reviewing data quality (scenario 5) than the students in the control group. Since the quasi-experiments only incorporated a treatment group of professional open data users and no control group of professionals, we did not conduct a Mann-Whitney test for the professionals.
Table 8. Mann-Whitney Test to compare the level of difficulty of scenario tasks of the student treatment group to the level of difficulty of scenario tasks of the student control group (n = 91).
The results from the participant surveys indicated that in general the OGD infrastructure improved five types of OGD use: (1) searching for and finding OGD, (2) OGD analysis, (3) OGD visualization, (4) interaction about OGD, and (5) OGD quality analysis. This suggests that metadata, interaction mechanisms, and data quality indicators positively influenced the ease of these five types of OGD use.
6.4. The speed of OGD use
In this section we discuss to which extent metadata, interaction mechanisms, and data quality indicators influenced the speed of OGD use. Time duration measures can be used to find out how much attention a person paid to an object (Webb et al. Citation1973, 134). In this study we assume that the more time is spent on a task, the more attention a person needs to perform the task and the more difficult this task is. Yet it should be realized that other factors may also influence how much time a person spends on a task, such as a person’s character and perseverance, and the feeling of pressure from other participants and the facilitator to complete the tasks. It was therefore emphasized in the instructions that time measures were not done to assess the performance of the participants and that they should use as much time as they needed to conduct the tasks.
From the time measures we collected the average number of minutes spent on conducting each of the five scenarios and the standard deviations. depicts the results from the time measures for three groups of participants, namely the control group that was present in the first and second quasi-experiment, the treatment group of students that was present in the first and second quasi-experiment, and the treatment group of professionals that was present in the third quasi-experiment. The table shows that participants of the control group needed more time to conduct all the five scenarios than the participants of the student and professional treatment groups. On average the professional open data users in the treatment group conducted the scenarios slightly faster than the students in the treatment group. The participants of the control group needed on average 42 minutes to complete all the five scenarios, while the students of the treatment group needed 29 minutes (31% less) and the professionals of the treatment group needed 27 minutes (35.7% less).
Table 9. Number of respondents, average number of minutes spent on each scenario, and standard deviations for the control and treatment condition.
The Mann-Whitney test was used to test whether the average number of minutes spent on the scenarios was significantly different for the control and treatment group. The Mann-Whitney test showed that the number of minutes that the students of the treatment group used to conduct the five open data use scenarios (Mdn = 29) differed significantly from the number of minutes that the students of the control group used to conduct these scenarios (Mdn = 45), U = 215.00, p < 0.001. Moreover, the number of minutes that the professionals of the treatment group used to conduct the five open data use scenarios (Mdn = 27) differed significantly from the number of minutes that the students of the control group used to conduct these scenarios (Mdn = 45), U = 81.50, p < 0.001. This indicates that metadata, interaction mechanisms and data quality indicators allowed for faster use of OGD in the five identified OGD use categories, although the time measures did not focus on each of these three elements but on carrying out the scenario tasks.
6.5. Intermediate variables
Although we found that the developed prototype improves OGD use, we cannot claim that these effects have only been caused by the implemented metadata, interaction mechanisms, and data quality indicators. In addition, the participant surveys provided several other intermediate variables, which we believe have influenced the performance of the OGD infrastructure. This section discusses intermediate variables.
provides the means and standard deviations for six statements regarding intermediate variables concerning characteristics of the facilitator of the quasi-experiment and the quasi-experiment itself. A mean of one indicates that the respondent strongly disagrees with the statement, while a mean of seven points at strong agreement. The table shows that the participants in all three quasi-experiments on average agreed that the practical session on open data use was well-organized and well-structured. The participants of the control and treatment groups disagreed that the facilitator of the quasi-experiment influenced their behavior and they agreed that the facilitator had a neutral attitude. On average the participants indicated that they were neutral about or slightly agreed with the statement that the scenarios reflected open data use in a realistic way. The participants of the treatment group stated that they learned something by participating in the quasi-experiment, while the control group participants were more neutral about this.
Table 10. Means and standard deviations for questions about intermediate variables in the quasi-experiment derived from the participant surveys.
In addition, the participants of the quasi-experiments described several other intermediate variables in the participant surveys. First, the participants of the quasi-experiments pointed at the considerable influence of the user interface. Participants were asked to indicate whether the user interface had influenced their performance, and, if so, whether this influence was positive or negative. In the control group 63% of the participants indicated that the user interface had negatively influenced the difficulty to conduct the scenario tasks, while 20% said that the user interface had a positive influence and 10% said it had not influenced their performance. In contrast, 58% of the participants in the student treatment group and 41% of the participants in the professionals’ treatment group stated that the user interface of the prototype infrastructure had positively influenced their performance.
Participants in the treatment group mentioned that their performance on the OGD infrastructure was positively influenced through the use of clear and big buttons. For instance, a participant from the treatment group stated that “using big buttons on places where you expect them […] makes using the infrastructure very user-friendly.” In addition, the clarity of the buttons, headings and logo’s, and the organization of the interface were seen as a success factor of the prototype. Participants stated that that “the clear buttons, logical symbols and clear setup of the page” and “putting the information under clear headings and using logos” had positively influenced their performance. Another participant pointed at the importance of the contrast and colors, as this person wrote that “important buttons have a different contrast or color.” Several participants wrote that the user interface had positively influenced their performance by clearly presenting the possibilities of the infrastructure and the results of data analysis: “the simple design of the website makes it easier to find data”, the “clear friendly interface makes users easily find useful information,” the “clear structure by the different sections makes things easy to find,” and “it was easy to view the data in an efficient way.”
On the other hand, the user interface had also negatively influenced the performance of participants in the control group. They mentioned that the use of small symbols and the non-intuitive user interface had a negative influence on the way that the control OGD infrastructure could be used. One participant in the control group stated: “the UI [User Interface] is not intuitive, a lot of tasks couldn’t be completed,” which was confirmed by other participants: “it’s not clear where to click to conduct the tasks,” “it was not clear what functions could be used and where data could be found,” “not a very friendly user interface,” and “[the control OGD infrastructure] really needs to improve its interface (make it more intuitive).” Especially the font size seemed to have a negative influence (“the size of the words was very small. It was not very clear what to do where,” “very small symbols,” and “the pictograms being very small, it is more difficult to know they are to be used”).
An additional hindering factor concerned a lack of options to search for and filter data. Participants of the control group said that “it was not clear […] where data could be found” and “too much data is ‘duttered’ and the navigation menu [is] also confusing.” Regarding difficulties resulting from a lack of experience, participants stated that there was a negative influence from “having no experience at all with these kind of programs,” “having never worked with ENGAGE,” and “general IT-skills.” Another participant stated: “this was the first time I looked really into it so it took me some time to search.” Moreover, regarding the number of datasets, it appeared that the number of datasets provided can have a negative influence (“the index gives too many different datasets to be a good overview,” mentioned by a control group participant, and “huge number of datasets make search become hard”, mentioned by a treatment group participant). Required registration and problems with signing in on the platform were other hindering factors. The control group participants mentioned, for example: “registration is always required when you want to analyze something. And you need more than one account,” “constantly logged out (against will), ‘relog’ wasn’t always possible,” and “login was not possible, frustration occurred.”
The programs used appeared to be both hindering and enabling factors, and participants disagreed about this. For instance, a participant of the treatment group stated “Excel online is a little difficult to use,” while another participant pointed at the positive influence of “programs that help to visualize the data (Excel).” Some participants also wrote that “the programs are very useful and easy to understand” and “easy to use graphs and filters,” whereas someone else stated that “the way to create a chart was not easy to use.”
It is important to keep the these factors in mind when interpreting the results of this study, since these factors appeared to either positively or negatively influence the performance of users of the OGD infrastructures. The influence of the characteristics and behavior of the respondents is discussed in Section 6.2. The influence of the characteristics and behavior of the observers and other participants were limited. Two observers of the control group and two observers of the student treatment group wrote that some of the observed participants might have been influenced slightly by the observers, since it was visible to the participants that they were observed. Two observers of the student treatment group stated that some participants may to some extent have influenced other participants, as some asked each other questions, although it was tried to avoid this by separating the participants through partitions between them. The influence of the characteristics and behavior of the observers and other participants are discussed more in detail by Zuiderwijk and Janssen (Citation2015).
7. Discussion
In this section the contributions of this study are discussed, followed by considerations about the functional infrastructure elements and a number of limitations of this research.
7.1. Contributions of the study
In this study we investigated if the suggested elements of OGD infrastructures improve the ease and speed of use of OGD. Our quasi-experiment results showed that OGD infrastructures that include metadata, interaction mechanisms, and data quality indicators are easier and faster to use than those that do not include these elements. The need to support open data use resounds through the literature, as detailed in Section 2.2. We investigated how specific elements of OGD infrastructures can contribute to ease-of-use of OGD and speed of OGD use and thus help fulfil the potential of open data to generate new insights.
In our research we focused on a key aspect of open data progress—efficient use of open data. Data manipulation capabilities and user engagement capabilities of an OGD infrastructure are the two critical indicators for benchmarking OGD status (Sayogo, Pardo, and Cook Citation2014). Our study posits that data manipulation capabilities can be enhanced by a comprehensive metadata model and the functionalities related to it, such as sorting and filtering, keyword search, language support, metadata overview, viewing datasets online, and visualization tools (in tables, charts, maps). Using open data can often require considerable time and hard work (Braunschweig et al. Citation2012a); these functionalities can make the task of finding, understanding, analyzing, visualizing, and assessing data less cumbersome and time-consuming. By making data manipulation easier, OGD infrastructures have the potential to diversify the user base of open data and enable a more varied audience to discover and share knowledge derived from open data.
User engagement in open data stands for the ability to interact with the data provider and with other open data users. It offers much potential to move open data forward, as, for example, user-to-provider interaction can help improve the quality of data and make publication more demand-driven; and user-to-user interaction can help attract more users to the portal and enable peer review and collaboration, to name a few benefits. Our study finds that implementing functionalities related to interaction mechanisms in OGD infrastructures improves OGD use. Such functionalities can include social media integration, wikis, discussion forums and comments, or upload of files related to a dataset, as investigated in our quasi-experiments.
Recent research put a spotlight on the second generation of OGD infrastructures, those with advanced data processing and user feedback capabilities (Charalabidis, Loukis, and Alexopoulos Citation2014). This study used a design science approach to design a novel OGD infrastructure, which is new to the field of open data and which is an example of a second generation infrastructure. The study demonstrated that design science can be used to develop infrastructures which improve OGD use. Thanks to the novel features, OGD infrastructures have the potential to generate a higher level of value and satisfy the objectives of users and providers to a greater extent. Our study contributes in this direction and demonstrates the utility of such elements as metadata, interaction mechanisms, and data quality indicators for moving toward a more advanced OGD infrastructure. We recommend the wider application of design science in the field of open data.
7.2. Considerations regarding metadata, interaction mechanisms, and quality indicators
The designed metadata, interaction mechanisms, and quality indicators to a large extent rely on sharing findings from OGD use. For example, connecting a visualization of a dataset to the data themselves required sharing metadata about the visualization, and assessing the quality of data requires explaining for what purpose the data were used. This raises the question what incentives open data users have to share this information with other persons. OGD infrastructures should consider this aspect. For instance, OGD users might be more motivated to share findings of OGD use if they will see that this results in improved datasets or if they will be acknowledged for sharing their feedback by giving them credits or so-called kudos that they can earn and exchange for data use service or if they are acknowledged on the home page of the open data platforms or via social media.
Additionally, the value of the metadata, interaction mechanisms, and the quality indicators depends on the complexity of the tasks that are conducted and the knowledge of other open data users. Moreover, an OGD infrastructure may be very well-designed with required metadata fields, yet users may not add these required metadata at all. This might explain why some of the metadata aspects and feedback and discussion mechanisms were less appreciated by the participants of the quasi-experiments.
Furthermore, findings from OGD use may be invalid and based on wrongful data use, or wrongful metadata may be added. Sharing and disseminating wrongful findings may not only lead to incorrect interpretations of datasets by other open data users, but this may also be harmful for the provider of the data. For instance, when an open data user presents incorrect data usage and also refers to the original data provider for these results, the data provider may receive criticism as a consequence.
Moreover, data quality assessment is subjective and depends to a large extent on the user’s purpose for the data use and the user’s frame of reference. Having a larger user base to assess datasets may contribute to reducing this problem, although data quality assessment will always remain subjective. It is therefore important that quality assessment of OGD takes into account different types of data use, different data quality indicators, and that users provide a nuanced view on the assessment by describing the context of the way that they used the data. It should be explained for which types of use a certain dataset was useful and for which purposes it was not. These aspects cannot strictly be controlled, although quality checks may already be performed before datasets actually appear online. The maintainer of the dataset may conduct an initial data quality check before the data are published on the platform, which was not the case in our prototype.
Finally, for most functionalities that we tested in the quasi-experiments a critical mass of users is required to make the functionalities successful. For example, discussion messages and data rating reviews cannot be expected to be successful when only a few people provide them. Therefore, open data platforms using metadata, interaction mechanisms, and quality indicators require a large user base consisting of both data providers and data users. Engaging users to work with an OGD infrastructure that they are not used to yet is a challenging task.
7.3. Limitations
Although the prototype improved the speed and ease of OGD use, it is important to note that the prototype and this research have several limitations. First, the evaluations focused on a limited number of specific tasks related to metadata, interaction, and data quality, which needed to be conducted within a limited time frame. Due to time limitations it was not possible to conduct additional tasks or to conduct scenario tasks longer than about 50 minutes. A few participants were not able to complete the scenarios in this time frame. This seemed to be caused mainly by having a problem with one of the tasks, which resulted in spending much time on this particular task. For some functionalities a more thorough evaluation was desired by the participants, which meant that they desired to spend more time on that task. For instance, data quality rating required a thorough analysis of a dataset, and it may be difficult to assess the quality of an open dataset in a short time frame.
Second, in our evaluations we used three types of measures, namely time measures, observations, and questionnaires. In addition to these three measures, other measures of the performance of the quasi-experiment participants can be used. For example, when the participants conduct the predefined tasks, one may not only investigate the ease and speed of conducting the task, but also the performance of the participant. By using additional measures, more information could be obtained regarding the quality (e.g., the accuracy) of completing the task with the developed infrastructure.
Third, other factors may have influenced the outcomes, such as the user interface, experience with open data use, and search options. The participants involved in the quasi-experiments indicated that these factors played an important role in conducting the scenario tasks. The final results and the enhanced speed and ease of use cannot only be attributed to the metadata model, the interaction mechanisms, and the data quality indicators.
Fourth, these quasi-experiments involved a number of persons who had limited experience with OGD use (mainly the students). Despite the fact that all students had followed lectures on open data, the majority had not used open data very often themselves. The involvement of professional OGD users partly solved this problem. Yet it was not possible to have a control group of professional open data users, since the number of participants in the treatment group of professionals was too small to divide the group into both a control and treatment group to still be able to conduct statistical tests (which requires at least 30 participants per group). Moreover, in the first and second quasi-experiments the control infrastructure server was temporarily not available for some of the control group participants, so that we could not sufficiently rely on the control OGD infrastructure for the third quasi-experiment. This may have resulted in longer time durations to conduct the tasks for some participants of the control group. Some participants had no problems, while others had to wait for some minutes before they could use the control open data infrastructure again to conduct the tasks. For most participants the server problem occurred when they were conducting the tasks of the third scenario.
Finally, the quasi-experiments pointed at a number of prototype characteristics that can be improved. The prototype requires improvements especially regarding sustainability (“I need to see transparency of the business model that makes engage sustainable over a longer period of time”), visualizations (“the visualizing (chart, graph, map) was a bit difficult to use”), the section where participants could post messages to discuss data use (“having to scroll through all the comments” and “unable to reply to a comment made it a bit frustrating”), the user interface (“ENGAGE has high potential but needs some work in terms of interface and what users will need from the platform” and “some of the interface is intuitive but some things […] made it a bit frustrating”), and trust generation (there was a lack of information about what ENGAGE does with users’ (social media) account information and there were some other concerns about privacy).
8. Conclusions
This study focused on the issue of stimulating OGD use, namely we looked into the elements of OGD infrastructures that can improve OGD use. Based on the literature, we identified five types of activities that OGD use comprises: searching for and finding OGD, OGD analysis, visualizing OGD, interaction about OGD, and OGD quality analysis. In the study we endorsed the idea that three elements of OGD infrastructures—metadata, interaction mechanisms, and data quality indicators—can allow for improving these five OGD use activities. Hence the objective of this study was to use a design science approach to evaluate whether metadata, interaction mechanisms, and data quality indicators can improve OGD use. This study focused on the ease and speed of OGD use because we endorsed the idea that ease and speed of OGD use are the most important indicators for successful OGD use. To test the effects of the functional infrastructure elements, we conducted three quasi-experiments with students and professionals, involving 127 participants in total. The participants, divided into treatment and control groups, conducted five scenarios of OGD use using our prototype OGD infrastructure and a control OGD infrastructure. The prototype infrastructure had metadata, interaction mechanisms, and data quality indicators implemented in it. In addition to scenarios, the participants completed pretest and posttest surveys.
In our quasi-experiments, surveys showed that the treatment group found it significantly easier to conduct scenario tasks than the control group and indicated that the prototype infrastructure functioned better than they had expected based on their experience with other OGD infrastructures. Time measures showed that the treatment group needed significantly less time to conduct all scenarios than the control group. Hence, we conclude that our quasi-experiments indicate that metadata, interaction mechanisms, and data quality indicators positively influence the ease and speed of use of OGD and that OGD infrastructures positively influence the ease and speed of use of OGD. OGD infrastructures in general—and metadata, interaction mechanisms, and data quality indicators in particular—can thus contribute to making OGD use easier and enhance the user experience. To maximize the positive effect of these elements of OGD infrastructures, however, we argue that a critical mass of users is required who can engage in meaningful discussions, provide and peer-review data quality indicators, share, and spread the word about open data stories.
The contribution of our study is that we provide solid empirical evidence that by incorporating three elements in OGD infrastructures, open data use can be stimulated and made easier. Overall OGD use has been lower than expected and little is known about how to stimulate OGD adoption by users; therefore our study is a giveaway lesson for practitioners and data publishers. One contribution to research is that we enhanced the understanding of the use processes of open data, an issue which has received much less attention in open data literature so far than data publication practices. We identified five types of OGD use (searching for and finding OGD, analyzing OGD, visualizing OGD, interaction about OGD, and OGD quality analysis) and discussed intermediate variables that influence them. Future research is recommended to evaluate in more detail how other elements, such as interface design, might influence the ease and speed of use of OGD. We also suggest testing our propositions in larger user groups of professionals, as our study did not involve a control group of professionals. Finally, the application of a design science approach in the field of open data is recommended.
Additional information
Notes on contributors
Anneke Zuiderwijk
Dr. Anneke Zuiderwijk is a researcher in the Information and Communication Technology section of the Faculty of Technology, Policy, and Management at Delft University of Technology, the Netherlands. Anneke’s research covers, among others, open data use, open data ecosystems, socio-technical open data infrastructures and platforms, metadata for open data, open data business models, open data policy analysis, and open data release. Anneke has recently guest-edited two special issues for the Journal of Theoretical and Applied Electronic Commerce Research (JTAER), which concern open data innovation and open data policies and transparency. For more information see: http://www.tbm.tudelft.nl/nl/over-faculteit/afdelingen/engineering-systems-and-services/sectie-ict/medewerkers/anneke-zuiderwijk-van-eijk/.
Marijn Janssen
Dr. Marijn Janssen is full professor in ICT & Governance and head of the Information and Communication Technology section of the Technology, Policy, and Management Faculty of Delft University of Technology. His research interests are in the field of orchestration, (shared) services, intermediaries, open data and infrastructures within constellations of public and private organizations. He serves on several editorial boards and is involved in the organization of a number of conferences. He published over 300 refereed publications. More information: www.tbm.tudelft.nl/marijnj
Iryna Susha
Dr. Iryna Susha is researcher in informatics at the School of Business of Örebro University in Sweden. She is also a guest researcher at the Faculty of Technology, Policy, and Management of Delft University of Technology in the Netherlands. Her research is centered on citizen-driven innovation enabled by new information technologies and its effects on public policymaking and service delivery. In particular, one topic of interest is the use of open government data by diverse stakeholders for economic and societal benefit. Iryna’s research is part of the research school “Technology-mediated knowledge processes,” a joint effort of Örebro University and Dalarna University in Sweden.
Notes
1 This study of Zuiderwijk and Janssen (Citation2015) showed that interaction mechanisms and quality indicators add value and improve the use of OGD, although this study did not evaluate metadata. According to the observers, participants in the treatment group found it easier to conduct tasks with the prototype related to giving feedback on and discussing open data and rating and reviewing data quality than the participants in the control group.
References
- Alani, H., W. Hall, K. O’Hara, N. Shadbolt, P. Chandler, and M. Szomszor. 2008. Building a pragmatic semantic web. IEEE Intelligent Systems 23(3):61–68. doi:10.1109/MIS.2008.42.
- Alexopoulos, C., L. Spiliotopoulou, and Y. Charalabidis. 2013. Open data movement in Greece: A case study on open government data sources. In 17th Panhellenic Conference on Informatics. Thessaloniki, Greece: ACM.
- Archer, P., M. Dekkers, S. Goedertier, and N. Loutas. 2013. Study on Business Models for Linked Open Government Data (BM4LOGD). European Commission 2013. https://joinup.ec.europa.eu/community/semic/document/study-business-models-linked-open-government-data-bm4logd ( accessed February 23, 2015).
- Auer, S., J. Lehmann, A.-C. N. Ngomo, and A. Zaveri. 2013. Introduction to linked data and its lifecycle on the web. In Reasoning Web. Semantic technologies for intelligent data access, eds. S. Rudolph, G. Gottlob, I. Horrocks, and F. van Harmelen, 1–90. Mannheim, Germany: Springer.
- Behkamal, B., M. Kahani, E. Bagheri, and Z. Jeremic. 2014. A metrics-driven approach for quality assessment of linked open data. Journal of Theoretical and Applied Electronic Commerce Research 9(2):64–79. doi:10.4067/S0718-18762014000200006.
- Bernstein, L. 1996. Foreword: Importance of software prototyping. Journal of Systems Integration 6(1–2):9–14. doi:10.1007/BF02262748.
- Bertot, J. C., P. McDermott, and T. Smith. 2012. Measurement of open government: Metrics and process. In 45th Hawaii International Conference on System Sciences. Hawaii, USA.
- Braunschweig, K., J. Eberius, M. Thiele, and W. Lehner. 2012a. OPEN—Enabling non-expert users to extract, integrate, and analyze open data. Datenbank-Spektrum 12:121–130. doi:10.1007/s13222-012-0091-9.
- Braunschweig, K., J. Eberius, M. Thiele, and W. Lehner. 2012b. The state of open data. Limits of current open data platforms. In International World Wide Web Conference. Lyon, France.
- Campbell, D. T., and J. C. Stanley. 1969. Experimental and quasi-experimental designs for research. Chicago: Rand McNally.
- Charalabidis, Y., E. Loukis, and C. Alexopoulos. 2014. Evaluating second generation open government data infrastructures using value models. In 47th Hawaii International Conference on System Sciences. Hawaii, USA.
- Charalabidis, Y., E. Ntanos, and F. Lampathaki. 2011. An architectural framework for open governmental data for researchers and citizens. In Electronic government and electronic participation joint proceedings of ongoing research and projects of IFIP EGOV and ePart 2011, eds. M. Janssen, A. Macintosh, J. Scholl, E. Tambouris, M. Wimmer, H. De Bruijn, and Y. H. Tan, 77–85. Delft, The Netherlands: Springer.
- Conradie, P., and S. Choenni. 2014. On the barriers for local government releasing open data. Government Information Quarterly 31(Supplement 1):S10–S17. doi:10.1016/j.giq.2014.01.003.
- Cronbach, L. J., and P. E. Meehl. 1955. Construct validity in psychological tests. Psychological Bulletin 52(4):281–302. doi:10.1037/h0040957.
- Davis, F. B. 1964. Educational measurements and their interpretation. Belmont, CA: Wadsworth.
- Dawes, S. 2010. Stewardship and usefulness: Policy principles for information-based transparency. Government Information Quarterly 27(4):377–383. doi:10.1016/j.giq.2010.07.001.
- Dawes, S., and N. Helbig. 2010. Information strategies for open government: Challenges and prospects for deriving public value from government transparency. In 9th International Conference on e-Government. Lausanne, Switzerland: Springer LNCS.
- Dawes, S., T. Pardo, and A. Cresswell. 2004. Designing electronic government information access programs: A holistic approach. Government Information Quarterly 21(1):3–23. doi:10.1016/j.giq.2003.11.001.
- De Vocht, L., A. Dimou, J. Breuer, M. Van Compernolle, R. Verborgh, E. Mannens, P. Mechant, and R. Van de Walle. 2014. A visual exploration workflow as enabler for the exploitation of linked open data. In International Semantic Web Conference. Trentino, Italy.
- Denyer, D., D. Tranfield, and J. E. van Aken. 2008. Developing design propositions through research synthesis. Organization Studies 29(3):393–413. doi:10.1177/0170840607088020.
- Detlor, B., M. E. Hupfer, U. Ruhi, and L. Zhao. 2013. Information quality and community municipal portal use. Government Information Quarterly 30(1):23–32. doi:10.1016/j.giq.2012.08.004.
- Dimou, A., L. de Vocht, G. van Grootel, L. van Campe, J. Latour, E. Mannens, P. Mechant, and R. van de Walle. 2014. Visualizing the information of a linked open data enabled research information system. In Current Research Information Systems Conference. Rome: Procedia Computer Science.
- Ding, L., V. Peristeras, and M. Hausenblas. 2012. Linked open government data. Intelligent Systems, IEEE 27(3):11–15. doi:10.1109/MIS.2012.56.
- Duval, E., W. Hodgins, S. Sutton, and S. L. Weibel. 2002. Metadata principles and practicalities. D-Lib Magazine 8(4). doi:10.1045/dlib.magazine.
- Field, A. 2005. Discovering statistics using SPSS. London: Sage Publications.
- Field, A. 2009. Discovering statistics using SPSS, 3rd ed. London: Sage.
- Foulonneau, M., S. Martin, and S. Turki. 2014. How open data are turned into services? In Exploring services science, ed. Mehdi Snene and Michel Leonard, 31–39. Geneva, Switzerland: Springer International Publishing.
- Garbett, A., C. Linehan, B. Kirman, J. Wardman, and S. Lawson. 2011. Using social media to drive public engagement with open data. Paper presented at Digital Engagement ’11, Newcastle, UK, November 15–17, 2011.
- Gilb, T. 1997. Towards the engineering of requirements. Requirements Engineering 2(3):165–169. doi:10.1007/BF02802774.
- Hevner, A. R., S. T. March, J. Park, and S. Ram. 2004. Design science in Information Systems research. MIS Quarterly 28(1):75–105.
- Ho, J., and R. Tang. 2001. Towards an optimal resolution to information overload: An infomediary approach. In International ACM SIGGROUP Conference on Supporting Group Work. Boulder, Colorado, USA: ACM.
- Jeffery, K. 2000. Metadata: The future of Information Systems. In Information systems engineering: State of the art and research themes, eds. J. Brinkkemper, E. Lindencrona, and A. Sølvberg. London: Springer Verlag.
- Jetzek, T. 2015. The sustainable value of open government data. Uncovering the generative mechanisms of open data through a mixed methods approach. Copenhagen: Copenhagen Business School.
- Jetzek, T., M. Avital, and N. Bjorn-Andersen. 2014. Data-driven innovation through open government data. Journal of Theoretical and Applied Electronic Commerce Research 9(2):100–120. doi:10.4067/S0718-18762014000200008.
- Joorabchi, A., and A. E. Mahdi. 2011. An unsupervised approach to automatic classification of scientific literature utilizing bibliographic metadata. Journal of Information Science 37(5):499–514. doi:10.1177/0165551511417785.
- Jurisch, M. C., M. Kautz, P. Wolf, and H. Krcmar. 2015. An international survey of the factors influencing the intention to use open government. In 48th Hawaii International Conference on System Sciences. Hawaii, USA: IEEE Computer Society.
- Karr, A. F. 2008. Citizen access to government statistical information. In Digital government: E-government research, case studies, and implementation, eds. H. Chen, L. Brandt, V. Gregg, R. Traunmuller, S. Dawes, E. Hovy, A. Macintosh, and C. A. Larson, 503−529. New York: Springer.
- Kenny, D. A. 1975. A quasi-experimental approach to assessing treatment effects in the nonequivalent control group design. Psychological Bulletin 82(3):345–362. doi:10.1037/0033-2909.82.3.345.
- Kuk, G., and T. Davies. 2011. The roles of agency and artifacts in assembling open data complementarities. In Thirty Second International Conference on Information Systems. Shanghai, China.
- Lindman, J., T. Kinnari, and M. Rossi. 2014. Industrial open data: Case studies of early open data entrepreneurs. In 47th Hawaii International Conference on System Sciences. Hawaii, USA.
- Liu, T., F. Bouali, and G. Venturini. 2014. EXOD: A tool for building and exploring a large graph of open datasets. Computers & Graphics 39:117–130. doi:10.1016/j.cag.2013.11.014.
- Mann, H. B., and D. R. Whitney. 1947. On a test of whether one of two random variables is stochastically larger than the other. Annals of Mathematical Statistics 18:50–60.
- March, S. T., and G. Smith. 1995. Design and natural science research on information technologies. Decision Support Systems 15(4):251–266. doi:10.1016/0167-9236(94)00041-2.
- Martin, C. 2014. Barriers to the open government data agenda: Taking a multi-level perspective. Policy & Internet 6(3):217–240. doi:10.1002/poi3.v6.3.
- Murphy, K. R., and C. O. Davidshofer. 1988. Psychological testing: Principles and applications. Englewood Cliffs, NJ: Prentice-Hall.
- Myers, M. D. 2013. Qualitative research in business and management, 2nd ed. London: Sage.
- Novais, T., J. P. D. Albuquerque, and G. S. Craveiro. 2013. An account of research on open government data (2007–2012): A systematic literature review. In 12th Electronic Government and Electronic Participation Conference. Koblenz, Germany.
- Nunnally, J. C. 1967. Psychometric theory, 1st ed. New York: McGraw-Hill.
- O’Hara, K. 2012. Data quality, government data and the open data infosphere. In AISB/IACAP World Congress 2012: Information Quality Symposium. Birmingham, Great Britain: The Society for the Study of Artificial Intelligence and Simulation of Behaviour.
- Oviedo, E., J. N. Mazon, and J. J. Zubcoff. 2013. Towards a data quality model for open data portals. In XXXIX Latin American Computing Conference. Club Puerto Azul, Venezuela.
- Pearl, J. 2001. Direct and indirect effects. In 17th Conference on Uncertainty in Artificial Intelligence. Seattle, USA: Morgan Kaufmann Publishers.
- Peffers, K., T. Tunanen, M. A. Rothenberger, and S. Chatterjee. 2008. A design science research methodology for information systems research. Journal of Management Information Systems 24(3):45–77. doi:10.2753/MIS0742-1222240302.
- Petychakis, M., O. Vasileiou, C. Georgis, S. Mouzakitis, and J. Psarras. 2014. A state-of-the-art analysis of the current public data landscape from a functional, semantic and technical perspective. Journal of Theoretical and Applied Electronic Commerce Research 9(2):34–47. doi:10.4067/S0718-18762014000200004.
- Potts, C. 1995. Using schematic scenarios to understand user needs. In 1st conference on Designing Interactive Systems: Processes, Practices, Methods, & Techniques. Ann Arbor, USA: ACM.
- Reichardt, C. S. 1979. The statistical analysis of data from nonequivalent group designs. In Quasi-experimentation. Design & analysis issues for field settings, ed. T. D. Cook, and D. T. Campbell. Boston: Houghton Mifflin Company.
- Reichman, O. J., M. B. Jones, and M. P. Schildhauer. 2011. Challenges and opportunities of open data in ecology. Science 331(6018):703–705.
- Riley, M. W. 1963. Sociological research: I. A case approach. New York: Harcourt, Brace & World.
- Salkind, N. J. 2010. Encyclopedia of research design. Thousand Oaks, CA: Sage Publications.
- Sayogo, D. S., T. A. Pardo, and M. Cook. 2014. A framework for benchmarking open government data efforts. In 47th Hawaii International Conference on System Sciences. Hawaii, USA.
- Seybert, H. 2007. Gender differences in the use of computers and the internet. European Communities 2007. http://epp.eurostat.ec.europa.eu/cache/ITY_OFFPUB/KS-SF-07-119/EN/KS-SF-07-119-EN.PDF ( accessed June 10, 2013).
- Shadbolt, N., K. O’Hara, T. Berners-Lee, N. Gibbins, H. Glaser, W. Hall, and M. C. Schraefel. 2012. Linked open government data: Lessons from data.gov.uk. IEEE Intelligent Systems 27(3):16–24. doi:10.1109/MIS.2012.23.
- Shadish, W. R., T. D. Cook, and D. T. Campbell. 2002. Experimental and quasi-experimental designs for generalized causal inference. Boston: Houghton-Mifflin.
- Sieber, R. E., and P. A. Johnson. 2015. Civic open data at a crossroads: Dominant models and current challenges. Government Information Quarterly 32(3):308–315. doi:10.1016/j.giq.2015.05.003.
- Stamati, T., T. Papadopoulos, and D. Anagnostopoulos. 2015. Social media for openness and accountability in the public sector: Cases in the Greek context. Government Information Quarterly 32(1):12–29. doi:10.1016/j.giq.2014.11.004.
- The Data Seal of Approval Board. 2013. Implementation of the data seal of approval 2013. https://assessment.datasealofapproval.org/assessment_47/seal/html/ ( accessed April 22, 2015).
- Venkatesh, V., J. Y. L. Thong, F. K. Y. Chan, P. J.-H. Hu, and S. A. Brown. 2011. Extending the two-stage information systems continuance model: Incorporating UTAUT predictors and the role of context. Information Systems Journal 21(6):527–555. doi:10.1111/j.1365-2575.2011.00373.x.
- Verschuren, P., and R. Hartog. 2005. Evaluation in design-oriented research. Quality & Quantity 39(6):733–762. doi:10.1007/s11135-005-3150-6.
- Webb, E. J., D. T. Campbell, R. D. Schwartz, and L. Sechrest. 1973. Unobtrusive measures. Nonreactive research in the social sciences. Chicago: Rand McNally & Company.
- Whitmore, A. 2014. Using open government data to predict war: A case study of data and systems challenges. Government Information Quarterly 31(4):622–630. doi:10.1016/j.giq.2014.04.003.
- Yannoukakou, A., and I. Araka. 2014. Access to government information: Right to information and open government data synergy. Procedia—Social and Behavioral Sciences 147:332–340. doi:10.1016/j.sbspro.2014.07.107.
- Yin, R. K. 2003. Case study research. Design and methods. Thousand Oaks, CA: SAGE publications.
- Zuiderwijk, A. 2015. Open data infrastructures: The design of an infrastructure to enhance the coordination of open data use. ‘s-Hertogenbosch, The Netherlands: Uitgeverij BOXPress.
- Zuiderwijk, A., and M. Janssen. 2015. Participation and data quality in open data use: Open data infrastructures evaluated. In 15th European Conference on eGovernment. Portsmouth, United Kingdom.
Appendix A: Screenshots of the prototype
– of this appendix provide screenshots of the prototype that was developed as part of the FP7 ENGAGE-project (www.engagedata.eu).
Figure 4. Homepage of the prototype.
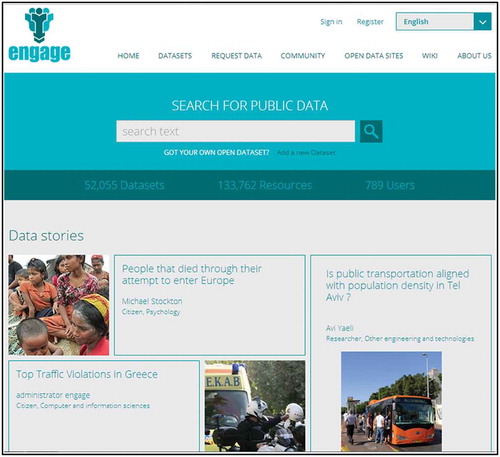
Figure 5. Dataset overview in the prototype.
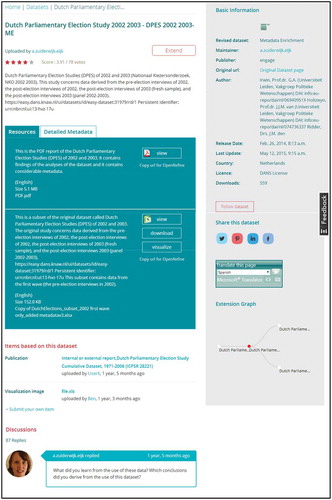
Figure 6. Dataset and data use interaction section in the prototype.
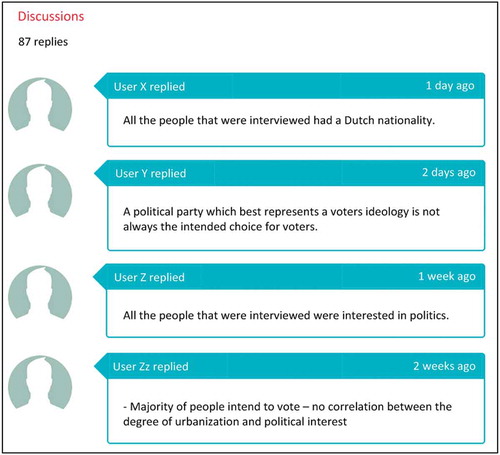
Figure 7. Data quality assessment in the prototype.
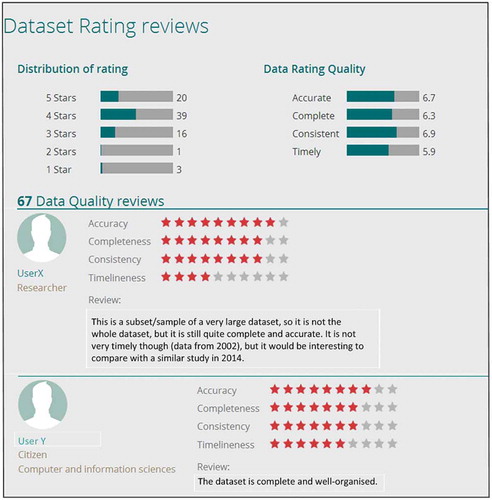
Appendix B: Protocol for the quasi-experiments
This appendix provides more information about the conducted quasi-experiments, including information about the introduction, the pretest, the second participant survey, observations and time measures, the posttest, and the plenary discussion.
B.1. Introduction
In each evaluation the participants should receive correct and sufficient instructions to participate (Verschuren and Hartog Citation2005). In the introduction of our quasi-experiments the participants were informed about the objectives of the quasi-experiment and they received instructions. All participants received a participant code, which they needed to provide at the start of the three participant surveys. This allowed for linking the results from the different surveys to one individual participant. The participant code showed to which group the participants belonged (the treatment or control group), what their participation number was (e.g., 1, 2, or 3), and in which quasi-experiment they took part (the first, second, or third). The participant code was taped to the tables and visible for the observers, so that they could relate the code to the behavior of certain participants. In addition, the participants received a handout with general instructions, a time plan, links to the participant surveys, and an overview of the five main parts of the quasi-experiments, as well as a document with instructions for conducting a number of tasks (referred to as “scenario tasks”). Participants were ensured that the information that they would provide in the quasi-experiments would be treated confidentially.
B.2. Pretest: First participant survey
A pretest was used to allow for measuring differences between the treatment and control group before the OGD infrastructure was used. The findings from the pretest were used to identify differences and to compare with the findings from the posttest. The pretest and posttest were designed in the form of surveys, since this allowed for measuring various constructs before the participants worked with the OGD infrastructure and thereafter, so that the findings from these measures can be compared. This was expected to provide insight in the effects of the OGD infrastructure with the possibility to control for intermediate variables. The first participant survey (the pretest) was completed online before the participants performed the scenario tasks. The first survey consisted of 19 questions, and most questions were mandatory, that is, it was not possible to skip these questions. shows the questions that were included in the first participant survey.
Table 11. Structure of the first participant survey.
B.3. Second participant survey, observations, and time measures
The following three key measures were used for the quasi-experiments.
B.3.1. Second participant survey
The second participant survey incorporated various tasks that the participants needed to conduct to operate the prototype. We refer to these tasks as scenarios tasks, since they explored scenarios related to the range of OGD use activities that were identified in section 2.1, including searching for and finding open data, analyzing open data, visualizing open data, interacting about open data, and discussing the quality of open data. Five comprehensive scenarios were developed which comprised eighteen scenario tasks in total. The scenarios were provided to the participants in the form of a survey. This second participant survey included scenario tasks, instructions, and questions. The participants were asked to indicate to which extent they found it difficult or easy to conduct the scenario tasks, to rank the tasks based on their ease or difficulty, and to indicate whether they were able to complete each individual task. Participants were told that if they could not conduct a certain task, they should just move on to the next task. In that case they were told to write down in the questionnaire that it was “very difficult” to conduct the task and to state that they were not able to conduct the task. Completing the scenario tasks took the participants between 30 and 50 minutes.
All participants in both the treatment and the control group used the same dataset to conduct the scenario tasks. This was done to ensure that differences in the results could not be the consequence of differences in the datasets that the participants used. The used dataset concerned Dutch parliamentary elections in 2002 and 2003 (i.e., the Parliamentary Elections Dataset). The DANS infrastructure (see www.dans.knaw.nl/en) was selected for conducting the scenario tasks by the control group. We refer to the DANS infrastructure as “the control infrastructure.” This infrastructure was selected because it is already used by many Dutch organisations to make their data publicly available, including the Ministry of the Interior and Kingdom Relations, the Ministry of Health, Welfare and Sport, Statistics Netherlands, the Netherlands Organization for Scientific Research, the Research and Documentation Centre, and The Netherlands Institute for Social Research. The basic infrastructure is a well-accepted archive for publishing data from social sciences, humanities, behavioral sciences, geospatial sciences and other sciences, and Dutch ministries are nowadays obliged to store their data resulting from policy-oriented research at the basic infrastructure. Furthermore, the control infrastructure did not offer the functionalities that our prototype provided, which made it possible to compare OGD use on the two infrastructures. In addition, the control infrastructure provided English translations of all the functionalities that were required for conducting the quasi-experiments. Since various participants who were involved in the quasi-experiments did not speak Dutch, it was essential that the control infrastructure was available in English.
B.3.2. Time measures
Time measures were used to examine how long it took to conduct the scenario tasks and to investigate whether there were significant differences between the time used to conduct the scenarios by the treatment group and the time used by the control group. Time duration measures can be used to find out how much attention a person paid to an object (Webb et al. Citation1973, 134). In this study we assume that the more time is spent on a task, the more attention a person needs to perform the task and the more difficult this task is. Participants registered the time before and after they conducted each of the scenarios.
B.3.3. Observations
Observations were used to observe whether the behavior of the participants of the treatment group was different than the behavior of the participants in the control group. The results from the observations have already been described by Zuiderwijk and Janssen (Citation2015) and are outside the scope of this paper.Footnote1 Observers were responsible for observing a particular group of participants. It was defined in advance which observer should stand where exactly and which participants would be observed. All the observers had experience with Information and Communication Technologies. Out of the 18 observations that were conducted for the three quasi-experiments, 12 were conducted by persons who had significant experience with open data. Riley (Citation1963) refers to two types of errors that participant-observation studies can be subject to. First, Riley refers to the “control effect,” which is the situation in which the measure process itself becomes an agent working for change and is unsystematic. Second, the biased-viewpoint effect refers to the situation in which the human observer “may selectively expose himself to the data, or selectively perceive them, and, worse yet, shift over time the calibration of his observation measures” (Webb et al. Citation1973, 114). By using an observation protocol and a semi-structured observer survey we tried to avoid these two types of errors as much as possible. The observers were provided with the protocol, the observer survey and the scenario tasks before the quasi-experiments took place, and they were asked to read these documents carefully before the quasi-experiments. The protocol, the semistructured observer survey and the scenario tasks were also explained in dedicated training sessions which took place one week before the quasi-experiments took place.
The participants received the scenario tasks and instructions on paper. Each of the six sections in the scenario tasks was displayed on a different page. Moreover, a different color was used to highlight the tasks for each of these six sections to make clear for the observers on which section people were working. This made it easier for the observers to identify how much time it took for people to work on certain tasks and to indicate to which extent the participants found it difficult or easy to complete these tasks. For instance, yellow highlights on the first page of the scenario tasks indicated that participants were working on the section “searching for and finding open data.”
B.4. Posttest: Third participant survey
A posttest was used to measure whether the OGD infrastructure had influenced to which extent the scenario tasks could be completed. shows the questions that were included in the third participant survey. The survey was provided online, and the link to the participant survey could be found in the handout that all participants had received at the start of the quasi-experiment. The third participant survey consisted of 26 questions and it took about 15 to 20 minutes to conduct this final participant survey.
Table 12. The content of the third participant survey.
B.5. Plenary discussion
Finally, in a plenary discussion the participants were asked which tasks they found most difficult, which tasks they found easiest and whether they had any suggestions to improve the investigated open data infrastructure. The plenary discussions were mainly used to obtain more information about limitations of the study, recommendations for further development of the prototype, and the influence from intermediate variables.