
ABSTRACT
Digitalization of agricultural technology has led to the emergence of precision dairy farming, which strives for the simultaneous improvement of productivity as well as animal well-being in dairy farming through advanced use of technology such as movement sensors and milking parlors to monitor, control, and improve dairy production processes. The data warehouse serves as the appropriate technology for effective and efficient data management, which is paramount to the success of precision dairy farming. This paper presents a joint effort between industry and academia on the experimental development of an active semantic data warehouse to support business intelligence and business analytics in precision dairy farming. The research follows an action research approach, deriving lessons for theory and practice from a set of actions taken in the course of the project. Among these actions are the development of a loading stage to facilitate data integration, the definition of an analysis view as well as the introduction of semantic OLAP patterns to facilitate analysis, and analysis rules to automate periodic analyses. The large volumes of generated sensor data in precision dairy farming required careful decision-making concerning the appropriate level of detail of the data stored in the data warehouse. Semantic technologies played a key role in rendering analysis accessible to end users.
Introduction
Digitalization of agricultural technology has led to the emergence of precision livestock farming which strives for the simultaneous improvement of productivity as well as animal well-being in livestock farming through advanced use of technology to monitor, control, and improve production processes (Banhazi et al. Citation2012; Wathes et al. Citation2008). In this respect, precision dairy farming refers to the application of precision livestock farming technology in dairy production (Bewley Citation2010). While there exist practical and ethical concerns (Wathes et al. Citation2008), precision livestock farming in general and precision dairy farming in particular promise improvement of animal well-being with respect to conventional farming methods, for example, through the early detection of illness and timely treatment. In order to deliver on these promises, an abundance of data must be analyzed to generate meaningful insights, for example, to detect signs of illness or determine ideal food compositions. The data, however, hail from various heterogeneous sources such as sensors and external databases maintained by dairy herd improvement associations. Therefore, effective and efficient data management is paramount to the success of precision dairy farming (Schulze, Spilke, and Lehner Citation2007). For this task, the data warehouse serves as the appropriate technology.
A data warehouse stores large amounts of cleansed data, extracted from operational sources and transformed into a format suitable for analysis (Vaisman and Esteban Citation2014). Business intelligence (BI) and business analytics applications then serve to present the collected data to business people and allow them to gain insights into their businesses (Sherman Citation2015). A data warehouse’s main advantages compared to other forms of storage employed in data analysis, most notably data lakes, include the clean integrated schema optimized for analysis, which facilitates comparison of data from various sources. As opposed to data stream management systems, which frequently serve for the analysis of sensor data (Bonnet, Gehrke, and Seshadri Citation2001), a data warehouse preserves historical data for future analysis. Through the introduction of analysis rules, an active data warehouse (Mohania et al. Citation2009; Thalhammer, Schrefl, and Mohania Citation2001) allows for fact-based management of business processes. Hence, exceptional circumstances detected in the data trigger notifications that allow for appropriate countermeasures. A more recent trend in data warehousing is the application of semantic technologies, which allow for the description of data in human- and machine-readable format (Hitzler, Krotzsch, and Rudolph Citation2009), for data integration (Skoutas and Simitsis Citation2006) and data analysis (Abelló et al. Citation2015).
This paper presents a joint effort—the agriProKnow projectFootnote1—between industry and academia on the experimental development of an active semantic data warehouse to support BI and business analytics in precision dairy farming, running from November 2015 to January 2018 in Austria. The agriProKnow project involved the companies Smartbow GmbH (henceforth referred to as SMART), a manufacturer of smart ear tags for animals, and Wasserbauer GmbH (WASSER), a manufacturer of automatic feeding machines. From the Johannes Kepler University (JKU) Linz, the Department of Business Informatics – Data & Knowledge Engineering (DKE), with expertise in data warehousing and BI technology, and the Institute for Stochastics (STOCH) participated in the project. From the University of Veterinary Medicine Vienna (VETMED), the Department for Farm Animals and Veterinary Public Health participated, its members serving as domain experts on animal well-being. Josephinum Research (JR) complemented the consortium as a non-university research institute specialized in agricultural engineering. The number of individuals actually participating in the project fluctuated, but never exceeded 20. The authors of this paper were project participants from DKE. The presented research follows an action research approach.
The remainder of this paper is organized as follows. Following an introduction to the problem situation, a description of the research approach, and the presentation of the theoretical framework, we provide an overview of the actions related to data acquisition and extraction, which are not the focus of this paper. We then present an action related to data integration, aggregation, and representation, namely the implementation of a loading stage. We also present actions related to analysis and modeling, namely the generation of an analysis view from the loading stage and the identification and technical implementation of OLAP patterns. We further present actions related to facilitating interpretation of the results and automating recurring data analyses as well as the reactions to these results, namely the semantic description of query results and the development of rule patterns. We conclude the paper with a discussion of the implications of the findings for research and practice.
Problem situation: data analytics in precision dairy farming
Precision dairy farming employs advanced technology to improve animal well-being and productivity (Bewley Citation2010). Thus, a multitude of different systems and sensors operate on modern dairy farms, for example, milking and feeding robots, temperature sensors, animal tracking systems, dairy herd management systems, and databases maintained by dairy herd improvement associations. Each of these systems and sensors serves a different purpose, the common trait of these systems and sensors being the generation and storage of data. Thus, the available data about dairy farm operations are typically scattered across different systems in various formats and only exist in isolation from each other. Consequently, the full potential of the data cannot be realized since data analysis is often only possible within the respective source system or by manual integration of data from different source systems. The agriProKnow project aimed to develop a data warehouse system that allows for the integration of data from various data sources across multiple farms. The thus available data may be leveraged for managing and improving operational business processes, for example, to effectively counteract outbreak of illnesses with detrimental effects on animal well-being and productivity. Likewise, the data may serve to find ideal food compositions for different groups of animals.
While collection of dairy farming data from different operational sources could have been achieved by loading the generated data into either a data lake (see Russom Citation2017) or a data warehouse, the project consortium decided early on to focus on the implementation of a data warehouse. Data lakes, unlike data warehouses, store the raw sensor data as they occur, with little additional structure and little to no prior cleansing and transformation. While the system can thus quickly ingest large amounts of data, semi-automatic data wrangling has to occur every time before conducting data analysis. The problem for precision dairy farming is twofold. First, precision dairy farming employs recurring data analyses for managing operational processes, which constantly require uniform transformations that slowly evolve over time. For example, the daily monitoring of milk composition and comparison with historical values, which serves to detect signs of illness early on, requires daily updates and thus transformation and integration of the source data. A data lake, however, seems more appropriate for one-time optimization. Second, in precision dairy farming, different sensors and systems often produce data about the same kind of facts, for example, movement, milk quantity and quality, with quite different schemas. These schemas would then have to be integrated by the analysts themselves. While this task is hard for integration of data within a single farm, the task becomes exponentially more complicated when trying to compare values from one farm with other farms. Similarly, the systems produce data of different quality, which the analyst should be aware of in order to judge accurately the significance of the result. Moreover, the full amount of sensor readings is unnecessary for many analytical questions. For example, rather than store exact location and acceleration data for each animal in every second, it may be more convenient to store the minutes per hour an animal was active in each functional area. This information is sufficient for a posteriori detection of extraordinary activity of an animal in a functional area where the animal normally is supposed to rest, which hints at an illness. Storing raw sensor data is not without merits, though. Indeed, STOCH also worked on the raw sensor data in order to ameliorate the sensors themselves, which ultimately leads to higher quality data. For continued use, a data warehouse with clean and integrated, high-quality data seems to be the more viable option for data analysis in precision dairy farming.
The integration of data from different sources is only the first step toward enabling data analysis in precision dairy farming. As the prospective users, for example, farmers, veterinarians, and animal food consultants, are hardly data scientists or BI specialists, these users require intuitive query facilities to support them with the analytical tasks at hand; data lakes typically do not provide such facilities. For data warehouses, however, more sophisticated analysis tools and query languages exist, or can be more easily developed and implemented due to more uniform structure and higher quality of the collected data. Therefore, among the project’s goals was the provision of intuitive query facilities for non-experts in data science and BI technology.
Research approach
In action research, researchers collaborate with practitioners in order to alleviate a real-world problem by taking action while also contributing to the body of knowledge (Baskerville Citation1999). Action research has gained recognition as a valid method of qualitative information systems (IS) research (Baskerville and Myers Citation2004; Myers Citation1997). As such, action research is related to case research but differs with regard to the involvement of the researcher (Benbasat, Goldstein, and Mead Citation1987): In action research, as opposed to case research, the researcher actively participates in actions that change the state of reality. While other IS research often struggles to achieve practical relevance, action research tackles real-world problems and develops solutions that can be immediately applied, thereby linking theory and practice (Baskerville and Wood-Harper Citation1996). In this regard, a common line of criticism brands action research as mere consulting (Baskerville and Wood-Harper Citation1996). Unlike mere consulting, however, action research operates within a theoretical framework which the researchers, committed to academia, aim to extend, refine and validate in the course of the study (Baskerville Citation1999; Baskerville and Wood-Harper Citation1996).
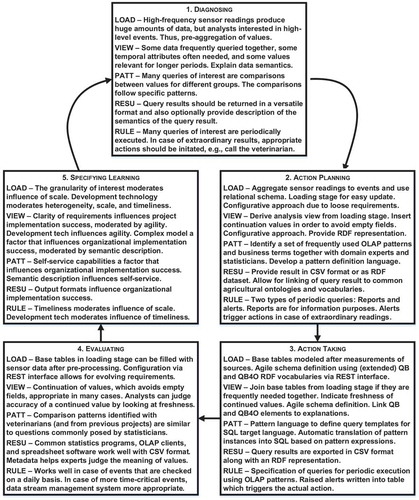
Common steps of action research are laid out in the action research cycle (Baskerville and Wood-Harper Citation1996; Susman and Evered Citation1978) which consists of five steps for each action: diagnosing, action planning, action taking, evaluating, and specifying learning. Diagnosing refers to the thorough investigation of the problem domain, which leads to a planned action to be undertaken in collaboration with practitioners followed by an evaluation of that action which leads to confirmation, adaptation, or rejection of the theoretical framework. gives an overview of the individual steps of the actions associated with the construction of a prototype data warehouse for data analysis in precision dairy farming. The five actions reported in this paper are the implementation of a loading stage (henceforth referred to as LOAD), analysis view (VIEW), OLAP patterns (PATT), semantic description of query results (RESU), and active rules (RULE). As theoretical framework serves a well-known model of success factors in data warehousing (Wixom and Watson Citation2001) extended with factors for big data analysis (Agrawal et al. Citation2012). While the action research cycle is typically characterized as the “ideal” process for action research, in practice projects often deviate from that process (Baskerville and Wood-Harper Citation1996). In the agriProKnow project, some actions have been implemented in parallel rather than sequentially. Likewise, the steps for individual actions were typically iterative and overlapped, especially action planning, action taking, and evaluating, since the experimental nature of the project demanded a more agile development approach. Hence, evolutionary prototyping led to constant addition of new features, expanding breadth of the implementation, and gradual refinement of already implemented features, expanding depth of the implementation. Furthermore, planning related to one action frequently led to revisions in the planning of other actions, for example, planning for data integration and aggregation also influenced planning for data acquisition and extraction.
Figure 1. The action research cycle (Susman and Evered Citation1978), showing the steps encountered for the different actions described in this paper.
The control structures in place that govern an action research project differ between projects. In particular, action research projects present different characteristics with respect to initiation, authority, and formalization (Avison, Baskerville, and Myers Citation2001). In the agriProKnow project, SMART initiated the project and led the effort to obtain funding from a public funding agency, although all partners were, to different degrees, involved in writing the proposal. As consortium leader and main financial contributor apart from the funding agency, SMART set the general direction and provided the business case. Nevertheless, DKE enjoyed a great degree of freedom concerning technical implementation aspects. There was no a priori functional specification for DKE to follow. Rather, requirements elicitation happened in close collaboration of all project partners. DKE presented different design options, which were iteratively refined together with the other partners. Hence, regular meetings involving representatives from all project partners served important coordination purposes and were vital for diagnosing and action planning. Besides regular project meetings, smaller meetings with selected partners on specialized issues were called when the need arose for further coordination of the involved parties. In general, the degree of formalization in the project was low, with most decisions taken in personal meetings or e-mail conversations. A formal contract between project partners governed financial and legal aspects, in particular questions of intellectual property rights.
Action research shares many traits with design science research (Järvinen Citation2007) but in our opinion both are distinct research methodologies. While design science aims to generate design artifacts, that is, methods, tools, modeling languages, and concepts that aid the design process, action research investigates a theory. That is not to say that both methodologies have no overlapping characteristics. Indeed, some of the actions presented in this paper, for example, semantic OLAP patterns, are design artifacts formally described in separate works (Kovacic et al. Citation2018; Schuetz et al. Citation2017). In this paper, however, we present the case of the construction of an active semantic data warehouse and the taken actions to develop the system from a more general point of view, rather than in a formal manner, and we derive implications to theory and practice drawn from the experience in the agriProKnow project. In particular, we refine an existing research model and thus discover interesting questions for future research while sharing our experience in implementing a data warehouse system for precision dairy farming.
Theoretical framework
Action research operates on a theoretical framework: a research model that guides practice. The aim of this paper is to confirm, refine, and extend the research model, which also guides action planning and taking. illustrates the employed research model, which builds on a well-known model for data warehousing success (Wixom and Watson Citation2001), extended with factors for big data analysis (Agrawal et al. Citation2012). In this model, a set of implementation factors influence implementation success and ultimately system success. The model distinguishes three facets of implementation success: organizational, project, and technical. Organizational implementation success refers to the acceptance of the final system by its prospective users. Project implementation success refers to the project team’s ability to finish the implementation project. Technical implementation success refers to the ability to overcome technical obstacles. In this paper, we focus more on project and technical implementation success, since the project is experimental development and the final product will undergo further development before deployment in a non-experimental setting accessible to farmers, veterinarians, and animal feed consultants. Still, we report on actions aimed at improving organizational implementation success, which we developed and evaluated together with the VETMED and JR domain experts. We also hypothesize about factors that likely influence organization success as discovered trough interaction with the other project partners and confirmed in stakeholder workshops organized by JR.
Figure 2. Research model for data warehousing success (Wixom and Watson Citation2001), extended with factors influencing project success in big data analysis. A dagger (†) marks the model’s original factors (Wixom and Watson Citation2001), a double dagger (‡) marks additional factors (Agrawal et al. Citation2012).
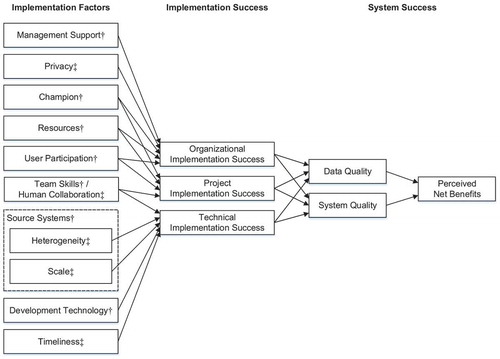
The research model’s various implementation factors () influence different facets of implementation success. Management support, the existence of a “champion” advocating the data warehousing project, allocation of sufficient resources to the project, and user participation hypothetically wield positive influence on organizational implementation success. Existence of a champion, sufficient resources, and user participation along with high team skills of the project participants hypothetically wield positive influence on project implementation success. Team skills and more advanced development technology hypothetically wield positive influence on technical implementation success whereas higher complexity of the source systems that deliver the data hypothetically wields negative influence on technical implementation success. While the original study (Wixom and Watson Citation2001) did not find all hypothesized influences of implementation factors on the various facets of implementation success to be significant, we keep these connections in the research model to study possible differences in our findings.
Since one of the project’s key goals was the development of a system that integrates potentially large amounts of sensor data for data analysis, we extend the research model with common factors contributing to the difficulty of big data analysis. These factors hail from a community whitepaper on big data challenges and opportunities authored by leading researchers in the field (Agrawal et al. Citation2012); the factors are privacy, human collaboration, heterogeneity, scale, and timeliness. We consider privacy a factor that influences acceptance of the data warehouse by end users and thus organizational implementation success. We liken human collaboration to team skills. We consider heterogeneity and scale as refinements of the factor source systems: The more heterogeneous the source systems and the larger their scale, the more likely is technical implementation success to elude the project team. We consider timeliness, that is, how fast results are needed and data volume increases, another factor that influences technical implementation success.
shows the typical steps in big data analysis, referred to as the big data analysis pipeline (Agrawal et al. Citation2012), extended with an action component that follows the interpretation of the results. The remainder of this paper follows the big data analysis pipeline, describing the actions taken with respect to each step. While the project had to solve issues related to acquisition and recording as well as extraction, cleaning, and annotation, the DKE researchers were not primarily involved in taking the corresponding actions, which were the responsibility of SMART. We hence provide only a high-level overview of the issues and solutions related to these steps in order to foster understanding of the reasoning behind the actions associated with other steps.
Figure 3. Big data analysis pipeline (Agrawal et al. Citation2012). Shaded boxes denote the steps with associated actions described in more detail in this paper; other steps are only described from a bird’s-eye view.
Acquisition and extraction
Various source systems and sensors record data. Before the analysis, the data must be extracted from the source systems and receive further cleaning and annotation. Planning and taking of the corresponding actions was in accordance with the actions associated with the design of the data model for integration, aggregation, and representation of the recorded, extracted and cleansed data (LOAD). Implementation of data acquisition and extraction was SMART’s responsibility.
Acquisition and recording
A key factor in the identification of potential data sources for useful analysis was close collaboration with domain experts. In order to identify possible data sources, DKE closely collaborated with VETMED, JR, and SMART. In regular meetings, the partners discussed which data are used on a daily basis in operational agricultural systems. Following these discussions, the DKE researchers were able to gain an overview of common data sources in dairy farming. These data sources can broadly be categorized into three types: sensors, e.g., temperature sensors or smart ear tags that track animal activity, agricultural information systems within the farm, e.g., dairy herd management systems, and external data sources, for example, a dairy herd improvement association’s database about milk quality or an animal feed vendor’s database of nutritional information.
The data warehouse should allow for inter-farm data analysis, that is, allow for comparison of measurements between farms. An important factor in data acquisition is thus the identification of data and data sources present at multiple farms, which also influences the base granularity of aggregation in the data warehouse since that should be the same across farms. For example, some farms milk the same cow twice a day while other farms have up to three or four milkings per cow and day. Hence, for inter-farm comparison, recording the number of milkings as well as the aggregate milk yield per cow and day can be beneficial. Similarly, when recording animal movement, for inter-farm comparison, indication of general functional areas that are uniform across farm sites, for example, feeding area, resting area, is more effective in enabling meaningful comparison across farm sites than recording the precise location of an individual animal within a specific farm. Ideally, such information should be recorded close to the source as later computation can become costly.
The recorded data should also include the same measurements across farms in order for the measurements to be comparable. In close collaboration with VETMED, DKE, and SMART identified measurements with validity across farms. For example, since each type of animal feed, for example, silage or forage grass, differs between farms or even between seasons, it is not enough for feeding data to record the type of feed. Instead, the data warehouse should record feeding data through measurements of its most important constituents. The process of identifying interesting data and relevant measurements revealed that in some cases the same measurements are obtained in different frequencies from different data sources. For example, milking data are obtained once a day from the milking parlor at the farm and once a month from DHIA reports. VETMED, DKE, and SMART decided to include such redundant data in the data warehouse together with an indication of provenance.
Extraction, cleaning, and annotation
As data of interest are scattered across various data sources inside and outside of a farm, data extraction has to deal with heterogeneities. These heterogeneities are not limited to the interfaces of source systems and sensors but also concern the data formats. The data sources for a single farm, such as sensors and information systems, for example herd management systems, are from various different vendors, and each of these vendors possibly employs its own proprietary extraction processes and data formats. Furthermore, authorities that administrate the external data sources also typically provide the data encoded in custom proprietary formats.
Most of the raw data extracted from the data sources are wrapped into comma-separated value (CSV) files. These files have to be further processed in order to extract the data of interest. A first step toward extracting the data is the mapping of the data to the required levels of granularity. For instance, in the course of discussions with domain experts, DKE determined that it is beneficial for the analysis to record measurements per cow. Some measurements, however, are not available per cow. For example, raw data about microclimate within farms do not include records per cow. Rather, climate data consist of temperature and humidity measurements that were taken at a specific date and time in a specific location of the farm. In order to obtain records per cow, the temperature and humidity measurements have to be mapped to the location data for individual cows. Hence, the measurements of climatic conditions are mapped to the cows that were near the location at the time of measurement, and which must therefore have been exposed to the measured climatic conditions.
Apart from transforming the data to the desired granularity, data have to be transformed from farm-specific to globally relevant and comparable across farms. This does not only apply to measurements, which have to be converted to common units, but also to identifiers. A cow, for example, is identified by a unique national identifier consisting of a two-letter country code and nine digits. Some farms, however, also employ more memorable farm-specific identifiers for their animals in addition to the national identifier, for example, names or numbers with fewer digits. In order to be able to compare all records concerning a specific cow, records using the farm-specific identifiers have to be transformed into records that use the corresponding national identifier in order for the records to be comparable across farms.
Further cleaning of the data is necessary as the raw data might include faulty data or simply data deemed to be useless for the analysis. For example, the herd management system may record whether a cow is currently pregnant. Concerning pregnancy, the herd management system may know three states, namely pregnant, non-pregnant, and unknown. The “unknown” state is semantically equal to no information, that is, a Null value, and therefore records with such an unknown value of pregnancy status are discarded as they are useless for the analysis.
Implementation of data extraction, mapping and cleaning follows a plugin-based system, which has been implemented by SMART in a previous project. For each data source exists a plugin that manages data extraction, mapping, and cleaning for that particular data source. Consequently, in order to support a new data source, a new plugin has to be developed, without entailing changes in existing plugins or the overall system. Each plugin covers the necessary steps to transform the raw data extracted from the data sources into RDF data suitable for the loading stage as described in the following section.
Integration, aggregation, and representation
The operational data sources deliver data about business events of interest at different update frequencies, for example, the DHIA delivers a report on milk quality and quantity once a month, a cow is milked several times a day, temperature is measured every few minutes and, depending on the configuration, smart ear tags possibly measure animal movement multiple times per second. Storing all data generated by the data sources with high update frequencies is impractical since aggregation would be deferred to the moment of the analysis, which complicates the analytical task for end users, slows down computation of the result, and requires huge storage capacities. Thus, in order to facilitate analysis from both a technical and usability point of view, and to render the data of the different sources comparable and joinable, the project participants opted to pre-aggregate the data in a loading stage to levels deemed useful by domain experts.
In the original design, the loading stage defined a table for each type of business event and each data source, for example, milking data as captured by milking parlors, which means that business events are split such that all measurements of a table originate from the same data source. However, not all data sources of the same kind, for example, milking parlors, take the same measurements. Therefore, in order to avoid Null values in the loading stage, the tables are further split by measurements, and only those measurements are contained in the same loading stage table that always occur together. For example, the body temperature always consists of a minimum and maximum temperature as well as the number of measurements within a given hour. The milking data as captured by milking parlors, on the other hand, are split across multiple loading stage tables, owing to the fact that some parlors only measure milk yield while others also detect nutritional information. The decomposition of the loading stage tables facilitates the task of loading the data from the different sources into the data warehouse as the data does not have to be cached at the source until all data from all relevant sources are available and new data does not have to be joined with existing data. Furthermore, the utilization of a loading stage increases agility and ensures extensibility with respect to the structure of the identified business events and the granularities required by domain experts—more comprehensive tables are defined in the analysis view which we explain later in this paper.
The decisions regarding the design of a loading stage led to incremental changes in the multidimensional model. These changes were part of a constant feedback loop with the domain experts. In order for the domain experts to be able to give appropriate feedback about the model, it was necessary for the domain experts to understand the model, resulting in the semantic description of the multidimensional model and the storage of these metadata in the data warehouse. The reasons for a semantic description of the multidimensional model are twofold. On the one hand, the domain experts are not able to read the source code of a data warehouse and, on the other hand, the multidimensional model should be described independently of the employed target platform. Hence, the multidimensional model was described using the Dimensional Fact Model (DFM) (Golfarelli, Maio, and Rizzi Citation1998). Furthermore, the project partners settled on formalizing the multidimensional model using an RDF representation to be stored in a triple store that forms a part of the data warehouse. The RDF description employs the RDF Data Cube vocabulary (QB) (W3C Citation2014) and its extension QB for OLAP (QB4O) (Etcheverry and Vaisman Citation2012; Etcheverry, Vaisman, and Esteban Citation2014). Making an RDF definition available in the data warehouse, as well as the reliance on existing modeling languages, has several benefits. First, the semantic description allows for visualization of the multidimensional model, which enables domain experts to read the schema after a quick introduction to the most important multidimensional modeling primitives, namely fact, dimension, and measure. Second, the RDF definition allows for inclusion of further semantic descriptions of the schema elements by linking the schema elements to existing ontologies in the agricultural domain such as AGROVOC (Caracciolo et al. Citation2013), which can also be formalized using the Web Ontology Language (OWL) (Lauser et al. Citation2006), or other (semantic) web resources. For example, a blood measurement dimension attribute could link to a scientific article on the web that explains the measurement. Third, storing the semantic description as metadata increases agility, as the logical data model can be derived automatically from the RDF representation.
DKE proposed to rely on a relational database management system (RDBMS). Not only is Relational OLAP (ROLAP) a widespread and well-proven approach to data warehouse implementation, but a modern RDBMS also features rich extensions of SQL for data analysis. As one of the project goals was simply to develop a data model for dairy farming data, the project had only very loose and constantly evolving requirements regarding the data model. Therefore, it was not practical to implement the ROLAP schema manually. Rather, a system was set in place capable of transforming a multidimensional model defined in QB, QB4O, and project-specific extensions into a star schema in SQL. The data warehouse provides a REST interface, which allows, by uploading multidimensional models in RDF format, for the dynamic definition and deletion of cubes and dimensions as well as for the creation of additional descriptive dimension attributes in the loading stage. The data warehouse stores the RDF description of the multidimensional model as metadata in a triple store, and a schema manager component applies the necessary changes to the ROLAP schema in the RDBMS. The instance data are likewise uploaded via REST interface in RDF format since QB and QB4O allow for the definition of instance data besides schema information. A data loader caches the submitted RDF files in the triple store and then transforms, using SPARQL query statements, the QB/QB4O instance data into relational format. The data loader also performs consistency checks using the semantic description of the multidimensional model.
The loading stage with separate tables for different data sources and measurements greatly facilitated SMART’s task of implementing extraction and cleaning of the data prior to loading the data into the data warehouse. The configurative approach toward schema definition, with automatic schema generation from a semantic specification in RDF, proved valuable multiple times in the course of the project with its ever-evolving requirements. The advantage of agility becomes even starker in the context of the design and implementation of the analysis view which we explain later in this paper. Concerning the theoretical framework, we learned that the identification of the appropriate base granularity is one of the key factors in constructing a data warehouse for big data analysis. An appropriate base granularity alleviates the negative influence of scale on technical implementation success. Development technology also moderates the negative influence of scale, heterogeneity, and timeliness on technical implementation success.
Analysis and modeling
Previous steps were all about getting the data from the sources into the data warehouse. The loading stage tables, however, are not ideal for actually conducting the analysis since they are optimized toward facilitating the loading procedures. In this section, we present two actions that aimed at facilitating the analysis itself, namely the conception of an analysis view and the introduction of semantic OLAP patterns.
Analysis view
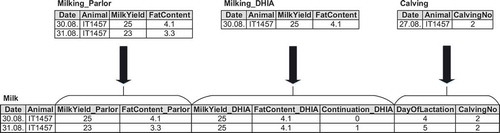
The analysis view derives from the loading stage tables and consists of analysis tables. An analysis table is a subject-oriented materialized database view that combines data from different loading stage tables. The first type of analysis table joins multiple loading stage tables about the same subject. For example, in , loading stage tables with milk data are joined into a milk analysis table. In this example, milk yield and fat content as measured by the milking parlor and by the DHIA are integrated into a common analysis table gathering all the available data about milk, regardless of the original data source. By convention, a prefix in the attribute name indicates the attribute’s origin in the loading stage.
Figure 4. Example derivation of an analysis table from loading stage tables.
Meetings with the VETMED domain experts brought to attention that certain subjects are analyzed together frequently. For example, data about feeding is regularly related to data about milk yield and content. The VETMED domain experts, under guidance from DKE, then identified candidate tables in the loading stage to be joined in the analysis view. The project participants deemed necessary the creation of analysis tables that contain data about multiple subjects, which could be achieved through the same mechanisms as the creation of analysis tables about a single subject. In order to be part of the same analysis table, the joined loading stage tables are required to have the same dimensions and the same granularity.
The same types of measurements are often available from multiple sources, for example, milk yield and milk contents. In some cases, provenance of a specific measurement is not relevant. For example, if an analyst intends to summarize a cow’s daily milk yield over a year, the analyst is typically not interested whether a daily measurement came from the DHIA or the milking parlor as long as each day is counted only once. A virtual analysis column combines several, semantically equivalent measures in a single column so that each record only has one value for that measurement. To this end, equivalent measurements from different sources are ordered by relevance. In case the measurement with the highest relevance does not have a value, the measurement next in line is taken. For instance, a virtual analysis column for milk yield contains the milk yield measurement from the milking parlor when available or otherwise the milk yield from the DHIA.
In addition to combination of data from multiple loading stage tables, completion of measures for missing data points was identified as a useful feature for analysis tables. Since different data sources track data at different frequencies, gaps in the data occur upon combination of these different data sources in a single analysis table. In meetings, the domain experts brought to attention the fact that many measurements are not taken more frequently due to the fact that these measurements do not change a lot and are valid over a longer period of time, for example, the constituents of silage feed are only measured once per season since they do not change during the season and are valid for that entire period of time. Consequently, certain measurements should be carried over to multiple records for a (configurable) amount of time, for example, use one silage measurement for the following 200 days. The VETMED domain experts suggested to show the freshness of each continued measurement by indicating the number of days that the value has been continued for. The freshness allows users to determine when the original measurement was taken and thus judge the accuracy of the value. For example, in , there are no DHIA data for the 31 August and, therefore, the data from the previous day are continued; the freshness indicates that the measurement is one day old.
While collaborating with domain experts to identify interesting analyses for end users, we discovered that domain experts often do not refer to time in terms of calendar dates but in terms of calving number and lactation days, that is, how many times the cow has calved already and how many days have passed since the current lactation started. In this regard, cows are often not compared by their age as determined through their birthdate but by comparing the number of lactations. shows an example of calving number and day of lactation in an analysis table.
Semantic OLAP patterns
The developed data warehouse employs a relational schema. SQL serves as the query language for data analysis over relational data. The targeted users of the data warehouse—farmers, veterinarians, feed consultants—hardly have any database knowledge and, therefore, relying on SQL as the only query facility is not an option since the formulation of complex SQL code would overburden prospective users. Typically, in such cases, analysts are provided with standardized reports, which are then used by non-experts in database technology. The explorative nature of the presented project, however, makes the definition of a standard set of reports impossible since there were no specific requirements for analysis at the beginning of the project.
In meetings in the beginning of the project, textual examples of possible OLAP queries were created by domain experts, with the assistance of DKE and JR, in order to gain an informal set of requirements. The set of examples was then analyzed by DKE. The analysis of the examples led to the conclusion that most queries are some sort of comparison. Two main types of comparison could be identified. First, two sets of data from the same analysis table were often compared, for example, body condition of animals at day one of lactation with the body condition at day 30 of lactation. Second, data from different analysis tables were also compared, for example, the number of calvings in one month compared to the number of detected illnesses in the following month. The remaining examples were simple selections of data from one analysis table without any comparisons.
After further examination of the textual query examples, patterns could be identified and described. These patterns consist of different elements that are in relation to each other, for example, measurements of some analysis table. A custom RDF vocabulary serves for the definition of semantic OLAP (semOLAP) patterns. Using this RDF vocabulary, patterns, pattern elements, and their relationships can be defined formally. Due to the definition in RDF format, semantic OLAP patterns are compatible with the RDF description of the data warehouse model, that is, loading stage and analysis view. The thus defined query patterns can be instantiated and automatically translated into SQL.
The discussions with domain experts also helped to identify common calculations applied to measurements as well as commonly employed business terms. To incorporate these calculations and business terms into the system, DKE proposed the notions of calculated measures and predicates. Calculated measures are derived from other measures by some kind of calculation, for example, sum of milk yield or fat-to-protein ratio in milk. Predicates define business terms, which are used by domain experts. For example, the term “high-lactating cow” represents an animal within the first 100 days of lactation. In practice, calculated measures and predicates are expected to be defined by domain experts in collaboration with data engineers. Calculated measures and predicates are defined in RDF, stating all employed schema elements. An expression in a target language—here: SQL—is provided for each calculated measure and predicate, similarly to reference modeling according to the BIRD approach (Schuetz et al. Citation2016); the creation of an extensive formal language for the definition of calculations and conditions was deemed out of focus and too time-consuming in the case of the agriProKnow project. The defined calculated measures and predicates may then also be used as concrete values for pattern elements in pattern instances for pattern-based querying.
In order to map the patterns and pattern elements to SQL for automatic query formulation, each pattern is provided with a pattern expression. All pattern expressions are defined using a grammar based on SQL. The grammar was solely created for the purpose of defining pattern expressions that map semOLAP patterns to SQL. A pattern expression consists of SQL snippets, placeholders for pattern elements, and functions wrapping these placeholders, for example, a function to create comma-separated lists. On execution of a pattern-based query, the pattern expression is parsed and the placeholders are substituted with their concrete values. The result of the transformation is SQL code representing the pattern-based query, which can be executed on the RDBMS.
Semantic OLAP patterns provide self-service capabilities to users. Concerning the theoretical framework, we hypothesize that self-service capabilities, and thus semantic OLAP patterns, will eventually increase user acceptance, and thus lead to organizational implementation success. Semantic OLAP patterns positively influence self-service capabilities from two perspectives. First, the OLAP patterns themselves can be instantiated and automatically translated into SQL, thereby facilitating query formulation. Second, semantic OLAP patterns are a description of the semantics of queries, potentially fostering better understanding of the analysis.
Interpretation and action
Once the data are in the data warehouse, analysts may execute queries over these data, the results of which must then be interpreted correctly and acted upon accordingly. In this section, we present two actions, namely semantic description of query results and analysis rules, that aimed at establishing a system that supports analysts with the interpretation and use of analysis results.
Semantic query results
The semantics of a pattern-based query is described by the underlying OLAP pattern, which specifies how the formal pattern elements should be arranged in order to obtain a specific result. Hence, semantic OLAP patterns also serve for the description of the semantics of query results. Concerning the format of the actual result data, the analyst may choose among three options: RDF, CSV, and database view. An RDF result can be further linked to domain ontologies. Definitions of calculated measures and predicates used in the query are likewise included in the result, empowering users to investigate and understand the computations in the query as well as the restrictions applied on the data. The CSV format serves many statistical tools as an exchange format. Hence, the main users of CSV output during the project were VETMED and STOCH in order to import the query results into spreadsheet or statistical software for further analysis. Persisting a pattern-based query as a database view allows for direct access through the connectivity drivers of the RDBMS without the need to access through the REST interfaces provided by the semantic data warehouse. The result of pattern-based query also becomes accessible to commercial BI applications. While SMART proposed the use of a commercial BI application for visualization purposes, JR created interactive dashboards for end users on top of database views defined by persisted pattern-based queries.
Concerning the theoretical framework, we hypothesize that the semantic description of query results leads to increased organizational implementation success as prospective users are more likely to accept the data warehouse if they understand the result of the analyses. Besides semantic description, being able to export query results in multiple, versatile formats will contribute to a positive impact on organizational implementation success. For example, statisticians are familiar with their statistical software and thus prefer an output format that these programs can import in order to allow for further processing of query results in a familiar environment. Statisticians are thus more likely to accept the data warehouse system and the corresponding query facilities if they are provided with an output format compatible with their preferred software.
Analysis rules
In precision dairy farming, cows are constantly monitored and, in most cases, not in order to gain new knowledge but simply to check on their health and productivity by analysis of certain measurements, such as milk yield and movement. This kind of analysis occurs periodically and may serve different purposes. First, the analysis could serve to generate a periodic report that allows the analyst to gain an overview of the farm’s current situation. Second, the analysis could check for extraordinary readings that demand action, for example, if a cow only moved two meters in an entire day then the veterinarian must be called to perform a checkup. Over time, there is little variation in the definition of these queries. Hence, semantic OLAP patterns may serve as the fundamental for such periodic analyses. During the analysis, the project participants also decided that no timely real-time analyses would be performed, for example, every second. In that case, a data stream management system would be the more appropriate choice.
DKE proposed the introduction of analysis rules based on OLAP patterns for automating periodic analyses that lead to the creation of reports or alerts. An analysis rule consists of a logical event that triggers the rule, a focus query that defines which objects are the focus of the analysis, a specification of data of interest from the analysis view, optional conditions that the data of interest for the objects in focus should be checked against, and a definition of the structure of the event raised by the rule. As of now, the only logical events supported by the implementation are temporal events specified as intervals, that is, an analysis rule is triggered once every interval, for example, once every day. Future work will introduce other types of logical events. The focus query, defined using an OLAP pattern, identifies the objects, for example, specific groups of animals such as the animals fed yesterday, functional areas or farm sites, the data of interest for which are to be investigated. Another OLAP pattern then specifies the data of interest to be analyzed for the focus group, for example, the milk yield or the blood level of some substance per time period and animal. The results of focus query and the query specifying the data of interest are then joined over their common attributes. A condition further specifies when an entry in the data of interest for the focus of the analysis is also in the result. For example, the focus could be all animals fed yesterday and the condition could restrict the result to only those animals in the focus with a blood level of a specific substance being above a specified threshold. In case that no condition is stated, all the objects that constitute the focus of the analysis are part of the result. As a result, an analysis rule raises an event with a specific schema, the attributes of which are elements in the results of the analysis rule’s OLAP patterns.
Analysis rules are specified using a custom RDF vocabulary. The RDF definitions of analysis rules automatically translate into triggers and tables in the RDBMS. Temporal event detection and the execution of analysis rules then happen in the RDBMS. The result events raised by the rules are written into specific tables which can be read by external programs that implement the action associated with these rules—an approach that preserves agility.
Conclusions
The aim of the agriProKnow project was the design and implementation of an active semantic data warehouse to support data analysis in precision dairy farming. illustrates the architecture of the implemented data warehouse. The data warehouse employs two database systems, namely a relational database and an RDF triple store. The relational database contains the actual data used for analysis, partitioned into loading stage and a derived analysis view. The RDF triple store contains as metadata the multidimensional model of the data in the relational database as well as metadata about OLAP and rule patterns, which can be instantiated by analysts using a special query interface. The data are loaded into the data warehouse in RDF format, and cached in the triple store before being transformed into relational format and loaded into the relational database’s loading stage. External applications mainly communicate via REST interfaces, forwarding arguments and input data to the appropriate Java programs for further processing. In some cases, external applications directly access the databases on a read-only basis. External applications, however, do not directly write into the database: The appropriate Java programs perform checks to ensure consistency of the databases.
Figure 5. The architecture of the active semantic data warehouse for precision dairy farming as implemented in the course of the presented project.
The final system is an advanced experimental prototype, which established the conceptual foundations for future development efforts in order to implement a production-ready system. In particular, future development will focus on privacy aspects, which are especially important to farmers. Furthermore, the data model could be extended to enable further analyses: The configurative nature of the data warehouse facilitates extension. Nevertheless, the implementation of the experimental prototype already delivered interesting insights for practice and research. In the following, we briefly summarize the main contributions of this action research study.
Contribution summary
While the agriProKnow project has also produced design artifacts in the area of BI and data warehousing—as described in separate design science research papers (Kovacic et al. Citation2018; Schuetz et al. Citation2017) —this action research study had a different focus: analyze the actions taken in the course of the agriProKnow project with respect to their implications for information systems practice and research. Hence, the contributions of this paper lie in the general description of a wide array of actions that led to the success of the agriProKnow project, as well as the lessons learned while taking these actions, rather than in the formal definition of the produced design artifacts. With respect to practice, we conclude that the data warehouse remains a relevant concept also in the age of big data, storing clean data in a format and granularity suitable for analysis. Furthermore, when introducing BI technology in an environment that traditionally does not rely on advanced data analysis, agility is key to implementation success. With respect to research, we extended a well-known model for data warehousing success with factors for big data analysis. The resulting adaptations to the theoretical model may serve as the starting point for future research. In the following, we highlight the implications of this study for practice and research.
Implications for practice
In the course of the project, identifying the appropriate base granularity for the data warehouse emerged as a key factor to project success. An appropriate level of granularity provides semantic abstraction of the raw data that facilitates comprehension of the data model for analysts. For example, rather than sifting through raw sensor data, it is more intuitive for the analyst to be presented with the minimum and maximum temperature measured within a specific functional area during a given time period or with the duration of each type of activity per animal, functional area, and time period. Furthermore, common advice found in literature for handling big volumes of data arriving with high frequency suggests pushing aggregation toward the source systems (Jagadish et al. Citation2014). Indeed, among our findings is that in many circumstances the full amount of generated sensor data is not required for conducting meaningful analysis, but that storing the entirety of high-frequency sensor readings presents major technical challenges and historical analysis may not be feasible in a reasonable amount of time. Of course, should real-time reaction to detected events be required, a data stream management system is typically preferable over a data warehouse. Both technologies, however, are not mutually exclusive. We may well imagine an architecture where a data stream management system tends to real-time event detection for triggering immediate responses and handles pre-aggregation of the data for long-term storage in the data warehouse, where the data are held for future analysis.
Another important lesson learned was that for non-standard development projects that introduce data analysis to an area previously not relying heavily on advanced data analysis, agility is the key to project success. In such projects, no blueprints for data models exist and even domain experts, in the beginning, lack a complete vision of what constitutes an interesting analysis. In that case, data engineers and BI specialists must, in frequent meetings with the domain experts, elicit requirements for conducting meaningful analysis, propose potential data models and interesting queries, and refine the designs in accordance with the domain experts’ comments. The development technology should be flexible enough to allow for rapid prototyping in order for the data engineers and BI experts to react quickly to evolving requirements over the course of a project.
In practice, many different preparation steps are required to render large volumes of raw sensor data useable for analysis. Frequent meetings with domain experts uncovered useful additions to the source data that facilitate the experts’ analytical tasks. Among these transformation steps are the identification of an appropriate level of granularity, continuation of measurements in order to eliminate Null values, and derivation of custom time units. We surmise that data warehousing projects in domains other than precision dairy farming may also benefit from such data preparation.
Implications for research
Action research operates under a theoretical framework and refines the research model based on the experience gathered in the course of action taking. Action research is similar to case research, which is typically considered to be “exploratory in nature” (Benbasat, Goldstein, and Mead Citation1987). In that spirit, the proposed extensions and refinements of the research model discovered in the course of the agriProKnow project may serve as hypotheses for further empirical investigation.
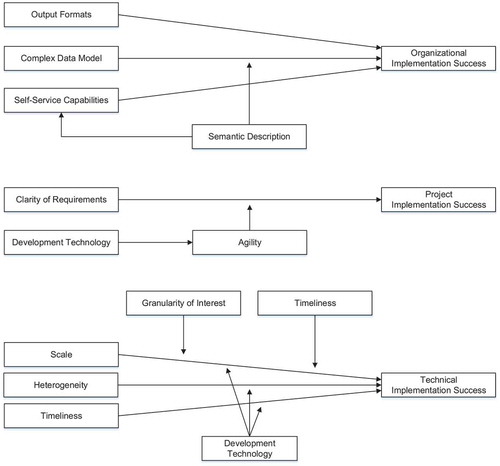
shows, as consequence of the actions taken, proposed refinements of the employed research model for data warehousing success. The described influence of factors on organizational implementation success are more hypothetical than those on project and technical implementation success due to the experimental nature of the implemented system. Hence, we hypothesize that the more output formats available to analysts, the higher the acceptance of the data warehouse by the users. Furthermore, we hypothesize that complex data models are detrimental to user acceptance, but semantic description of data models and query results alleviates the negative impact. We also hypothesize that increased self-service capabilities lead to higher organizational implementation success and semantic description positively influences the users’ self-service capabilities. Concerning project implementation success, we experienced that clear requirements benefit project implementation success but that agility, positively influenced by an appropriate choice of development technology, counteracts a lack of clarity of the requirements in the beginning of a project. Concerning technical implementation success, we note a moderating effect of development technology on the influence of scale, heterogeneity, and timeliness: The better the technology, the lower the obstacles posed by the scale and heterogeneity of the data as well as the timely provision of results. While scale certainly has a negative influence on technical implementation success, we find that a higher granularity of interest, which allows for pre-aggregation prior to loading the data into the data warehouse, and lower requirements with respect to desired update and reaction time, that is, timeliness, alleviate the negative impact of scale on technical implementation success.
Figure 6. The extensions to the research model in as discovered during the presented action research project.
Additional information
Funding
Notes on contributors
Christoph G. Schuetz
Christoph G. Schuetz is an Assistant Professor at the Department of Business Informatics—Data & Knowledge Engineering at Johannes Kepler University (JKU) Linz, Austria. He received his diploma and doctorate in business informatics from JKU Linz in 2010 and 2015, respectively. While pursuing his doctoral degree, he visited Portland State University on a Marshall Plan Scholarship in 2012, and the University of Konstanz in Germany on a Marietta Blau Grant in 2014. In 2011, he was awarded the TDWI Award for Diploma and Master’s Theses for the best thesis on business intelligence and data warehousing in Germany, Austria, and Switzerland. His research interests include business intelligence, semantic web technologies, business process modeling, and information privacy.
Simon Schausberger
Simon Schausberger was at the Department of Business Informatics—Data & Knowledge Engineering at JKU Linz from 2016 to 2018, working as a junior researcher in the agriProKnow project. He earned his master’s degree in business informatics in 2016. In 2015, he studied at the University of Tasmania. He has been working as a software developer since 2010.
Michael Schrefl
Michael Schrefl is Head of the Department of Business Informatics—Data & Knowledge Engineering at JKU Linz. The department maintains close ties with industry, pursuing joint research projects in the aeronautical and agricultural domains. He received his engineering degree (Dipl.-Ing.) and his doctorate in computer science from TU Wien in Vienna, Austria, in 1983 and 1988, respectively. In 1983–1984, he studied at Vanderbilt University on a Fulbright Scholarship. From 1985 to 1992, Dr. Schrefl was with the TU Wien. In 1992, he was appointed professor of business informatics at JKU Linz. Additionally, in 1998, he was appointed Professor of Computer and Information Science at the University of South Australia.
Notes
References
- Abelló, A., O. Romero, T. B. Pedersen, R. Berlanga, V. Nebot, M. J. Aramburu, and A. Simitsis. 2015. Using semantic web technologies for exploratory OLAP: a survey. IEEE Transactions on Knowledge and Data Engineering 27 (2):571–88. doi:10.1109/TKDE.2014.2330822.
- Agrawal, D., P. Bernstein, E. Bertino, S. Davidson, U. Dayal, M. Franklin, and J. Widom. 2012. Challenges and opportunities with big data: a white paper prepared for the computing community consortium committee of the computing research association. Accessed February 01, 2018. https://cra.org/ccc/resources/ccc-led-whitepapers/.
- Avison, D., R. L. Baskerville, and M. D. Myers. 2001. Controlling action research projects. Information Technology & People 14 (1):28–45. doi:10.1108/09593840110384762.
- Banhazi, T. M., H. Lehr, J. L. Black, H. Crabtree, P. Schofield, M. Tscharke, and D. Berckmans. 2012. Precision livestock farming: An international review of scientific and commercial aspects. International Journal of Agricultural and Biological Engineering 5 (3):1–9.
- Baskerville, R. L. 1999. Investigating information systems with action research. Communications of the AIS 2 (3es). http://dl.acm.org/citation.cfm?id=374468.374476
- Baskerville, R. L., and M. D. Myers. 2004. Special issue on action research in information systems: making is research relevant to practice: Foreword. MIS Quarterly 28 (3):329–35.
- Baskerville, R. L., and A. T. Wood-Harper. 1996. A critical perspective on action research as a method for information systems research. Journal of Information Technology 11 (3):235–46. doi:10.1080/026839696345289.
- Benbasat, I., D. K. Goldstein, and M. Mead. 1987. The case research strategy in studies of information systems. MIS Quarterly 11 (3):369–86. doi:10.2307/248684.
- Bewley, J. 2010. Precision dairy farming: Advanced analysis solutions for future profitability. In Proceedings of the First North American Conference on Precision Dairy Management. Accessed 25 February 2018. http://precisiondairy.com/proceedings/s1bewley.pdf
- Bonnet, P., J. Gehrke, and P. Seshadri. 2001. Towards Sensor Database Systems. In Proceedings of the MDM 2001 conference, ed. K.-L. Tan, M. J. Franklin and J. C.-S. Lui. LNCS 1987, 3–14. Heidelberg: Springer.
- Caracciolo, C., A. Stellato, A. Morshed, G. Johannsen, S. Rajbhandari, Y. Jaques, and J. Keizer. 2013. The AGROVOC Linked Dataset. Semantic Web 4 (3):341–48. doi:10.3233/SW-130106.
- Etcheverry, L., and A. A. Vaisman. 2012. QB4OLAP: A Vocabulary for OLAP Cubes on the Semantic Web. In Proceedings of the Third International Conference on Consuming Linked Data, 27–38. CEUR Workshop Proceedings 905: CEUR-WS.org.
- Etcheverry, L., A. A. Vaisman, and Z. Esteban. 2014. Modeling and querying data warehouses on the semantic web using QB4OLAP. In Proceedings of the DaWaK 2014 conference, ed. L. Bellatreche, and M. K. Mohania, LNCS 8646, 45–56. Cham: Springer.
- Golfarelli, M., D. Maio, and S. Rizzi. 1998. The dimensional fact model: A Conceptual model for data warehouses. International Journal of Cooperative Information Systems 7 (2–3):215–47.
- Hitzler, P., M. Krotzsch, and S. Rudolph. 2009. Foundations of semantic web technologies. Boca Raton, FL: CRC press.
- Jagadish, H. V., J. Gehrke, A. Labrinidis, Y. Papakonstantinou, J. M. Patel, R. Ramakrishnan, and C. Shahabi. 2014. Big data and its technical challenges. Communications of the ACM 57 (7):86–94. doi:10.1145/2611567.
- Järvinen, P. 2007. Action research is similar to design science. Quality & Quantity 41 (1):37–54. doi:10.1007/s11135-005-5427-1.
- Kovacic, I., C. G. Schuetz, S. Schausberger, R. Sumereder, and M. Schrefl. 2018. Guided query composition with semantic OLAP patterns. In Workshop Proceedings of the EDBT/ICDT 2018 Joint Conference, Aachen.
- Lauser, B., M. Sini, A. Liang, J. Keizer, and S. Katz. 2006. From AGROVOC to the agricultural ontology service/concept server. An OWL model for creating ontologies in the agricultural domain. In Proceedings of the OWLED 2006 Workshop on OWL: Experiences and Directions. CEUR Workshop Proceedings 216: CEUR-WS.org. Aachen.
- Mohania, M., U. Nambiar, M. Schrefl, and M. Vincent. 2009. Active and real-time data warehousing. In Encyclopedia of database systems, ed. L. Liu, and M. T. Özsu, 28. Boston, MA: Springer US. doi:10.1007/978-0-387-39940-9_8.
- Myers, M. D. 1997. Qualitative research in information systems. MIS Quarterly 21 (2):241–42. doi:10.2307/249422.
- Russom, P. 2017. Data lakes: Purposes, practices, patterns, and platforms. Accessed February 01, 2018. https://tdwi.org/research/2017/03/best-practices-report-data-lakes.
- Schuetz, C. G., B. Neumayr, M. Schrefl, and N. Thomas. 2016. Reference modeling for data analysis: The BIRD approach. International Journal of Cooperative Information Systems 25 (2):1–46. doi:10.1142/S0218843016500064.
- Schuetz, C. G., S. Schausberger, I. Kovacic, and M. Schrefl. 2017. Semantic OLAP patterns: Elements of reusable business analytics. In Proceedings of the OTM 2017 Conferences, Part II, 318–36. LNCS 10574. Cham: Springer.
- Schulze, C., J. Spilke, and W. Lehner. 2007. Data modeling for precision dairy farming within the competitive field of operational and analytical tasks. Computers and Electronics in Agriculture 59 (1):39–55. doi:10.1016/j.compag.2007.05.001.
- Sherman, R. 2015. Business intelligence guidebook: From data integration to analytics. Amsterdam: Elsevier.
- Skoutas, D., and A. Simitsis. 2006. Designing ETL processes using semantic web technologies. In Proceedings of the Ninth ACM International Workshop on Data warehousing and OLAP, 67–74. New York, NY: ACM.
- Susman, G. I., and R. D. Evered. 1978. An assessment of the scientific merits of action research. Administrative Science Quarterly 23 (4):582–603. doi:10.2307/2392581.
- Thalhammer, T., M. Schrefl, and M. Mohania. 2001. Active data warehouses: complementing OLAP with analysis rules. Data & Knowledge Engineering 39 (3):241–69. doi:10.1016/S0169-023X(01)00042-8.
- Vaisman, A., and Z. Esteban. 2014. Data warehouse systems: Design and implementation. Heidelberg: Springer.
- W3C. 2014. The RDF data cube vocabulary: W3C recommendation 16 January 2014. http://www.w3.org/TR/2014/REC-vocab-data-cube-20140116/.
- Wathes, C. M., H. H. Kristensen, J.-M. Aerts, and D. Berckmans. 2008. Is precision livestock farming an engineer’s daydream or nightmare, an animal’s friend or foe, and a farmer’s panacea or pitfall? Computers and Electronics in Agriculture 64 (1):2–10. doi:10.1016/j.compag.2008.05.005.
- Wixom, B. H., and H. J. Watson. 2001. An empirical investigation of the factors affecting data warehousing success. MIS Quarterly 25 (1):17–41. doi:10.2307/3250957.