
Abstract
Reports of ground water contamination in a southwestern Pennsylvania community coincided with unconventional shale gas extraction activities that started late 2009. Residents participated in a survey and well water samples were collected and analyzed. Available pre-drill and post-drill water test results and legacy operations (e.g., gas and oil wells, coal mining) were reviewed. Fifty-six of the 143 respondents indicated changes in water quality or quantity while 63 respondents reported no issues. Color change (brown, black, or orange) was the most common (27 households). Well type, when known, was rotary or cable tool, and depths ranged from 19 to 274 m. Chloride, sulfate, nitrate, sodium, calcium, magnesium, iron, manganese and strontium were commonly found, with 25 households exceeding the secondary maximum contaminate level (SMCL) for manganese. Methane was detected in 14 of the 18 houses tested. The 26 wells tested for total coliforms (2 positives) and E. coli (1 positive) indicated that septic contamination was not a factor. Repeated sampling of two wells in close proximity (204 m) but drawing from different depths (32 m and 54 m), revealed temporal variability. Since 2009, 65 horizontal wells were drilled within a 4 km (2.5 mile) radius of the community, each well was stimulated on average with 3.5 million gal of fluids and 3.2 million lbs of proppant. PA DEP cited violations included an improperly plugged well and at least one failed well casing. This study underscores the need for thorough analyses of data, documentation of legacy activity, pre-drill testing, and long term monitoring.
Introduction
Groundwater serves as a major source of drinking water for many Pennsylvania residents with an estimated 3 million Pennsylvanians relying on private wells for their water needs.Citation[1] Pennsylvania has over 1 million water wells and around 20,000 new water wells are drilled each year.Citation[1] Unlike public water supplies, Pennsylvania does not regulate residential groundwater use and there have been very few studies on general water well quality.Citation[1–4]
The rise in unconventional shale gas extraction using hydraulic fracturing and the consistent claims of groundwater contamination associated with this practice has raised concerns about groundwater quality.Citation[5–10] Freshwater aquifers may be contaminated by brines or hydrocarbons from underlying formations, chemicals used in the drilling or fracturing processes, waste water, and the natural gas itself through a number of pathways.Citation[11–18] These include but are not limited to surface contamination from leaky impoundments and spills, poor well construction resulting in failed cement and improper casing, a pressurized annulus, as well as pre-existing faults and legacy issues from previous mining and drilling operations.Citation[11,12,19] Well construction issues involving casing and cementing failures of the gas wells account for most contamination incidents.Citation[19] They result in the creation of vertical migration pathways for fluids to migrate from the surface downward or from deep formations under extreme pressure upwards. In addition, hydraulic fracturing can increase the permeability of the targeted deep formations by creating new fractures or propagating existing fractures thereby creating flow pathways for the upward migration of gases and fluids.Citation[11,14,17,18]
Establishing a definitive link between hydraulic fracturing itself and groundwater contamination has been challenging. The Energy Policy Act of 2005, Section 322 Hydraulic Fracturing amends the Safe Drinking Water Act to exclude “(i) the underground injection of natural gas for purposes of storage and (ii) the underground injection of fluids or propping agents (other than diesel fuels) pursuant to hydraulic fracturing operations related to oil, gas, or geothermal production activities.” Additionally, the large distances (hundreds of meters) separating the deep gas rich formations and the shallower groundwater sources, the multitude of surface and subsurface contaminant sources and the lack of comprehensive scientific baseline study data are all factors that contribute to the challenge.Citation[2-4,20] The main objective of this study was to determine if recent the changes in well water (quality and quantity) of a small rural community in southwestern Pennsylvania could be related to the current unconventional shale gas extraction activities of drilling and/or fracturing.
The community chosen for this study comprises a development that began as hunting camps with most eventually converted to year round residences. It covers a total area of around 2.5 km2 (1 km × 2.5 km or 0.62 × 1.5 miles) and has about 190 households. All have been dependent on wells for their source of drinking water as there is no connection to municipal supply. Although there had been previous oil and gas drilling and coal mining activity in the area,Citation[21,22] considerable new activity in unconventional shale gas extraction (USGE) now surrounds the community. The first reported unconventional extraction of shale gas according to the Pennsylvania Department of Environmental Protection (PA DEP) began in this area in early 2007 and 2008 with the drilling of the Steven Lensey 1 and Reedy D2 vertical wells, respectively. Drilling activity increased with 20 wells spudded between March 2010 and November 2011.
Coinciding with the increased USGE activity, several residents of the community reported groundwater contamination with changes in water quality and quantity.Citation[23] As drilling continued more residents filed complaints and alternative water was provided.Citation[24,25] After a PA DEP investigation found no connection between the change in water quality and the drilling, the alternative water was removed and a volunteer water bank was established.Citation[24,25] The current study was conducted between the fall of 2011 through the spring of 2014. The goal was to determine how many wells in the community had been affected as well as those that had not, and to determine types and possible sources of contamination. An initial door-to-door survey of the residents was carried out in the fall of 2011.
Residents were asked six questions regarding water supply, well location, well construction and water issues. Subsequently, well water samples were collected and analyzed and additional surveys were completed. Water analysis included on site measurements (temperature, dissolved oxygen, pH, and conductivity) and lab analyses for selected anions (chloride, bromide, fluoride, sulfate, phosphate, nitrate, nitrite) using ion chromatography and selected metals using ICP-MS (EPA method 200.8). A subset of wells was tested for light hydrocarbons and the presence of coliforms and E. coli. Base maps of the study area were created identifying the location of current horizontal wells, legacy operations (e.g., gas and oil wells, coal mining), and topography. Where available pre-drill and post-drill water analyses, done either by the drilling company, Pennsylvania Department of Environmental Protection (PA DEP), or independent certified water testing lab, were reviewed in addition to a comprehensive PA DEP file review of permits and well completion reports.
Methods and materials
Community survey
The study was conducted with full Institutional Review Board (IRB) approval with the principle investigator (JFS) completing basic IRB training. The survey consisted of six questions relating to well location, water quality and quantity and testing.
| 1. | Do you have well water and where is your well located? | ||||
| 2. | What kind of well is it (e.g. artesian, rotary, cable tool)? | ||||
| 3. | Do you know how deep the well is and have you noticed a change in your well depth? | ||||
| 4. | Have you noticed any change in water quality (taste, smell, color) and if so when? | ||||
| 5. | Have you noticed any change in the water flow or quantity? | ||||
| 6. | Have you had the water tested and would you be willing to share those results? | ||||
Sample collection and analysis
Water samples were collected in sterile 1L French square glass bottles and 100 ml glass bottles containing 10M nitric acid (trace metal grade, Fisher Scientific, Pittsburgh, PA, USA). Samples were collected upstream of any water treatment and filtration devices, after purging the source, usually an outside spigot, for 10–20 min. Purge times were reduced to between 2–5 min when running the well dry was an issue. Collected samples were stored in the dark and on ice and transported back to the lab and stored at 4°C until analyses. On site field measurements of temperature, dissolved oxygen, pH, and conductivity were made with a YSI-Pro Plus multimeter (YSI Incorporated, Yellow Springs, OH, USA). Lab concentrations of selected anions (chloride, bromide, fluoride, sulfate, phosphate, nitrate, nitrite) were measured using a ThermoFisher Dionex ICS-1100 Ion Chromatography System equipped with a conductivity cell and UV/VIS detector (Dionex, Sunnyvale, CA, USA) using EPA Method 300.0Citation[26] with modifications as reported in Kondratyuk et al.Citation[27] Five-point calibrations, in triplicate, were done with standards for each anion. Analysis for selected cations was done with a Perkin-Elmer NexION 300X ICP-MS (Waltham, MA, USA) at the University of Pittsburgh using the EPA Method 200.8Citation[28] with modifications as reported in Kondratyuk et al.Citation[27]
Light hydrocarbon analyses
For light hydrocarbon analyses (methane, ethane, ethene, propane, propylene, butane), samples were collected in 100-ml amber septum sealed vials without headspace. The bottles were kept in the dark on ice, and hand delivered to VaporTech Analytical Laboratory and Sampling Services (Valencia, PA, USA) where the analyses were completed.
Total coliform and E. coli testing
Total coliforms were determined using EPA Method 9222 B and Method 9222 G was used to detect the presence of E. coli.Citation[29] First, 100-mL samples were collected in triplicate using six 50-mL sterile polypropylene tubes. The water was collected from either an outside spigot or other inside faucet prior to any water treatment system (i.e., water softeners, UV treatment, or filtration). The samples were kept on ice packs in the dark after collection and processed within 48 h.
Data mapping and file review
Base maps of the study area were created using the ArcGIS software package (ESRI, Redlands, CA, USA). Preexisting base maps, topography, digital elevation data (LiDAR), coal mining operations, and abandoned mine land, were retrieved from the Pennsylvania Spatial Data Access (PASDA) and Pennsylvania Geospatial Data Clearinghouse.Citation[30] Gas field locations were obtained from the Pennsylvania Department of Conservation and Natural Resources (PA DCNR).Citation[31] Abandoned oil and gas well data, where available, came from the PA DEP.Citation[32]A comprehensive PA DEP file review was conducted in January of 2013 that included permits and well completion reports for the study area. Violations were accessed through the PA DEP website.Citation[32] In addition, pre-drill and post-drill water analyses, done either by the drilling company and/or PA DEP and provided by study participants were reviewed and compiled.
Results
Community survey
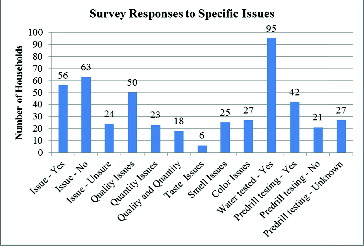
In the initial survey, a total of 143 households participated. Survey results showed that majority of survey respondents (61%) did not know the type of well construction. When well type was known, it was either cable tool (27% of respondents) or rotary (12% of respondents). The average and median well depths were 63.7 m (209ft) and 54.3 m (178 ft) respectively, with the shallowest well at a depth of 19.8m (65 ft) and the deepest well at 274.3 m (900 ft). Fifty-six (56) households (39%) reported changes in water quality or quantity since 2010, 63 households (44%) reported no issues and the remaining 24 households (17%) were unsure.
Out of the 56 households reporting issues, 50 indicated changes in quality based on taste and/or smell, 23 households had quantity issues and 18 reported both quality and quantity issues (). Color was the most common change, with 27 households reporting brown, black, or orange water. Twenty-five households noticed odors and 6 households a change in taste (). Change in the water level of the well was not readily discernable as 78 of the respondents (55%) indicated they did not know. Six households stated loss of water during normal use. Ninety-five households (66%) indicated that they had their water tested at some time. Among these, only 42 had their water tested by the drilling company as part of predrill testing. Although most households had received their test results, 9 households said they had not.
Fig. 1. Results showing the number of respondents for each question out of the 143 that participated in the survey.
Water chemistry
Initially, 57 water samples from 33 wells were collected and analyzed over an 18-month period for this study. Anion analysis of these samples revealed the presence of all analytes (e.g., bromide, chloride, fluoride, nitrate, phosphate, sulfate) except nitrite (). ICP-MS analysis looked at 31 analytes consisting of a combination of major ions, minor ions (trace metals), inorganic chemicals and radionuclides (e.g., uranium) (). Only cadmium and uranium were not detected. Although their concentrations varied in amount from well to well, the most common contaminates were sodium, calcium, magnesium, iron, manganese, and strontium (). Twenty-five households had levels of manganese above the maximum contaminate level (MCL) (). Plotting of the Cl/Br mass ratios for all water samples having both anions show a broad distribution of values (). However, most lie below the mixing line for seawater ().
Fig. 2. The mass ratios of Cl-Br to Cl for all well water samples having both anions present collected during the study. The halite and seawater mixing curves and septic leachate field are from Katz et al.Citation[48] The precipitation mixing curve is from Davis et al.Citation[44]
![Fig. 2. The mass ratios of Cl-Br to Cl for all well water samples having both anions present collected during the study. The halite and seawater mixing curves and septic leachate field are from Katz et al.Citation[48] The precipitation mixing curve is from Davis et al.Citation[44]](/cms/asset/545d2ec1-ad91-4e37-b1f7-2173258fd50f/lesa_a_992684_f0002_c.jpg)
Table 1. Summary of anion analysis of water samples.
Table 2. Summary of cation analysis of water samples collected in this study.
Regular monitoring of the water wells from two households (Household 1 and Household 2) that were close to each other (204 m), had similar well construction (cable tool), but well depths that differed (32 m and 54 m), in order to determine changes in water quality over time and whether they were affected similarly (). Field analysis showed that the water temperature and pH of these two wells were similar and remained steady with average temperatures of 11°C and 14°C, respectively, and pH of 7 in both. Dissolved oxygen (DO) readings showed seasonal fluctuations, increasing in the colder months, with Household 1 exhibiting more variation in DO. The specific conductance readings of the well from Household 2 mirrored the laboratory chloride readings, indicating that chloride was the major source of dissolved solids.
Fig. 3. Monthly field and lab data for household 1.
Fig. 4. Monthly field and lab data for household 2.
In contrast, Household 1 specific conductance readings were inversely related, with higher conductance readings corresponding to lower chloride levels. Here the increase in conductivity appears to be due to an increase in sulfate. Review of laboratory results for Household 1 and Household 2 showed that except for phosphate, all readings were higher for Household 2 compared to Household 1. ICP-MS analysis for these two households showed the presence of iron and manganese. The varying results of both field and lab analyses indicates that while the two wells share similar physical properties (i.e. location, construction), they draw water from two different sources.
Household 1 and 2 (the same as above) had pre-drill water testing data performed by the industry as well as PA DEP (). Review of this data showed increased levels of all analytes except for barium in Household 1 between pre-drill and post-drill. Analyses of industry pre-drill and three PA DEP post-drill testing data for Household 1 appear to indicate the increases in iron, manganese and strontium coincided with drilling activities. However the levels decrease in subsequent sampling (). Determination letters from the PA DEP reviewed in this study, although negative, indicate contamination (e.g., chloride, iron, and manganese) at levels above secondary MCL (). We were also able to obtain the results of the water analyses carried out by the drilling company and PA DEP for a total of five households (including Households 1 and 2). Four of these reports were pre-drill test results, while the fifth was conducted after the drilling had commenced (). Three of the 5 households also had their water tested by the PA DEP (Households 1, 2, and 5) following complaints filed by the homeowners subsequent to noticing changes to their well water quality (). The data show a change in water quality from pre-drill to post-drilling.
Table 3. Industry water testing results.
Table 4. DEP water testing results.
Light hydrocarbons
Eighteen wells were tested for the presence of light hydrocarbons (methane, ethane, ethylene, propane, propylene, and butane) between January, 2013 and April, 2014 (). Those that were tested multiple times during the study showed that both the concentrations of methane as well as the presence and concentration of other light hydrocarbons varied (data not shown). Ethane was detected in 5 of the wells, and one also had traces of propane and propylene ().
Table 5. Light hydrocarbons (in µg/L).
Total coliforms and E. coli
A total of 26 wells were tested for total coliforms and E. coli as part of this study during 2013. Of these only one well was positive for total coliforms, and one tested positive for both coliforms and E. coli. These results indicate no source of pathogens, or that flow paths large enough to allow bacteria to be transported to the wells are absent.
Base mapping
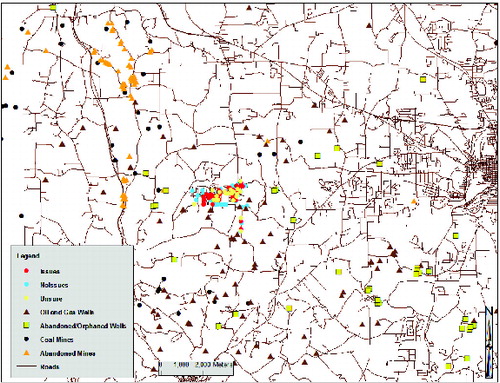
Base mapping of the study findings and data gathered from public databases were used to locate the presence of historic and current oil and gas and mining activity surrounding the community. The Little Creek Oil Field, which has had previous drilling activity, lies at about 1,300’ below the community (). The main petroleum-bearing section is the Hundred Foot sandstone, and the Snee sandstone lies even deeper at around 1,600 ft.Citation[21] Mapping of legacy oil and gas wells, abandoned and/or orphaned wells, coal mines and abandoned mines data confirms the existence of previous oil and gas and mining activity surrounding the community (), however pinpointing these has been difficult. Lytle's review of oil field exploration in Butler County, indicates 500 abandoned oil wells with 250’ spacing drilled into the Hundred Foot and Snee sands within Connequenessing and Forward Townships.Citation[33] No specific locations, however, were provided. The USGS Topo map obtained through the US Fish and Wildlife Service indicate at least three oil wells within the confines of the community.Citation[34] The same cannot be said for gas wells as, unfortunately, these same maps use the identical symbol for buildings and gas wells. PA DEP file review data indicate at least a dozen gas wells were drilled in the area between 1961 and 1985; however, their coordinates (longitude, latitude) appear to have been added later and only plot to the general area, down to minutes rather than seconds (e.g., N40o50’ W 80o00’).
Fig. 5. Survey results plotted over the Little Creek Oil Field that underlies the community.
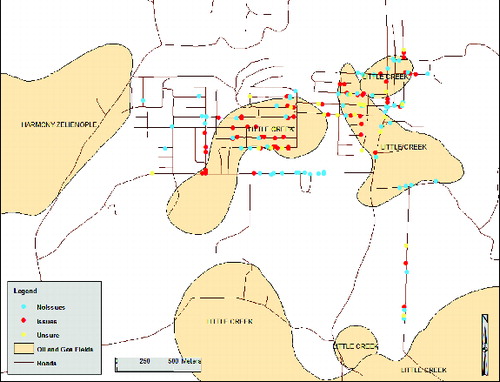
Fig. 6. Current and historic oil and gas and mining activity surrounding the community as could be determined from state sources (e.g., PASDA, PA DEP).
PA DEP file reviews
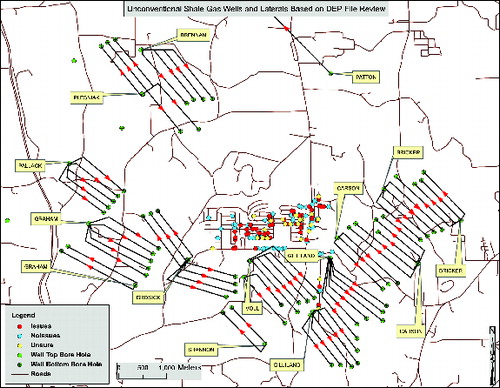
PA DEP file reviews of permits and well completion records provided the locations, lengths, and directions of USGE wells in Connequenessing and Lancaster Townships. Analysis of this data shows that by late 2012 the community was surrounded by 15 well pads and a total of 65 laterals (horizontal gas wells) (). summarizes the review of unconventional shale gas drilling records obtained from the PA DEP. Each well was stimulated with varying amounts of fluids and proppant, on average 3.5 million gal and 3.2 million lbs, respectively.
Fig. 7. Locations, lengths, and directions of lateral wells surrounding the community. Data compiled from DEP file review of location plats.
A list of violations for oil and gas activity in the township from September 2010 through September 2012 was obtained from the PA DEP website ().Citation[32] Violations ranged from simple administrative issues such as failure to post proper documentation to more direct environmental impacts such as improper discharges, and compromised well casings and inadequate plugging of a well.
Table 6. Summary of DEP file reviewa findings showing well name, dates of stimulation (e.g., fracking), volume of fluids, amount of proppant and length of the lateral.
Table 7. PA DEP reported USGE violations for the township issued between September 2010 to 2012.
Discussion
The results of the survey indicate that a significant number of families (56 out of 143) saw noticeable changes in quality and/or quantity to their private well water supply since 2009 (). Although the recent USGE activities began in 2009 the respondents began noticing the changes at different times after that. This delay might be attributed the location within the community of each household relative to the well pads, the substantial difference in depth of the water wells, (that varied in depth from 19 to 274 m), as well as the form of contamination. Most respondents saw changes in secondary water standards, namely color, taste or smell. It is not surprising that no one surveyed had equipment to routinely monitor or test their well water quality. The study by the Center for Rural Pennsylvania indicated that about half of the participants in their study had not had proper water testing done, thus many did not know if they had issues.Citation[1] In contrast, more than 66% of the households in this study (95 out of the 143) indicated they had had their water tested at some time. However, only 42 households had had their water tested by the gas drilling company as part of predrill testing. The survey results suggest that more comprehensive (e.g., greater distances from the well pad) pre-drill testing should be required as recommended by the Citizens Marcellus Shale Commission.Citation[35]
Typical contaminants seen in Pennsylvania domestic wells include bacteria from septic or runoff, chloride from road salt, nitrate and phosphate from agriculture, iron and sulfate from mining, brines from oil and gas wells, and methane.Citation[1–3] The brine and produced water associated with unconventional gas extraction in the Marcellus Shale is reported to contain high levels of total dissolved solids, halides (e.g., chloride, bromide), strontium, barium, and naturally occurring radionuclides.Citation[36–41] Water analyses conducted during this study indicated elevated levels of chloride, manganese, iron, and specific conductance as compared to good quality groundwater.Citation[1] Chloride was found in all of the wells sampled, however, none exceeded the secondary drinking water limit of 250 mg L−1 (). The presence of chloride in Pennsylvania groundwater is common, however, concentrations are typically less than 25 mg L−1.Citation[1,42]
The results from the total coliform and E. coli testing as well as the mass ratio analyses for chloride and bromide, indicate that septic leachate may be ruled out as a source.Citation[43] Other potential sources of contaminants include precipitation, road salt (e.g., halite), and brines associated with coal, oil, and gas fields. Here, the use of Cl/Br mass ratios can be used to assess potential sources of chloride.Citation[44–48] Reported values for Cl/Br mass ratios range from 50–150 for precipitation, 100–200 for shallow groundwater, 300–600 for septic leachate, and 1,000–10,000 for halite.Citation[44,48] Produced water from unconventional shale gas extraction may have concentrations of chloride in excess of 100,000 mg L−1, but the Cl/Br mass ratios are indicative of evaporated seawater.Citation[49] Our analyses revealed that the majority of the well samples fell below the primary mixing line for seawater (). This suggests that brine may be the primary source of elevated chloride mixing with groundwater.Citation[48,49]
Similar to chloride, iron and manganese have limits set under the secondary standards for drinking water.Citation[50] These two analytes were elevated in a number of samples with iron found above the 0.3 mg L−1 standard limit in 3.5% of samples, and manganese was above the 0.05 mg L−1 standard limit in 44% of samples (). The ubiquitous presence of manganese in these wells, with 25 households above the maximum contaminate level (MCL), is a serious health concern ().Citation[50] Manganese is an essential element required for many biological enzymes, however, it is also a known neurotoxin.Citation[51] Long-term exposure can lead to manganism and Parkinson's Disease.Citation[52] Recent studies have shown that manganese concentrations in drinking water between 300-400 ppb can lead to lower IQ in children.Citation[53,54] The presence of iron and manganese is a common occurrence in western Pennsylvania waters, especially around coal mining areas.Citation[1] Although the PA DEP base map for abandoned coal mines does not show the presence of such mines underneath the confines of the community, strip mines are in close proximity () and the watershed is under a TMDL monitoring program.Citation[55] Thus mine drainage may be another important source of contamination to the wells.
Methane was found in 14 of the 18 wells tested, and while most were in low microgram amounts, at least one well had mg L−1 quantities (). Methane can be either biogenic or thermogenic origin. Methanogens, microorganisms belonging to the domain Archaea, generate methane from carbon dioxide, acetate, or simple organic compounds (e.g., formate).Citation[56] Thermogenic methane, on the other hand, is formed through the “cracking” or catagensis of fossil organic carbon (e.g., kerogen), and is usually found with other light hydrocarbons.Citation[14,17] In addition, biogenic methane is depleted in 13C, and has δ13C values ranging from −60 to −120 o/oo.Citation[17] Thus biogenic sources may be distinguished from thermogenic sources through isotopic (e.g., δ13C-CH4 and δ2H-CH4) and geochemical analyses (e.g., propane/methane ratios).Citation[9,14,17,56-58] The presence of associated hydrocarbons (e.g., ethane, propane, propylene, butane) may then be an indication that the source of methane is thermogenic in at least six wells (). Definitive determination of the thermogenicity, however, will require isotopic analyses, but may not indicate the exact source (i.e., both Little Creek Field and deeper deposits are thermogenic).Citation[57,58]
Mapping of survey results shows the spatial extent of groundwater issues experienced by the residents. No pattern of contamination is apparent as the households indicating changes in water quality are not clustered together (). Overlay of the survey results with underlying oil and gas reserves shows that the affected homes sit atop the Little Creek Oil Field (). Both the Hundred Foot sandstone and the Snee sandstone of the Little Creek were developed in the late 1800's and early 1900's, with at least one well reaching over 4,000 ft.Citation[21,33] The PA DEP file review also included permits for at least a dozen conventional wells in the area that were drilled between 1961 and 1985 with several on current USGE sites (e.g., Graham, Gilliland pads). Thus the region has had significant legacy oil, gas, and mining operations ().
More telling is the location of the new unconventional wells as there are 15 well pads with 65 horizontal wells within a -m radius of the community (). The laterals follow a north-north west or south-south-east drilling direction to take advantage of the enhanced permeability of the J1 joint of the Marcellus shale, maximizing yields.Citation[59] The large volumes of fluids and proppant used in the slick water hydraulic fracturing of the new wells (on average 3.2 million gal. and 3 million lbs, respectively) () could also affect the local hydrology and contribute to subsurface disturbance resulting in well water contamination.Citation[11] While the depth of the Marcellus in this part of the state is around 5,000 ft, the violations cited in late 2010 (), especially the failed casing/cement job, could provide conductive pathways for the migration of legacy mining as well as deep formations fluids.Citation[11,19] Although the PA DEP eventually determined that there was no connection between the new drilling and the changes in water quality, their own data indicate that at least for Household 1, there was a dramatic and contemporaneous increase in concentrations of barium, strontium, iron and manganese () as well as contamination in other wells (e.g., chloride, iron, and manganese) at levels above secondary MCL ().
Conclusions
We have used a variety of methods to determine whether there is a correlation between the changes in well water quality in water wells with surrounding USGE in this community in Southwest Pennsylvania. The survey results indicate that there has been an increase in well water issues in the community since 2010. Water chemistry results show elevated cations and anions including manganese, iron, bromide and chloride. Different wells had different contaminants although the majority had manganese above the MCL. Light hydrocarbon analyses suggested a thermogenic source for the methane in some wells. Analysis of mapping results revealed the community lies over the Little Creek Oil Field, and locations of previous mining and oil and gas activities.
DEP file review indicates several violations that could result in groundwater contamination. The proximity and location of USGE well sites to the community provide shorter pathways for the transport of surface and subsurface contamination. The number of lateral wells (65) within 4 km of the community could have contributed to subsurface disturbance ultimately resulting in well water contamination. Further in-depth study of the local geology and hydrology, in addition to access to all pre-drill tests and well completion records would allow for a more definitive assessment. This study demonstrates the challenges faced in making a positive determination (e.g., relating contamination to drilling activity) and the need for thorough investigation including legacy activity, pre-drill testing, and long term monitoring.
Acknowledgments
The authors would like to thank the community for their willingness to participate in the study. We also thank S. Mayes, C. Nolan, C. Brown, and T. Umstead for additional sample collection and analyses as well as W.M. Griffin, R.S. Oremland, and A. Ingraffea for helpful comments.
Funding
This work was supported in part by the Heinz Endowments and Colcom Foundation.
References
- Swistock, B.R.; Clemens, S.; Sharpe, W.E. Drinking water quality in rural Pennsylvania and the effect of management practices. The Center for Rural Pennsylvania: Harrisburg, PA, 2009.
- Swistock, B.R.. Gas well drilling and your private water supply. Penn State College of Agricultural Sciences Cooperative Extension: Harrisburg, PA, 2010.
- Boyer, E.W.; Swistock, B.R.; Clark, J.; Madden M.; Rizzo, D.E. The impact of Marcellus gas drilling on rural drinking water supplies. The Center for Rural Pennsylvania: Harrisburg, PA, 2012.
- Sloto, R.A. Baseline groundwater quality from 20 domestic wells in Sullivan County, Pennsylvania, 2012. U.S. Geological Survey Scientific Investigations Report 2013-5085; Reston, VA, 2013.
- Groundwater Protection Council (GWPC), Modern Shale Gas Development in the United States: A Primer, prepared for the U.S. Department of Energy, National Energy Technology Laboratory (NETL) 2009.
- U.S. Environmental Protection Agency. Study of the potential impacts of hydraulic fracturing on drinking water resources: progress report. EPA601R-12011, 2012.
- Gregory, K.; Vidic, R.; Dzombak, D. Water management challenges associated with the production of shale gas by hydraulic fracturing. Elements 2011, 7, 181–186.
- Vidic, R.D.; Brantley, S.L.; Vandenbossche, J.M.; Yoxtheimer, D.; Abad, J.D. Impact of shale gas development on regional water quality. Science 2013, 340, 1235009.
- Vengosh, A.; Warner, N.; Jackson, R.; and Darrah, T. The effects of shale gas exploration and hydraulic fracturing on the quality of water resources in the United States. Procedia Earth and Planetary Science 3013, 7, 863–866.
- Vengosh, A., Jackson, R.B., Warner, N.; Darrah, T.H.; and Kondash, A. A critical review of the risks to water resources from unconventional shale gas development and hydraulic fracturing in the United States. Environ. Sci. Tech. 2014, 48(15), 8334–8348.
- Harrison, S. Evaluating system for ground-water contamination hazards due to gas- well drilling on the glaciated Appalachian Plateau. Ground Water 1983, 21, 689–700.
- Harrison, S. Contamination of aquifers by over pressuring the annulus of oil and gas wells. Ground Water 1985, 23, 317–324.
- Osborn S.G., Vengosh A.; Warner N. R.; and Jackson, R.B. Methane contamination of drinking water accompanying gas-well drilling and hydraulic fracturing. P. Nat. Acad. Sci. 2011, 108, 8172–8176.
- Warner, N.R.; Jackson, R.B.; Darrah, T.H.; Osborn, S.G.; Down, A., Zhao, K., White, A. and Vengosh, A. Geochemical evidence for possible natural migration of Marcellus formation brine to shallow aquifers in Pennsylvania. P. Nat. Acad. Sci. 2012, 109, 11961–11966.
- Myers, T. Potential contamination pathways from hydraulically fractured shale to aquifers. Ground Water 2012, 50, 872–882.
- Saiers, J.E. and Barth, E. Potential contaminant pathways from hydraulically fractured shale aquifers. Ground Water 2012, 50, 826–826.
- Jackson, R.B.; Vengosh, A.; Darrah, T.H.; Warner, N.R.; Down, A.; Poreda, R.J.; Osborn, S.G.; Zhao, K.; and Karr, J.D. Increased stray gas abundance in a subset of drinking water wells near Marcellus shale gas extraction. P. Nat. Acad. Sci. 2013, 110, 11250–11255.
- Kang, M. CO2, Methane, and Brine Leakage Through Subsurface Pathways: Exploring Modeling, Measurement, and Policy Options. PhD Dissertation, Princeton University. 2014. 131 p.
- Ingraffea, A.R.; Wells, M.T.; Santoro, R.L.; and Shonkoff, S.B.C. Assessment and risk analysis of casing and cement impairment in oil and gas wells in Pennsylvania, 2000–2012. P. Nat. Acad. Sci. 2014, 111(30), 10955–10960.
- Chapman, M.J.; Gurley, L.N. and Fitzgerald, S.A. Baseline well inventory and groundwater-quality data from a potential shale gas resource area in parts of Lee and Chatham Counties, North Carolina, October 2011- August 2012. U.S. Department of Interior and U.S. Geological Survey, Data Series 861. 2014.
- Richardson, G.B. Geology and Mineral Resources of the Butler and Zelienople Quadrangles Pennsylvania, Geological Survey Bulletin 873. United States Department of Interior. United States Printing Office, 1936.
- History of Butler County, Pennsylvania, 1895. R.C. Brown Co. http://www.rootsweb.ancestry.com/~pabutler/1895/ (accessed Nov 2014).
- Associated Press. Connoquenessing WESA Pittsburgh NPR Station, 2012. Available at http://wesa.fm/post/connoquenessing-water-ok (accessed Nov 2014).
- Khan, N. 2014. A day in the life of a water bank. Available at http://publicsource.org/investigations/day-life-of-water-bank#.VGy5h4elpL0 ( accessed May 2014).
- Frazier, R. 2014. Fracking and groundwater contamination? It's complicated. Allegheny Front. Available at http://www.alleghenyfront.org/story/fracking-and-groundwater-contamination-its-complicated. ( accessed Jul 2014).
- U.S. Environmental Protection Agency Method 300.0 Determination of inorganic anions by ion chromatography. Available at http://water.epa.gov/scitech/methods/cwa/bioindicators/upload/2007_07_10_methods_method_300_0.pdf. 2007 (accessed Jun 2014).
- Kondratyuk, T.; Eastham, J.L.; Rutter, J.K.; Bain, D.J.; Basu, P.; Stolz, J.F. Application of anion analysis for chemical characterization of fluids associated with Marcellus Shale gas extraction. Appl. Geochem. 2015, in press.
- U.S. Environmental Protection Agency Method 200.8 Determination of trace elements in waters and wastes by inductively coupled plasma – mass spectrometry. http://water.epa.gov/scitech/method/scwa/bioindicators/upload/2007_07_10_methods_method_200_8.pdf. 2007 ( accessed Jun 2014).
- U.S. Environmental Protection Agency. Protocol for Developing Pathogen TMDLs. EPA 841-R-00-002. Office of Water (4503F), United States Environmental Protection Agency, Washington, DC, 2001.
- Pennsylvania Spatial Data Access (PASDA) and Pennsylvania Geospatial Data Clearinghouse. Available at http://www.pasda.psu.edu/ ( accessed Jun 2014).
- Pennsylvania Department of Conservation and Natural Resources (PA DCNR) Available at http://www.dcnr.state.pa.us (accessed Jun 2014).
- Pennsylvania Department of Environmental Protection (PA DEP) Available at http://www.depweb.state.pa.us/portal/server.pt/community/dep_home/5968 (accessed Jun 2014).
- Lytle, W.S. Oil fields of the greater Pittsburgh region. Mineral Resource Report 70. Pennsylvania Geological Survey, Harrisburg PA. 1976.
- U.S. Fish and Wildlife Service. National Wetlands Inventory. Wetlands mapper. Available at http://www.fws.gov/wetlands/data/mapper.HTML ( accessed Oct 2014.)
- Citizen Marcellus Shale Commission. Marcellus Shale: A Citizens View. Pennsylvania Budget and Policy Center: Harrisburg, PA. 2011. 69 p.
- Blauch, M.; Myers, R.; Moore, T.; and Houston, N. Marcellus Shale post-frac flowback waters - where is all the salt coming from and what are the implications? Society of Petroleum Engineers International 2009. SPE 125740.
- Palmerton Group PADEP Frac flow-back water study: presence of inorganics. Available at http://www.palmertongroup.compdfPADEP%20Frac%20Flow_Back%20Water%20Study_%20Presence%20of%20Ino-rganics.pdf, ed. 2010 ( accessed Jun 2014).
- Chapman, E.C.; Capo, R.C.; Stewart, B.W.; Kirby, C.S.; Hammack, R.W.; Schroeder, K.T.; and Edenborn, H. M. Geochemical and strontium isotope characterization of produced waters from Marcellus shale natural gas extraction. Envir. Sci. Tech. 2011, 46, 3545–3553.
- Balaba, R.S., and Smart, R.B. Total arsenic and selenium analysis in Marcellus shale, high-salinity water, and hydrofracture flowback wastewater. Chemosphere 2012, 89, 1437–1442.
- Rowan, E.L.; Engle, M.A.; Kirby, C.S.; and Kraemer, T.F. Radium content in oil-and gas-field produced waters in the Northern Appalachian Basin (USA): summary and discussion of data. U.S. Geological Survey Scientific Investigations Report 2011-5135; Reston, VA, 2011.
- Brown, V.J. Radionuclides in fracking waste water: managing a toxic blend. Environ. Health Perspect. 2014, 122, A50–55.
- Swistock, B.R.; Sharpe, W.E.; Clark, J. A. Water tests: What do the numbers mean? Penn State Cooperative Extension. College of Agricultural Sciences. University Park, The Pennsylvania State University, 2003.
- Zimmerman, T.M.; Zimmerman, M.L., and Lindsey, B.D. Relation between selected well-construction characteristics and occurrence of bacteria in private household-supplly wells, Southcentral and Southeastern Pennsylvania. U.S. Geological Survey Water Resources Investigations Report 01-4206, 2001.
- Davis, S.N.; Whittemore, D.O.; Fabryka-Martin, J. Uses of Chloride/Bromide ratios in studies of potable water. Groundwater 1998, 36(2), 338–350.
- Cartwright, I.; Weaver, T.R.; Fifield, L.K. Cl/Br ratios and environmental isotopes as indicators of recharge variability and groundwater flow: An example from the southeast Murray Basin, Australia. Chem. Geol. 2006, 231, 38–56.
- Leybourne, M.I.; Goodfellow, W.D. Br/Cl ratios and O, H, C, and B isotope constraints on the origin of saline waters from eastern Canada. Geochem. Cosmochem. Acta. 2007, 71, 2209–2223.
- Alcala, F.J. and Custodio, E. Using the ClBr ratio as a tracer to identify the origin of salinity in aquifers in Spain and Portugal. J. Hydrol. 2008, 359, 189–207.
- Katz, B.G.; Eberts, S.M.; and Kauffman, L.J. Using ClBr ratios and other indicators to assess potential impacts of groundwater quality from septic systems: A review and examples from principal aquifers in the United States. J. Hydrol. 2011, 39, 151–166.
- Haluszczak, L.O.; Rose, A.W.; and Kump, L.R. Geochemical evaluation of flowback brine from Marcellus gas wells in Pennsylvania, USA. App. Geochem. 2013, 28, 55–61.
- U.S. Environmental Protection Agency. National Primary Drinking Water Regulations. EPA 816-F-09-004; US EPA: Washington, DC, 2009.
- Crossgrove, J. and Zheng, W. Manganese toxicity upon overexposure. NMR Biomed. 2014, 17, 544–553.
- Aschner, M.; Erikson, K.M.; Herrero Hernandez, E.; and Tjalkens, R. Manganese and its role in Parkinson's disease: From transport to neuropathology. Neuromol. Med. 2009, 11(4), 252–266.
- Wasserman, G.A.; Liu, X.; Parvez, F.; Ahsan, H.; Levy, D.; Factor-Litvak, P.; Kline, J.; van Geen, A.; Slavkovich, V.; Lolacono, N.J.; Cheng, Z.; Zheng, Y.; and Graziano, J.H. Water manganese exposure and children's intellectual function in Araihazar, Bangladesh. Environ. Health Persp. 2006, 114(1), 124–129.
- Khan, K.; Wasserman, G.A.; Liu, X.; Ahmed, E.; Parvez, F.; Slavkovich, V.; Levy, D.; Mey, J.; van Geen, A.; Graziano, J.H.; and Factor-Litvak, P. Manganese exposure from drinking water and children's academic achievement. NeuroToxicology 2012, 33, 91–97.
- PA DEP Little Connoquenessing Creek watershed TMDL Butler County. Technical Report. PA DEP: Harrisburg PA, 2009.
- Oremland, R.S. Biogeochemistry of methanogenic bacteria. In Biology of Anaerobic Microorganisms; Zehnder, A.J.B., Ed. John Wiley and Sons; Hoboken NJ. 1988. 641–690.
- Molofsky, L.J.; Conner, J.A.; Farhat, S.K.; Wylie, A.S. Wagner, T. Methane in Pennsylvania water wells unrelated to Marcellus Shale fracturing. Oil Gas J. 2011, 109, 54–67.
- Molofsky, L.J.; Conner, J.A.; Wylie, A.S.; Wagner, T.; Farhat, S.K. Evaluation of methane sources in groundwater in Northeastern Pennsylvania. Groundwater 2013, 51, 333–349.
- Engelder, T.; Lash, G.G.; Uzcategui, R.S. Joint sets that enhance the production of Middle and Upper Devonian gas shales of the Appalachian Basin. AAPG Bull. 2009. 95, 1399–1422.