Abstract
The study of microbial community in groundwater systems is considered to be essential to improve our understanding of arsenic (As) biogeochemical cycling in aquifers, mainly as it relates to the fate and transport of As. The present study was conducted to determine the microbial community composition and its functional potential using As-contaminated groundwater from part of the Bengal Delta Plain (BDP) in West Bengal, India. Geochemical analyses indicated low to moderate dissolved oxygen (0.42-3.02 mg/L), varying As (2.5-311 µg/L) and Fe (0.19-1.2 mg/L) content, while low concentrations of total organic carbon (TOC), total inorganic carbon (TIC), nitrate, and sulfate were detected. Proteobacteria was the most abundant phylum, while the indiscriminate presence of an array of archaeal phyla, Euryarchaeota, Crenarchaeota, Nanoarchaeota, etc., was noteworthy. The core community members were affiliated to Sideroxydans, Acidovorax, Pseudoxanthomonas, Brevundimonas, etc. However, diversity assessed over multiple seasons indicated a shift from Sideroxydans to Pseudomonas or Brevundimonas dominant community, suggestive of microbial response to seasonally fluctuating geochemical stimuli. Taxonomy-based functional potential showed prospects for As biotransformation, methanogenesis, sulfate respiration, denitrification, etc. Thus, this study strengthened existing reports from this region by capturing the less abundant or difficult-to-culture taxa collectively forming a major fraction of the microbial community.
Acknowledgments
The authors are thankful for the support received from the Department of Geology and Geophysics, and School of Environmental Science and Engineering, IIT Kharagpur, West Bengal, India, for groundwater geochemical parameter estimation. The authors also acknowledge Dr. Avishek Dutta and Dr. Himadri Bose for their assistance during sample collection.
Disclosure statement
No potential conflict of interest was reported by the authors.
Data availability statement
The amplicon sequences corresponding to each sample from this study were deposited under the accession number PRJNA666502 in NCBI as a Sequence read archive (SRA).
Appendix
Figure 1A. Groundwater geochemistry reported for close-by locations during the pre-monsoon period available publicly. Central Ground Water Board acquired data for the year 2017–2018. Figure: Regional (North 24 Parganas) rainfall and groundwater level data. An increase in water level due to groundwater recharge post onset of monsoon was observed in both 2017 and 2018 in the month of July. Green box: Last 10 years average (m bgl), Blue box: Last year (m bgl), Yellow: RF Actual level (mm), Red: Level (m bgl). Table: Groundwater geochemistry of selected sites in the vicinity of current study sites in the North 24 Parganas district, West Bengal, India as reported for pre-monsoon period. PH, pH; EC, Electrical Conductivity (µS/cm); TH, Total Hardness (mg/L); CA, Calcium (mg/L); MG, Magnesium (mg/L); NA, Sodium (mg/L); K, Potassium (mg/L); FE, Iron (mg/L).
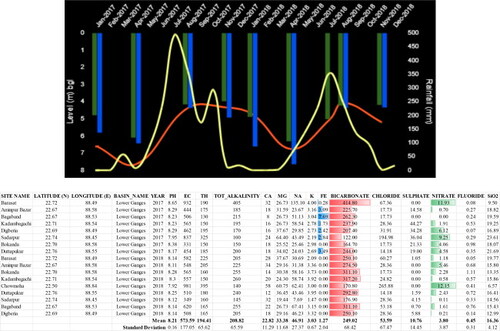
Figure 2A. Microbial community distribution patterns. Non-metric multidimentional scaling ordination plot at the OTU level (taxa with >0.1% abundance considering all samples). The colors (red, arsenic present; cyan, As absent; green, surface water; square, wet period; dot, dry period) indicate the presence or absence of As in the samples.
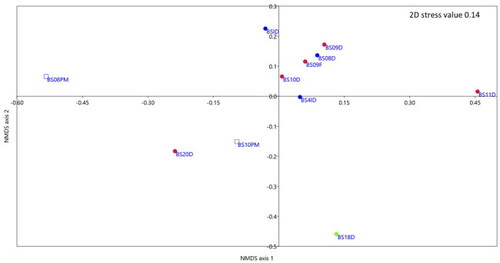
Figure 3Aa. Major taxa present in BS20D in order of abundance, the highest As bearing groundwater sample.
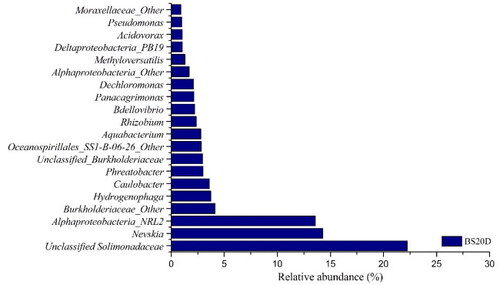
Figure 3Ab. Count of common OTUs shared by As bearing samples.
Figure 3Ac. Extended error bar plot showing microbial taxa with a significant difference in proportion (p value <0.05 and effect size >1) across represented samples. The samples BS10PM, BS08PM, and BS09F are represented by orange color, while BS10D, BS08D, and BS09D are represented by blue color. The left panel indicates the proportion of the feature (taxa) across the two samples. The right panel indicate the p-value at 95% confidence interval for the difference between proportions.
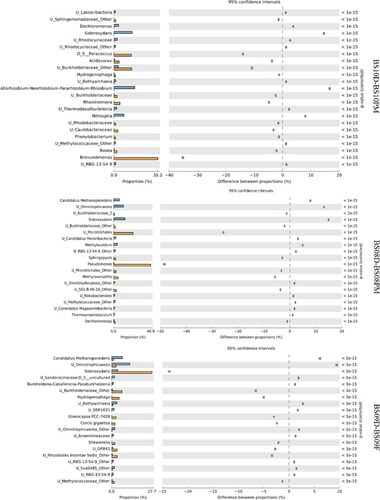
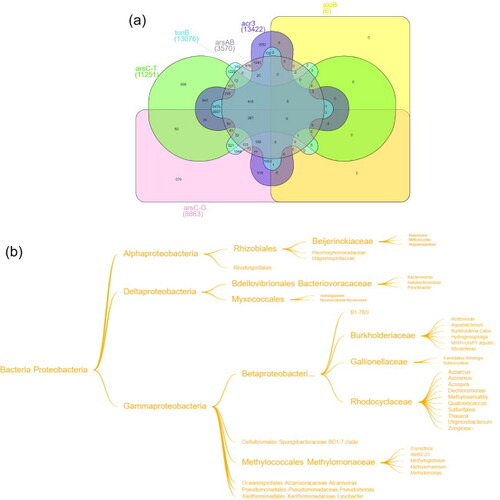
Figure 4A. (a) Count and taxonomic affiliation of the As related genes represented as a VENN diagram, (b) a flow chart of shared taxa (361) mentioned in .