
 ?Mathematical formulae have been encoded as MathML and are displayed in this HTML version using MathJax in order to improve their display. Uncheck the box to turn MathJax off. This feature requires Javascript. Click on a formula to zoom.
Abstract
In this study, a leak detection and repair program was conducted on five pharmaceutical factories in China to analyze the volatile organic compounds (VOCs) emission characteristics of leaking equipment. The results indicated that the monitored components were mainly flanges, accounting for 70.23% of the total, and open-ended lines were the components most prone to leaks. The overall percentage of VOCs emissions reduction after the repair was 20.50%, and flanges were the most repairable components, with an average emission reduction of 47.5 kg/a for each flange. In addition, atmospheric predictions were conducted for the VOCs emissions before and after the repair of the components at the research factories. The atmospheric predictions showed that emissions from equipment and facilities have a noticeable impact on VOCs concentration at boundary and the emissions are positively correlated with the pollution source strength. The hazard quotient of the investigated factories was lower than the acceptable risk level set by the US Environmental Protection Agency (EPA). The quantitative assessment of the lifetime cancer risk showed that the risk levels of factories A, C, and D exceeded the EPA’s acceptable risk level, and the on-site workers were exposed to inhalation cancer risk.
Introduction
Volatile organic compounds (VOCs) are important contributors to regional complex atmospheric pollution. VOCs emissions have become the focus of air pollution prevention and health risk assessment. VOCs are one of the key precursors for the generation of O3 and PM2.5, and contribute significantly to the generation of secondary organic aerosols and photochemical smog.[Citation1,Citation2] Therefore, controlling anthropogenic VOCs emissions plays an important role in protecting people from poor air quality problems. Regarding the potential health risks, epidemiological studies show that exposure to VOCs may cause respiratory irritation and central nervous system damage, and some VOCs components (e.g. 1,3-butadiene, methylene chloride, tetrachloroethylene, and benzene) can cause cancer.[Citation3–6]
Sources of VOCs in the atmosphere include natural and anthropogenic emissions. In urban areas, VOCs mainly originate from human activities.[Citation7,Citation8] Industrial emissions are the most important source of VOCs, accounting for more than 50% of anthropogenic emissions, mainly from the petroleum, chemical, and spray-printing industries.[Citation1,Citation9] Many countries have enacted stringent emission standards, such as the US Clean Air Act Amendments [Citation10] and EU Directive 1999/13/EC,[Citation11] to reduce VOCs emissions.
The pharmaceutical industry is an important branch of the chemical industry and an important source of VOCs emissions. Statistically, the total VOCs emissions from pharmaceutical industries in China were estimated to be approximately 2.58 × 10⁸ kg in 2010 and 4.27 × 10⁸ kg in 2015, revealing an increase of 65.4% over the six years.[Citation12] VOCs originating from the pharmaceutical industry are mainly emitted by chemical pharmaceutical and biopharmaceutical enterprises due to the use of a wide range of organic solvents in the extraction, synthesis, and refining processes.[Citation13] VOCs components originating from different pharmaceutical enterprises differ significantly in terms of their products and manufacturing processes. For example, exhausts from chemical pharmaceutical factories contain a high percentage of isopropyl alcohol, acetone, and ethanol, while fermentation pharmaceutical exhaust contains a high amount of acetone and ethyl acetate, with some other common components being methylene chloride and toluene.[Citation14,Citation15]
Because of cleanliness requirements in the pharmaceutical industry, pharmaceutical enterprises generally have enclosed workshops and gas-collecting equipment where gases from the production line are collected and treated before discharge. However, fugitive emissions are prone to occur at the parts connecting different sections of equipment, such as valves, reaction tanks, pumps, pipelines, and other similar equipment (e.g. centrifugal separators). Pipelines require particular attention as they are responsible for more than 70% of the total fugitive emissions.[Citation16] These leaks lead to increased concentrations of VOCs in the workshop and the surrounding environment, especially in older pharmaceutical factories with aging equipment, lack of maintenance, and high levels of leakage.[Citation17] It has been reported that VOCs concentrations in pharmaceutical workshops can reach up to 33.7 mg/m3, with ethanol and dichloromethane being the most common contaminating components.[Citation18]
Health risks for workers are more vulnerable to suffer from VOCs from fugitive emissions than with exhaust VOCs because they are closer to the ground and are generally emitted indoors. Studies have shown an increased odorous activity index and health risks for VOCs within workshops and interior or boundary regions of pharmaceutical factories.[Citation19] Existing studies have focused on stack exhaust, while fewer studies have been conducted on fugitive VOCs emissions from the pharmaceutical industry, resulting in an incomplete understanding of the overall picture of VOCs emissions in this sector. Research on the characteristics of VOCs in pharmaceutical workshops, the surrounding environment, and their risks to human health remains insufficient.
Leak detection and repair (LDAR) is a general method for controlling VOCs leakage in equipment. By detecting potential leak points of equipment and devices, leaking connections can be detected in time and repaired or replaced, thus reducing emissions. In 1998, the US issued the Pharmaceutical Production Industry: National Emission Standards for Hazardous Air Pollutants [Citation20] guidelines, which explicitly require the use of LDAR for all pipelines and equipment related to hazardous air pollutants (HAPs). China’s Emission Standard of Air Pollutants for Pharmaceutical Industry [Citation21] also recommends LDAR as a crucial step for controlling fugitive VOC emissions. A comparison of the monitoring quantities in the LDAR program of typical industries, including oil refining, coal chemical industry, pesticide industry, and pharmaceutical industry shows that the pharmaceutical industry ranked third, behind the oil refining and coal chemical industry. Therefore, controlling component leakage control in the pharmaceutical industry deserves more attention.[Citation23]
In this study, five pharmaceutical factories implemented the LDAR program in southwest China to analyze the characteristics of fugitive VOCs emissions from leaking equipment and facilities. The AERMOD model was adopted to predict the concentration of VOCs in the factories and at the boundary to assess exposure risks for on-site workers.
Materials and methods
Site description
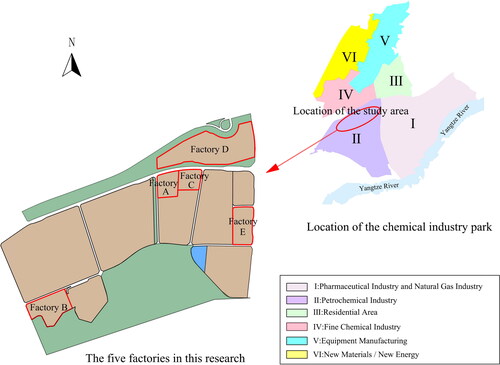
The study area of this project was located in a comprehensive chemical industry park on the banks of the Yangtze River in southwestern China. The industrial park consists of natural gas, pharmaceutical, petrochemical, steel, fine chemical, renewable energy industries, and so forth, which is divided into six zones from I to VI according to functions. Five pharmaceutical factories in Zone II were chosen to implement the LDAR program in this study because they exemplify the classical fugitive VOC emission characteristics of different types and scales of the pharmaceutical industry and provide reliable indications for environmental management and fugitive VOC emission control in the pharmaceutical industry. These factories were named Factory A, Factory B, Factory C, Factory D, and Factory E respectively. Factory D and Factory E have larger scales than the other three factories. Factory A and Factory C are small-scale pharmaceutical factories. Factory B is a medium-scale factory. Factory A is situated beside Factory C, and Factory D is located opposite to Factories A and C. Factory B is positioned southwest of the above three factories, approximately 1500 m away from Factory A. Factory E is approximately 600 m southeast of Factory C. The layout of the industrial park and distribution of the five factories are shown in . All five factories had taken measures to reduce fugitive VOC emissions by sealing hazardous waste storage, sewage treatment stations, raw material storage, and workshops.
Figure 1. Locations of zone II and the five pharmaceutical factories (A, B, C, D, and E).
Data collection
LDAR is an important means of maintaining the routine operation of equipment and facilities, ensuring safe production, and improving product quality. The LDAR application consists of four main steps: component identification, component monitoring, component repair, and recordkeeping.[Citation22,Citation23] LDAR was implemented in these five factories in 2021. The total number of components monitored in factories A, B, C, D, and E was 7,166, 2,954, 1,165, 56,802, and 9,001, respectively, which were identified by considering the process flow diagram (PFD), piping and instrumentation diagram (P&ID), material balance diagram, instruction manual, device layout, instrumentation, and equipment list. Leakage detection was conducted using a portable detection instrument, the phx21 flame ionization detectors (LDARtools, USA), followed by repair and re-detection. The first reading and re-detection readings of each component were recorded with a unique identification number.
QA/QC analysis and uncertainty analysis
At present, the LDAR program uses hydrogen flame ionization detectors to measure the concentration of leakage. Calibration is performed both before and after monitoring to ensure that the instrument readings are within ±2.5% of the standard gas concentration. The response factors differ for different substances. The net detection values of substances do not need to be corrected, when the response factors are less than 3. However, the net detection values of substances need to be corrected, when the response factors are over 3 and less than 10. Due to uncertainty in the operation of the monitoring technicians, this study combines the LDAR monitoring results with the VOCs measurement results for analysis to ensure the reliability of the results.
Data analysis
According to the Standard for Fugitive Emission of Volatile Organic Compound,[Citation21] leak definitions vary by service. The threshold values were 2000 ppm for light liquid leaks and 5000 ppm for heavy liquid and gas leaks, respectively. To estimate the VOCs emissions from equipment leaks, the total emissions were calculated using correlation equations, default zero emission rates, and pegged emission rates in the United States.[Citation23] In China, piecewise functions are widely used to estimate emissions.
(1)
(1)
where, eTOC (kg/h) refers to the VOC emission rate of individual components.SV (μmol/mol) is the screen value measured by the portable detection instrument. e0 (kg/h) denotes the default zero-emission rate of individual components. ep (kg/h) indicates the pegged emission rate of individual components. ef (kg/h) represents the correlation equation of the individual component.
The e0, ep, and ef values for each type of component were provided by the Environmental Protection Agency (EPA) in November 1995. Different emission rates were adopted for the emission calculation. The emission rates for connectors were adopted when the sampling connections worked well, whereas the emission rates for open-ended lines were selected when the sampling bottle was not connected to the sampling port. Meanwhile, combined with the current product ranges and the consumption of raw materials, the substances and amount of equipment leakage could be derived from previous studies based on the reported results of VOCs fugitive emission measurements of each factory.[Citation19,Citation24]
AERMOD model
The AERMOD model was designed by the American Meteorological Society (AMS) and EPA in the 1990s. It encompasses the Gaussian dispersion model and considers the latest planetary boundary layer and dispersion theories to replace and supersede the ISC3 model.[Citation25] It is a steady-state plume model widely used for short-range atmospheric prediction (less than 50 km), incorporating air dispersion, various terrain conditions, and treatment of different sources. The model consists of the AERMET meteorological data preprocessor, AERMAP terrain data preprocessor, BPIP building downwash preprocessor, and AERMOD dispersion model.[Citation26–28] The concentration of pollutants can be expressed using the following formula, where Q refers to the source strength, σz is the dispersion parameter, Hz is the effective source height, and Ue is the average wind speed.[Citation29]
(2)
(2)
BPIP was not considered in this study since the surrounding structures were not applicable for the model usage. Albedo, Bowen ratio, roughness, and meteorological data are the required inputs for AERMET to generate meteorological predictions, while geological data, including coordinates and elevation, are required as inputs for AERMAP. Using all preprocessors, the dispersion model was implemented to finally generate the prediction.[Citation29–31]
Meteorological data, including wind direction, wind speed, total cloud cover, cloud amount, and dry bulb temperature, were acquired for 8,760 h over 365 days in 2021 from the meteorological station in this region, and were used in the simulation. The study also used sounding data from the adjacent station provided by the Laboratory of Evaluation Center of the Ministry of Environment. Meteorological and sounding data are essential for the AERMOD model.
Exposure risk assessment
Inhalation, oral ingestion, and skin contact are the three main routes that lead to pollution exposure in humans. Inhalation is the major pathway for atmospheric VOCs exposure.[Citation24] The EPA has released guidelines for assessing inhalation exposure risks, including noncancer and cancer effects.[Citation32,Citation33] In this study, the hazard quotient (HQ) was adopted in the noncancer risk assessment for chronic exposure, while the lifetime cancer risk (LCR) was selected to assess carcinogenic influences:[Citation34–36]
(3)
(3)
(4)
(4)
where, ci refers to the concentration (mg/m3) of substance i in air. ET and EF denote an exposure time of 8 h/day and an exposure frequency of 250 days/year, respectively. ED, AT, and LE represent an exposure duration of 20 years, an averaging time of 70 years,[Citation37] and a life expectancy of 77.4 years [Citation38] respectively.
RfCi and IUR are the inhalation reference concentration (mg/m3) and inhalation unit risk (μg/m3) of substance i, respectively, which were obtained from EPA and other studies,[Citation19,Citation39] as shown in supplementary information.
Results and discussions
Monitoring results of LDAR
In this study, a thousand to more than 50,000 equipment components were monitored at each of the five factories, totaling 77,088 components monitored by the LDAR program. A total of 156 leaks were detected, resulting in a leak rate of 0.2%. The total fugitive emissions of VOCs from equipment and facilities of the five factories were 31,878.54 kg before repair. Applying the equipment and facilities modifications reduced the fugitive emissions of VOCs by approximately 6,536.27 kg, a 20.5% reduction. The monitoring results are summarized in and .
Characteristics of VOCs fugitive emissions from monitored components
Based on the data generated by the LDAR and the operating conditions of each factory, the characteristics of leaking components in the pharmaceutical industry were identified.
Characteristics of fugitive emissions from leaks in different factories
On average, 15,418 components were monitored in each factory. The number of components monitored per factory ranged from 1,165 at factory C to 56,802 at factory D. The number of components monitored in each factory depended on the products, solvents, scale, equipment, and facilities of the factory. Factory E had the highest leak rate of 0.63% (), 2.15 times higher than the average leak rate. The result indicated that factory E is the most leak-prone factory, which is related to the operating time for each unit, raw and auxiliary materials, quality of equipment and facilities and other factors.[Citation40]
Figure 2. Average emissions and leak rate of a) individual components in each factory b) different types of components.
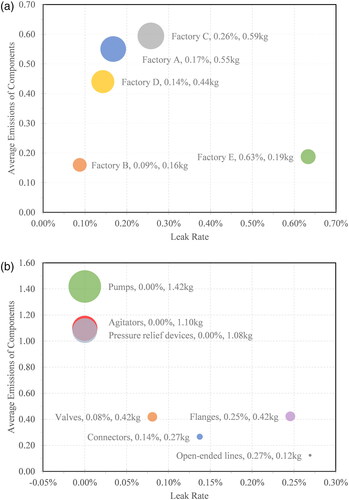
and ) present the fugitive emissions of VOCs from equipment and facilities before and after the implementation of the LDAR program in each factory. Factory C reduced fugitive emissions of VOCs by 22.87 kg (a 3.3% reduction) by implementing the LDAR program. Factory D reduced 6,220.57 kg (a 24.88% reduction), which was a greater than average reduction and approximately 272 times the reduction of Factory C. This far greater reduction may be a consequence of a disparity in the number of components monitored in different factories. Factories with fewer monitored components had fewer detected leaks and lower emission reduction from modifications of equipment and facilities compared to larger factories with higher numbers of detected leaks. Further, Factory C, as a small-scale pharmaceutical industry, had the largest emissions per individual component, with 0.59 kg/pc before repair and 0.57 kg/pc after repair ( and ). The average emissions of the same component vary from factory to factory (). In terms of pumps, Factory E had smaller average emissions from individual pumps, while both Factory A and Factory D had higher emissions from individual pumps. A possible explanation is that Factory A, small-scale industry, had more problems with management and maintenance, and Factory D, a large-scale industry, had more complex and numerous production lines, making it more difficult to manage. To some extent, this reflects the situation in small-scale pharmaceutical factories, which often have poor management and maintenance capabilities that lead to a greater risk of leaks.
Figure 3. Average emissions per component in the factories.
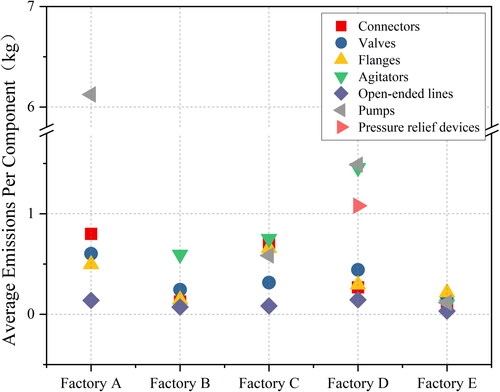
Table 1. Average and reduction emissions (kg/pc) for each component before and after leak detection and repair (LDAR).
The five factories included in this study mainly produced active pharmaceutical ingredients (APIs), which involved a large number of organic solvents in raw and auxiliary materials. According to LDAR monitoring and analysis of the use of raw and auxiliary materials and technological processes in each factory, light liquids were the most commonly used organic solvents, and the most frequently used organic solvents were acetone, methanol, and ethanol, followed by methylene chloride, toluene, triethylamine, ethyl acetate, hexane, trichloromethane, formic acid, tetrahydrofuran, acetonitrile, acetic anhydride, pyridine, and isopropanol. According to a related study, all of the detected organics mentioned above could contribute to VOCs pollution in the area.[Citation24]
Characteristics of fugitive emissions from different components
Flanges were the most common components, accounting for 70.23% of all monitored components and a large portion of LDAR monitoring work. Flanges accounted for 85% of total leaks, a significant excess due to the large quantities of monitored flanges and their leak rate of 0.25%, which was 1.34 times higher than the average leak rate. Although open-ended lines contributed only 1.02% of the total leaks, they had the highest leak rate, namely 0.27% (). A possible explanation for this might be that flanges had the highest number of leaks due to the large quantities of monitored pieces; however, open-ended lines were the most leak-prone component. This finding was consistent with that of another study[Citation23] that reported that flanges were commonly used in pharmaceutical factories, accounting for 56.31% of total components and the leak rate of flanges was 0.92%. Open-ended lines only accounted for 2.97% of total components but had the greatest leak rate of 5%.
After monitoring, the repair of a single flange reduced emissions by 47.5 kg, which was the largest emission reduction among all types of components. The repair of open-ended lines achieved the least reduction, of 3.1 kg per piece. Leaks were not identified in three types of components: agitator (shaft seal), pump (shaft seal), and pressure relief equipment. Therefore, these components were not repaired, as shown in ). Flanges were the most repaired components. Despite the differences in the effectiveness of leak repair in different components, they all had good repairability and satisfied the production requirements. Flange leaks mainly because of the loosening of bolts and nuts, wearing of gaskets, or seal failures, which can be solved by tightening the bolts and nuts, replacing gaskets, or re-winding thread seal tape. Valve leakage generally refers to the leakage between the valve stem and gland packing, which can usually be eliminated by properly torquing the nut on the gland or gland bolt.[Citation41–43] The main reason for the leakage of open-ended lines is the loose valve end, which can be solved by installing additional valves, blind plates, or pipe plugs, based on the conditions of the valve end or pipeline. A single component emitted 0.32 kg per year after the modification of the equipment and facilities, and a single pump had the highest emission of 1.42 kg per year. Pump leakage is generally due to seal failure and seal face separation, and sometimes results from lower spring pressure or insufficient fluid pressure. Such faults can be repaired by replacing the seal and static and dynamic O-rings and increasing the pressure ratio.
Characteristics of fugitive emissions in pharmaceutical industry
In this study, fugitive emission data were collected from each of the five factories before LDAR implementation, and the ratio of fugitive emissions from monitored components to total fugitive emissions of VOCs was evaluated based on the characteristics of fugitive emissions, as shown in . Fugitive emissions from monitored components accounted for 22.05% of total fugitive emissions before LDAR implementation and 20.24% after the LDAR program, resulting in with a 1.81% reduction. This result indicated that emissions from equipment and facilities constituted a significant portion of total fugitive emissions, and need to be further reduced.
Figure 4. Percentage contribution to the total fugitive emission of volatile organic compounds (VOCs) from the equipment and facilities emissions. (LDAR, leak detection and repair).
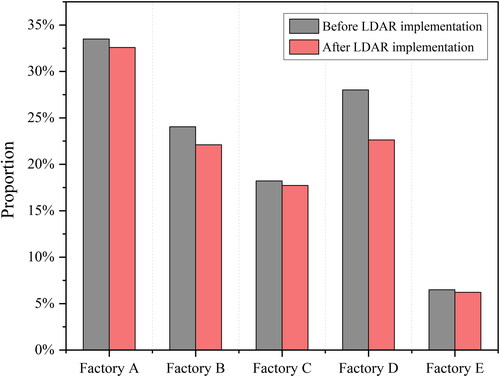
This result may be attributable to the high thresholds for leak definition used in the standards in China, as well as long monitoring intervals. U.S. National Emission Standards for Hazardous Air Pollutants (NESHAP) uses a leak definition of 500 ppm or 1000 ppm,[Citation44] and China uses a leak definition of 2000 ppm or 5000 ppm.[Citation21] Components that did not exceed the threshold value for leakage still emitted VOCs and were not repaired, making them significant contributors to the total fugitive emissions of VOCs. At present, pumps, valves, open-ended lines, pressure relief devices, and agitators must be monitored twice a year and flanges and connectors once a year in China. In the U.S., flanges and valves must be monitored every 3 months and pumps every month according to NESHAP.[Citation22] Shorter monitoring intervals facilitate timely detection and repair of leaks, and also reduce fugitive emissions from equipment and facilities. Factory D had the highest emission reduction of 5.39% and Factory E had the lowest, with a 0.28% reduction of emissions. This result further emphasizes the importance of selecting equipment, consuming solvents, and maintenance and management in each factory.
Atmospheric diffusion simulation
Diffusion simulated results
The diffusion concentration of fugitive VOCs emissions caused by leakage from components was simulated, and the simulation results were used to assess the human health impacts of pollutants on plant employees in the enterprises. All studied factories had taken corresponding collection and treatment measures for fugitive emission sources, such as covering the wastewater treatment station, enclosing hazardous waste storage, and collecting and treating fugitive emissions during the dosing process in the sealing workshop. However, there are limitations to the practical application of these measures. For instance, VOCs leakage from equipment and facilities is difficult to control or eliminate in a timely and effective manner due to the lack of necessary environmental management measures within the enterprise. The AERMOD model was used for the simulation of the atmospheric impact of VOCs leakage in this study.
The maximum ground-level concentration for the interior region and the maximum short-term concentration for the boundary of the five factories were simulated (). The results show that all simulated results for the study area comply with China’s national and local standards. Factory D had the highest simulated VOCs values, with the maximum ground-level grid concentration reaching 4.53% of the limit and the maximum short-term simulated result at the factory boundary reaching 20.67% of the limit.
Table 2. Simulated emissions before and after repair in the five factories and the limited value for fugitive emissions of volatile organic compounds (VOCs) from China’s national standards.
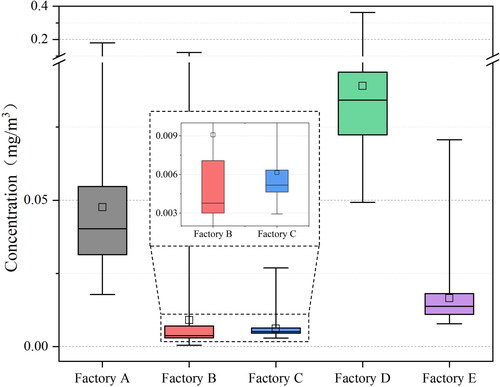
The hourly concentration contours of VOCs at all grids before and after LDAR implementation in each plant, considering topographic effects, are shown in and . The maximum ground-level grid concentration shows a decrease at different levels, with reduction rates ranging from 3.24% to 28.88%. Simulated concentrations among grids are quite different due to the uneven distribution of facilities within factories and the different quantities and emission loads of facilities in each grid. Factory D had the largest scale, greatest number of product lines, greatest consumption of organic solvents, and greatest quantities of components; hence it has the largest potential emission. shows that Factory D has the highest average grid concentration and maximum ground-level grid concentration. The figure indicates that the simulated diffuse concentration at factories is positively correlated with the pollution source strength.
Figure 5. Hourly concentration distribution of volatile organic compounds (VOCs) before leak detection and repair (LDAR) implementation.
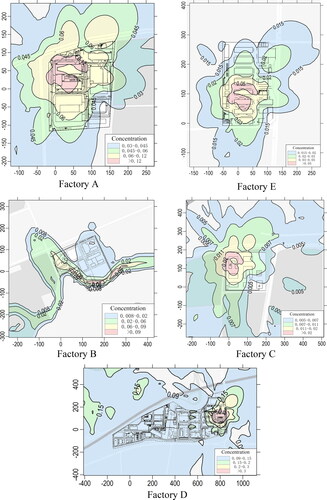
Figure 6. Hourly concentration distribution of volatile organic compounds (VOCs) after leak detection and repair (LDAR) implementation.
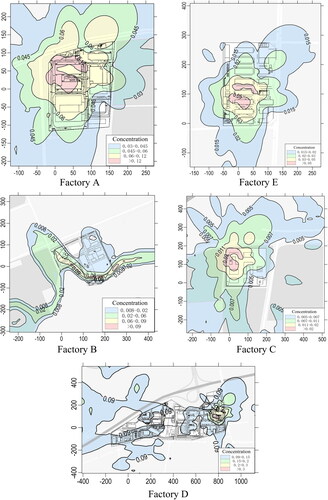
Figure 7. Predicted grid concentration of volatile organic compounds (VOCs) in the five factories.
Factory E had a larger emission after LDAR implementation than Factory B, while its simulated concentration at the boundary was lower. This indicates that the concentration at the boundary is also influenced by the workshop layout, terrain, and weather in the region. According to the distribution of VOCs within factories ( and ), air pollution from component leakage is concentrated within the factory, which may cause adverse effects on workers’ health.
Comparison between simulated and monitored VOCs concentration
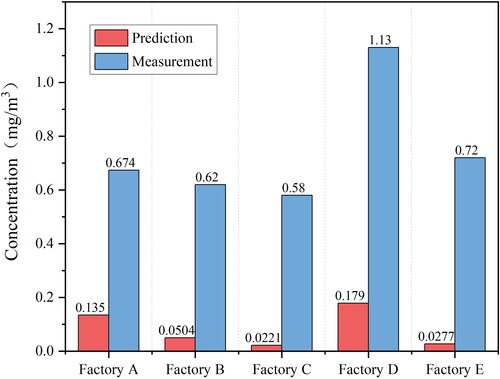
Field monitoring data of VOCs concentrations at factory boundaries were collected in this study after the implementation of the LDAR program and compared with the simulated concentration caused by component leakage, as shown in . The average contribution of VOCs concentration from five factories is 10.33%. Factory A had the largest contribution (20.03%), indicating that the VOCs leakage from components of Factory A had an impact on the surrounding atmospheric environment, which should not be ignored. The VOCs concentration at Factory E boundary was 0.72 mg/m3 according to monitoring, whereas the corresponding maximum simulated concentration was only 0.0277 mg/m3, which suggests that leakage only slightly affects the VOCs concentration at the Factory E boundary. Apart from the influencing factors of layout and meteorological parameters, the concentrations measured at the boundary may be affected by organized emissions or emissions from nearby factories, which may lead to a much higher concentration than the concentration influenced by fugitive emissions from the factory. Taking influences from nearby factories into consideration, the average contribution of leakage to the boundary concentration in this study is likely to be higher than 10.33%. Fugitive VOCs emissions from factory components have a noticeable impact on the surrounding atmospheric environment.
Figure 8. Maximum predicted concentration and measured concentration at the factory boundary.
Exposure risk assessment
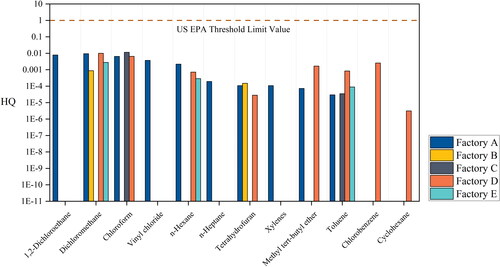
Twelve of the VOCs detected from five research factories by LDAR belong to the toxic and hazardous air pollutants announced by the EPA, including 1,2-dichloroethane, methylene chloride, trichloromethane, chlorobenzene, tetrahydrofuran, and n-hexane. Four of these substances, including 1,2-dichloroethane, methylene chloride, trichloromethane, and vinyl chloride, are carcinogenic substances. shows the hazard degree of fugitive VOCs emissions after the implementation of LDAR in five factories. A hazard quotient higher than one indicates a chronic health risk. Factory A had the highest accumulative HQ of hazardous VOCs, with a value of 3.02E-02. The highest HQ of a single substance occurred at Factory C, namely for trichloromethane with a value of 1.15E-02. These 12 toxic and hazardous components showed different spatial distribution characteristics but had similar source characteristics among the research factories. The HQ values of all five factories were lower than the EPA (US EPA, 2009) acceptable risk level (HQ <1), indicating that on-site staff were unlikely to suffer from non-carcinogenic chronic health risks due to the inhalation of the above substances.
Figure 9. Chronic health risks of volatile organic compounds (VOCs) through inhalation for on-site workers in the five factories (HQ, hazard quotient).
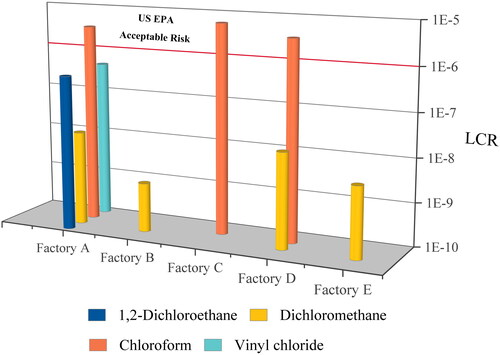
shows the lifetime cancer risk from leaking VOCs in each factory. The maximum LCR of the four selected VOCs appeared in Factory C, reaching 6.67E-06. There were significant differences between the LCR values of different VOCs constituents. The LCR values of three factories, which were 4.71E-06 for trichloromethane in Factory A, 6.66E-06 for trichloromethane in Factory C, and 1.29E-06 for methylene chloride in Factory D, exceeded the acceptable risk level (LCR <1 × 10⁻⁶) introduced by the EPA.[Citation35,Citation45] The results show that on-site staff at Factories A, C, and D had a relatively high inhalation cancer risk. Fugitive VOCs emissions from component leakage pose a carcinogenic risk to employees. Based on the results of the study, the pharmaceutical industry can choose trichloromethane and methylene chloride as the primary focus for controlling human health risks caused by VOC emissions.
Figure 10. Lifetime cancer risks of volatile organic compounds (VOCs) through inhalation for on-site workers in the five factories (LCR, lifetime cancer risk).
There was some uncertainty regarding the health value in this study, considering that LDAR was conducted for only a few days, while the LCR was calculated for a continuous carcinogenic effect of 77.4 years of life, and LCR could have deviations in this case. Thus, the results could not completely describe the degree of harm caused by VOCs emissions from the pharmaceutical industry to human health. To reflect the exposure risk more accurately, more VOCs emission monitoring should be conducted, and risk assessment should be carried out by combining atmospheric dispersion models and local population information.[Citation46] In addition, there were some differences in the RfC and IUR values published by various regulatory authorities (e.g. USEPA and OEHHA), and these differences further increased the uncertainty in the risk assessment process. It is suggested that the Chinese government should formulate unified standards such as RfC and IUR to assess health risks.
Conclusion
Characteristics of VOCs leakage from equipment and facilities were studied at five pharmaceutical factories. Atmospheric diffusion was simulated and exposure risk was assessed. Flanges were the most numerous components and had the largest average emission reduction following the implementation of the LDAR program. Open-ended lines were the most prone to leakage, while pumps had the largest average emissions. The study found that the average emission reduction per component accounted for the removal of only a small proportion of the total leakage emission load, which can be attributed to the high threshold value for repair specified by the relevant Chinese standard. The LCR values for chloroform in Factory A and Factory C and LCR for dichloromethane in Factory D exceeded the acceptable risk level specified by the US EPA, indicating potential carcinogenic risks in these three factories. Pharmaceutical factories can regard chloroform and dichloromethane as key substances for control to reduce health risks. In general, the implementation of LDAR can reduce fugitive VOCs emissions, cut down material loss, improve product yields and economic benefits, and lower the pollution exposure risk of field workers in pharmaceutical factories. China should decrease the threshold value that defines a leaking component and gradually improve the VOCs leakage control standard. As a new pollution control measure in China, LDAR technology is worth popularizing in the pharmaceutical industry because of the environmental and economic benefits it can bring.
Author contributions
Fang Zhao: Conceptualization, Methodology, Investigation, Writing – original draft, Visualization. Yao Peng: Writing – review & editing, Project administration. Lin Huang: Writing – original draft, Visualization, Investigation. Ziwei Li: Writing – original draft, Visualization. Weinan Tu: Writing – original draft. Biao Wu: Supervision.
Acknowledgements
We appreciate the support from the five pharmaceutical enterprises in this research.
Disclosure statement
The authors declare no conflict of interest.
Data availability statements
The data that support the findings of this study are available from Key Laboratory for Urban Atmospheric Environment Integrated Observation & Pollution Prevention and Control of Chongqing but restrictions apply to the availability of these data, which were used under license for the current study, and so are not publicly available. Data are however available from the authors upon reasonable request and with permission of Key Laboratory for Urban Atmospheric Environment Integrated Observation & Pollution Prevention and Control of Chongqing.
Additional information
Funding
References
- Kansal, A. Sources and Reactivity of NMHCs and VOCs in the Atmosphere: A Review. J. Hazard Mater. 2009, 166, 17–26. DOI: 10.1016/j.jhazmat.2008.11.048.
- Koppmann, R. Volatile Organic Compounds in the Atmosphere; Blackwell: Oxford, UK, 2007.
- Durmusoglu, E.; Taspinar, F.; Karademir, A. Health Risk Assessment of BTEX Emissions in the Landfill Environment. J. Hazard Mater. 2010, 176, 870–877. DOI: 10.1016/j.jhazmat.2009.11.117.
- Schmidt, K.; Podmore, I. Current Challenges in Volatile Organic Compounds Analysis as Potential Biomarkers of Cancer. J. Biomarkers 2015, 2015, 1–16. DOI: 10.1155/2015/981458.
- Song, S. K.; Shon, Z. H.; Kang, Y. H.; Kim, K. H.; Han, S. B.; Kang, M.; Bang, J. H.; Oh, I. Source Apportionment of VOCs and Their Impact on Air Quality and Health in the Megacity of Seoul. Environ. Pollut. 2019, 247, 763–774. DOI: 10.1016/j.envpol.2019.01.102.
- Soni, V.; Singh, P.; Shree, V.; Goel, V. Effects of VOCs on Human Health. In Air Pollution and Control, Energy, Environment, and Sustainability; Springer Singapore: Singapore, 2018; pp 119–142.
- Lu, S.; Bai, Y.; Zhang, G.; Li, T. Source Apportionment of Anthropogenic Emissions of Volatile Organic Compounds. Acta Sci. Circumst. 2006, 26, 757–763.
- Feng, X.; Peng, K.; Ling, Z.; Zheng, J.; Guo, H. Source Apportionments and Characteristics of VOCs from 2005 to 2010 in Hong Kong. Acta Sci. Circumst. 2013, 33, 173–180.
- Jia, C.; Batterman, S.; Godwin, C. VOCs in Industrial, Urban and Suburban Neighborhoods, Part 1: Indoor and Outdoor Concentrations, Variation, and Risk Drivers. Atmos. Environ. 2008, 42, 2083–2100. DOI: 10.1016/j.atmosenv.2007.11.055.
- US. Clean Air Act Amendments of 1990: Conference report to accompany S. 1630. 1990.
- The Council of the European Union. Council Directive 1999/13/EC of 11 March 1999 on the Limitation of Emissions of Volatile Organic Compounds Due to the Use of Organic Solvents in Certain Activities and Installations. Council Directive 1999/13/EC, 1999.
- Liang, X.; Chen, X.; Zhang, J.; Shi, T.; Sun, X.; Fan, L.; Wang, L.; Ye, D. Reactivity-Based Industrial Volatile Organic Compounds Emission Inventory and Its Implications for Ozone Control Strategies in China. Atmos. Environ. 2017, 162, 115–126. DOI: 10.1016/j.atmosenv.2017.04.036.
- Boltic, Z.; Ruzic, N.; Jovanovic, M.; Savic, M.; Jovanovic, J.; Petrovic, S. Cleaner Production Aspects of Tablet Coating Process in Pharmaceutical Industry: Problem of VOCs Emission. J. Clean. Prod. 2013, 44, 123–132. DOI: 10.1016/j.jclepro.2013.01.004.
- Balasubramanian, P.; Philip, L.; Murty Bhallamudi, S. Biotrickling Filtration of VOC Emissions from Pharmaceutical Industries. Chem. Eng. J. 2012, 209, 102–112. DOI: 10.1016/j.cej.2012.04.020.
- Gui, C.; Li, G.; Zhu, R.; Lei, Z.; Dong, Y. Capturing VOCs in the Pharmaceutical Industry with Ionic Liquids. Chem. Eng. Sci. 2022, 252, 117504. DOI: 10.1016/j.ces.2022.117504.
- Li, Y.; Chen, Y.; Zhang, G.; An, J. Study on Typical Cases of Equipment Leak Detection and Repair Project in Chemical Industry. Shanghai Chem. Ind. 2017, 42, 22–25.
- Yang, W.; Li, W.; Liu, B. Odour Prediction Model Using Odour Activity Value from Pharmaceutical Industry. Austrian Contrib. to Vet. Epidemiol. 2015, 8, 51–60.
- Cheng, N.; Jing, D.; Zhang, C.; Chen, Z.; Li, W.; Li, S.; Wang, Q. Process-Based VOCs Source Profiles and Contributions to Ozone Formation and Carcinogenic Risk in a Typical Chemical Synthesis Pharmaceutical Industry in China. Sci. Total Environ. 2021, 752, 141899. DOI: 10.1016/j.scitotenv.2020.141899.
- Lin, Q.; Gao, Z.; Zhu, W.; Chen, J.; An, T. Underestimated Contribution of Fugitive Emission to VOCs in Pharmaceutical Industry Based on Pollution Characteristics, Odorous Activity and Health Risk Assessment. J. Environ. Sci. 2023, 126, 722–733. DOI: 10.1016/j.jes.2022.03.005.
- Us, EPA. Pharmaceutical Production Industry: National Emission Standards for Hazardous Air Pollutants. 1998, 63.
- Ministry of Ecology and Environment of the People’s Republic of China. Standard for fugitive emission of volatile organic compounds. 2019.
- EPA. Leak Detection and Repair: A Best Practices Guide. In Pollution Control Handbook for Oil and Gas Engineering. 2016. https://www.epa.gov/sites/default/files/2014-02/documents/ldarguide.pdf.
- Zhang, G.; Fei, B.; Xiu, G. Characteristics of Volatile Organic Compound Leaks from Equipment Components: A Study of the Pharmaceutical Industry in China. Sustain 2021, 13, 1–14.
- Li, L.; Zhang, D.; Hu, W.; Xu, Q.; Wu, H.; Yuan, R.; Pu, X.; Hao, Y.; Tang, Z.; Lai, M. Atmospheric VOCs Pollution Characteristics and Health Risk Assessment of Large-Scale Integrated Industrial Area and Surrounding Areas in Southwest China. Environ. Sci. 2022, 43, 102–112.
- Ma, J.; Yi, H.; Tang, X.; Zhang, Y.; Xiang, Y.; Pu, L. Application of AERMOD on near Future Air Quality Simulation under the Latest National Emission Control Policy of China: A Case Study on an Industrial City. J Environ Sci (China) 2013, 25, 1608–1617. DOI: 10.1016/s1001-0742(12)60245-9.
- U.S. Environmental Protection Agency. AERMOD Implementation Guide. EPA-454/B-21-006 2021.
- Tartakovsky, D.; Stern, E.; Broday, D. M. Comparison of Dry Deposition Estimates of AERMOD and CALPUFF from Area Sources in Flat Terrain. Atmos. Environ. 2016, 142, 430–432. DOI: 10.1016/j.atmosenv.2016.08.035.
- Xu, G.; Tong, J.; Mo, X.; Pan, F.; Xie, N. Effect of Different Precision Terrain Data on Atmospheric Prediction under Different Terrain Conditions. Southwest China J. Agric. Sci. 2018, 3, 1288–1292.
- Pandey, G.; Sharan, M. Accountability of Wind Variability in AERMOD for Computing Concentrations in Low Wind Conditions. Atmos. Environ 2018, 2019, 105–116.
- Haq, A.; Ul Nadeem, Q.; Farooq, A.; Irfan, N.; Ahmad, M.; Ali, M. R. Assessment of AERMOD Modeling System for Application in Complex Terrain in Pakistan. Atmos. Pollut. Res 2019, 10, 1492–1497. DOI: 10.1016/j.apr.2019.04.006.
- Guo, B.; Jiang, J. Research of Planning Atmospheric Environmental Impact Prediction Based on AERMOD Model, 2014.
- Zhang, L.; Yang, Q.; Wang, H.; Gu, Q.; Zhang, Y. Genetic Interpretation and Health Risk Assessment of Arsenic in Hetao Plain of Inner Mongolia, China. Environ. Res. 2022, 208, 112680. DOI: 10.1016/j.envres.2022.112680.
- Jiang, L.; Li, Y.; Cai, Y.; Liu, K.; Liu, C.; Zhang, J. Probabilistic Health Risk Assessment and Monetization Based on Benzene Series Exposure in Newly Renovated Teaching Buildings. Environ. Int. 2022, 163, 107194. DOI: 10.1016/j.envint.2022.107194.
- Zhao, C.; Zhang, X.; Fang, X.; Zhang, N.; Xu, X.; Li, L.; Liu, Y.; Su, X.; Xia, Y. Characterization of Drinking Groundwater Quality in Rural Areas of Inner Mongolia and Assessment of Human Health Risks. Ecotoxicol. Environ. Saf. 2022, 234, 113360. DOI: 10.1016/j.ecoenv.2022.113360.
- US EPA. Risk Assessment Guidance for Superfund Volume I: Human Health Evaluation Manual (Part F, Supplemental Guidance for Inhalation Risk Assessment), 2009.
- Tohid, L.; Sabeti, Z.; Sarbakhsh, P.; Zoroufchi Benis, K.; Shakerkhatibi, M.; Rasoulzadeh, Y.; Rahimian, R.; Darvishali, S. Spatiotemporal Variation, Ozone Formation Potential and Health Risk Assessment of Ambient Air VOCs in an Industrialized City in Iran. Atmos. Pollut. Res 2019, 10, 556–563. DOI: 10.1016/j.apr.2018.10.007.
- Jia, H.; Gao, S.; Duan, Y.; Fu, Q.; Che, X.; Xu, H.; Wang, Z.; Cheng, J. Investigation of Health Risk Assessment and Odor Pollution of Volatile Organic Compounds from Industrial Activities in the Yangtze River Delta Region, China. Ecotoxicol. Environ. Saf. 2021, 208, 111474. DOI: 10.1016/j.ecoenv.2020.111474.
- World Health Organization. World Health Statistics 2022. 2022.
- Li, C.; Li, Q.; Tong, D.; Wang, Q.; Wu, M.; Sun, B.; Su, G.; Tan, L. Environmental Impact and Health Risk Assessment of Volatile Organic Compound Emissions during Different Seasons in Beijing. J. Environ. Sci. (China) 2020, 93, 1–12. DOI: 10.1016/j.jes.2019.11.006.
- Zhang, G.; Fei, B.; Xiu, G. Application Research of Leak Detection and Repair(LDAR) Technology in Paint Manufacturing Industry. Paint Coatings Ind. 2020, 50, 63–68.
- Ezekoye, L. I.; Densmore, W. E.; Turkowski, W. M.; Becse, R. E. In Managing Check Valve Flange Leaks: Technical Solutions and Challenges to Overcome, Toronto, Ontario, Canada, 2012. DOI: 10.1115/PVP2012-78780.
- Madl, A. K.; Devlin, K. D.; Perez, A. L.; Hollins, D. M.; Cowan, D. M.; Scott, P. K.; White, K.; Cheng, T. J.; Henshaw, J. L. Airborne Asbestos Exposures Associated with Gasket and Packing Replacement: A Simulation Study of Flange and Valve Repair Work and an Assessment of Exposure Variables. Regul. Toxicol. Pharmacol. 2015, 71, 35–51. DOI: 10.1016/j.yrtph.2014.10.017.
- Aweimer, A. S. O.; Bouzid, A. H. Evaluation of Interfacial and Permeation Leaks in Gaskets and Compression Packing. J. Nucl. Eng. Radiat. Sci. 2019, 5(1), 011013–011019.
- Epperson, D.; Lev-On, M.; Taback, H.; Siegell, J.; Ritter, K. Equivalent Leak Definitions for Smart LDAR (Leak Detection and Repair) When Using Optical Imaging Technology. J. Air Waste Manag. Assoc. 2007, 57, 1050–1060. DOI: 10.3155/1047-3289.57.9.1050.
- Xiong, Y.; Bari, M. A.; Xing, Z.; Du, K. Ambient Volatile Organic Compounds (VOCs) in Two Coastal Cities in Western Canada: Spatiotemporal Variation, Source Apportionment, and Health Risk Assessment. Sci. Total Environ. 2020, 706, 135970. DOI: 10.1016/j.scitotenv.2019.135970.
- Pan, Y.; Liu, Q.; Liu, F. F.; Qian, G. R.; Xu, Z. P. Regional Assessment of Ambient Volatile Organic Compounds from Biopharmaceutical R&D Complex. Sci. Total Environ. 2011, 409, 4289–4296. DOI: 10.1016/j.scitotenv.2011.07.014.
Appendix
Table A1. Longitude and latitude of the five factories.
Table A2. Number of monitored components and leaks
Table A3. Emissions (kg) before and after leak detection and repair (LDAR) implementation
Table A4. Non-cancer reference concentrations and inhalation unit reference for carcinogenic volatile organic compounds (VOCs)
Table A5. Hazard quotient values for fugitive emissions of volatile organic compounds (VOCs) from equipment and facilities in five factories
Table A6. Lifetime cancer risk values for fugitive emissions of volatile organic compounds (VOCs) from equipment and facilities in the five factories.
Table A7. Main products, solvents, scale and disposal techniques in the five factories.