
ABSTRACT
A quantitative weight of evidence (QWoE) methodology was developed and used to assess many higher-tier studies on the effects of three neonicotinoid insecticides: clothianidin (CTD), imidacloprid (IMI), and thiamethoxam (TMX) on honeybees. A general problem formulation, a conceptual model for exposures of honeybees, and an analysis plan were developed. A QWoE methodology was used to characterize the quality of the available studies from the literature and unpublished reports of studies conducted by or for the registrants. These higher-tier studies focused on the exposures of honeybees to neonicotinoids via several matrices as measured in the field as well as the effects in experimentally controlled field studies. Reports provided by Bayer Crop Protection and Syngenta Crop Protection and papers from the open literature were assessed in detail, using predefined criteria for quality and relevance to develop scores (on a relative scale of 0–4) to separate the higher-quality from lower-quality studies and those relevant from less-relevant results. The scores from the QWoEs were summarized graphically to illustrate the overall quality of the studies and their relevance. Through mean and standard errors, this method provided graphical and numerical indications of the quality and relevance of the responses observed in the studies and the uncertainty associated with these two metrics. All analyses were conducted transparently and the derivations of the scores were fully documented. The results of these analyses are presented in three companion papers and the QWoE analyses for each insecticide are presented in detailed supplemental information (SI) in these papers.
Introduction and problem formulation
There has been considerable concern expressed by the public and regulators about the potential adverse effects of neonicotinoids on bees and other pollinators. Neonicotinoids are used as insecticides and would be expected to be toxic to insects, including honeybees. Neonicotinoid insecticides are commonly used as seed treatments (Cresswell Citation2011) and the focus of these assessments was on the risks and potential effects on honeybees.
Neonicotinoids are systemic and, as such, they can be translocated from the roots to the upper parts of the plant where the exposure of honeybees and other pollinators might occur through nectar, pollen, guttation water, plant materials, etc. (Fairbrother et al. Citation2014). A historically important pathway of exposure to neonicotinoids is from the dust released from the seed coatings during the pneumatic drilling of seeds (Forster Citation2008). This is a source of direct contamination of bees, pollen, and surfaces of plants, which can result in the localized mortality of honeybees and might, in some cases, still be an issue, as suggested by Long and Krupke (Citation2016). The importance of this source of exposure has been reduced through changes in regulations, the introduction of better coating technology for seeds, better lubricants to reduce abrasion of the coating on the seed, better seeding procedures (Nuyttens et al. Citation2013), and equipment such as deflectors, which can reduce the levels of airborne dust by 90–99% (Vrbka et al. Citation2014).
Many review papers have been devoted to the topic of neonicotinoids and their potential effects in pollinators (Alkassab and Kirchner Citation2017; Blacquière et al. Citation2012; Cresswell Citation2011; Cresswell et al. Citation2014; Cutler, Scott-Dupree, and Drexler Citation2013; Decourtye and Devillers Citation2010; Fairbrother et al. Citation2014; Godfray et al. Citation2015; Krupke et al. Citation2012; Krupke and Long Citation2015; Mommaerts et al. Citation2010; Sánchez-Bayo Citation2014; Staveley et al. Citation2014; Van Der Sluijs et al. Citation2013). This quantitative weight of evidence (QWoE) analysis did not recapitulate these reviews, but focused on higher-tier studies addressing exposures to and effects on honeybees of neonicotinoids used as seed treatments. These effects were measured under more realistic semi-field and field conditions. In some crops, neonicotinoids are sprayed directly onto the crop. This use would be expected to result in greater exposures than with treatment of seeds; however, foliar sprays of these three neonicotinoids (and most other insecticides) are limited to times when honeybees are not present. These foliar uses were not included in the analyses presented in the companion papers.
Mode of action of neonicotinoids and adverse outcome pathways
Neonicotinoid insecticides bind to the insect nicotinic acetylcholine receptor (nAChR) and act as agonists (Jeschke et al. Citation2011; Nauen and Bretschneider Citation2002). The nAChR is in the central nervous system and is believed to consist of a pentamer of two identical alpha-subunits and three beta-subunits, which together comprise a transmembrane protein with a central cation-permeable ion channel found in postsynaptic membranes.
For the purposes of methodology of QWoE analysis, the most appropriate toxicity values for characterizing hazard and risks were for exposures via oral ingestion with food, i.e., pollen, nectar, and guttation fluid. Contact toxicity of neonicotinoids is unlikely to be relevant when they are used as seed treatment and appropriate precautions are taken to limit exposure to dust produced from seeding. There might also be residues on the surface of the honeybee that result from contact with pollen and/or nectar and dust, but the neonicotinoids are too polar to penetrate rapidly through the cuticle of the honeybee and toxicity from direct contact is unlikely.
The oral toxicity values derived from first-tier laboratory studies on individual bees were not used in this QWoE analysis. These toxicity values are appropriate for use in initial screening, but are less useful for assessing responses in higher-tier field studies that directly measure apical endpoints at the level of the colony (the term “colony” is used to refer to all castes of honeybees as an entity; the term “hive” is used to refer to the structure in which the colony resides). This is consistent with the views of others on the relevance of toxicity data derived from laboratory tests to exposures occurring in the field (Carreck and Ratnieks Citation2014) and observations of resiliency at the level of the hive (Henry et al. Citation2015).
Insecticidal seed treatments in general often contain other pesticides, such as fungicides. Fungicides have been suggested as potential modifiers on the toxicity of neonicotinoids. Many of the studies in these QWoE analyses used seeds treated with a mixture of neonicotinoids and fungicides (see SI for companion papers). Fungicides are frequently detected in products of the colony (Johnson et al. Citation2010; Mullin et al. Citation2010), but many of these are applied directly to crops as well as in seed treatments. Many of these fungicides are not systemic and are used as protectants for the seed and seedling. Fungicides that inhibit ergosterol biosynthesis are systemic and have been shown to synergize the toxicity of pyrethroid insecticides by the inhibition of detoxification via monooxygenases (Pilling et al. Citation1995). The greatest synergistic ratio reported in honeybees was 16-fold for a mixture of pyrethroid lambda cyhalothrin and the systemic fungicide propiconazole (Pilling and Jepson Citation1993). In laboratory studies, synergistic ratios for clothianidin (CTD), imidacloprid (IMI), thiacloprid, and thiamethoxam (TMX) and several fungicides (myclobutanil, propiconazole, flusilazole, and tebuconazole) in honeybees were smaller than those for pyrethroids and varied by route of exposure (Thompson et al. Citation2014). Synergistic ratios were 0.19- to 2.6-fold via the dermal exposure and 0.36- to 1.9-fold via the oral route. The only statistically significant level of synergism (no overlap of the 95%CIs of LD50 for the insecticide alone and for the combination) was between TMX and tebuconazole (2.6-fold) via dermal exposure and CTD and tebuconazole (1.9-fold) via the oral route (Thompson et al. Citation2014). In another laboratory study with honeybees (Sgolastra et al. Citation2016), CTD was shown to be synergistic when mixed with the fungicide propiconazole, but only at 4 and 24 h in a 96-h oral toxicity test. The relevance of these low synergistic ratios measured in laboratory studies to effects in the field is questionable; a semi-field tunnel study with spray application of a mixture of neonicotinoid, thiacloprid, and tebuconazole failed to show synergism (Schmuck, Stadler, and Schmidt Citation2003).
In many of the field and semi-field studies included in the QWoE assessments, the control seeds were treated with the same fungicides as the neonicotinoid-treated seed (see SI from the individual companion papers). Thus, if observed, the differences between responses in control and treated plots could have been the result of neonicotinoid alone or the synergism of the neonicotinoid by the fungicide(s). Field and semi-field experiments were not designed to elucidate synergism, but the rates of application used were consistent with good agricultural practice and hence the results represent realistic agricultural uses. Synergism, if it occurred, was incorporated in the observed responses.
In conducting a QWoE analysis, it is important to recognize that domains of evidence can be either independent or linked in dependent chains of responses. Independent domains of evidence are typically based on a single response, such as toxicity of a single type. Each of these domains of evidence can be tested experimentally.
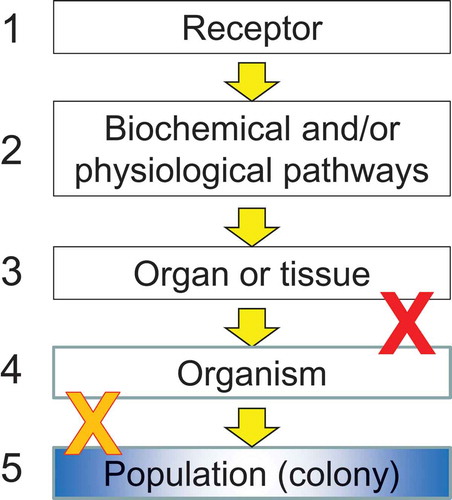
Dependent evidence is usually concatenated in a chain of events that is similar to an adverse outcome pathway (AOP; Ankley et al. Citation2010) or some of the guidelines for causality, such as those suggested by Hill (Citation1965). Each of the links in a concatenated line of evidence () can be tested experimentally; however, if one of these is shown not to be relevant, e.g., redundancy or resiliency in an organ or tissue that negates the measured effects on physiology, then the chain is broken. In these cases, the response is not propagated to the apical endpoint (blue box in ) at the level of the colony and the AOP is not relevant. In this QWoE assessment, the focus was on higher-tier studies, many of which directly measure the effects at the level of these apical endpoints.
Figure 1. Illustration of linked or concatenated lines of evidence and the importance of continuity. The chain is broken if one of the lines of evidence is not true (red or orange X). Apical endpoints for honeybee colonies are shown with the blue background.
Conceptual models for exposures to and effects of neonicotinoids
The conceptual model for exposure consists of a series of scenarios that qualitatively describe how the receptor organisms co-occur with, or may encounter, the stressor. These descriptions considered several issues to better match the conceptual model of exposure to the actual field situation. These include, inter alia, the medium; bioavailability; the geographic, spatial, temporal, and biological scales; and the amount of detail needed or provided.
Exposure via food
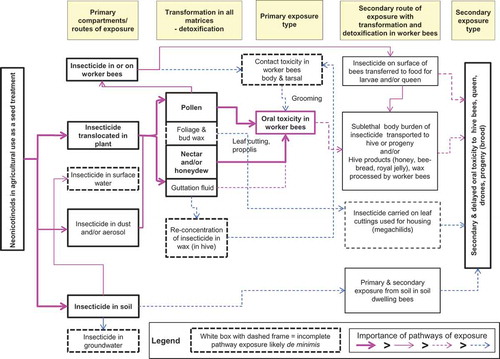
The conceptual model for exposures in these QWoE assessments () identified potential primary sources of neonicotinoids as those resulting from translocation in the plant to bee-relevant food matrices such as nectar, honeydew, and pollen. Because of the method of application and the lack of partitioning of the polar neonicotinoids into wax, exposure via foliage and bud wax was of lesser relevance to honeybees and was not included as a matrix of relevance.
Figure 2. Conceptual model for exposures of bees to neonicotinoid insecticides in agricultural use as seed treatments (developed from Cutler et al. Citation2014).
Exposure via guttation fluid and surface waters
Guttation fluid is produced, particularly in the early growth stages, by a variety of plants due to root pressure under conditions of excess moisture in soil and high humidity in air (Hughes and Brimblecombe Citation1994). Guttation fluid can contain neonicotinoids translocated from the roots and is a potential source of exposure if bees collect this fluid as a source of water. Surface waters are also used as a source of water for honeybees and have been reported to contain residues of neonicotinoids (see companion papers). It has been estimated that honeybees can carry 40 mg of water in a foraging trip (Visscher, Crailsheim, and Sherman Citation1996). For the purposes of calculating the dose derived from guttation fluid, it was assumed that a single water-carrier honeybee would be able to collect from this source for about 4 h a day and that approximately 20 trips for a total of 800 mg of water would be carried to the hive during a “water shift”.
Water or guttation fluid is carried from the source by the honeybee and is delivered to the colony for purposes of cooling the hive and processing of food, so almost all the water and any water-soluble active substance therein is not absorbed by the honeybee while in transit. Studies with radiolabeled water have shown that very little water is passed to the midgut of the honeybee (Visscher, Crailsheim, and Sherman Citation1996), where absorption of water and water-soluble materials occurs. Of the neonicotinoids in the guttation fluid or surface water, it was estimated that less than 1% would be taken up by the forager honeybee (based on data in in Visscher, Crailsheim, and Sherman Citation1996), i.e., less than the amount in 8 mg of guttation fluid or water in a day of collecting water from this source only. In addition, guttation fluid is not always produced by plants, and it is mostly produced before transpiration starts early in the day and at the initial stages of plant growth that are less attractive to bees. Thus, exposures of honeybees via this route would be infrequent and discontinuous, depending on the type of plant, rainfall, soil moisture, and relative humidity of the air surrounding the plants, in addition to the water needs of the colony. Potential exposures from surface waters have been addressed in the companion papers, where estimated exposures were compared to toxicity values derived from higher-tier tests.
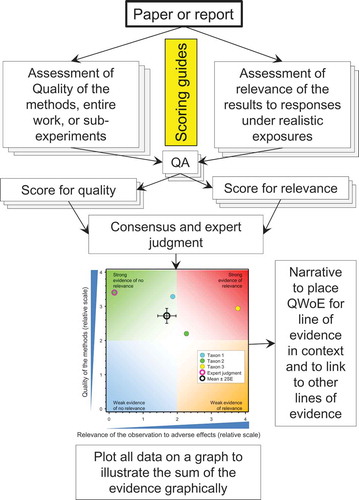
Figure 3. Illustration of the QWoE process used to assess the pesticide for adverse effects at relevant exposures.
Exposures via dust from seeding
Exposure of honeybees might occur via dust released from seed treatments during planting or from dust created by disturbance of soil. If exposures are large enough, the threshold of dermal toxicity might be exceeded, but it is more likely that dust will contaminate pollen or be carried by the honeybees back to the hive where secondary exposures might result. Neonicotinoids in dust deposited on the soil might be taken up by plants and translocated to bee-relevant matrices, but these amounts are likely to be small.
Exposure via soil
Neonicotinoids are somewhat persistent in soil and will be present in the soil when treated seeds are planted or where dust has been deposited. This pathway of exposure is incomplete because honeybees have little direct contact with soil. Residues of neonicotinoids remaining in the soil after a treated crop has been harvested might be taken up in a succeeding crop or in wild flowers and translocated to bee-relevant matrices (Botias et al. Citation2015), resulting in exposures via food. Tests based on exposures via this route were included in the QWoEs presented in the companion papers.
Exposure of honeybees via food
Exposures of honeybees via food are the drivers of hazard and risk and they are different for each of the castes in the colony. Although the rate of feeding and the proportion of honey and pollen in food fed to larvae vary over time and development of the larva (Table 3 in USEPA Citation2014), we chose to follow the food-consumption guidelines proposed by the US EPA (2014). These values are probably conservatively overestimated, which provides an additional level of protection in our assessments. Our assessment of risks to honeybees via food exposures should be similar to those derived by others working from the US EPA guidance. Adult honeybee workers are expected to receive the greatest dietary exposures; a median food consumption rate of 292 mg nectar with 30% sugar/d was proposed (USEPA Citation2014). US EPA has proposed a maximum rate of consumption of food by worker larvae of 124 mg nectar and some pollen/d. This food is processed by nurse bees and is thus subject to transformation in storage, dilution, and metabolism in the nurse bees. Thus, exposures are either at or reduced to nontoxic levels by the processing of the food by nurse bees. If the levels of exposures were toxic, the nurse bees would be affected adversely and the pathway to larvae, drones, and queens would be incomplete. Thus, exposure values in workers are expected to be protective of larvae, drones, and queens because they do not consume pollen or honey directly except via nurse bees. Because of the structure and functioning of the colony, adverse effects on these castes of honeybees would be reflected in the results of toxicity testing at the level of the colony.
When using the above-mentioned rates of consumption of food for honeybees, factors that limit or mitigate exposures are not considered, so they represent a worst case. In the field, honeybees are free to seek nectar, pollen, and water from various locations and sources. Thus, they will not necessarily feed exclusively on one source of food; however, exceptions might occur for large fields of monoculture crops. Because crops and other plants flower at various times, exposures of honeybees to treated plants vary over time. This spatial and temporal heterogeneity of food sources and residues therein result in the averaging out or amortization of exposures. Thus, a worst-case assumption that all honeybees are exposed to the highest concentrations of a pesticide in food and water is only useful for lower-tier hazard assessment. In practice, real-world exposures will be less than that for worst-case scenarios. The most appropriate way to assess the risk of neonicotinoids to honeybees is to use exposures from realistic scenarios of honeybees feeding freely in the field. Of course, free-ranging honeybees are subject to many other stressors, chemical and otherwise, and the resulting variability in response complicates the detection of effects and the assignment of causality, just as it does in all field studies in ecotoxicology.
Effects on honeybees
Effects of neonicotinoids in honeybees range from mortality to behavioral and physiological responses. Because the protection goal is the colony and services provided by the colony, we selected measures of effect that were extrapolatable to apical endpoints of survival, reproduction, development, and sustainability of the colony. Physiological effects such as behavior and resistance to disease or parasites might impair survival, but extrapolation of these responses to apical endpoints is poorly understood and the extrapolation factors have not been quantified. In addition, these responses can be modified by other factors such as those related to local conditions, pest management in the colony, and husbandry of the honeybees. The focus of these QWoE analyses was on responses of honeybees under semi-field and field conditions that are representative of normal commercial use. For this reason, toxicity values derived from higher-tier studies that assessed effects on the colony were chosen as the most appropriate measures of effect. These studies integrate all normal pathways of exposure from food and water, even if the proportion of the dose received from a pathway is unknown. While it is recognized that models have been developed to analyze and predict the effects of pesticides on honeybee colonies (Becher et al. Citation2014), these have yet to be used in regulation. We did not include these models in our QWoE analyses.
There is biological resiliency and redundancy of function associated with a colony of honeybees. Individual worker honeybees have a relatively short lifetime (as long as 5–6 weeks in summer and five or more months in the winter) and are continuously replaced because of mortality from natural causes. Queens usually live for several years. Because of the continuous replacement of workers, effects on the survival of individuals can be tolerated if the functioning of the colony is protected. Because of this, a lack of effects on the level of the colony in a field or semi-field study will likely only be observed at concentrations greater than those in the laboratory, where effects are assessed at the level of the individual. Higher-tier experimental studies carried out in semi-field and field scenarios provide measures of effects closer to the apical endpoint: the colony. This is especially true if these studies are experimental, in that exposures are controlled and/or measured. In this way, they provide an integration of responses at lower nodes on the AOP. Thus, lack of effects in these studies overrides the effects observed at lower nodes of the AOP. If honeybees are confined to sources of food (and/or water) for which exposures are known, observed effects, or lack thereof, provide validation or calibration of the relevance of responses at lower nodes of the AOP.
Higher-tier observational studies (ecoepidemiology studies), where honeybees have free range to seek food and water, are subject to greater uncertainty of interpretation because exposures are less controlled. However, analysis of food products in the colony before and after putative exposures might provide information on the amounts carried by honeybees to the hive. While less able to clarify causality, these studies can illuminate the assessment of risks.
Assessment endpoints
In keeping with the focus on the effects measured in higher-tier semi-field and field studies, the protection goals used in the QWoE were 1) provision of pollination services and 2) production of colony products (USEPA Citation2014). The assessment endpoints for the former were population size and stability of commercially managed honeybees, and, for the latter, quantity and quality of colony products (USEPA Citation2014). The measurement endpoints were related to the apical endpoints (nodes 4 and 5 in ) and included the relevance of exposures from higher-tier studies to survival of individual workers and larvae, fecundity of the queen, success of the brood, and growth and survival of the colony (USEPA Citation2014).
Hypotheses
The main null hypothesis tested was that use of neonicotinoids as a seed treatment has no adverse impacts on viability and sustainability of the colony of honeybees. There are several sub-hypotheses addressed below and these also considered toxic metabolites (if any):
Maximum or higher centile (90th) concentrations of the neonicotinoid (as the sum of parent compound and any toxic metabolite) in bee-relevant matrices from treated crops in the field do not exceed the toxicity values derived from higher-tier toxicity studies on colonies of honeybees (see SI Table 1c).
Colonies of honeybees exposed to normal uses of the neonicotinoid as seed treatments under experimental conditions (enclosure studies) in the field do not show adverse effects at the level of the colony (see SI Table 2b).
Exposure of colonies of honeybees to the neonicotinoid (and toxic metabolites) resulting from use as a seed treatment in open agricultural fields does not cause adverse effects at the level of the colony (see SI Table 3b).
Weight of evidence
Weight of evidence (WoE) was used to characterize the studies included in this assessment. WoE is a term that is widely used in the literature but mostly in the metaphorical sense (Weed Citation2005). Until recently, the scientific community has been without a defined and transparent process for integrating different and sometimes conflicting sources of information to reach conclusions about a specific phenomenon or question (Linkov et al. Citation2009). WoE has been used very infrequently in a formal and quantitative sense for risk assessment. Instead, its use in risk assessment has relied upon expert judgment that might be valid but is neither transparent nor entirely consistent. Different scientific disciplines have adopted different methods for developing, analyzing, and integrating data, and combining information (Gough Citation2007), and this provides a challenge in a complex multidisciplinary area such as environmental risk assessment.
Hypothesis-based approaches have been used for assessing risks of substances with endocrine activity (Borgert et al. Citation2011, Citation2014), carcinogens (Rhomberg, Bailey, and Goodman Citation2010), and chemicals in general (Lutter et al. Citation2015). Quantitative and semiquantitative methods have been used for sediment (Chapman Citation2007), oil spills (McDonald et al. Citation2007), for the herbicide atrazine (Van Der Kraak et al. Citation2014), and for other chemicals (Bridges and Solomon Citation2016). In conducting this quantitative QWoE assessment, we have modified the methods used previously (Van Der Kraak et al. Citation2014) to address the question of the potential effects associated with exposure of honeybees to neonicotinoids and to test the hypotheses related to effects on apical endpoints under realistic conditions of exposure. The QWoE methodology was used to characterize the quality of the available studies and to assess their relevance to potential or measured adverse effects.
Methods for QWoE
An overview of the methods that we developed in the QWoE analysis is illustrated in . A WoE methodology requires the evaluation of all the relevant, available evidence. The process was a stepwise process that began with searches to identify all the relevant literature (publications and reports). These papers and reports were then grouped into lines of evidence for testing the risk hypothesis that the neonicotinoid being considered had a property or effect that would result in exceedance of an exposure threshold for adverse effects. The result is a graphical integration and summation of all domains/lines of evidence.
Selection of publications and sources of data
Several data sources were considered. The term publication is used to describe both papers published in the peer-reviewed literature and research reports for studies conducted by or for the industry, in this case the registrants of the neonicotinoids.
Papers in the peer-reviewed literature
The compilation of references from 1990 to 2014 and provided to EFSA (Fryday, Tiede, and Stein Citation2015) was used as a starting point. References for the neonicotinoids were selected and copies of the original paper and any supplemental information (SI) were obtained. In addition, a search of the literature with PubMed, ESTAR, SciFinder®, CAPLUS (via SciFinder®) Biosis Preview and CAB (via Ovid®), Science Direct, EBSCO, EMBASE, and Google® Scholar was conducted and recent papers (January 2014–June 2017) in the open literature were evaluated to be as inclusive as possible. In this way, search bias was minimized.
Reports produced for regulatory agencies
Regulatory studies conducted on neonicotinoids were provided by the registrant. These reports were all focused on higher-tier studies and, for the most part, were conducted under the auspices of Good Laboratory Practices (GLP) (OECD Citation2005). We assumed that all reports of completed higher-tier studies were provided.
Paper and reports that were excluded
We did not exclude any primary studies based on predetermined quality attributes as used in the scoring guides; however, the following were excluded, mainly because they lacked sufficient details to allow quality to be assessed.
Studies available only in summary form, interim reports, and abstracts where the details of the methods used could not be assessed.
Reviews; however, the references provided in the reviews were checked to identify possible additional publications that might need to be examined.
Publications not published in English were excluded unless a full translation was available.
Exposure studies from the field where the analytical level of detection (LOD) for the neonicotinoid was ≥concentrations in the matrix equivalent to the chronic no-observed-adverse-effect-concentration (NOAEC for nectar, water or guttation fluid, pollen, and abraded dust deposited from treated seeds).
Studies on fate, deposition of, and exposure to dust from seeders that were not conducted in the field were excluded because the relevance of the data to the field could not be extrapolated.
Effect studies where mixtures of systemic insecticides containing one or more neonicotinoids were tested as a single mixture were excluded because the causality of any observed effects could not be assigned. However, if the result showed no effects, then the concentration of neonicotinoid(s) in the mixture was assumed to be less than the level of toxicity; these were addressed in the narrative, where appropriate.
Overview studies based on unpublished reports were excluded. If these reports were available to us and contained raw data and sufficient information to evaluate the quality of the study, they were included.
It was not possible to totally avoid publication bias, i.e., the lower likelihood for papers reporting no effects to be published (Walker, Hernandez, and Kattan Citation2008). This bias is unquantifiable but is reduced to some extent by the inclusion of GLP studies required by regulatory agencies where all results, positive or not, are included in submissions. In general, publication bias in the open literature is likely to make the conclusions of any WoE more conservative.
Weighing the findings from publications and reports
Papers and reports were assessed in detail, using predefined criteria for quality and relevance to develop scores (on a relative scale) to separate the higher-quality from the lower-quality studies and the relevant from the less-relevant results (see SI Tables 1–3 for scoring criteria and the scoring sheets in the companion papers). In addition, see SI from the companion papers for the description of the QWoE analyses. Scoring methods used for each publication were similar to those recommended for assessing studies for inclusion in the International Uniform Chemical Information Database (IUCLID, Klimisch, Andreae, and Tillmann Citation1997) and for setting criteria for environmental quality (Breton et al. Citation2009; Moermond et al. Citation2017), and WoE (Van Der Kraak et al. Citation2014). Scoring approaches were also similar to those recommended for assessing studies from the open literature (ECETOC Citation2014; USEPA Citation2011, Citation2012). The objective of the scoring was to separate the studies based on quality of the methods and relevance of the observations to apical endpoints at the level of the colony. Thus, the scores have no real meaning other than for the purposes of ranking and characterizing the clustering of the results. As in Van Der Kraak et al. (Citation2014), scores were not used to exclude studies from further consideration; all studies, regardless of quality, were included.
Scores for quality of the study
The scoring criteria and scoring sheets for quality (see SI Tables 1a, 2a, and 3a and the SI for the companion papers) were developed before the assessment of paper and reports was started. As it was not possible to anticipate, a priori, all possible study designs and approaches, the scoring criteria were divided into two groups, general and critical. The general criteria were grouped in the category “Experimental design and hypotheses” and included as many elements of good experimental design as possible. These were scored from 4 to 0 based on the number of weaknesses identified in the methods. These weaknesses were identified in a summary of the methods used in the study and are shown in SI for the companion papers. Although somewhat subjective, these criteria were used without change for all three neonicotinoids assessed. If these criteria were scored individually, there would have been many scorable points. Thus, a low score for a weakness in one of these would have been “lost” in the average and total scores would have clustered so closely as to not be discernably different.
The second group of scoring criteria was the “critical criteria” and was deemed more important in the experimental design. Most of these criteria were objective (e.g., number of replicates, access to raw data, etc.) but based on sound science and best practices and were scored from 4 to 0. These critical criteria thus had greater weight in the total score than the general criteria. In addition to the criteria developed a priori, significant weaknesses were sometimes discovered during review. When this occurred, a score for expert judgment (SEJ) on quality of the study was included as a multiplier, which reduced the total score for quality by a factor of 0.5 for each major weakness. The reason for the SEJ was documented in SI (see companion papers).
Scores for relevance of the results
Relevance of the exposures measured in bee-relevant matrices under field conditions was scored by comparison to the toxicity values from a higher-tier field toxicity studies at the level of the colony. Concentrations in exposure matrixes were converted to dose per honeybee to allow comparison to the Lowest Observed Adverse Effect Dose (LOAED) and the No Observed Adverse Effect Dose (NOAED) to estimate relevance (exposure value > toxicity value) as shown in SI Table 1c. For small data sets (<10), the maximum or worst-case values were used. Where centiles were calculated or the raw data provided, upper centiles were used or estimated from the raw data with “PERCENTILE.EXC” function in MS Excel (MS Office version 10). As for the scores for quality, major weaknesses identified in the relevance were assigned multipliers of 0.5 as scores for expert judgment.
For the experimental field studies on effects (SI Table 2b), relevance was based on several criteria, i.e., statistical significance (p < 0.05) and consistency of significance over time where these observations were repeated, evidence of a concentration response, relationship of the response to apical endpoints at the level of the colony, and plausibility of the mechanism of action. Some studies measured multiple responses. Where these were judged to be independent, they were listed separately; if dependent (e.g., honeybee behavior – trembling, apathy, shaking), they were scored together. For studies on effects on the colony in experimental field studies where differences between treatments and control were not tested statistically, best professional judgment was used to assess the differences and the same criteria for repeated observations as outlined for statistical significance were applied (SI Table 2b).
For assessing the relevance of results from ecoepidemiology studies (SI Table 3b), we used statistical significance (p < 0.05) and consistency of significance over time where these observations were repeated, evidence of a concentration response, and relationship of the response to apical endpoints at the level of the colony. Where differences between treatments and control were not tested statistically, best professional judgment was used to assess the differences and the same criteria for repeated observations as outlined for statistical significance were applied (SI Table 3b).
Summarizing the scores
The mean and variance of the scores provide a summary of all the responses considered. These are shown in the graphs because they summarize all the responses even when the data points overlap. Overlapping data points in the graphs are noted in the graphs provided in SI. The means and 2 x SEs (≈ the 95%CI) were calculated and plotted using SigmaPlot for Windows V11 (Systat Software Inc.) to show uncertainty in the mean values in the graphic form. Similar calculations in Excel used the “AVERAGE” and “STDV.S” function in MS Excel (MS Office version 10). The SE was calculated using the equation SE = (STDV.S/SQRT of n).
Initial scoring for a study was carried out by one of the authors. This QWoE was then checked for accuracy of data by an independent quality assurance (QA) person and corrected, if needed. The QWoE was then reviewed by the other author and, if needed, the scores were adjusted by consensus upon discussion.
Key issues in assessing quality and relevance of studies
Exposures
Some papers and reports were focused only on exposures of honeybees via food matrices. In others, effects and exposures were assessed in the same study. All papers and reports that passed the exclusion criteria (discussed above) were included in the assessment. The scoring of these reports and papers for quality was based on the scoring guide outlined in SI Table 1a.
Some studies collected nectar and pollen directly from the flowers. Others utilized honeybees to collect nectar and pollen that were sampled as fresh honey in the comb, from pollen traps, or from the contents of the “honey-stomach” and “pollen baskets” of individual honeybees. In most of the experimental studies, the honeybees used as “collectors” were confined to the test crop in mesh tunnels, thus representing a worst-case exposure scenario.
A key attribute of the scoring of quality of studies on exposure was the use of field spikes and blanks, transport spikes and blanks, and storage spikes. The latter are needed to ensure that concentrations do not change because of, for example, changes in temperatures during transport and storage. Several studies that were assessed did not make use of transport and storage spikes. Normally this would have been identified as a major weakness resulting in a substantial reduction in score for quality; however, GLP studies of spiked field samples of pollen, nectar, and other matrices were available for the CTD or its metabolites N-(2-chlorothiazol-5-ylmethyl)-N’-methylurea; clothianidin urea (TZNG), and N-(2-chlorothiazol-5-ylmethyl)-N’-nitroguanidine; desmethyl clothianidin (TZMU) (Bayer CropScience Citation2014)), IMI and its toxic metabolites hydroxy-IMI and IMI-olefin (Bayer CropScience Citation2013), and TMX and its toxic metabolite, CTD (Syngenta Citation2007). All these studies showed that storage in a freezer at ≤–18°C for up to 365 d did not result in significant degradation of samples of the neonicotinoids or relevant toxic metabolites. Therefore, a generalized exception for lack of transport and storage spikes was applied to all the studies, whether conducted by the registrants or not. Lack of field blanks or field control samples is a major weakness and was not included in this generalized exception.
Field and semi-field experimental studies of effects
All papers and reports on experimental field studies on effects where exposures were experimentally controlled and that passed the exclusion criteria (above) were included in the assessment. Most of the studies included in this group were experiments where honeybees were confined to the crop by enclosures, thus forcing them to forage on the treated crop. Some others, where honeybees could forage freely, were also included when the treated crop covered an area larger than the normal forage range, and the honeybees were essentially confined by distance to the treated crop. The scoring of these reports and papers for quality was based on the scoring guide outlined in SI Table 2a. The scoring guide for relevance is shown in SI Table 2b
Ecoepidemiology studies (higher-tier observational studies)
All papers and reports on ecoepidemiology that passed the exclusion criteria (above) were included in the QWoE analysis. These papers were largely from field studies where honeybees were not confined to the treated crop and were free to forage as freely as their flight range allowed. Others were large surveys of apiaries across regions where hives were sampled randomly or because of the reporting of adverse effects. The scoring of these reports and papers for quality was based on the scoring guide outlined in SI Table 3a. There were two key attributes for scoring quality of studies on ecoepidemiology. One of these was the use of an appropriate control and the other was the characterization of potential confounders of adverse effects. Relevance of effects was determined using the guidance summarized in SI Table 3b.
Solomon_Stephenson-2017-JTEH-B-SI-for-Paper-1-ID1388563.pdf
Download PDF (165.5 KB)Acknowledgments
The methods described in this paper were developed by the authors alone.
Supplemental data
Supplemental data for this article can be accessed on the publisher’s website.
Related Research Data
References
- Alkassab, A. T., and W. H. Kirchner. 2017. Sublethal exposure to neonicotinoids and related side effects on insect pollinators: Honeybees, bumblebees, and solitary bees. Journal of Plant Diseases and Protection 124:1–30. doi:10.1007/s41348-016-0041-0.
- Ankley, G. T., R. S. Bennett, R. J. Erickson, D. J. Hoff, M. W. Hornung, R. D. Johnson, D. R. Mount, J. W. Nichols, C. L. Russom, P. K. Schmieder, J. A. Serrrano, J. E. Tietge, and D. L. Villeneuve. 2010. Adverse outcome pathways: A conceptual framework to support ecotoxicology research and risk assessment. Environmental Toxicology and Chemistry 29:730–41. doi:10.1002/etc.v29:3.
- Bayer CropScience. 2013. Storage Stability of Imidacloprid and its 5-Hydroxy and Olefine Metabolite in/on Plant Matrices for 36 Months. Monheim: Bayer CropScience AG. Report Study ID: P642094733, Report No.: MR-09/182. 449
- Bayer CropScience. 2014. Clothianidin Plant Bioavailability and Soil Accumulation Study. Research Triangle Park, North Carolina, USA: Bayer CropScience (Unpublished Report). Report M-498438-01-1. 663
- Becher, M. A., V. Grimm, P. Thorbek, J. Horn, P. J. Kennedy, and J. L. Osborne. 2014. BEEHAVE: A systems model of honeybee colony dynamics and foraging to explore multifactorial causes of colony failure. Journal of Applied Ecology 51:470–82. doi:10.1111/1365-2664.12222.
- Blacquière, T., G. Smagghe, V. G. Cam, and V. Mommaerts. 2012. Neonicotinoids in bees: A review on concentrations, side-effects and risk assessment. Ecotoxicology 21:973–92. doi:10.1007/s10646-012-0863-x.
- Borgert, C. J., E. M. Mihaich, L. S. Ortego, K. S. Bentley, C. M. Holmes, S. L. Levine, and R. A. Becker. 2011. Hypothesis-driven weight of evidence framework for evaluating data within the US EPA’s endocrine disruptor screening program. Regulatory Toxicology and Pharmacology 61:185–91. doi:10.1016/j.yrtph.2011.07.007.
- Borgert, C. J., L. D. Stuchal, E. M. Mihaich, R. A. Becker, K. S. Bentley, J. M. Brausch, K. Coady, D. R. Geter, E. Gordon, P. D. Guiney, F. Hess, C. M. Holmes, M. J. LeBaron, S. Levine, S. Marty, S. Mukhi, B. H. Neal, L. S. Ortego, D. A. Saltmiras, S. Snajdr, J. Staveley, and A. Tobia. 2014. Relevance weighting of tier 1 endocrine screening endpoints by rank order. Birth Defects Research B 101:90–113. doi:10.1002/bdrb.21096.
- Botias, C., A. David, J. Horwood, A. Abdul-Sada, E. Nicholls, E. Hill, and D. Goulson. 2015. Neonicotinoid residues in wildflowers, a potential route of chronic exposure for bees. Environmental Science & Technology 49:12731–40. doi:10.1021/acs.est.5b03459.
- Breton, R. L., G. Gilron, R. Thompson, S. Rodney, and S. Teed. 2009. A new quality assurance system for the evaluation of ecotoxicity studies submitted under the new substances notification regulations in Canada. Integrated Environmental Assessment and Management 5:127–37. doi:10.1897/IEAM_2008-026.1.
- Bridges, J., and K. R. Solomon. 2016. Quantitative weight of evidence analysis of the persistence, bioaccumulation, toxicity and potential for long range transport of the cyclic volatile methyl siloxanes. Journal of Toxicology and Environmental Health B. doi:10.1080/10937404.2016.1200505:.
- Carreck, N. L., and F. L. W. Ratnieks. 2014. The dose makes the poison: Have “field realistic” rates of exposure of bees to neonicotinoid insecticides been overestimated in laboratory studies? Journal Apicul Researcher 53:607–14. doi:10.3896/IBRA.1.53.5.08.
- Chapman, P. M. 2007. Determining when contamination is pollution - Weight of evidence determinations for sediments and effluents. Environment International 33:492–501. doi:10.1016/j.envint.2006.09.001.
- Cresswell, J. E. 2011. A meta-analysis of experiments testing the effects of a neonicotinoid insecticide (imidacloprid) on honey bees. Ecotoxicology 20:149–57. doi:10.1007/s10646-010-0566-0.
- Cresswell, J. E., F.-X. L. Robert, H. Florance, and N. Smirnoff. 2014. Clearance of ingested neonicotinoid pesticide (imidacloprid) in honey bees (Apis mellifera) and bumblebees (Bombus terrestris). Pest Management Science 70(5):779–83.
- Cutler, C., J. Purdy, J. P. Giesy, and K. R. Solomon. 2014. Risk to pollinators from the use of chlorpyrifos in North America. Reviews of Environmental Contamination and Toxicology 231:219–65.
- Cutler, G. C., C. D. Scott-Dupree, and D. M. Drexler. 2013. Honey bees, neonicotinoids and bee incident reports: The Canadian situation. Pest Manage Sciences.
- Decourtye, A., and J. Devillers. 2010. Ecotoxicity of neonicotinoid insecticides to bees. Advances in Experimental Medicine and Biology 683:85–95.
- ECETOC. 2014. Information to be Considered in a Weight-of-evidence-based PBT/vPvB Assessment of Chemicals (Annex XIII of REACH) Brussels: European Centre for Ecotoxicology and Toxicology of Chemicals. Report ECETOC Special Report No. 18. 158 http://www.ecetoc.org/uploads/Publications/documents/TR%20104.pdf
- Fairbrother, A., J. Purdy, T. Anderson, and R. Fell. 2014. Risks of neonicotinoid insecticides to honeybees. Environmental Toxicology and Chemistry / SETAC 33:719–31. doi:10.1002/etc.v33.4.
- Forster, R. 2008. Bee poisoning caused by insecticidal seed treatment of maize in Germany in 2008. 10th International Symposium of the ICP-Bee Protection Group; Bucharest (Romania). Julius-Kühn-Archiv. 126–31
- Fryday, S., K. Tiede, and J. Stein 2015. Scientific Services to Support EFSA Systematic Reviews: Lot 5 Systematic Literature Review on the Neonicotinoids (Namely Active Substances Clothianidin, Thiamethoxam and Imidacloprid) and the Risks to Bees. Parma, Italy: European Food Safety Authority. Report EFSA supporting publication 2015:EN-756. 656 www.efsa.europa.eu/publications
- Godfray, H. C., T. Blacquiere, L. M. Field, R. S. Hails, G. Petrokofsky, S. G. Potts, N. E. Raine, A. J. Vanbergen, and A. R. McLean. 2015. A restatement of the natural science evidence base concerning neonicotinoid insecticides and insect pollinators. Proceedings of the Royal Society B Biological Sciences 282:20151821. doi:10.1098/rspb.2015.1821.
- Gough, D. 2007. Weight of evidence: A framework for the appraisal of the quality and relevance of evidence. Research Papers in Education, 22: 213–228.
- Henry, M., N. Cerrutti, P. Aupinel, A. Decourtye, M. Gayrard, J.-F. Odoux, A. Pissard, C. Rüger, and V. Bretagnolle. 2015. Reconciling laboratory and field assessments of neonicotinoid toxicity to honeybees. Proceedings of the Royal Society B Biological Sciences 282. doi:10.1098/rspb.2015.2110.
- Hill, A. B. 1965. The environment and disease: Association or causation? Proceedings of the Royal Society of Medicine 58:295–300.
- Hughes, R. N., and P. Brimblecombe. 1994. Dew and guttation: Formation and environmental significance. Agricultural and Forest Meterology 67:173–90. doi:10.1016/0168-1923(94)90002-7.
- Jeschke, P., R. Nauen, M. Schindler, and A. Elbert. 2011. Overview of the status and global strategy for neonicotinoids. Journal of Agricultural and Food Chemistry 59:2897–908. doi:10.1021/jf101303g.
- Johnson, R. M., M. D. Ellis, C. A. Mullin, and M. Frazier. 2010. Pesticides and honey bee toxicity: USA. Apidologie 41:312–31. doi:10.1051/apido/2010018.
- Klimisch, H.-J., M. Andreae, and U. Tillmann. 1997. A systematic approach for evaluating the quality of experimental toxicological and ecotoxicological data. Regulatory Toxicology and Pharmacology 25:1–5. doi:10.1006/rtph.1996.1076.
- Krupke, C. H., G. J. Hunt, B. D. Eitzer, G. Andino, and K. Given. 2012. Multiple routes of pesticide exposure for honey bees living near agricultural fields. PLoS ONE 7:e29268. doi:10.1371/journal.pone.0029268.
- Krupke, C. H., and E. Y. Long. 2015. Intersections between neonicotinoid seed treatments and honey bees. Current Opinion in Insect Science 10:8–13. doi:10.1016/j.cois.2015.04.005.
- Linkov, I., D. Loney, S. Cormier, F. K. Satterstrom, and T. Bridges. 2009. Weight-of-evidence evaluation in environmental assessment: Review of qualitative and quantitative approaches. The Science of the Total Environment 407:5199–205. doi:10.1016/j.scitotenv.2009.05.004.
- Long, E. Y., and C. H. Krupke. 2016. Non-cultivated plants present a season-long route of pesticide exposure for honey bees. Nature Communications 7:11629. doi:10.1038/ncomms11629.
- Lutter, R., L. Abbott, R. Becker, C. Borgert, A. Bradley, G. Charnley, S. Dudley, A. Felsot, N. Golden, G. Gray, D. Juberg, M. Mitchell, N. Rachman, L. Rhomberg, K. Solomon, S. Sundlof, and K. Willett. 2015. Improving weight of evidence approaches to chemical evaluations. Risk Analysis 35:186–92. doi:10.1111/risa.12277.
- McDonald, B. G., D. Amh, B. G. Wernick, L. Patterson, N. Pellerin, and P. M. Chapman. 2007. Design and application of a transparent and scalable weight-of-evidence framework: An example from Wabamun Lake, Alberta, Canada. Integrated Environmental Assessment and Management 4:476–83. doi:10.1897/IEAM_2007-017.1.
- Moermond, C., A. Beasley, R. Breton, M. Junghans, R. Laskowski, K. R. Solomon, and H. Zahner. 2017. Assessing the reliability of ecotoxicological studies: An overview of current needs and approaches. Integrated Environmental Assessment and Management 13:640–51.
- Mommaerts, V., S. Reynders, J. Boulet, L. Besard, G. Sterk, and G. Smagghe. 2010. Risk assessment for side-effects of neonicotinoids against bumblebees with and without impairing foraging behavior. Ecotoxicology 19:207–15. doi:10.1007/s10646-009-0406-2.
- Mullin, C. A., M. Frazier, J. L. Frazier, S. Ashcraft, R. Simonds, D. Vanengelsdorp, and J. S. Pettis. 2010. High levels of miticides and agrochemicals in North American apiaries: Implications for honey bee health. PLoS ONE 5:e9754. doi:10.1371/journal.pone.0009754.
- Nauen, R., and T. Bretschneider. 2002. New modes of action of insecticides. Pesticide Outlook 13:241–45. doi:10.1039/b211171n.
- Nuyttens, D., W. Devarrewaere, P. Verboven, and D. Foque. 2013. Pesticide-laden dust emission and drift from treated seeds during seed drilling: A review. Pest Management Science 69:564–75. doi:10.1002/ps.3485.
- OECD. 2005. Good laboratory practice: OECD principles and guidance for compliance monitoring. Paris, France: OECD Publishing http://www.oecd-ilibrary.org/environment/good-laboratory-practice_9789264012837-en.
- Pilling, E., K. Bromleychallenor, C. Walker, and P. Jepson. 1995. Mechanism of synergism between the pyrethroid insecticide λ-cyhalothrin and the imidazole fungicide prochloraz, in the honeybee (Apis mellifera L.). Pesticide Biochemistry and Physiology 51:1–11. doi:10.1006/pest.1995.1001.
- Pilling, E. D., and P. C. Jepson. 1993. Synergism between EBI fungicides and a pyrethroid insecticide in the honeybee (Apis mellifera). Pesticide Science 39:293–97. doi:10.1002/ps.2780390407.
- Rhomberg, L. R., L. A. Bailey, and J. E. Goodman. 2010. Hypothesis-based weight of evidence: A tool for evaluating and communicating uncertainties and inconsistencies in the large body of evidence in proposing a carcinogenic mode of action–naphthalene as an example. Critical Reviews in Toxicology 40:671–96. doi:10.3109/10408444.2010.499504.
- Sánchez-Bayo, F. 2014. The trouble with neonicotinoids. Science 346:806–07. doi:10.1126/science.1259159.
- Schmuck, R., T. Stadler, and H. W. Schmidt. 2003. Field relevance of a synergistic effect observed in the laboratory between an EBI fungicide and a chloronicotinyl insecticide in the honeybee (Apis mellifera L, Hymenoptera). Pest Management Science 59:279–86. doi:10.1002/ps.626.
- Sgolastra, F., P. Medrzycki, L. Bortolotti, M. T. Renzi, S. Tosi, G. Bogo, D. Teper, C. Porrini, R. Molowny-Horas, and J. Bosch. 2016. Synergistic mortality between a neonicotinoid insecticide and an ergosterol-biosynthesis-inhibiting fungicide in three bee species. Pest Management Science. doi:10.1002/ps.4449.
- Staveley, J. P., S. A. Law, A. Fairbrother, and C. A. Menzie. 2014. A causal analysis of observed declines in managed honey bees (Apis mellifera). Human and Ecological Risk Assessment 20:566–91. doi:10.1080/10807039.2013.831263.
- Syngenta. 2007. Thiamethoxam (CGA293343) and CGA322704: Validation of Residue Analytical Method REM 179.07 for the Determination of Residues in Bee and Hive Products and Storage Stability in Hive Pollen, Wax and Nectar, Stored Deep Frozen for 12 months. Bracknell, Berkshire, United Kingdom: Syngenta Ltd. (Unpublished Report). Report CGA293343-CGA322704-05-S508. 103
- Thompson, H. M., S. L. Fryday, S. Harkin, and S. Milner. 2014. Potential impacts of synergism in honeybees (Apis mellifera) of exposure to neonicotinoids and sprayed fungicides in crops. Apidologie 45:545–53. doi:10.1007/s13592-014-0273-6.
- USEPA. 2011. Evaluation Guidelines for Ecological Toxicity Data in the Open Literature. Procedures for Screening,Viewing, and Using Published Open Literature Toxicity Data in Ecological Risk Assessments. Washington, DC: U.S. Environmental Protection Agency, Office of Pesticide Programs. https://www.epa.gov/pesticide-science-and-assessing-pesticide-risks/evaluation-guidelines-ecological-toxicity-data-open
- USEPA. 2012. Guidance for Considering and Using Open Literature Toxicity Studies to Support Human Health Risk Assessment. Washington, DC: U.S. Environmental Protection Agency, Office of Pesticide Programs. https://www.epa.gov/pesticide-science-and-assessing-pesticide-risks/guidance-considering-and-using-open-literature
- USEPA. 2014. Guidance for Assessing Pesticide Risks to Bees. Washington, DC: Office of Chemical Safety and Pollution Prevention, Office of Pesticide Programs. United States Environmental Protection Agency. https://www.epa.gov/sites/production/files/2014-06/documents/pollinator_risk_assessment_guidance_06_19_14.pdf
- van der Kraak, G. J., A. J. Hosmer, M. L. Hanson, W. Kloas, and K. R. Solomon. 2014. Effects of atrazine in fish, amphibians, and reptiles: An analysis based on quantitative weight of evidence. Critical Reviews in Toxicology 44 (S5):1–66. doi:10.3109/10408444.2014.967836.
- van der Sluijs, J. P., N. Simon-Delso, D. Goulson, L. Maxim, J.-M. Bonmatin, and L. P. Belzunces. 2013. Neonicotinoids, bee disorders and the sustainability of pollinator services. Current Opinion in Environment Sustainability 5:293–305. doi:10.1016/j.cosust.2013.05.007.
- Visscher, P. K., K. Crailsheim, and G. Sherman. 1996. How do honey bees (Apis mellifera) fuel their water foraging flights? Journal of Insect Physiology 42:1089–94. doi:10.1016/S0022-1910(96)00058-3.
- Vrbka, L., R. Friessleben, K. Neubauer, A. Cantoni, and A. C. Chapple. 2014. Bayer AirWasher® and SweepAir®: Technological options for mitigation of dust emissions from vacuum based maize sowing equipment. Aspects of Applied Biology 122:113–18.
- Walker, E., A. V. Hernandez, and M. W. Kattan. 2008. Meta-analysis: Its strengths and limitations. Cleveland Clinic Journal of Medicine 75:431–39. doi:10.3949/ccjm.75.6.431.
- Weed, D. L. 2005. Weight of evidence: A review of concepts and methods. Risk Analysis 25:1545–57. doi:10.1111/j.1539-6924.2005.00699.x.