
 ?Mathematical formulae have been encoded as MathML and are displayed in this HTML version using MathJax in order to improve their display. Uncheck the box to turn MathJax off. This feature requires Javascript. Click on a formula to zoom.
ABSTRACT
The potential chronic health risks of occupational and environmental exposure to styrene were evaluated to update health hazard and exposure information developed since the Harvard Center for Risk Analysis risk assessment for styrene was performed in 2002. The updated hazard assessment of styrene’s health effects indicates human cancers and ototoxicity remain potential concerns. However, mechanistic research on mouse lung tumors demonstrates these tumors are mouse-specific and of low relevance to human cancer risk. The updated toxicity database supports toxicity reference levels of 20 ppm (equates to 400 mg urinary metabolites mandelic acid + phenylglyoxylic acid/g creatinine) for worker inhalation exposure and 3.7 ppm and 2.5 mg/kg bw/day, respectively, for general population inhalation and oral exposure. No cancer risk value estimates are proposed given the established lack of relevance of mouse lung tumors and inconsistent epidemiology evidence. The updated exposure assessment supports inhalation and ingestion routes as important. The updated risk assessment found estimated risks within acceptable ranges for all age groups of the general population and workers with occupational exposures in non-fiber-reinforced polymer composites industries and fiber-reinforced polymer composites (FRP) workers using closed-mold operations or open-mold operations with respiratory protection. Only FRP workers using open-mold operations not using respiratory protection have risk exceedances for styrene and should be considered for risk management measures. In addition, given the reported interaction of styrene exposure with noise, noise reduction to sustain levels below 85 dB(A) needs be in place.
Introduction
Styrene (C6H5CH = CH2, CAS No. 100-42-5) is an important high production volume chemical used primarily as an intermediate in the production of a number of commercially important polymers and copolymers that are in turn used to make a wide variety of products of industrial, consumer, and medical importance, including polystyrene (building construction and food packaging materials), styrene butadiene rubber (SBR) (tires and automotive parts), unsaturated polyester resins (boats and tubs/shower stalls), styrene butadiene latexes (carpet backings and paper coatings), acrylonitrile-butadiene-styrene (household and office appliances), and styrene-acrylonitrile (housewares and battery casings) (ATSDR, Citation2010; IARC, Citation2002; Miller, Newhook, and Poole Citation1994).
Styrene has been extensively studied in animal toxicology tests and human studies and been the subject of a number of regulator and authority reviews. In 1999, the Styrene Information and Research Center (SIRC) commissioned the Harvard Center for Risk Analysis to perform a comprehensive review of the potential health risks associated with exposure to styrene. This review was completed in 2002 and published by Cohen et al. (Citation2002).
Cohen et al. (Citation2002) summarized styrene exposures for occupational, consumer, and general population contact. In the 1990s, the U.S. annual styrene production exceeded 10 billion pounds and, with its uses in polymers and copolymers, human contact to styrene was determined to potentially occur in air, food, water, consumer products, and waste materials. In air, the primary sources of styrene were found to be industrial activities and motor vehicle exhaust, with typical ambient air concentrations at 1 ppb. Smoker exposures were identified as higher and smoking was found to be a dominant air source of styrene for these individuals. In occupational settings, exposures were described as highly variable with the industry conditions but were below 10 ppm except in sectors of the fiber-reinforced polymer composites (FRP) industry where levels of 20 ppm and higher were reported. Styrene’s presence in foods was identified with sources from natural occurrence, its use as a direct food additive, and indirect presence in foods from migration from packaging materials. Styrene presence in surface and groundwater was noted to be very low given its rapid biodegradation and volatility. Environmental releases in the U.S. in the 1990s averaged annually in the range of 24,000 tons of styrene.
Cohen et al. (Citation2002) review of the styrene toxicology information concluded that mammary tumor findings in two of the rat studies (Conti et al. Citation1988; Jersey et al. Citation1978) were not significant given high variability in the background incidence of these tumors, lack of dose response, and absence of increases in the other reported rat studies (Beliles et al. Citation1985; Cruzan et al. Citation1998; Ponomarkov and Tomatis Citation1978; U.S. NCI, Citation1979a, Citation1979b). The authors also concluded that the cancer evidence for mice was stronger with elevations in lung adenomas and carcinomas observed in several studies (Cruzan et al. Citation2001; Ponomarkov and Tomatis Citation1978; U.S. NCI, Citation1979a). In the later study, an increased incidence of bronchioalveolar adenomas in CD-1 mice exposed to between 20 and 160 ppm (female) or between 40 and 160 ppm (male) styrene by inhalation was found. The occurrence of lung carcinomas in females exposed to 160 ppm styrene was also significantly increased relative to unexposed controls.
Regarding non-cancer effects, Cohen et al. (Citation2002) found neurological effects to be a concern for styrene with high exposures associated with pre-narcotic central nervous system depression, with lower concentrations in animal and human studies reported to cause dopaminergic, nerve conduction, and neurobehavioral changes as well as ototoxicity and color vision impairment. In rodents but not humans, styrene was noted to be a respiratory tract toxicant. Limited evidence was reported on an immune function change. Reproductive and developmental toxicity was not indicated as a major concern for styrene although these endpoints were found not to have been thoroughly evaluated. Estrogenic or androgenic activity was not apparent in available animal studies.
Cohen et al. (Citation2002) identified a number of cancer epidemiology studies available for the three industrial settings: the FRP industry, manufacture of styrene monomer and polystyrene, and production of SBR. Studies in the FRP industry were considered the most informative given higher exposures to styrene relative to the other industries and less potential for confounding by other possible workplace carcinogens. The authors noted that some of the FRP industry studies found an excess of lung or respiratory tract cancer (Kogevinas et al. Citation1994b, Citation1994a; Okun et al. Citation1985; Wong, Trent, and Whorton Citation1994); however, the pattern of results strongly suggested that the elevated rates were not attributable to styrene. In addition, an excess of lymphatic and hematopoietic (LH) cancers was noted in some studies but not others and that the findings were difficult to interpret given the small number of cases, inconsistent dose–response patterns, and the potential for confounding by other occupational exposures. Cohen et al. (Citation2002) concluded that the balance of epidemiologic evidence did not suggest a causal association between styrene and any form of cancer in humans, although as the statistical power of these studies was limited, the generally inconclusive results could not rule out the relevance to humans of the Cruzan et al. (Citation2001) mouse lung tumor findings.
With the positive mouse lung cancer findings, Cohen et al. (Citation2002) explored the available tumor mode of action (MOA) information including the available information on genotoxicity, non-genotoxic mechanisms, and physiologically based pharmacokinetic models. The authors found this information provided a suggestive basis for conclusions about the MOA by which styrene increases lung cancer risk, but a complete basis for understanding of the interspecies differences in susceptibility was lacking, as was understanding the relative importance of genotoxic and nongenotoxic MOAs at different dose levels. Cohen et al. (Citation2002) noted that because aggregate measures of metabolic activity and styrene oxide (SO) accumulation did not explain the relative susceptibilities of mice and rats to the development of lung tumors, their difference in susceptibility might reflect any of several other possibilities, including: (1) a greater number of Clara cellsFootnote1 in mouse pulmonary tissue than rat pulmonary tissue; (2) a toxicokinetic difference at the cellular level; or (3) a toxicodynamic difference, such as, greater susceptibility at the cellular level to injury due to less efficient DNA repair.
Cohen et al. (Citation2002) review of the available scientific data on styrene carcinogenicity determined the human evidence for styrene was suggestive for carcinogenicity. The authors noted that the epidemiologic studies conducted up to that time did not provide evidence of an increased cancer risk in workers exposed to styrene, whereas the animal bioassays showed an increased occurrence of lung tumors in mice exposed to styrene. Cohen et al. (Citation2002) also found that the mechanistic information suggests that styrene does not appear to be genotoxic, although it is metabolized in both the lung and liver to SO, a potential genotoxic agent. Hence overall, the authors concluded that styrene’s carcinogenic potential in humans could not be ruled out. For risk characterization purposes, Cohen et al. (Citation2002) determined that the MOA information did not support the use of a dose–response model, but rather use of estimated margins of exposure (MOE) considering the possible adverse effects and exposure scenarios was warranted for styrene. Inhalation MOEs were estimated for mouse lung tumorigenicity and for occupationally related hearing impairment, and oral margins of exposure were estimated for male rat reproductive toxicity from a rat chronic bioassay that produced no other adverse effects. The authors considered a MOE lower than 100 for occupational exposures and 1000 for general population exposure as benchmarks for possible health risk concerns.
For general population exposures, Cohen et al. (Citation2002) concluded the estimated MOEs suggested a low concern with respect to nonoccupational exposures to airborne styrene, with the exception of residents exposed continuously to emissions near a hypothetical high-emitting styrene production facility, although noting that the assumptions used to estimate that high-exposure scenario were designed purposely to overstate exposures and that most people living near such facilities would receive substantially less exposure than assumed in the review’s analysis. The MOE estimated for oral exposure to styrene from food, whether naturally occurring or as a result of migration from food packaging or food contact items, were found to be large indicating that the potential risks, if any, would be well below levels of concern.
For occupational exposure, Cohen et al. (Citation2002) noted that the estimated MOE corresponding to the highest occupational exposures to airborne styrene may be of concern, depending on whether or not styrene is a human carcinogen. The authors found that if styrene was a human carcinogen, MOE values for the most-exposed workers in the FRP industry were likely to be less than 100 and might be as small as unity, whereas, even if styrene was a human carcinogen, workers in industries other than FRP were at low to moderate risk (MOE values ranging from 100 to 1000). The MOE for non-cancer effects was found to be well below 100 for workers in the FRP industry and other industry sectors, however noting these effects were generally of moderate severity and may be reversible. Cohen et al. (Citation2002) identified that for some of these workers the MOE could be unacceptably small for more severe effects and hence warrant monitoring and mitigation and that more accurate exposure data and more research on styrene’s potential for ototoxicity, color vision impairment, and immunotoxicity should be further investigated to improve risk characterization.
Cohen et al. (Citation2002) risk assessment identified several sources of uncertainty, including styrene exposure levels among workers and among the general population, styrene’s classification as a possible human carcinogen, and whether styrene exposure truly impairs color vision to any clinically significant extent.
As a result of the conclusions and questions provided by Cohen et al. (Citation2002), SIRC and its international industry partners have sponsored nearly two decades of research and expert assessments on human color vision, ototoxicity, genotoxicity, cancer epidemiology, mouse lung tumor MOA, rat reproductive toxicity and developmental neurotoxicity, and have also performed an assessment of endocrine activity and disruption effects. The following report provides a current review of the styrene-related key health effects endpoints of human and animal cancer, cancer MOA information, and non-cancer neurological and reproductive/developmental toxicity effects; it also provides updates to the assessment of exposure and risk characterization.
Hazard assessment
The following review and assessment of styrene’s toxicology properties (hazard assessment) focuses on the health endpoints identified by Cohen et al. (Citation2002) and others as key areas of concern, specifically rodent cancer, human cancer, human neurotoxicity including ototoxicity and color vision impairment, immunotoxicity, and reproductive/developmental and endocrine activity and disruption effects. There is significant literature reported on these effects and other toxicological endpoints which were extensively reviewed by Cohen et al. (Citation2002); hence, the below review provides only a summary of the historical information and then a more detailed review of the more recent relevant studies.
Cancer
Cancer bioassays
Styrene has been thoroughly tested in animal cancer bioassays with detailed reviews provided by IARC (Citation1994, Citation2002), Cohen et al. (Citation2002) and NTP (Citation2011). No standard bioassays have been reported in the literature for styrene since 2002; however, a chronic mechanistic study aimed at informing on the human relevance of lung tumors was recently completed in mice (Cruzan et al. Citation2017).
Studies in rats
There are eight chronic studies of styrene reported in rats (reviewed in Cruzan et al. Citation2002). One study in which styrene was administered via intraperitoneal injection at 50 mg/rat four times at 2-month intervals and another in which styrene was administered once at 50 mg/rat by subcutaneous injection (Conti et al. Citation1988) were not included in Cruzan’s review because of the low dosages and abnormal study design used. Overall, the rat studies found no consistent increases in tumors, although two studies did observe increases in mammary tumors (). Mammary fibroadenomas in rodents are benign, do not advance to malignant tumors and have no human correlate; therefore, these are not considered relevant for human risk assessment. Malignant mammary tumors (adenocarcinomas) are considered relevant for human risk assessment. Malignant mammary tumors were increased in all tested exposure concentrations in one inhalation study (Conti et al. Citation1988), but not in a gavage study conducted at similar doses at the same laboratory at the same time. Malignant mammary tumors were also found at 600 ppm styrene by inhalation (greater incidence than the concurrent controls but not greater than the historical controls), but not at 1000 ppm (Jersey et al. Citation1978). No increase in mammary tumors occurred from exposure to 50 or 200 ppm styrene by inhalation (Cruzan et al. Citation1998) and a dose-related decrease in malignant mammary tumors was found at 500 and 1000 ppm. When analyzed by cumulative dose, there is no consistent increase in malignant mammary tumors across studies (Cruzan et al. Citation1998).
Table 1. Mammary tumor findings in female rats administered styrene.
Studies in mice
There have been five long-term cancer bioassays of styrene performed in mice, four by gavage and one by inhalation (). In the inhalation study, there were increased lung tumors in male CD-1 mice at 40, 80, and 160 (not 20) ppm and in female CD-1 mice at 20, 40, and 160 (not 80) ppm. The lung tumors were mostly benign and the increase was not seen until after 18 months of exposure (terminal sacrifice occurred at approximately 24 months). In a gavage study, increased lung tumors were found only in males at the high dose (300 mg/kg bw/day for 78 weeks, observed additional 13 weeks) (U.S. NCI, Citation1979a). Tumors in both studies were found in the periphery of the lung which consists of areas of terminal bronchioles and alveoli. Because the origin of the tumors could not be determined by location or cellular anatomy, these tumors are referred to as bronchoalveolar adenomas or adenocarcinomas.
Table 2. Summary of long-term studies of styrene in mice.
A chronic-exposure mechanistic study was recently completed for styrene in mice (Cruzan et al. Citation2017). The objective of this study was to examine the role of mouse cytochrome P-450 2F2 (CYP2F2) and human cytochrome P-450 2F1 (CYP2F1) mediated styrene metabolism on lung toxicity and tumorigenicity for chronic (up to 24 months) exposure to styrene. The study design included evaluation of the human relevance of the CYP2F mediated bioactivation with observations in CYP2F2 knockout and CYP2F1 humanized mice. Tested mice consisted of four strains of male mice: normal C57BL/6 mice (WT, the parental strain for the CYP2F genetically modified mice), CYP2F2 knockout (KO) and CYP2F1 transgenic (TG) mice on the CYP2F2 knockout genetic background, and CD-1 mice that were included for comparison to the previous chronic study that identified styrene as a mouse lung carcinogen over an exposure range of 20–160 ppm styrene. Descriptions of the generation of the KO mice have been described by Cruzan et al. (Citation2012) and Li et al. (Citation2011) and the TG mice described by Cruzan et al. (Citation2013). The TG mice also expressed human CYP2A13 and 2B6. These animals were created by crossbreeding a previously created transgenic strain containing CYP2A13/CYP2B6/CYP2F1 (Wei et al. Citation2012) with the CYP2F2 KO mice.
This study exposed mice to 0 or 120 ppm styrene vapor for 6 hours/day, 5 days/week, for up to 104 weeks with interim sacrifices performed at 1, 26, 52, and 78 weeks. Group sizes for the interim sacrifices were 5 mice and for the chronic exposure were 50 mice per group. The tested styrene exposure concentration was chosen to minimize the possibility of excessive chronic toxicity in the three mouse strains based on C57BL/6 mice included in the study, while at the same time provide an exposure sufficient to present likely toxicity and carcinogenic challenge. The previous inhalation carcinogenicity study in male CD-1 mice found increased lung tumors at 40, 80, and 160 ppm (Cruzan et al. Citation2001) and a 5-day oral toxicity study found styrene to be more toxic to C57BL/6 mice than to CD-1 mice (Cruzan et al. Citation2012). Study evaluations included regular moribundity checks and body weights and lung histopathology and cell proliferation examinations in mice euthanized after 1, 26, 52, and 78 weeks. At 104 weeks, terminal body weights were recorded and lung tissue was collected for histopathology examination.
For in-life evaluations, the study found no clinical signs of styrene toxicity in any of the mouse strains and survivability was generally comparable among the control and treated strains, although the KO mice survival was higher than the other strains. Overall long-term survival was not compromised with the genetic cytochrome P-450 manipulations performed in the mice strains. Body weights were reduced in the CD-1, WT, and KO treated mice relative to controls, whereas weights were comparable for control and treated TG mice.
The lung histopathology findings for each mouse strain at weeks 1, 26, 52, 78, or up to 104 weeks are summarized in . The lung evaluations found cytotoxicity as evidenced by slight degeneration of epithelial cells present in the terminal bronchioles of some CD-1 and WT mice exposed to styrene, but not in KO or TG mice. Hyperplasia was present in the terminal bronchioles in CD-1 and WT mice exposed to styrene, but not in KO or TG mice. Increased cell proliferation, measured by KI-67 staining, was present in CD-1 and WT mice exposed to styrene for 1 week, but not after 26, 52, or 78 weeks, nor in KO or TG mice. Styrene increased the incidence of bronchoalveolar adenomas and carcinomas in CD-1 mice but produced no lung tumor increases in WT despite clear evidence of lung toxicity paralleling that in CD-1 mice. No toxicity or lung tumor increases were observed in KO or TG mice ().
Table 3. Mouse lung histopathology changes in terminal bronchioles following exposure to 0 or 120 ppm styrene.
Table 4. Total proliferative lesions in mouse lungs following exposure to 0 or 120 ppm styrene for up to 104 weeksa.
The tumor rate differences between the CD-1 mice and the WT, KO, and TG mice are likely due to the development of these latter mice strains from C57BL/6 embryonic stem cells (Li et al. Citation2011; Wei et al. Citation2012). C57BL/6 mice are known to be resistant to spontaneous lung tumor development (Malkinson Citation1989; Miller et al. Citation2003) relative to B6C3F1 mice (Haseman, Hailey, and Morris Citation1998) or CD-1 mice (Cruzan et al. Citation2017). Embryonic stem cells from C57BL/6 are commonly used for developing knockout (KO) mice, whereas, a source of embryonic stem cells or procedures for developing KO mice from CD-1 mice were not available. Another factor considered in using the C57BL6 parental strain was a preliminary study (Cruzan et al. Citation2017) that showed 200 or 400 mg/kg bw styrene administered orally for 5 days produced greater BrdU incorporation in the terminal bronchioles of C57BL/6 mice than in either CD-1 or B6C3F1 mice, indicating that the founder C57BL/6 strain used to produce the KO and humanized TG mice strains was clearly susceptible to early-stage styrene lung toxicity equivalent to that seen in CD-1 mice. Therefore, although the control WT, KO, and TG mice had a low rate of tumor development relative to the CD-1 mice, the styrene treated WT mice exhibited lung toxicity as evidenced by the large numbers showing bronchiolar hyperplasia that were comparable to these lung changes observed in the CD-1 mice, whereas neither the KO and TG styrene treated mice demonstrated this lung change.
In parallel with the new 2-year inhalation mouse Andersen et al. (Citation2017) and Andersen et al. (Citation2018) studied gene expression in the lungs of the above described C57BL/6 derived mouse strains (WT, KO, TG) over the different exposure periods. Andersen et al. (Citation2017) examined changes up through 26 weeks of exposure. This study found that after 1-day of exposures at 1, 5, 10, 20, 40, and 120 ppm there were significant increases in differentially expressed genes (DEGs) only in parental strain lungs; an increase in DEGs was apparent at 5 ppm and many thousands of DEGs were observed at 120 ppm. The enrichment findings for 1-day and 1-week exposures included cell cycle, mitotic M-M/G1 phases, DNA-synthesis, and metabolism of lipids and lipoproteins pathways. Over time, the numbers of DEGs decreased steadily with no DEGs meeting both statistical significance and fold-change criteria at 26 weeks. The results at 4 and 26 weeks indicated that some key transcription factors (TFs) – Nr1d1, Nr1d2, Dbp, Tef, Hlf, Per3, Per2, and Bhlhe40 – were upregulated (|FC| > 1.5), while others – Npas, Arntl, Nfil3, Nr4a1, Nr4a2, and Nr4a3 – were down-regulated. At all times, consistent changes in gene expression only occurred in the WT strain. These results support the molecular initiating events (MIE) for styrene of direct mitogenicity from mouse-specific CYP2F2-mediated metabolites activating Nr4a signaling. Longer-term modulating factors (MFs) include down-regulation of Nr4a genes and shifts in both circadian clock TFs and other TFs, linking circadian clock to cellular metabolism. This study found no gene expression changes indicative of cytotoxicity or activation of p53-mediated DNA-damage pathways; both of these findings were inconsistent with the hypothesis that styrene lung toxicity was mediated through formation of the protein- and DNA-reactive styrene oxide metabolite (Cohen et al. Citation2002).
Andersen continued to study the gene expression through the full course of the new 2-year inhalation mouse study and prepared an overall review of the study findings (Andersen et al. Citation2018). This study expanded the findings to include gene expression data at 52, 78, and 104 weeks and found that very few exposure-related responses occurred at any time in KO or TG mice. For short-term exposures, male mice of the strains expressing CYP2F2 had altered expression of thousands of genes and the pathways enriched were similar (including cell cycle, mitosis, DNA replication/repair, lipid/cholesterol metabolism, and immune response) but with very different time courses. The WT mice responded within a single day while the CD-1 mice response required several days of exposure. Benchmark doses for pathway activation were found to be lower by a factor of two in CD-1 mice. At all later times/ages, the changes in gene expression were greatly reduced. With the longer times, exposure-related differentially expressed genes were enriched for the broad category of metabolism, namely biological oxidations in WT and metabolism of lipids and lipoproteins in CD-1 mice. Changes in circadian cycle TF gene expression over time were also more persistent for the CD-1 mice. These gene expression results indicate a non-genotoxic, rodent and rodent strain-specific MOA-related to activation of nuclear receptor signaling with attendant cell proliferation, changes in cellular metabolism and activation of immune response pathways followed by diminished response and adaptation with continued exposure. The differences in lung tumor susceptibility between the C57BL/6 mice and the CD-1, a more tumor-prone strain, appear to relate to the presence of the Pas1 loci, differential basal and styrene-dependent CYP expression and both greater immune system/inflammatory pathway activation and more persistent changes in key circadian TFs in CD-1 mice.
The chronic mouse mechanistic study was a culmination of over a decade of research on styrene mouse lung tumor MOA. The results of this chronic study in CD-1, C57BL/6, and two strains of engineered mice on the C57BL/6 background demonstrate that mouse-specific CYP2F2 metabolism of styrene represents an obligatory key event necessary for the production of downstream biological events ultimately resulting in lung tumors. If this obligatory step is missing (as in the KO mice) or significantly diminished (as in the TG mice), neither lung toxicity nor tumorigenicity occur.
Cancer epidemiology
Cohen et al. (Citation2002) and others (IARC, Citation2002; NTP, Citation2011) identified three industrial settings for cohort and nested case-control studies of styrene workers including, the FRP industry, manufacture of styrene monomer and polystyrene, and production of synthetic rubber (styrene-butadiene rubber, SBR). The FRP industry worker studies are considered the most informative of the occupational studies as these workers had relatively high levels of styrene monomer (10s-100s ppm with peak exposures more than 200 ppm) (Collins, Bodner, and Bus Citation2013; IARC, Citation2002, NIOSH, Citation1982), while in the styrene/polystyrene production and SBR industries exposure to styrene has typically been below 10 ppm (Frentzel-Beyme, Thiess, and Wieland Citation1978; Macaluso et al. Citation2004; Meinhardt, Young, and Hartle Citation1978; Ott et al. Citation1980). In addition, the FRP industry workers have not been widely exposed to known or suspected carcinogens (Collins, Bodner, and Bus Citation2013; NIOSH, Citation1982), whereas workers at styrene/polystyrene production facilities potentially have been exposed to several established or suspected carcinogens (e.g., benzene, dyestuffs, ethylene oxide, 1,3-butadiene, formaldehyde, acrylonitrile, mineral oil, carbon black, cadmium, arsenicals, vinyl chloride, asbestos, and others) (Bond et al. Citation1992; Hodgson and Jones Citation1985; Nicholson, Selikoff, and Seidman Citation1978). FRP industry studies also have included over 100,000 workers exposed to styrene, whereas studies of the other two industry sectors are considerably smaller (about 6000 and 15,000 workers exposed in the styrene/polystyrene manufacturing and SBR industries, respectively). Finally, the FRP industry is the only one of the sectors for which studies of cancer incidence, rather than cancer mortality, has been conducted (Christensen et al. Citation2017; Ruder and Bertke Citation2017).
Based on three FRP worker studies reported through the mid-1990s (Kogevinas et al. Citation1993, Citation1994a, Citation1994b; Okun et al. Citation1985; Wong, Trent, and Whorton Citation1994), Cohen et al. (Citation2002) identified an excess of lung or respiratory cancer; however, the authors found that the pattern of results strongly suggested that the elevations were not attributable to styrene. Specifically, the lung or respiratory cancer excess was confined to workers with lower styrene exposures and there was a lack of evidence of an increase in risk with increasing exposures. In one of the studies (Wong, Trent, and Whorton Citation1994), mortality was also elevated for cervical cancer, cardiovascular disease and nonmalignant respiratory disease suggesting the workforce may be of lower socioeconomic status and may have included a relatively high proportion of smokers. Cohen et al. (Citation2002) also noted that some studies reported an excess of lymphatic and hematopoietic (LH) cancers but that these findings were difficult to interpret given the small number of observed and expected deaths from these cancers, the potential confounding of other occupational exposures, the lack of consistent dose–response patterns, and the absence of clear excess LH cancers in the highest exposure groups. Overall, Cohen et al. (Citation2002) concluded that the epidemiologic evidence did not suggest a causal association between styrene and any form of cancer in humans but, given the limited statistical power of these studies, these studies were inadequate to discern the association of styrene and LH cancer.
Since the Cohen et al. (Citation2002) review, nearly all the FRP worker studies have been updated as well as updates performed in one other industry sector, and additional general population epidemiological studies are available.
The Okun et al. (Citation1985) study of a cohort of workers at two FRP boatbuilding plants has been updated by Ruder et al. (Citation2004) and then again by Ruder, Meyers, and Bertke (Citation2016), Ruder and Bertke (Citation2017) and Bertke, Yiin, and Daniels (Citation2018). This cohort is the smaller of the two U.S. FRP studies, the other being the Collins, Bodner, and Bus (Citation2013) and predecessor study by Wong (Citation1990, Citation1994). The mean length of follow-up in the Ruder et al. (Citation2004, Citation2016) updates is 35 years. The original study included a survey of styrene exposure levels in specific departments at the facilities. Although quantitative historical exposure estimation for the cohort members was performed, Ruder, Meyers, and Bertke (Citation2016) did not report numerical data on the results of cumulative exposure analyses but rather reported the detailed analyses of specific forms of cancer that were limited to exposure proxies including duration of employment and employment in high-exposure jobs (fibrous glass or lamination) versus other jobs with lower exposure. Other limitations of this study include imprecision due to small study size, lack of information on lifestyle factors, and failure to analyze high versus low styrene exposure in a time-dependent manner.
Two additional updates to this cohort have been published since 2016, including Ruder and Bertke (Citation2017) and Bertke, Yiin, and Daniels (Citation2018). Ruder and Bertke (Citation2017) examined cancer incidence from 1991–2007 among 3704 workers of the Washington state cohort living in Washington with no restriction on duration of employment using data from the Washington State Cancer Registry and applying statistical methods similar to those used by Ruder, Meyers, and Bertke (Citation2016). The results found standardized incidence ratios (SIR) of lung cancer of 1.11 (95% CI 0.89–1.37) and 1.42 (95% CI 1.00–1.95) for the total population of workers and for workers with potential high exposure to styrene, respectively. Corresponding SIR values for these groups were 1.03 (95% CI 0.77–1.35) and 0.99 (95% CI 0.59–1.57) for LH cancers, 1.00 (95% CI 0.75–1.32) and 1.17 (95% CI 0.70–1.82) for urinary tract cancers, and 0.81 (95% CI 0.50–1.23) and 0.88 (95% CI 0.49–1.45) for breast cancers. The main strengths of this study are its inclusion of workers with relatively high exposure to styrene and its use of cancer incidence, rather than cancer mortality, as the outcome of interest. The study has important limitations, including statistical imprecision, lack of analyses that considered time since first exposure to styrene and duration of exposure/employment, and inability to control for potential confounding by lifestyle risk factors or occupational exposures in work before and after employment at the study facilities. Positive associations reported by Ruder and Bertke (Citation2017) were due in large part to unexplained deficits of cases in the low styrene exposure subcohort compared to the general referent population based on the Surveillance, Epidemiology, and End Results (SEER) program data, and not to any excess in the high exposure subcohort. Furthermore, the elevated SIRs and SRRs (standardized rate ratios) for specific forms of cancer reported in this study were statistically imprecise. Thus, non-causal explanations of the results are plausible. The cancer incidence study adds little to the previous mortality study (Ruder, Meyers, and Bertke Citation2016) of workers at the same facilities.
Bertke, Yiin, and Daniels (Citation2018) reported on cancer mortality from 1959–2016 for 5201 workers in the Washington state cohort. Exposure levels reported between 1978–1979 for full shift average for workers ranged from 42.5 to 71.7 ppm styrene. In this update, for workers with more than one year of employment, many cancer sites showed increased SMRs (standardized mortality ratios) when compared to Washington state expected values including lung cancer (SMR 1.20, 95% CI 0.95–1.51) whereas increases were not observed for cancer of buccal cavity and pharynx, breast, non-Hodgkin lymphoma (NHL) or leukemia. In internal analyses, for leukemia, there was a suggestion of an exposure response as risk increased with increasing duration in the high-exposed group (relative risk, “RR” per year: 1.6, 95% CI 1.2–2.2). Study strengths are the high styrene exposure levels, long follow up, and few competing risk factors. Limitations of this study are important, including, the small size of the study, the limited exposure characterization, and the lack of information on smoking status and other lifestyle factors. In addition, as mentioned by the authors, the study’s observed association between styrene exposure and leukemia does not have consistent external support from studies of other cohorts occupationally exposed to styrene. Consequently, firm conclusions of cancer risks, or lack thereof, due to styrene exposure are not warranted. As the authors noted, the study results should be interpreted cautiously given these limitations.
Collins, Bodner, and Bus (Citation2013) is the larger of the two available cohort studies of U.S. FRP workers and covers 15,826 workers at 30 plants. The mean length of follow-up in the Collins updated study was 35 years. This study used data from industrial hygiene surveys conducted at each plant when the study began, as well as historical industrial hygiene and process records linked to subjects’ detailed work histories, in order to develop quantitative estimates of workers’ exposure to styrene. Workers had styrene time-weighted average (TWA) exposures for an 8-h work day of about 35 ppm in 1967 and about 25 ppm in 1977. Over the entire study period, the average styrene TWA was 28 ppm. The lung cancer findings observed in the Collins, Bodner, and Bus (Citation2013) study and other studies that have found increases may be confounded by smoking. In the Collins, Bodner, and Bus (Citation2013) study excesses of non-malignant respiratory disease, which is associated with smoking, paralleled lung cancer excesses. An earlier study of the same cohort investigated by Collins, Bodner, and Bus (Citation2013) included a nested case-control study of respiratory cancer in which data on smoking were obtained (Wong Citation1990). The latter study, which included 40 cases who had died of respiratory cancer and 102 deceased controls, reported that respiratory cancer was associated positively with smoking but not with direct exposure to styrene, duration of direct exposure to styrene, or type of styrene process. Exposure to asbestos in some FRP plants studies has also been suggested as another potential confounder. The strengths of this study are its industry-wide design, the relatively high quality of its styrene exposure estimation, the relatively high styrene exposure of the workers, the long follow-up period, and the thorough exposure-response analyses performed for certain cancers. The study’s limitations are its reliance on mortality data to determine cancer outcomes and lack of information on lifestyle factors that were potential confounders for some of the cancers analyzed and, because of its moderate size and reliance on cancer mortality, the study’s results for some cancers (for example, rare cancers and cancers associated with good survival) were imprecise.
The large international cohort study of European FRP workers was originally reported by Kogevinas et al. (Citation1993, Citation1994a, Citation1994b) and included several hundred facilities in the FRP industry in Denmark, Finland, Norway, Sweden, Italy, and the United Kingdom. This study included workers reported in Danish studies (Kolstad et al. Citation1995; Kolstad, Lynge, and Olsen Citation1993; Kolstad et al. Citation1994) and workers included in studies in the United Kingdom by Coggon (Citation1987). Workers entered the international cohort of Kogevinas in 1945 through 1970 and were traced to determine the cohort’s mortality experience through a calendar year that varied by country and ranged from 1987–1991. Styrene exposure estimation was based on detailed job histories available for some facilities, on industrial hygiene and production data from several countries, or on biological monitoring data. The workers that were laminators had the highest average styrene exposures, estimated to have been about 200 ppm in the late 1950s, 100 ppm in the late 1960s, and falling to about 20 ppm in the late 1980s. Styrene exposure estimation for individuals was based on workers’ longest-held job (e.g. laminators – 43 ppm, unspecified jobs – 29 ppm, other exposed jobs – 15 ppm, unexposed job, unknown). Due to lack of detailed work histories, all Danish and Finnish workers and many Swedish workers were classified as having unspecified jobs and were assigned an average of 29 ppm. Strengths of this study are the inclusion of comprehensive analyses of several indices of styrene exposure (job type, duration of employment, ppm-years) for many forms of cancer, as well as analyses by time since first exposure. Limitations of the study include lack of detailed job information for a high proportion of cohort members, lack of information on lifestyle factors, a high proportion (40% overall) of subjects employed in the industry for less than one year, and the use of cancer mortality, rather than cancer incidence, as the outcome of interest.
This international cohort study has been the subject of a recent re-analysis that is reported in Loomis et al. (Citation2019). The original study on FRP industry workers included 40,668 workers with 539,479 person-years. The countries in this study include Denmark, Finland, Italy, Norway, Sweden, and the United Kingdom. The Loomis et al. (Citation2019) study re-analyzed a portion of this study population and has 37,021 workers with 506,459 person-years. The Loomis et al. study did not include data from the more recent follow-up periods of the Danish and United Kingdom cohorts that were analyzed by Christensen et al. (Citation2017, Citation2018) and Coggon et al. (Citation2015) but instead, only reanalyzed the original follow-up period. The Loomis et al. study concentrated on cancers of the LH tissues and used the most recent classifications of what is considered NHL. Cancers of secondary interest were lung esophagus, kidney, and pancreas. The exposure assessment in the study appears to use the same approach as the original study. The Loomis et al. study examined cumulative exposure, mean exposure, duration of exposure, and jobs with likely high exposure to styrene (i.e., laminators). Poisson regression was used to calculate rate ratios with follow-up time treated as the time axis. Other factors considered were age, calendar date, sex, country, length of follow-up, and time since first exposure. The “best model” was determined by the set of variables which produced the best fit and the largest change in the relative risk. Latency effects were examined by lagging exposures 0, 5, 10, and 20 years. The findings for cancers of the LH tissues including NHL were similar to the original study. With the exception of NHL, cancers in this category were not statistically associated with styrene exposure. However, NHL was related to mean styrene exposure but not cumulative exposure. There was no association with styrene exposure for lung and kidney cancer, but there were statistically significant associations for esophageal cancers for both cumulative exposures lagged 20 years and mean exposure (sometimes referred to as average exposure) regardless of the lag period used. Pancreatic cancers were associated with mean styrene exposure but not with cumulative exposure, and the positive association with mean exposure was statistically significant only when no lag period was used. The authors conclude the findings for lung cancer and NHL were unchanged from the original study, but the new findings for esophageal and pancreatic cancer merit further investigation. This study was well analyzed in keeping with the current accepted methodology for occupational cohort studies. The exposure characterization appears generally well done, although potential exposure misclassification still is a limitation, given the lack of detailed job and task information for a large proportion of the cohort. Further, this study update allows consideration of the findings of this study in the context of recent updates of the Danish and United Kingdom studies of FRP workers.
There are some limitations to this study. First, there was potential for confounding. The use of internal analyses does not ensure that confounding by non-occupational factors is controlled. Although other occupational exposures in the FRP industry may not be a concern, because of the short duration of employment in the FRP industry, occupational exposures in other industries may have had an impact on results. Second, the unexposed group of workers should have been discussed in more detail. The authors mention some of these workers were “clerical” and thus may be very different from exposed workers in education, lifestyles, and habits. Loomis et al. make a statement (in Methods) that implies that clerical workers were classified as unexposed: “ … clerical personnel who worked in the industry but were not regularly exposed to styrene were classified as unexposed.” It may be of interest that the unexposed subcohort had a statistically significant deficit of esophageal cancer deaths in the SMR analysis reported earlier by Kogevinas et al. (Citation1994a, Citation1994b). However, it is not possible to definitively estimate the impact of the unexposed on the results, as Loomis et al. did not do exposure-response analyses restricted to the exposed, as was done by Kogevinas et al. (Citation1994a, Citation1994b). Third, there were many models examined but only a few models presented in the results. The authors mention that models presented in the paper were selected by fit and with the variables which “appreciably changed” the relative risk. For NHL, the variables in the model were age, calendar time, and sex, but for esophageal and pancreatic cancer only age was included. However, the results for the full model with all variables for each cancer evaluated were not presented. It is not clear how many models were examined and how many of these did not have statistically significant findings. Finally, most of the findings of effects in this study were observed when mean (average) styrene exposure was used in the model. Mean exposure is the arithmetic mean of past exposures and has been used in occupational studies to examine partially reversible effects such as pulmonary function. When examining cancers, however, cumulative exposure – the product of intensity and duration – is generally considered more appropriate for examining irreversible effects. The authors also did not address the lack of associations when cumulative exposure models were employed as in the case of pancreatic cancer and in most of the models of esophageal cancer. Loomis et al. do comment about this, as follows, in the Discussion: “The observed tendency for several cancers to be associated with mean, but not cumulative styrene exposure may be related to the short duration of exposure for most workers, which would minimize contrast in cumulative exposure.” However, the data provided in the paper do not clearly support this interpretation: the mean values and ranges of exposures variables in the cohort were mean = 63.1, range = 0–205 ppm for mean styrene exposure and mean = 158 and range = 0–4543 ppm-years for cumulative styrene exposure ( of Loomis et al. Citation2019).
The studies of the Danish FRP industry workers were reported by Kolstad, Lynge, and Olsen (Citation1993); Kolstad et al. (Citation1994, Citation1995) and contribute to the international cohort study discussed above. The Danish cohort was recently updated by Christensen et al. (Citation2017, Citation2018), and Nissen et al. (Citation2018). The earlier Kolstad studies included workers employed between 1964 and 1988 at 386 companies. Christensen et al. (Citation2017) expanded the cohort to include workers employed between 1964 and 2007 at 443 companies and extended follow-up to identify incident cancer cases diagnosed from 1968 through the end of 2012, adding more than 20 years of follow‐up to the earlier studies. In addition, Christensen et al. (Citation2017) used data from a worker survey to estimate the probability of exposure to styrene at each company and to obtain data on workers’ tobacco smoking patterns; analyzed cancer incidence in relation to three surrogate measures of styrene exposure; and assessed potential confounding by smoking. The main conclusion of Christensen et al. (Citation2017) was that “Occupational exposure may be associated with Hodgkin lymphoma, myeloid leukemia, and cancer of nasal cavities and sinuses. Further studies are needed to evaluate if the observed associations are likely to be causal.” Also, of importance are the findings that an increased incidence of lung/bronchus/trachea cancer seen in some analyses could have been due to confounding by smoking; that an observed 2.5-fold increase in mesothelium cancer (mesothelioma) was likely attributable to shipyard employment, rather than to exposure to styrene; and that NHL, lymphoid leukemia, multiple myeloma and a number of other cancers of a priori interest were not associated positively with styrene exposure. The study has several notable strengths, including large size, long follow-up, and use of cancer incidence rather than cancer mortality as the endpoint of interest. Major limitations are lack of information on specific jobs held by workers and the consequent lack of quantitative estimates of cumulative exposure to styrene; lack of analyses of cancer incidence by exposure categories specified on the basis of both probability of exposure and duration of employment/potential exposure; lack of internal analyses of styrene exposure proxies; and the possibility of residual confounding by tobacco smoking, other non-occupational factors and occupational exposures other than styrene. The statistical associations reported by Christensen et al. (Citation2017) for styrene and Hodgkin lymphoma, myeloid leukemia, and cancer of the nasal cavities and sinuses lack external support and are not interpreted as causal associations, and the study’s results for myeloid leukemia were not statistically significant. The study provides evidence that previously reported associations between styrene and cancers of the esophagus, pancreas, lung, kidney, and bladder may be non-causal, and it found no positive association between styrene and NHL, Hodgkin lymphoma, lymphoid leukemia or multiple myeloma.
Christensen et al. (Citation2018) report on a study of LH cancer incidence among workers exposed to styrene in the Danish FRP industry. This study adds to the Christensen et al. (Citation2017) study of the same cohort of workers (with minor changes). Christensen et al. (Citation2018) enhanced the methodologic approach of the earlier paper in several major ways, including improved exposure estimation, analysis of subtypes of LH cancer not examined in the 2017 study (the 2018 study analyzed a total of 21 types of LH cancer), use of an internal referent group and inclusion of analyses of LH cancer incidence in relation to multiple time-dependent exposure indices and induction time/latency. The follow-up period of the new study was 1968 through 2011. The 2017 study by Christensen et al. includes findings of positive statistical associations between surrogate styrene exposure variables (“probability” of exposure to styrene) and overall myeloid leukemia and Hodgkin lymphoma but the authors acknowledged that “Further studies are needed to evaluate if the observed associations are likely to be causal.” Christensen et al. (Citation2018) is a further investigation that contributes to the knowledge base for styrene and LH cancer. It analyzed subtypes of myeloid leukemia, lymphoid leukemia, and NHL, included new analyses of multiple myeloma and Hodgkin lymphoma and analyzed several types of LH cancer not included in Christensen et al. (Citation2017). Findings of Christensen et al. (Citation2018) included a positive association between cumulative exposure to styrene and acute myeloid leukemia in a subgroup of the cohort and positive but statistically less impressive associations with Hodgkin lymphoma and T-cell lymphoma (no significant trends were found with any measure). Other important findings included null results for styrene and overall NHL, the most numerically important subtypes of NHL (including multiple myeloma), other subtypes of leukemia, myelodysplastic syndrome, and polycythemia vera. The evidence for a causal association between styrene and acute myeloid leukemia, Hodgkin lymphoma and T-cell lymphoma remains inconclusive because of the uncertain styrene exposure estimates and consequently a high likelihood of exposure misclassification, lack of control of confounding by cigarette smoking, lack of information on other occupations held by short-term workers, and, despite the large size of the overall study, the relatively small numbers of outcomes available for analysis (acute myeloid leukemia, 50; Hodgkin lymphoma, 57; T-cell lymphoma, number not reported) and the resulting statistical imprecision of the results. The null results for other forms of NHL are based on large numbers and are an important contribution to the relevant literature.
In a case-control study nested within the Danish FRP industry cohort, Nissen et al. (Citation2018) analyzed the association between styrene exposure and sinonasal cancer incidence among the 73,092 workers included in Christensen et al. (Citation2017). The original study reported 40 sinonasal cancers, whereas Nissen et al. (Citation2018) reports on 37 sinonasal cancer from the original study including 9 adenocarcinomas, 15 squamous cell carcinomas, and 13 other histologic types. There was no explanation for the differences in the numbers between the two versions of study. The observed 9 cases of sinonasal adenocarcinomas corresponded with an imprecise five-fold increased age, sex and wood industry-adjusted odds ratio (OR) for high versus low cumulative styrene exposure (OR 5.11, 95% CI 0.58–45.1). The incidence increase was confined to exposure received during the most recent 15 years. No association was found for the other histological subtypes. Given the potential for confounding exposure to wood dust in this industry, the authors should have committed more time to understand the exact nature and levels of potential wood dust exposures. The categories used in this study to classify employment in the wood industry (never, ever, unknown) are far too crude to examine such a powerful potential risk factor as wood dust. A strength of this study is the specific histological information, but major limitations are the small numbers of cancers included and the potential confounding with wood dust exposure in this study which make it difficult to assess the impact of styrene exposure on the risk of sinonasal cancer. This study does not support a causal interpretation of the reported association between styrene and sinonasal adenocarcinoma because chance and residual confounding by exposure to wood dust cannot be reasonably ruled out.
The Nissen et al. (Citation2018) study findings initiated a letter to the editor by Harris et al. (Citation2019) on some additional information on sinonasal cancer on the United Kingdom FRP study by Coggon et al. (Citation2015) that is described in more detail below. The Coggon et al. (Citation2015) study found no sinonasal cancers deaths with a standardized mortality ratio (SMR) of 0.0, but failed to report the expected number of cancers. The letter by Harris et al. (Citation2019) provides the expected number of sinonasal cancers from the Coggon et al. study as 1.2 expected and concludes that while the number of sinonasal cancers is rare, their study provides “no additional support for this hazard.” The Harris et al. letter mentions it would be helpful to know the observed and expected sinonasal cancers risk in other studies that were not reported especially for populations unlikely to have significant wood dust exposures.
Coggon et al. (Citation2015) is an update of the United Kingdom FRP workers cohort study that was first published by Coggon in 1987 (study included in Kogevinas et al. Citation1994b, Citation1994a, Citation1993). The update extended the follow-up to December 2012 for 7970 workers at eight companies in England and compared workers’ mortality to that of the general population of England and Wales using SMRs and included a supplementary nested case-control analysis that compared styrene exposures, lagged by 5 years in 122 incidents or fatal LH cancer cases and 1138 matched controls. For LH cancer, no elevation of mortality was observed in either the full cohort (62 deaths, SMR 0.9, 95% CI 0.69–1.15), a subgroup with more than background exposure to styrene (38 deaths, SMR 0.82, 95% CI 0.58–1.14) or in the case-control analysis. For NHL/chronic lymphocytic leukemia in comparison with background exposure, the OR for workers with high exposure (estimated 8-h time-weighted average of 40–100 ppm) for ≥1 year was 0.54 (95% CI 0.23–1.27). Lung cancer mortality was found to be significantly elevated, and risk increased progressively across exposure categories, with an SMR of 1.44 (95% CI 1.10–1.86) in workers highly exposed for ≥1 year, although the author’s noted that lung cancer association is not consistently supported by other studies and may have been confounded by smoking. The study’s strengths are the inclusion of a substantial proportion of cohort members with high exposure, long follow-up, inclusion of nested case-control analyses of LH cancer deaths, and registrations and analyses of time-dependent exposure variables. Limitations of the study are a lack of quantitative estimates of cumulative exposure to styrene, lack of data on lifestyle factors, lack of analyses of cancer incidence for forms of cancer other than LH cancer, and a relatively high proportion of subjects lost to follow-up.
For the other industrial sectors with styrene exposures, no updates have been performed to the styrene monomer and polystyrene cohorts (Bond et al. Citation1992; Frentzel-Beyme, Thiess, and Wieland Citation1978; Hodgson and Jones Citation1985; Nicholson, Selikoff, and Seidman Citation1978; Ott et al. Citation1980) whereas several updates have occurred for the SBR worker cohort. The most recent update for SBR workers is reported by Sathiakumar et al. (Citation2015), which now follows this cohort from 1944 through 2009, adding 11 years of mortality data to previous updates (Delzell et al. Citation2001, Citation2006; Graff et al. Citation2005). The investigators, using Cox regression to evaluate the exposure response-relationship between 1,3-butadiene and styrene ppm-years and leukemia, NHL and multiple myeloma, found significant positive exposure-response trends for cumulative butadiene and styrene exposures and leukemia. Given the strong correlation between the styrene and butadiene exposures, it was not possible to separate out the effects of the two exposures. There was no evidence for either substance of an association with multiple myeloma, whereas for NHL, styrene, but not butadiene, produced a positive association, although the author’s noted the exposure response data were statistically imprecise.
Besides the occupational cohort studies, there are other studies that evaluated styrene and cancer, including cohort and nested case-control studies of workers in various industries in which styrene was not a main exposure of interest (Budroni et al. Citation2010; Guénel et al. Citation2002; Marsh et al. Citation2001; Radican et al. Citation2008); population- and hospital-based case-control studies that evaluated the relation between occupational exposure to styrene and other agents and various cancers (Blanc-Lapierre, Sauve, and Parent Citation2018; Cantor et al. Citation1995; Gérin et al. Citation1998; Cocco et al. Citation2010; Costantini et al. Citation2008; Dumas et al. Citation2000; Flodin et al. Citation1986; Karami et al. Citation2011; Miligi et al. Citation2006; Scélo et al. Citation2004; Seidler et al. Citation2007; Siemiatycki Citation1991); a prospective cohort study of environmental exposure to styrene and other hazardous outdoor air pollutants and the risk of invasive breast cancer (Garcia et al. Citation2015); and ecologic studies that investigated environmental exposure to styrene and cancer (Bulka et al. Citation2016; Coyle et al. Citation2005). These study types are less informative than the occupational cohort studies given generally lower number of subjects and imprecise exposure information.
Epidemiology reviews
IARC has recently completed review of the styrene human cancer epidemiology information and concluded that there is limited evidence in humans for carcinogenicity of styrene (IARC Monographs Vol 121 Group Citation2018). This is the same conclusion IARC made in its 2002 review. In IARC’s present review, for lymphohematopoietic malignancies, the Agency noted increased incidence or mortality of subtypes of leukemia and lymphomas in several studies, with greater consistency for leukemia, and in particular myeloid leukemia. IARC also found the incidence of sinonasal adenocarcinoma, a rare cancer, was increased in one large cohort of FRP workers, but cases were few and chance and confounding could not be ruled out. The evidence for solid tumors, including lung cancer, was found to be sparse or inconsistent. Overall, IARC concluded that the human cancer information provides credible evidence that exposure to styrene causes lymphohematopoietic malignancies, but confounding, bias, or chance cannot be ruled out.
Collins and Delzell (Citation2018) performed a systematic review of the styrene epidemiology studies published through June 2017 (their review does not include the several study updates that have been published since June 2017) and a meta-analysis of the risk of cancers identified in previous reviews as possibly increased by styrene exposure. Methodological limitations of the available research and of the meta-analyses included reliance on mortality data rather than on cancer incidence data in many studies, lack of quantitative estimates of styrene exposure for individual subjects in most of the studies, and lack of information of lifestyle factors in most of the studies. Results from cohort and case-control studies for forms of cancer with data from at least two studies were eligible for meta-analysis of dichotomous exposure. Each meta-analysis included RR estimates for dichotomous styrene exposure. Meta-analyses estimated both fixed-effects and random-effects meta-RRs with 95% CIs. Meta-RR estimates from fixed-effects and random-effects models were compared to evaluate between-study heterogeneity in the RRs. As a further, quantitative measure of between-study heterogeneity,Footnote2 I2 was calculated to assess the percentage of between-study variance in RRs that is attributable to study heterogeneity as opposed to chance. Meta-analyses of exposure-response data were deemed not possible as: (1) among studies that did not use quantitative estimates of styrene exposure intensity or cumulative exposure, exposure settings were diverse, and surrogate measures such as duration of exposure and qualitative categories of exposure intensity were heterogeneous; and (2) among studies that did use quantitative estimates of styrene exposure, exposure categories were heterogeneous. However, the authors included a narrative review and summary of exposure-response data for each study and for each form of cancer of a priori interest. The authors also conducted sensitivity analyses to evaluate potential sources of heterogeneity on meta-RR results.
The Collins and Delzell (Citation2018) review included consideration of the completeness of reporting of results for styrene and specific forms of cancer and noted if any cohort study of styrene-exposed subjects failed to include results for certain specific forms of cancer. Another consideration was the possibility that null results for styrene and a form of cancer were not reported in cohort studies examining the relation between exposure to multiple agents and multiple outcomes and in case-control studies that assessed multiple agents. In the meta-analyses, evidence for publication bias was assessed when there was no evidence of heterogeneity by inspecting funnel plot symmetry using the approach of Egger et al. (Citation1997).
The cumulative epidemiologic evidence for a causal relationship between styrene and each form of cancer of a priori interest was assessed qualitatively, as well as additional cancers for which excesses were seen in multiple independent studies included in the current review. The author’s evaluation summarized the strengths and limitations of the cumulative body of evidence available for each form of cancer using Hill’s guidelines as a framework (Hill Citation1965), while placing more emphasis on consistency across studies, strength of associations, and presence of exposure-response in the studies. The potential for confounding exposures was also considered for explanations of observed associations.
The relative risk results for selected cancers from the Collins and Delzell (Citation2018) meta-analysis of the styrene-exposed worker human studies are presented in . The meta-analyses compared cancer risks in workers with any level or amount of exposure to styrene to those with no exposure.
Table 5. Relative risks of selected cancers from meta-analysis of human studies of styrene-exposed workers.
For NHL cancers, Collins and Delzell (Citation2018) evaluation found that studies of the FRP industries, on average, had the highest styrene exposures, and four of the five studies of this industry showed no increase in the risk of NHL overall or in analyses that considered induction time and exposure-response (Christensen et al. Citation2017; Coggon et al. Citation2015; Collins, Bodner, and Bus Citation2013; Ruder, Meyers, and Bertke Citation2016). The study by Kogevinas et al. (Citation1994a) found no excess of NHL in the overall exposed cohort and a non-statistically significant increase in NHL deaths among workers with at least 20 years since hire, based on 4 observed compared to 2.6 expected deaths. Overall, Collins and Delzell (Citation2018) found that the available studies of styrene exposure and NHL do not demonstrate an association with any exposure to styrene and do not demonstrate consistent and statistically precise exposure-response trends and that the methodologically-stronger recent cohort studies of FRP industry workers, and the overall evaluation of study results, provide little support for a causal association between styrene and NHL.
For leukemias, the meta-analyses found no association between any exposure to styrene and overall leukemia in all 13 studies included in the analysis or in five studies of workers in the FRP industry. For all types of leukemia, the authors observed that no study found consistent evidence of a positive exposure-response trend. The Christensen et al. (Citation2017) study of FRP workers appeared to have an elevated RR for all leukemia in the highest exposure category for one out of three exposure metrics analyzed, and the relatively small study of Ruder, Meyers, and Bertke (Citation2016) also found an elevated, but statistically imprecise risk of leukemia among workers with high exposure employed for at least one year. Among all relevant studies, excluding studies of synthetic rubber industry workers because of potential confounding by butadiene, there was no overall association between styrene exposure and lymphoid leukemia. For myeloid leukemia, the meta-analysis found little association with any exposure to styrene among all studies or the FRP worker studies.
The meta-analysis found considerable consistency across studies, with results indicating the absence of an association between any styrene exposure and esophageal cancer. Four of five FRP worker studies found elevated SMRs, SIRs or RRs in some, but not all, higher exposure categories, but most of the associations were weak, and results were based on small numbers and were imprecise. Given the absence of an association with any exposure to styrene, the relatively sparse and inconsistent exposure-response data and the lack of control for smoking and other non-occupational risk factors, the authors concluded that it is difficult to determine if esophageal cancer is associated with styrene exposure, but if there is an increased risk, it appears to be very small.
For pancreatic cancer, the data for any styrene exposure were consistent with an absence of any association. Examining exposure-response, Kogevinas et al. (Citation1994a) reported a trend with styrene exposure levels and pancreatic cancer, but this relationship was not observed in other studies (Christensen et al. Citation2017; Coggon et al. Citation2015; Collins, Bodner, and Bus Citation2013). The absence of an increased risk overall, and the consistency of findings across studies of different industries and study designs supports the absence of a relationship. The trend of increasing risk with increasing exposure in only one study, without consistent support from other studies, represents weak evidence of an association between styrene exposure and pancreatic cancer.
Positive associations with styrene exposure and lung cancer were found in the four recently updated studies of FRP workers with long follow-up (Christensen et al. Citation2017; Coggon et al. Citation2015; Collins, Bodner, and Bus Citation2013; Ruder, Meyers, and Bertke Citation2016) with three of the four studies reporting similar excesses among both male and female workers and the fourth study not reporting results separately by gender. No association between styrene exposure and lung cancer was observed in the two older and smaller studies with shorter follow-up (Antilla et al. Citation1998; Kogevinas et al. Citation1994a). In other industry studies, the four studies of styrene monomer and polymer workers found no association with lung cancer; a study of synthetic rubber industry workers found a positive association among women and no association among men, and three other studies found no association. Confounding by smoking was considered as a probable explanation of some or all of the excesses of lung cancer seen in the recently updated cohort studies of FRP workers. For the lung cancer reported in Christensen et al. (Citation2017), the authors analyzed the possible impact of confounding by smoking on the positive association between styrene and lung cancer and concluded that the cohort could have a slightly increased risk of lung cancer due to a higher prevalence of smoking among these workers compared to the general population of Denmark. Excesses of non-malignant respiratory disease, which is associated with smoking, were found to parallel lung cancer excesses in the studies of Collins, Bodner, and Bus (Citation2013) and Ruder, Meyers, and Bertke (Citation2016). Exposure to asbestos has been suggested as another potential confounder in the FRP industry studies (Collins, Bodner, and Bus Citation2013) or in other industries (Christensen et al. Citation2017). Additionally, the interpretation of the excess of lung cancer seen in FRP workers in recent studies is further complicated by inconsistencies among the studies in the exposure-response results. Collins, Bodner, and Bus (Citation2013) and Christensen et al. (Citation2017) found no evidence of positive exposure-response trends; instead, the study results suggested an inverse trend. In contrast, Coggon et al. (Citation2015) study found a positive exposure-response association between styrene and lung cancer. Ruder, Meyers, and Bertke (Citation2016) noted that among workers employed for at least one year, the lung cancer SMR was greater among those with high exposure than among those with low exposure, but that an internal analysis found a statistically non-significant inverse association between level of styrene exposure and lung cancer. Overall, the available information provides inconsistent evidence that workplace exposure to styrene causes lung cancer in humans, with most studies indicating no valid association. Alternative explanations of confounding by smoking and possibly other occupational exposures cannot be ruled out in lung cancer excesses observed in some FRP workers. The results of the worker studies of the FRP industry lack consistency with regard to exposure-response trends and the synthetic rubber industry study results were inconsistent for men and women and are, therefore, inconclusive.
The meta-analysis results for kidney cancer indicate a weak overall association with styrene exposure. Exposure-response results suggested a positive trend for kidney cancer with increasing exposure in Collins, Bodner, and Bus (Citation2013) and in Ruder, Meyers, and Bertke (Citation2016), although the latter result was quite imprecise. Christensen et al. (Citation2017) found a 31–36% increased risk of kidney cancer in the high exposure and longest duration of employment subgroups, although these results were not statistically significant, and consistent trends were not evident. Coggon et al. noted a slightly elevated SMR among workers classified as having the highest level of exposure for at least one year. None of the cohort studies, however, controlled for lifestyle factors that could increase the risk of kidney cancer, such as smoking and obesity, as well as other occupational exposures that may be associated with kidney cancer. Overall, the available epidemiologic data provide inconclusive evidence that workplace exposure to styrene causes kidney cancer in humans. This conclusion is supported by the weak association, exposure-response results that were inconsistent across studies, and confounding by smoking and, possibly, by other lifestyle factors and other occupational exposures that could not be ruled out as alternative explanations of the weak statistical association observed for styrene and kidney cancer.
In summary, the Collins and Delzell systematic review (Citation2018) found no strong and consistent indication of a causal association between styrene and NHL, subtypes of NHL, all leukemia, subtypes of leukemia or cancers of the esophagus, pancreas, lung, kidney, or other sites. The authors’ concluded that with consideration of all pertinent data, including substantial recent research, the epidemiologic evidence on the potential carcinogenicity of styrene is inconclusive and does not establish that styrene causes any form of cancer in humans.
Cancer mode of action
Evaluations of styrene’s cancer mode of action (MOA) have focused primarily on the mouse lung tumors as this provides the strongest cancer signal associated with styrene exposure. The cancer MOAs that have been historically examined include genotoxicity and non-genotoxic mechanisms. For styrene, Cohen et al. (Citation2002) found that while the available data suggest that the mouse has a greater metabolic capacity for conversion of styrene to SO than other species, as well as a greater pharmacodynamic response particularly with respect to lung tumor induction, the information was insufficient to identify those specific characteristics of mice that make them more susceptible than rats to the development of styrene-induced lung tumors. The authors noted that the inability to conclusively explain species differences (rat versus mouse) in tumor susceptibility on the basis of pharmacokinetic or other mechanistic considerations made it difficult to determine whether human response to styrene is likely to be closer to that of mice or rats. Overall, Cohen et al. (Citation2002) found that the available scientific information provided only a suggestive basis for conclusions about the MOA by which styrene increases lung cancer risk, given that a complete basis for understanding of the interspecies differences in susceptibility was lacking, as was an understanding of the relative importance of genotoxic and nongenotoxic MOAs at different dose levels. The authors postulated that the increase in susceptibility to lung tumors in mice but not rats might reflect any of several other possibilities, including: (1) a greater number of Clara cells in mouse pulmonary tissue than rat pulmonary tissue; (2) a pharmacokinetic difference at the cellular level; or (3) a pharmacodynamic difference, for example, greater susceptibility at the cellular level to injury due to less efficient DNA repair.
Since Cohen et al. (Citation2002) evaluation, the body of information on styrene’s genotoxicity and non-genotoxicity MOAs has significantly increased. Much of the research has been focused on the effects of styrene and/or its reactive epoxide metabolite, SO. In addition to new research, reevaluations of some of the older studies based on more current understanding of optimal study designs and data interpretation are now available. Summaries of the historical and recent information are provided below.
Genotoxicity (condensed from Collins and Moore, Citation2019 and Moore, Pottenger, and House-Knight Citation2019)
The styrene genotoxicity literature numbers in the hundreds of studies and originates in the 1970s, a period that coincided with the development of the field of genetic toxicology. The methods used in the investigations were generally in line with methods used in the timeframe in which these were conducted. Over the years, many summaries of the genetic toxicology literature have been prepared. A smaller number of critical reviews of the styrene/SO literature have been published by several genetic toxicology experts (Cohen et al. Citation2002; Nestmann, Lynch, and Ratpan Citation2005; Scott and Preston Citation1994a, Citation1994b; Speit and Henderson Citation2005) and have all concluded that, with the exception of in vitro studies where there is clear evidence that SO is genotoxic, there is little to no convincing evidence that styrene/SO is genotoxic in vivo in rodents. Cohen et al. (Citation2002) found that while styrene “does not appear to be DNA reactive”, SO clearly induces mutations in the Ames test and binds to both proteins and nucleic acids and forms both stable N2- and O6-guanine adducts in exposed mammalian cells. SO results in animal studies are “less clear cut”, with conflicting results as to whether styrene can cause sister chromatid exchanges (SCEs), chromosome aberrations (CAs), or micronuclei (MN) in rodents. Speit and Henderson (Citation2005) reviewed the styrene data from in vivo rodent genetic toxicology assays and concluded that there was no clear evidence that styrene induces clastogenic/mutagenic effects in vivo when the test is performed under appropriate test conditions, and that “equivocal” results can be observed when the tests were performed using high exposure levels that led to lethality. Nestmann, Lynch, and Ratpan (Citation2005) provided an overview of reviews that had been previously conducted and concluded that rodent studies at exposures up to 1500 mg/m3/day showed no evidence of clastogenicity.
Over the years, study methods and the interpretation of data have evolved with extensive modifications made for most of the standard genetic toxicology assays during the recent revisions to the OECD (Organisation for Economic Co-operation and Development) Test Guidelines (OECD Citation2017). Thus, Moore, Pottenger, and House-Knight (Citation2019) have critically reviewed the genotoxicity of styrene based on recommendations in the current OECD guidelines. The literature for genetic effects, including the Ames test, gene mutation in mammalian cells, chromosome aberrations in mammalian cells, MN in mammalian cells, and in vivo rodent studies for CAs and MN, were all included in the critical review. Literature for the endpoints associated with chemical exposure but which do not provide evidence of genotoxicity permanent genetic damage were summarized but not critically reviewed. These endpoints include DNA strand breakage, DNA adducts and also protein adducts (which are not primary DNA damage) and the in vivo studies using SCE. In this review, current OECD recommendations for assay conduct, assay acceptability, and for the interpretation of data were applied. Based on this approach, a large number of the studies were determined to be uninterpretable, but there were enough usable studies to reach the conclusion that styrene is not mutagenic/clastogenic in test systems lacking metabolic activation capability. However, positive results can be found in in vitro test systems with capability of metabolism of styrene to SO (and the SO is not further metabolized to nongenotoxicants). When SO is the test material, it is clearly mutagenic in the bacterial Ames test. The majority of studies that examined styrene/SO for gene mutation in cultured mammalian cells were uninterpretable because of major technical deficiencies based on current OECD Test Guidelines. A single study using the mouse lymphoma gene mutation assay was, in spite of some technical deficiencies, interpreted to be evidence that SO can induce mutation in cultured mammalian cells. No in vivo studies evaluating the ability of either styrene or SO to induce gene mutation were identified; hence no conclusions can be made concerning the ability of styrene/SO to induce mutations in the somatic cells of rodents. Studies indicate SO is clastogenic in in vitro mammalian cell assays. Most of the rodent CA and MN studies were not interpretable; however, a few interpretable studies provided no evidence that styrene is clastogenic in vivo and a 2012 well-conducted study provides definitive evidence that neither styrene nor SO induces MN in rats. Regarding endpoints reflective of molecular exposure only, styrene/SO exposure resulted in both specific and non-chemical specific DNA adducts in vitro and in vivo in rodents, SO-specific protein adducts have been observed in styrene-exposed rodents, and DNA strand breaks are induced in mammalian cells following in vitro exposure to SO. SCEs can also be induced by styrene exposure to rodents. Thus, while SO is clearly mutagenic in vitro, there is no evidence that styrene or SO can induce chromosomal damage in rodents in vivo. There are no in vivo rodent studies that directly assess the ability of styrene to induce gene mutations.
In addition to the large genetic toxicology literature, there is an extensive literature using genetic damage biomarkers evaluated in the blood cells of humans occupationally exposed to styrene. There are reports for CA, MN, SCE, and gene mutation. ATSDR (Citation2010) provides a compilation of the human chromosomal aberration and mutation studies through the review’s time period. Two mutation assays have been used in humans to study styrene, the Hprt gene mutation test and the Glycophorin A (GPS) assay. The studies that evaluated occupationally exposed subjects for increases in the frequency of Hprt mutants in relation to control individuals were reported by Vodicka et al. (Citation1995, Citation1999, Citation2001) and Lambert et al. (Citation1995). Two studies are reported that used the GPA gene to assess mutation induction (Bigbee et al. Citation1996; Compton-Quintana et al. Citation1993). None of these studies provides a clear conclusion as to whether styrene can induce mutation in human lymphocytes. Although there are a relatively large number of cytogenetic studies in occupationally exposed humans, as with the mutation studies, the study designs of these studies lack key elements important for understanding the results.
Many studies were lacking in external or internal exposure information (some lacked both). When exposure was assessed there were only a few studies that assessed exposure in both the occupationally exposed workers and the controls. There were often wide ranges in the exposure levels for workers. The control and worker populations often did not appear to be well matched, and an overall exposure assessment, to actually evaluate confounding exposures (beyond whether individuals were or were not active smokers) was not presented. Furthermore, most studies had a very small number of subjects. In addition, technical issues, including outdated methodologies for scoring the cytogenetic endpoints, too few cells scored for adequate statistical power, and for the Hprt gene mutation assay, very poor cell growth, made many of the studies uninterpretable. Overall, the weight of evidence indicates that there is insufficient information to conclusively determine whether styrene induces genetic damage in humans.
A recent review and meta-analysis focused on the induction of MN in human subjects was published by Costa et al. (Citation2016). The authors concluded that overall there was an increase in MN among styrene-exposed workers and that the findings of an increase were consistent across studies even though the review reported significant heterogeneity in the meta-analysis of all studies. However, the authors also indicate that study quality was problematic in the reported literature and identified a number of issues, such as poorly matched controls and exposed individuals, small numbers of study subjects, inadequate exposure assessment, confounding lifestyle exposures (i.e., combustible cigarette use), and poor epidemiological design.
Collins and Moore (Citation2019) updated this meta-analysis of the MN endpoint with additional studies not previously included, eliminated double counting of study subjects appearing in more than one publication, considered levels of styrene exposures in the analysis, assessed publication bias, and examined consistency of findings across studies. The meta-analysis used the standardized mean difference as the summary statistic since all studies assess the same outcome but use different comparison populations. The primary meta-analysis of the 12 studies of 516 styrene-exposed workers and 497 non-exposed comparisons produced a meta-mean difference of 1.19 (95% CI 0.20–2.18, random effects model), but there was substantial heterogeneity across studies (I2 of 97.47, p-value <0.001, fixed effect model). Collins and Moore (Citation2019) noted that in the presence of substantial heterogeneity across studies, it was difficult to propose an overall meta-mean difference of MN increase that represents the results of all studies. One study had a decrease in the meta-mean differences (Van Hummelen et al. Citation1994), five studies were consistent with neither an increase nor a decrease (Anwar and Shamy Citation1995; Holz et al. Citation1995; Mäki-Paakkanen Citation1987; Tomanin et al. Citation1992; Vodicka et al. Citation2004), and five studies showed an increase (Godderis et al. Citation2004; Hanova et al. Citation2010; Laffon, Pásaro, and Méndez Citation2002; Migliore et al. Citation2006; Teixeira et al. Citation2004). Overall, Collins and Moore (Citation2019) found that these studies do not show consistent findings. Furthermore, Collins and Moore (Citation2019) concluded the mean standardized differences of micronucleus frequencies had slightly higher levels among styrene-exposed workers compared to unexposed workers, but there was no consistency across studies. The authors found that the increase in the MN frequencies among styrene workers occurred in the studies with lowest quality and that there was some evidence of publication bias with small studies having negative findings not being published. Collins and Moore (Citation2019) also observed that studies with higher styrene exposure had a higher mean standard difference compared with studies with lower styrene exposures; however, a longitudinal study did not find any association of styrene exposure and MN frequencies.
Noting that exposure-response is an important causal guideline, Collins and Moore (Citation2019) considered the Yager, Paradisin, and Rappaport (Citation1993) longitudinal study of 48 workers, 26 males and 22 females, to be an important study for exposure considerations and was particularly useful for assessing exposure–response relationship over time. In this one-year longitudinal study, there were multiple individual measurements made for both external and internal exposure. The subjects wore personal breathing zone air monitors for an entire work-shift and samples taken at approximately 6-week intervals for up to 7 randomly chosen days during the year. Measurements of exhaled air were evaluated for styrene 3 times in a work day for 7 monitoring days and found that 38% of the individuals were exposed to a mean 31 ppm styrene level and the remainder exposed to 3–6 ppm. Blood was collected for MN analysis on up to 4 occasions and a minimum of 1000 binucleated cells were scored per sample. This study found that while there was an association between MN frequency and both age and gender, there was no association between the level of styrene exposure and the frequency of MN.
Given the lack of consistency across studies and the absence of an exposure-response finding from the Yager, Paradisin, and Rappaport (Citation1993) longitudinal study, Collins and Moore (Citation2019) determined that the data are currently insufficient to support a conclusion that styrene exposure induces MN in occupationally exposed humans.
Mouse lung tumors MOA
Since Cohen et al. (Citation2002) review of styrene, significant research has been undertaken to further characterize and refine the understanding of the hypothesized MOA of styrene-induced mouse lung tumors. These research efforts were particularly focused on defining the key MOA events responsible for development of mouse-specific lung tumors, and particularly the relevance of the hypothesized key events to human lung tumor development. Given knowledge of comparative rodent and human styrene metabolism at the time, Cohen et al. (Citation2002) hypothesized that the MOA of styrene mouse lung tumors was driven by metabolism of styrene to SO, a reactive and primary metabolite of styrene shared by humans and rodents. These reviewers also concluded that (physiologically based pharmacokinetic) PBPK modeling estimates of SO formation in rodents and humans offered some assurance that humans were likely less sensitive to styrene lung tumors due to as much as a 100-fold lower formation of SO in human lung relative to mouse lung. Importantly, however, these authors recognized that significant uncertainty remained as to how potential differences in the carcinogenic potency of styrene between mice and humans could be adequately accounted for by differences in the inter-species formation of the shared SO metabolite.
Extensive rodent and human data collected since Cohen et al. (Citation2002) have substantially challenged the hypothesized role of SO as the key mediator of mouse-specific lung tumors. The current MOA data now robustly support a conclusion that styrene mouse lung toxicity and tumorigenicity are not mediated primarily, if at all, by SO, but rather through additional mouse-lung specific metabolism of styrene and/or SO by cytochrome P450-2F2 (CYP2F2) to ring-oxidized metabolites. Importantly, the human isoform of mouse CYP2F2, CYP2F1, has substantially reduced or questionable metabolic capacity for metabolism of styrene to ring-oxidized metabolites, and CYP2E1, which is primarily responsible for the extensive metabolism of styrene to SO in rodents and humans, also has very limited if any capability for ring-oxidation.
Recently, Cruzan et al. (Citation2018) developed a comprehensive human relevance analysis of styrene mouse lung tumor using data integration standards promoted in multiple MOA analysis framework proposals (Meek et al. Citation2013, Citation2014). The styrene analysis proposed a primary non-genotoxic MOA action hypothesis based on CYP2F2-mediated formation of mitogenic/cytotoxic ring-oxidized metabolite(s), and contrasted the data-driven merits of that hypothesis against the alternative genotoxic SO reactive-metabolite mediated MOA as focused on in Cohen et al. (Citation2002).
The primary MOA hypothesis identified a key (molecular) initiating event and three subsequent key events as accounting for how styrene exposure in mice ultimately progresses to lung tumors. Those events are:
metabolism of styrene to ring-oxidized metabolite(s) by CYP2F2 in mouse lung terminal bronchiole club cells;
immediate changes in lung gene expression responses reflecting mitogenic signals and later-in-life changes consistent with shifts in circadian clock genes linked to mouse lung tumorigenesis;
initiation of mitogenic cell proliferative response as a primary event in mouse lung terminal bronchiolar club cells with cell cytotoxicity as a minor contributor to cell proliferation; and
development of persistent terminal bronchiole hyperplasia with ultimate progression to localized lung tumors.
Because the primary ring-oxidized-based and contrasting alternate SO-based MOA hypotheses have been comprehensively described and reviewed in Cruzan et al. (Citation2018), only tabulated summaries ( and ) of the contrasting strengths and weaknesses of the respective hypothesizes will be presented here.
Table 6. Evidence supporting the role of CYP2F2-mediated metabolism of styrene to ring-oxidized metabolite(s) as an essential key initiating event in generation of mouse lung specific toxicity and tumors (reviewed in Cruzan et al. Citation2018).
Table 7. Evidence inconsistent with SO as a plausible MOA for styrene-induced lung toxicity and tumors in rodents and humans (Cruzan et al. Citation2018).
illustrates the critical relationships of initial styrene metabolism key event to the other downstream key events of the postulated styrene MOA. Once absorbed in the systemic circulation by the respiratory tract, styrene distributes to the liver where styrene is extensively metabolized by CYP2E1 in all species to SO, although in mice, CYP2F2 liver metabolism likely contributes to both SO and ring-oxidized metabolite formation in that organ. Extensive SO generated in mouse liver, as well as styrene systemically absorbed into blood following inhalation or oral exposures, distributes to lung where it undergoes ring-oxidation mediated by CYP2F2 that is enriched in club (Clara) cells localized to the terminal bronchioles. CYP2E1, which is also enriched in lung club cells, may also contribute to styrene oxidative metabolism (particularly to SO), albeit to a lesser extent than by CYP2F2. The localized formation of ring-oxidized metabolite(s) by CYP2F2 is hypothesized as the key metabolic gateway responsible for initiation of the downstream 3 remaining key MOA events leading to terminal bronchiole-localized toxicity and progression to late-in-life mouse-lung specific lung tumors.
Figure 1. Postulated mode of action of styrene mouse lung tumorigenicity.
Republished with permission from Cruzan et al. (Citation2018; https://doi.org/10.1016/j.yrtph.2018.02.010).
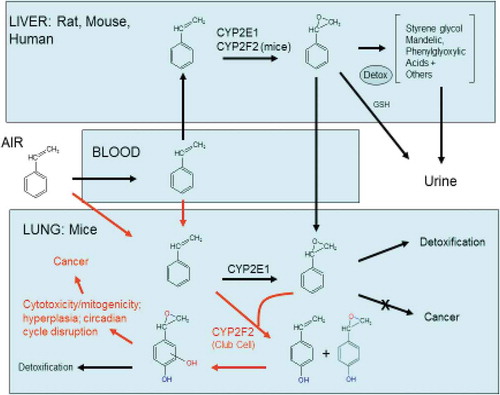
Empirical experimental support for the styrene mouse-lung MOA has been substantially facilitated by the relatively recent availability of genetically modified mouse strains focused on the key initial hypothesized metabolic gateway enzymes (CYP2F2, CYP2E1), and that have subsequently allowed for both short- and long-term testing of the CYP2F2 MOA hypothesis relative to that of the precedent SO-mediated hypothesis. Importantly, a transgenic humanized mouse model expressing the human CYP2F isozyme CYP2F1 (created on the CYP2F2 KO parent) has also allowed for additional examination of the qualitative and/or quantitative relevance of the mouse CYP2F2 hypothesis to humans. Summaries of the relative strengths and weaknesses of the competing MOA hypotheses are described in and , and are taken from the detailed MOA framework analysis recently published by Cruzan et al. (Citation2018). An overall weight-of-evidence integration of the data examining each of the two hypotheses now unequivocally indicates that mouse-specific lung tumors are unique to mice due to mouse-specific CYP2F2 metabolism. CYP2F2 operates essentially as a critical metabolic gateway, i.e., in the absence of CYP2F2 or in the presence of CYP2F1 humanized styrene metabolism, all subsequent key events of the hypothesized MOA are completely attenuated (the gateway is closed to activation of downstream events), including extension through late-in-life chronic 2-year evaluations in mice. Importantly, SO-induced cell proliferation is also completely attenuated in CYP2F2 KO and humanized mice, strongly indicating that SO is not a plausible proximate metabolite accounting for lung toxicity and tumorigenicity of styrene in mice or humans. In regard to the MOA informative value of responses observed in KO animals, Becker et al. (Citation2017) have emphasized that, when attempting to quantitatively score the strengths and weaknesses of competing MOA hypotheses, the essentiality of a MOA is strongly supported when an early key event prevents postulated downstream adverse outcomes and associated key events. These investigators further note that amelioration of key events through the use of hypothesis-driven animal knockouts offers “considerable confidence” that such an early key event (CYP2F2 metabolism for styrene) is essential to the MOA and that the chemical acts via the hypothesized MOA.
The experimental depth and support for the proposed styrene MOA is particularly enhanced by examination of transcriptomic responses to styrene in the various wild-type, KO, and humanized mouse strains over the entire course of 2 years of inhalation exposure to styrene ( and ). Those studies reveal that in the absence of CYP2F2 metabolism none of the ensuing key events accounting for cancer occurs over the entire life spans of the CYP2F KO and humanized mice strains, and at the same time provide sensitive and molecular data in WT mice supporting a biologically plausible conclusion that styrene is operating by a non-genotoxic proliferative-induced MOA. Equally important, however, the styrene transcriptomics analyses offer powerful tools for assessing whether alternative MOA(s) might be functioning even weakly in the face of the preferred CYP2F2 MOA hypothesis, including signals of alternative MOA(s) that might be delayed and thus appearing only later in life. The complete absence of styrene-induced changes in differential gene expression in CYP2F2 and CYPF1 measured over a substantial portion of the animals’ lifespan indicates that no such alternative MOA signals are recognized by sensitive and comprehensive transcriptomic analyses.
Overall assessment of cancer potential
The available epidemiologic studies for occupational exposure to styrene and human cancer have produced mixed results. Although some studies suggest that styrene-exposed workers may be at increased risk of some cancers, the data are not conclusive. Few consistent trends in cancer findings have been demonstrated. Increased lung and kidney cancer among FRP industry workers did not increase with increased exposures and was consistent with increased smoking among exposed workers compared to low- or non-exposed workers. An increased incidence or mortality of subtypes of leukemia and lymphomas has been reported in several studies, although these findings are not consistent and confounding, bias, or chance cannot be ruled out. Overall, the body of human cancer information for styrene and workplace exposure is constrained by methodological limitations including a greater reliance on mortality data rather than on cancer incidence data in many studies, lack of quantitative estimates of styrene exposure for individual subjects in most of the studies, and lack of information of lifestyle factors in most of the studies. Studies of general population environmental and consumer styrene exposure and cancer are less informative than the occupational cohort studies given generally lower number of subjects and imprecise exposure information but the available evidence does not suggest these low exposures are a concern.
The available animal cancer studies indicate styrene is carcinogenic in mice producing lung tumors only and not carcinogenic in rats. Based on eight chronic studies in rats, there are no styrene-induced increases in any type of tumor in rats exposed long term from 14–2000 mg/kg bw/day orally and 25–1000 ppm by inhalation. Based on four chronic studies by gavage and one by inhalation, styrene induces increased lung tumors in some strains of mice. No other tumor types were increased by oral doses up to 350 mg/kg bw/day or by 160 ppm by inhalation.
A MOA for lung tumor development in mice has been established. Cruzan et al. (Citation2018) concluded in a comprehensive MOA framework analysis of styrene-induced mouse lung tumors that this “ … MOA demonstrates styrene-induced mouse lung tumors are likely qualitatively, or possibly quantitatively, not relevant to humans.” On this basis, a quantitative risk assessment of potential styrene-induced lung cancer is not warranted and is not further pursued in the current risk assessment analyses. Although the integrated weight-of-evidence MOA framework analysis presented in Cruzan et al. (Citation2018) is the primary basis of that conclusion, it is important to note that since the Cohen et al. (Citation2002) review other reviews detailing the progressional development of the CYP2F2 MOA have been published (Cruzan et al. Citation2009, Citation2002).
Non-cancer health effects
Neurotoxicity
A substantial body of human data, primarily gathered in occupational settings, indicates that the nervous system is the most sensitive target of chronic styrene exposure (ATSDR, Citation2010; Bagirzadeh, Beach, and Cherry Citation2006; Cohen et al. Citation2002; European Union Risk Assessment Report (RAR) prepared by the U.K. Health & Safety Executive (U.K. HSE, Citation2008)). Acute neurobehavioral effects reported at high occupational exposure levels, such as delayed response time, drowsiness, and altered vestibular function, might negatively impact the ability of a worker to safely operate equipment and be aware of his or her environment. However, the persistence of such effects when exposure is reduced or eliminated has not been demonstrated (Seeber, Bruckner, and Triebig Citation2009a; U.K. HSE, Citation2008). Chronic occupational styrene exposure at lower concentrations might produce subtle neurosensory deficits (impaired olfaction, audition (ototoxicity), and color discrimination (dyschromatopsia)). These effects are generally subclinical (apparent only when using sensitive tests). The most sensitive neurosensory effect appears to be ototoxicity, followed by dyschromatopsia (Cohen et al. Citation2002). The reversibility of dyschromatopsia is unknown, but effects on hearing, well studied in animals, appear to be irreversible. This review therefore focuses on dyschromatopsia and ototoxicity as the most sensitive of the styrene induced-neurological effects.
Dyschromatopsia
Occupational exposure to a variety of chemicals, including styrene and several other organic solvents, has been linked to impairment of color perception (acquired dyschromatopsia), most often affecting blue-yellow color discrimination (tritanopia). Dyschromatopsia is an early indicator of neurotoxicity, and hence is an informative indicator for initiating treatment as well as monitoring the progression of injury. In the case of styrene, studies of workers in the U.S., Canada, Sweden, Germany, Italy, Japan, and Singapore have reported effects on color vision and/or visual contrast sensitivity. However, a threshold is difficult to identify in available epidemiological studies due to a number of shortcomings in the available database, including limited sample sizes, control groups inadequately matched for potential confounding variables, lack of accurate measures of current and historical exposures, lack of baseline measures prior to exposure, small effect sizes, and effect heterogeneity. The impact of such effects on instrumental activities for daily living (IADL) has not been determined, even for highly exposed workers. Implications, if any, for the general public exposed to styrene at much lower concentrations are accordingly even less certain.
Animal studies
Three studies examining visual function in experimental animals (two in rats and one in monkeys) exposed to styrene or its major metabolites are reported. None of these provide thresholds or dose–response information. It is noted that rats are a poor model for humans given the major differences in visual physiology between these species.
Male Wistar rats dosed with 1250, 3750, or 5000 mg/L of the major styrene urinary metabolite phenylglyoxylic acid (PGA) in drinking water for three months exhibited no gross signs of toxicity, changes in clinical biochemistry, abnormal results in a functional observational battery, or changes in auditory brain stem response, but scotopic (dark-adapted) flash electroretinogram (ERG) b-waves showed a slight increase in latency and decrease in amplitude at the high-dose level that were both significant at a flash intensity of 1.5 candela per square meter (cds/m2) (Ladefoged et al. Citation1998). The authors considered these changes to be minor and “not directly related to changes found in man.”
Vettori et al. (Citation2000) examined the effect of subchronic styrene inhalation exposure on amacrine cells in female Sprague-Dawley rats. Amacrine cells, of which there are several dozen types, are interneurons that serve to integrate inputs from photoreceptors and modulate the visual message presented to retinal ganglion cells (Schwartz Citation2010; Witkovsky Citation2004). Vettori et al. (Citation2000) focused on amacrine cells that release dopamine, the most abundant catecholamine in the vertebrate retina. Dopamine has multiple trophic roles related to eye growth, cell viability, circadian rhythmicity, and color perception (Kim, Chen, and Tannock Citation2014; Schwartz Citation2010; Tannock, Banaschewski, and Gold Citation2006; Witkovsky Citation2004). These neurons begin to die in aging animals, and reduction in retinal dopamine, such as occurs in Parkinson’s disease and attention-deficit/hyperactive disorder (ADHD), results in reduced visual contrast sensitivity (CS) and color vision deficits, particularly in blue-yellow pathways (Djamgoz et al. Citation1997; Firsov and Astakhova Citation2016; Popova Citation2014; Tannock, Banaschewski, and Gold Citation2006; Witkovsky Citation2004). Morphometric analysis of retinas from female Sprague-Dawley rats exposed to 300 ppm styrene 6 hours/day, 5 days/week, for 12 weeks (n = 10) showed a significant loss of tyrosine hydroxylase-immunoreactive (dopamine-producing) amacrine cells (Vettori et al. Citation2000). Dopamine and glutathione content were significantly lower in treated animals, and the activity of tyrosine hydroxylase was significantly higher when expressed as a function of the number of dopaminergic amacrine cells (Vettori et al. Citation2000). The potential human significance of these findings is unknown.
Toluene and styrene infused into anesthetized cynomolgus monkeys had no effect on ERG a- and b-waves, but elicited qualitatively similar transient effects on the ERG c-wave and the standing potential of the eye (Skoog and Nilsson Citation1981). The smallest effective doses differed by ten-fold (0.3 mg/kg bw for toluene, 3 mg/kg bw for styrene), but achieved similar blood concentrations. These results indicating an acute effect on the ERG are of unknown significance for longer-term exposures.
Epidemiological studies
Studies reporting effects on color vision (usually of the tritan type affecting blue-yellow color discrimination) and/or CS in workers exposed to high styrene concentrations have been re-reviewed in the past 20 years (Benignus et al. Citation2005; Betancur-Sánchez, Vásquez-Trespalacios, and Sardi-Correa Citation2017; Choi et al. Citation2017; Gobba Citation2000; Gobba and Cavalleri Citation2000, Citation2003; Good and Nichols Citation2006; Kishi, Tozaki, and Gong Citation2000; Lomax, Ridgway, and Meldrum Citation2004; Paramei, Meyer-Baron, and Seeber Citation2004; Sheedy Citation1997). Some of the relevant epidemiological studies are discussed below and summarized in Table S1.
Two meta-analyses found high variability in effect size across the studies (related to both exposure-related parameters and differences in subject characteristics, tests, and test conditions), but reached different conclusions (Benignus et al. Citation2005; Paramei, Meyer-Baron, and Seeber Citation2004). Paramei, Meyer-Baron, and Seeber (Citation2004) conducted a meta-analysis based on effect size in five studies that used the Lanthony D-15d test, had quantitative exposure estimates, and included a matched control group. Mean color confusion index (CCI) measurements for styrene-exposed workers ranged from 1.21–1.29 vs. 1.05–1.17 for referents, and effect sizes ranged from 0.19 (Kishi, Tozaki, and Gong Citation2000) to 2.39 (Gobba and Cavalleri Citation1993). Effect sizes varied to a greater extent than expected from within-study sampling error, and this non-homogeneity could not be explained by lighting conditions, levels or duration of exposure, or differences in age between subjects and referents. Although the average effect size for styrene was positive, it was not statistically significant. Indeed, the authors stated that “the results for styrene scarcely failed a significant negative effect” (Paramei, Meyer-Baron, and Seeber Citation2004). Discussing this seemingly paradoxical finding, the authors noted that the insensitivity and inaccuracy of exposure measurements may play a dominant role, with testing protocol vagaries and confounding factors both known and unknown also contributing. In particular, exposure characterization using current mean exposure levels was identified as a source of error, given “accumulating evidence that the impact of cumulative exposure and of high past exposure levels is also of importance for explaining effects of solvents on colour vision” (Castillo et al. Citation2001; Gong et al. Citation2002; Viaene et al. Citation2001).
Benignus et al. (Citation2005) obtained CCI results from six studies in which exposure was quantified as the product of inhaled-air styrene concentrations (estimated by converting urinary styrene or styrene metabolite concentrations to air concentrations) and exposure duration (ppm-years). In contrast with Paramei et al. (Citation2004) approach, Benignus et al. (Citation2005) calculated a normalized effect value (percentage of baseline, defined as control or low-dose individuals according to study data) so that “magnitude estimates were not conflated with variances” (Benignus et al. Citation2005). The relationships between both mean and individual CCI results and exposure were significant but highly variable. A nomogram for predicting the magnitude of effect at different styrene concentrations and exposure durations of 2, 4, 6, and 8 years indicated a 2.23% increase in CCI after 8 years of exposure to the American Conference of Governmental Industrial Hygienists (ACGIH) Threshold Limit Value (TLV-TWA) (20 ppm) (ACGIH, Citation2001), approximately equivalent to the change a person would be expected to experience with 1.7 additional years of age over that time frame (Benignus et al. Citation2005).
In view of the conflicting results among studies, Seeber, Bruckner, and Triebig (Citation2009b) undertook a cross-sectional study of workers with repeated measurements in a German boat-building plant. The same work setting was used to investigate effects on neurobehavioral effects (Seeber, Bruckner, and Triebig Citation2009a) and ototoxicity (Triebig, Bruckner, and Seeber Citation2009). Current exposure subgroups were objectively defined as low (n = 97), medium (n = 115), and high (n = 30) styrene exposures as defined by biomonitoring data (urinary mandelic acid [MA] + PGA concentrations and blood styrene concentrations), thereby deriving individual exposure measurements without confounding by personal protection measures. Job tenure was about 6 years. The urinary metabolite data were converted to airborne exposure concentrations of 1.7–3.4 ppm for the low group, 7.6–15.3 ppm for the medium group, and 39.1–48.9 ppm for the high group. Historical air monitoring data in the lamination department of this facility indicated median styrene concentrations of 100 ppm (range 10–200 ppm) in the 1980s and 80 ppm (range 5–150 ppm) from 1990–1995. Using the historical data, a “high-long” exposure group (n = 17, mean job tenure 14.6 years) and a “low-short” exposure group (n = 34, mean job tenure 6.4 years) were defined. CCI was assessed with the Lanthony D-15d test (1,000 lux, daylight fluorescent lamp) and contrast sensitivity with the Vistech chart VCTS 6500 during normal working schedule and company holidays. There were no significant associations between any styrene exposure parameters and CCI, which as expected was strongly associated with age, and not as expected, with native language, with native German speakers having significantly lower CCI than non-German speakers. CCI performance improved significantly during holidays, but not in relation to styrene exposure. Overall, the analyses for contrast sensitivity showed a strong relationship with age but not with styrene exposure. The authors concluded that neither acute styrene exposure levels of 40 ppm (range of standard deviation up to 54 ppm) nor long-term exposures to 27 ppm (range of standard deviation up to 44 ppm) for 15 ± 7 years with past exposures of 50–100 ppm were associated with elevated risks for the parameters of color vision and contrast sensitivity (Seeber, Bruckner, and Triebig Citation2009b). The authors also pointed out that the sample size employed was sufficient to ensure detection of “non-tolerable” functional changes in visual test performance.
Applying a variance-stabilizing, log-scale transformation of mean to CCI, Choi et al. (Citation2017) reported low- to-moderate heterogeneity in CCI among eight studies of styrene-exposed workers selected for meta-analysis (which did not include Seeber, Bruckner, and Triebig Citation2009b). For this evaluation, studies with significant co-exposure to chemicals other than styrene were not considered, nor were studies that did not contain a direct measurement of styrene exposure, either through airborne measurements or urinary biomarkers. In total, 352 exposed and 355 control workers were included. Pooled analysis using a random effects model yielded an overall standardized mean difference (SMD) of 0.56 (95% confidence interval [CI]: 0.37, 0.76; p < .0001), and a fixed effects model yielded a SMD of 0.53 (95% CI: 0.37, 0.68; p < .0001), stated to indicate a “medium-size effect,” which was not further defined in terms of functional significance. A “mild” publication bias against smaller studies with negative results was suggested, but implications were not discussed. Choi et al. (Citation2017) concluded that available evidence supports the hypothesis that chronic occupational exposure to styrene at “levels below most regulatory agency-prescribed exposure limits” can induce subclinical deficits in color vision. However, the analysis was not designed to yield a threshold concentration or a No-Observed-Adverse-Effect-Concentration (NOAEC), and the authors reported no consensus regarding a threshold exposure concentration that causes acquired dyschromatopsia.
Mode of action
The pathogenesis of organic solvent-induced dyschromatopsia is not understood. It could result from changes in either optical filtering or at some point(s) in the pathway of neural processing of color perception. Using biomicroscopy to examine the eye and fundoscopy to examine the optic nerve head, macula, and fundus background, Mergler, Blain, and Lagacé (Citation1987) found no abnormalities in paint manufacturing workers exposed to high concentrations of solvent mixtures, suggesting neural rather than ocular damage. According to the heuristic Köllner’s rule, tritanopia is suggestive of an effect on the outer retina (Schwartz Citation2010). Very limited electrophysiological data are available for styrene-exposed people or animals. In a study with cynomolgus monkeys administered styrene or toluene intravenously (discussed above), increased amplitude of the ERG c-wave returned to normal when blood styrene levels dropped (Skoog and Nilsson Citation1981). The relevance of these acute high-dose responses to chronically exposed workers is unclear, and even more questionable with respect to the general public.
A number of reports have implicated disruption of neurotransmitters in the retina and/or brain, particularly dopamine, in the mechanism of color vision impairment. As mentioned previously, dopamine plays a role in color perception, particularly blue-yellow pathways (Djamgoz et al. Citation1997; Tannock, Banaschewski, and Gold Citation2006; Witkovsky Citation2004). Observing the prevalence of tritanopia in individuals with ADHD, Tannock, Banaschewski, and Gold (Citation2006) proposed a “retinal dopaminergic” hypothesis stating that the central dopamine deficiency characteristic of ADHD is accompanied by hypo-functioning of retinal dopaminergic mechanisms. That destruction or dysfunction of retinal dopaminergic pathways is involved in the dyschromatopsia associated with occupational styrene exposure receives some support from limited animal data, as discussed in the preceding section.
Summary of dyschromatopsia
The preponderance of evidence indicates an effect on color vision at high styrene concentrations, but the magnitude of these effects is small, dose-response and reversibility are unclear, and the implications for IADL are uncertain (Benignus et al. Citation2005; Choi et al. Citation2017; Good and Nichols Citation2006). The systematic review and meta-analysis recently performed by Choi et al. (Citation2017) concluded that chronic occupational exposure to styrene at “levels below most regulatory agency-prescribed exposure limits” can induce subclinical deficits in color vision. However, the analysis was not designed to yield a threshold concentration or NOAEC, and the authors reported no consensus regarding a threshold exposure concentration that causes acquired dyschromatopsia. Of the 15 studies evaluated qualitatively by Choi et al. (Citation2017), only that reported by Seeber, Bruckner, and Triebig (Citation2009b) did not support the hypothesis. Of possible relevance in this regard is the fact that Seeber, Bruckner, and Triebig (Citation2009b) excluded participants on the basis of demonstrated red-green deficiency (as well as “congenital color-blindness”) in order to avoid potential impacts of this predominantly inherited deficiency on the color discrimination test that could have “inflated” styrene impacts in other studies. Taking a contrary view, Choi et al. (Citation2017) suggested that elimination of such individuals could have “inadvertently excluded advanced cases of acquired dyschromatopsia, with more clinically significant symptoms.” However, given that congenital color-blindness is generally of the red-green variety (Deeb Citation2004), it is not clear to what extent this criterion actually eliminated participants not identified as “congenitally” color-blind. Acknowledged limitations of the Choi et al. (Citation2017) analysis include: (1) the previously mentioned propensity for false positives in the D-15 d protocol; (2) the lack of blinding in 10 of the 15 studies; and (3) perhaps most importantly, the lack of knowledge regarding the magnitude of past exposures. The exclusion criteria applied by Seeber, Bruckner, and Triebig (Citation2009b) appear reasonable, and this study is considered most reliable in terms of exposure estimation.
As indicated in Table S1, NOAECs in studies of styrene-associated dyschromatopsia ranged from 4 ppm (Campagna et al. Citation1996) to 27 ppm (Seeber, Bruckner, and Triebig Citation2009b), and LOAECs ranged from 7 ppm (McCague et al. Citation2015) to >588 ppm (Castillo et al. Citation2001). Considering the sum of available evidence in humans and animal models, critical questions remain regarding the mode of action, dose-response, functional significance, and reversibility of occupational styrene-induced color vision deficiencies. Further, as discussed below, the German cohort in which Seeber, Bruckner, and Triebig (Citation2009b) identified neither acute nor chronic effects on color vision exhibited clear effects on audition (Triebig, Bruckner, and Seeber Citation2009). Overall dyschromatopsia is not well defined but does not appear to be present in individuals acutely exposed to approximately 40 ppm or in workers historically exposed to higher styrene levels (50–100 ppm). Thus, dyschromatopsia is not the most sensitive neurotoxicological effect of occupational styrene exposure.
Ototoxicity
Hearing loss is defined as decreased hearing acuity and is usually manifested as an increase in the hearing threshold (Śliwińska-Kowalska and Zaborowski Citation2017). This effect is the most thoroughly evaluated neurosensory consequence of styrene exposure in animals, and mechanistic studies have provided important insights into cellular targets, MOAs, and dose–response relationships. Hearing loss is common in humans, and major causes (besides age) include ototoxic drugs such as certain antibiotics, chemotherapeutic agents, loop diuretics, and non-steroidal anti-inflammatories (Agrawal, Platz, and Niparko Citation2008; Lanvers-Kaminsky et al. Citation2017). Noise is the most frequent cause of irreversible sensorineural hearing loss in the workplace. Styrene and other simple aromatic chemicals such as toluene, ethylbenzene, and xylenes have been linked to hearing loss in the workplace, particularly in conjunction with exposure to noise (Fechter Citation1999; Hormozi et al. Citation2017; Johnson Citation2007; Johnson et al. Citation2006; Lawton, Hoffmann, and Triebig Citation2006; Metwally et al. Citation2012; Morata et al. Citation2011; Sisto et al. Citation2016, Citation2013; Śliwińska-Kowalska et al. Citation2005; Tognola et al. Citation2015; Triebig, Bruckner, and Seeber Citation2009; Triebig et al. Citation2001). The evidence base is reasonably robust for this effect, and supported by a number of high-quality toxicological and mechanistic animal studies (Campo et al. Citation1999, Citation2001, Citation2003, Citation2007, Citation2011, Citation2014; Campo and Maguin Citation2007; Chen et al. Citation2007; Chen, Tanaka, and Henderson Citation2008; Chen and Henderson Citation2009; Loquet, Campo, and Lataye Citation1999; Fetoni et al. Citation2016; Gagnaire and Langlais Citation2005; Gagnaire et al. Citation2006; Lataye, Campo, and Loquet Citation2000; Lataye et al. Citation2001, Citation2003, Citation2004; Mäkitie et al. Citation2002; Pouyatos et al. Citation2004; Pouyatos, Campo, and Lataye Citation2005; Venet et al. Citation2015; Wang et al. Citation2001; Yang et al. Citation2009; Yano et al. Citation1992). Given the well-established importance of industrial noise as the most important ototoxic workplace hazard, adequate control of this variable is imperative for reliable attribution of hearing loss to styrene exposure.
Animal studies
The ototoxicity of aromatic solvents is dependent on structure but not lipophilicity, and styrene is one of the most potent, approximately equipotent with ethylbenzene in rats (Gagnaire and Langlais Citation2005; Loquet, Campo, and Lataye Citation1999; Pryor et al. Citation1987). It is noteworthy that styrene and other aromatic solvents are not ototoxic in guinea pigs exposed to the same concentrations as rats, likely due to marked differences in outer hair cell (OHC) lateral membrane morphology, tissue glutathione content, as well as styrene uptake, pharmacokinetics, and metabolism between these two rodent species (Cappaert et al. Citation2002; Davis et al. Citation2002; Lataye et al. Citation2003; Lautermann et al. Citation1997). Humans resemble rats more than guinea pigs in terms of both the pharmacokinetics and metabolism of styrene, and therefore may be considered similar in sensitivity (Campo and Maguin Citation2007; Morata and Campo Citation2002; Sumner and Fennell Citation1994).
Studies in rats have shown that styrene, like some other simple aromatic solvents, can cause permanent hearing loss associated with damage to the organ of Corti in the cochlea by both oral (gavage) and inhalation exposure routes (Table S2) (Campo et al. Citation2001; Gagnaire and Langlais Citation2005; Lataye, Campo, and Loquet Citation2000; Loquet, Campo, and Lataye Citation1999; Pryor et al. Citation1987; Yano et al. Citation1992). Solvents appear to reach the organ of Corti via blood through the outer sulcus as opposed to via dissolution in inner ear or cerebrospinal fluids (Campo et al. Citation1999; Lataye et al. Citation2001). Diffusing from the stria vascularis, styrene first encounters the third row of OHCs and their supporting cells in the sensory epithelium. The “architecturally exquisite” Deiters’ cells support OHCs on their cup-shaped apical surfaces, and their cytoskeletal microtubule stalks provide a rigid structural scaffold supporting mechanical stimulation of OHCs (Wan, Corfas, and Stone Citation2013; Zhu et al. Citation2013). Deiters’ cells (or possibly Hensen’s cells) appear to be the initial target of styrene, followed by OHCs, with a susceptibility gradient from the third row (most sensitive) to the first row (least sensitive) (Campo et al. Citation2001; Chen et al. Citation2007; Fetoni et al. Citation2016; Lataye, Campo, and Loquet Citation2000; Loquet, Campo, and Lataye Citation1999). Inner hair cells (IHCs) are connected to Type I spiral ganglion neurons (SGNs), and are also sensitive to injury by styrene (or its metabolites), but usually at higher styrene exposures and after the appearance of OHC lesions (Lataye et al. Citation2001).
In rats exposed to 800 mg/kg bw styrene via gavage, styrene concentrations in cochlear perilymph decreased from the apical turn to the basal turn (Chen et al. Citation2007). However, the interaction of this exposure gradient with the complementary cochlear gradient of cellular glutathione (which both conjugates SO and is a major intracellular scavenger of reactive oxygen species) (Sha et al. Citation2001) apparently results in relatively more damage in the middle turn compared to the apical and basal turns. Thus, the major impact of styrene is hearing loss in the mid-frequency range (10–20 kHz) (Chen et al. Citation2007; Yano et al. Citation1992). In subacute to subchronic exposure studies in rats administered styrene at 200–800 mg/kg bw/day via gavage, impacts on the auditory function were not evident until more than 33% of OHCs and Deiters’ cells were destroyed, with complete loss of cochlear amplification when more than two-thirds of OHCs were missing (Chen, Tanaka, and Henderson Citation2008). These results suggest that the cochlea could have a redundancy in the number of OHCs, buffering against functional loss until cell loss reaches a critical threshold.
Campo, Maguin, and Lataye (Citation2007) investigated the underlying mechanism for the synergistic effects on hearing of a simultaneous exposure to noise and aromatic solvents, including styrene. After intravenous administration, it was found that the solvents can inhibit the protective middle and inner ear acoustic reflexes of the middle ear muscles. This acoustic reflex is elicited by intense sounds and serves to prevent cochlear damage by diminishing the penetration of high acoustic energies into the inner ear.
Chen, Tanaka, and Henderson (Citation2008) administered various doses of styrene to male Long-Evans rats by gavage (100–800 mg/kg bw/day) for different time periods (3–24 weeks) in order to achieve similar cumulative doses (Chen, Tanaka, and Henderson Citation2008). This protocol was designed to determine whether the cochlear impairment is related to the total styrene dose or to the daily dose rate. The authors stated that six rats treated with 100 mg styrene/kg bw/day for 24 weeks were excluded in their analysis “because there was no hearing loss or hair cell loss.” However, more detailed information was provided in a subsequent report in which groups of six male Long-Evans rats were administered 100 mg/kg bw/day by gavage in olive oil 5 days/week, for 24 weeks; 200 mg/kg bw/day for 5 days/week, for 12 weeks; 400 mg/kg bw/day for 5 days/week, for 6 weeks; or 800 mg/kg bw/day for 5 days/week, for 3 weeks, for a total dose in all groups of 12 g styrene/kg bw (Chen and Henderson Citation2011).
Ototoxicity was assessed morphologically by light and scanning electron microscopy and electrophysiologically by measurement of the compound action potential (CAP) threshold shift five days after exposure cessation. Effects at the 100 mg/kg bw/day exposure level were the least of all doses: OHC loss of 0.4 ± 0.3% (restricted to third row) and CAP threshold shift of 4.3 ± 3.4 dB. Dosing at 200 mg/kg bw/day slightly increased third-row OHC loss but did not alter the CAP threshold when compared to the 100 mg/kg bw/day dose: OHC loss = 5.4 ± 3.0% and CAP threshold shift = 4.5 ± 3.6 dB. The respective 400 and 800 mg/kg bw/day OHC and CAP effects were substantially altered by styrene, however: OHC losses were 31.5 ± 6.0% (mostly third-row) and 50.8 ± 5.1% (all rows); CAP threshold shifts were 11.7 ± 4.4 dB and 21.3 ± 9.4 dB. Although no non-exposed control animals were part of this study, the authors stated that the “OHC loss and CAP threshold shift among the groups were significantly different (p < .0001)”, inferring possible statistically significant changes only in the two high treatment regimens. As other work by this group indicated no hearing loss at less than 30% OHC destruction (Chen, Tanaka, and Henderson Citation2008), the effects at 100 and 200 mg/kg bw/day seem unlikely to be of functional significance. This conclusion is consistent with a report that “active” rats inhaling 300, 400, 500, or 600 ppm styrene (6 h/day, 5 days/week for 4 weeks) exhibited no changes in auditory permanent threshold shifts (PTS; measured over 2–32 kHz) at 300 ppm despite an average 5% loss in third-row OHCs, or in “sedentary” rats exposed to 500 ppm with a corresponding 3% OHC loss (Lataye et al. Citation2005). Similarly, for the equi-ototoxic styrene analog ethylbenzene, exposure of rats to 200 ppm ethylbenzene (6 hours/day, 6 days/week for 13 weeks) resulted in an average 4% third-row OHC loss, with no corresponding changes in audiometric thresholds at 2, 4, 8, and 16 kHz evaluated at 4, 8, 13, and 21 weeks after exposure initiation (Gagnaire et al. Citation2007). It therefore seems reasonable to consider 200 mg/kg bw/day for 24 weeks as an oral NOAEL for functional hearing loss. The authors concluded, “the cochlear impairments appeared to be related to the daily dose level, instead of the total amount of styrene.” These results support observations in epidemiological studies that higher styrene exposures in the past may be responsible for the hearing deficits observed in workers, and that hearing loss conclusions based only on contemporaneous styrene exposure quantification potentially overestimate styrene dose impact on audiometric thresholds (i.e., hearing loss is attributed to lower contemporaneous exposures) (e.g., Triebig, Bruckner, and Seeber Citation2009).
The longest-term styrene inhalation study in which ototoxicity was examined is an unpublished subchronic study (Albee et al. Citation1992) described in the European Union Risk Assessment Report for Styrene (U.K. HSE, Citation2008). Groups of 14 male Fischer-344 rats were exposed to 50, 200, or 800 ppm styrene for 6 h/day, 5 days/week, for 13 weeks. After 13 weeks, evoked potential tests were performed on 12 rats per group. There were no exposure-related effects on body weight or mortality. Histopathological changes in the organ of Corti were observed in rats exposed to 800 ppm styrene and included loss of two outer hair cells per cross section from the upper basal turn and the occasional absence of an outer hair cell from the lower middle turn. No alterations were detected in the inner hair cells, the Deiters’ cells, and the pilar cells. No treatment-related alterations in somatosensory evoked potential from the sensory cortex or the cerebellum were observed; however, the 800-ppm group exhibited elevations in auditory brainstem response (ABR), specifically increases of approximately 40 dB at 16, 25, and 30 kHz. Therefore, the hair cell loss at 800 ppm occurred in the cochlea in areas that relate to mid-high frequency (15, 30 kHz) hearing. At the two lower styrene exposure concentrations, neither histopathological effects in the organ of Corti nor effects on ABR thresholds were observed. Thus, the NOAEC for ototoxicity in this study was 200 ppm.
Higher NOAECs are derived from four shorter-duration (4-week) studies. Mäkitie et al. (Citation2002) exposed groups of 10 male Wistar rats to 100, 300, or 600 ppm styrene for 12 h/day, 5 days/week, for 4 weeks. No treatment-related signs of toxicity were observed during or after treatment. Ototoxicity was assessed morphologically by light and transmission and scanning electron microscopy; ABR was assessed electrophysiologically. No effects on ABR thresholds or morphological damage were observed at 100 or 300 ppm. The NOAEC for ototoxicity in this study was therefore 300 ppm. Campo et al. (Citation2011) found that neither OHCs nor age-related hearing loss in male Brown Norway rats was significantly enhanced by exposure to 300 ppm styrene 6 hours/day, 5 days/week, for 4 weeks at different ages (although a decrease in SGN density was reported in aged rats).
In another 4-week study, groups of 8 male Long-Evans rats were exposed 500, 650, 850, 1000, and 1500 ppm styrene for 6 hours/day, 5 days/week (Loquet, Campo, and Lataye Citation1999). Audiometric testing via implanted electrodes (noise intensity thresholds for evoked potential across a range of frequencies from 2 to 32 kHz) was performed prior to styrene exposure and then at 6 weeks after the exposure period. Permanent threshold shifts (PTSs) were calculated as the difference in sound intensity required to induce an evoked response between the pre- and post-exposure thresholds. Tissues were examined via light and scanning electron microscopy. This protocol did not allow for evaluation of hearing impacts during or immediately after styrene exposure, so recovery could not be evaluated, but the study results indicated no PTSs in the 500-ppm group, and minimal PTS in the 650-ppm group. Based on segmented linear regression, styrene toxicity began at 570 ppm. Animals treated with at least 650 ppm styrene showed loss of OHC in all three rows, with progressively less damage from the third to first rows. No data were presented or discussed for the 500-ppm group. However, cochleograms for similarly treated “sedentary” animals were presented in a subsequent publication by this group, discussed below (Lataye et al. Citation2005). of Lataye et al. (Citation2005) indicates that only 3% of third-row OHCs were destroyed in the 500-ppm group, with no corresponding styrene-induced change in PTS. The NOAEC for effects on hearing in both of these studies was therefore 500 ppm. Lataye et al. (Citation2005) also examined the effects of styrene (300, 400, 500, or 600 ppm) on groups of rats forced to “slowly run” for two of every 3 min (n = 4 rats per dose level) (Lataye et al. Citation2005). No hearing loss or OHC damage (5% third-row loss) were observed at 300 ppm. The increased sensitivity in exercising rats was attributed to greater exposure attendant upon higher ventilation rates.
In Long-Evans rats, some recovery of auditory function was evident 6 weeks after animals were exposed to 750 ppm styrene 6 h/day, 5 days/week, for 4 consecutive weeks (Lataye, Campo, and Loquet Citation2000), although the effects on rat cochleae were reported to be “permanent” in 3-week gavage studies in rats of the same stock allowed a three-week post-exposure recovery period (data shown for 300- and 800-mg/kg bw dose levels) (Chen et al. Citation2007). This apparent discrepancy may occur because either the gavage experiments resulted in higher tissue concentrations and more severe damage, or the shorter recovery period was insufficient, or a combination of the two. Another possibility is that there may be central compensation within the CNS occurring as a result of adaptation to receipt of smaller signals. Thus, the extent to which the organ of Corti and auditory function may recover after styrene-induced injury is presently not understood.
To better inform extrapolation of animal toxicity findings to potential effects in exposed workers it is important to note that ototoxicity appears after relatively short exposures (one week) and that continued treatment does not enhance the severity of the ototoxic response. Campo et al. (Citation2001) exposed rats to 1000 ppm styrene (6 h/day, 5 days/week) for 1, 2, 3, or 4 consecutive weeks. Permanent hearing loss was observed using electrophysiological examinations 6 weeks after the end of each exposure period. An exposure duration of one week was enough to obtain the maximal hearing deficit without any further increase by prolongation of exposure. This was confirmed by histopathology of the cochlea carried out 6 weeks post-exposure: hair cell loss was virtually the same after an exposure duration of 1 or 3 weeks. The conclusion that maximal hearing impairment is already reached after a few weeks of exposure can also be indirectly inferred by comparison of the results of Albee et al. (Citation1992) and Mäkitie et al. (Citation2003). Albee et al. (Citation1992) exposed male Fisher-344 rats (6 h/day, 5 days/week) to 0, 50, 200, and 800 ppm styrene over 13 weeks. Effects on the auditory system were determined by electrophysiology and histopathology of the cochlea a few days after the end of exposure. Clear effects were noted at an exposure of 800 ppm and the NOAEC was 200 ppm. This compares well to the NOAEC of 300 ppm determined in male Wistar rats by Mäkitie et al. (Citation2003) after an exposure to 0, 100, 300, and 600 ppm (12 h/day, 5 days/week) over only 4 weeks, and may again indicate that hearing loss is mainly governed by the level of exposure and not by duration.
As mentioned previously, ototoxicity has been seen at similar exposure levels with other aromatic organic solvents, including toluene (Johnson and Nylen Citation1995; Loquet, Campo, and Lataye Citation1999), ethylbenzene (Cappaert et al. Citation2000), and xylene (Johnson and Nylen Citation1995; Nylen et al. Citation1987; Pryor et al. Citation1987). Thus, read-across for the qualitative features of ototoxicity induced by aromatic solvents is appropriate. The conclusion that solvent-induced ototoxicity appears after a relatively short exposure to sufficient doses and is governed by the intensity of exposure rather than duration or cumulative exposure is well supported by studies with toluene. Pryor et al. (Citation1984) showed that two weeks of exposure to 1000 ppm toluene (14 h/day, 7 days/week) produced ototoxicity in rats, while no effects were seen for a similar exposure schedule over 16 weeks to 400 and 700 ppm, leading to clearly higher time-integrated exposures. Even 3 days of exposure at 1500 ppm (14 h/day) or 2000 ppm (8 hours/day) was sufficient to induce hearing loss. Nylen et al. (Citation1987) demonstrated impairment of auditory function, as determined electrophysiologically, in male Sprague Dawley rats after exposure to 1000 ppm (22 h/day, 7 days/week) over 1 month, corresponding to 0.62 million ppm x hour. On the other hand, no effects were found after a cumulative exposure of 2.46 million ppm x hour achieved by a shorter weekly exposure regime to 1000 ppm (6 h/day, 5 days/week) over 19 months. Johnson and Nylen (Citation1995) reported that a time-integrated concentration between 12,000 and 16,000 ppm x hours/day toluene over 3 days was sufficient to cause loss of auditory sensitivity, while 6000 ppm x hours/day over 18 months failed to produce ototoxic effects. Further direct evidence that maximal and irreversible hearing impairment might be attained after a few weeks of exposure was presented by Gagnaire et al. (Citation2007) with ethylbenzene and mixed xylenes. Hearing deficits recorded electrophysiologically 4, 8, and 13 weeks after the start of exposure (6 h/day, 6 days/week), and after an additional 8 weeks of recovery, were essentially the same: there was no increase of hearing loss over time and the NOAEC did not change. These observations show that high, short-term exposures are responsible for hearing deficits. As a result, time-integrated exposure calculations for induced hearing deficits can be misleading. These findings also suggest that dose–response evaluation of hearing deficits in workers based only on contemporary styrene exposure assessments likely overestimate ototoxicity risks if past higher styrene exposures are likely to have occurred in the worker population. Since available data suggest that the intensity of the ototoxic response does not increase with time of exposure beyond the first week, the U.K. HSE (Citation2008) concluded, “the NOAEC values of 500 and 300 ppm for 4 weeks in sedentary/ordinary and active rats respectively are a more accurate starting point for risk characterisation than the NOAEC of 200 ppm for 13 weeks.”
A number of studies suggest that styrene-induced ototoxicity can be affected by exposure to noise. Studies in rats have shown noise (both continual and impulse) and styrene to have different targets and MOAs. These can act additively, and under some circumstances synergistically, in damaging the cochlea (Campo et al. Citation2014; Chen and Henderson Citation2009; Fetoni et al. Citation2016; Lataye, Campo, and Loquet Citation2000; Mäkitie et al. Citation2002, Citation2003; Venet et al. Citation2015). Noise exposure induces a certain level of hearing loss with only minor damage to OHCs, usually seen first in the first row, with no loss of Deiters’ cells (Chen et al. Citation2007; Chen and Henderson Citation2009; Fetoni et al. Citation2016; Lataye et al. Citation2001; Lataye, Campo, and Loquet Citation2000). Chen and Henderson (Citation2009) also observed greater loss of Deiters’ cells in animals with combined exposure. The Chen and Henderson (Citation2009) study exposed rats to continuous noise (100 dB SPL, 6 h/day, 5 days/week over 3 weeks) superimposed by an impact noise (up to 110 dB SPL, duration 30 msec at a rate of 1/sec) and 300 or 400 mg/kg bw/day styrene by gavage (5 days/week over 3 weeks). Hearing ability/loss was evaluated by CAP input/output function and threshold changes and hair cells in the cochlea were examined by histopathology. Styrene induced only a limited loss of OHCs without significant hearing loss, while exposure to noise alone led to a clear hearing loss, as measured by CAP, but only slight OHC losses. The combined exposures induced OHC and hearing losses that were greater than the sum caused by styrene or noise alone. Thus, a styrene/noise synergism was demonstrated even at exposures that produced no marked effects on the parameters investigated by either noise or styrene alone.
Several studies have shown that the character of the noise plays an important role in solvent-noise interactions. Campo et al. (Citation2014) observed that rats exposed to 300 ppm styrene, 6 h/day, 5 days/week, for 4 weeks combined with continuous noise (86.2 dB) surprisingly showed less hearing impairment than animals subjected to either treatment alone, while rats exposed to the combination of styrene and “impulse” noise showed potentiation of injury. Thus, co-exposure with styrene was less damaging than continuous noise alone, and enhanced the traumatic effect of impulse noise. The authors suggested that while 300 ppm styrene has a relatively slow cochleotoxic effect, its rapid pharmacological impact on the CNS could decrease the noise-protective middle-ear acoustic reflex threshold. Inefficient triggering of this reflex could explain the increased vulnerability to impulse noise (Campo et al. Citation2014).
Epidemiological studies
As recently as 2006, it was not universally accepted that a true ototoxic effect existed in styrene workers. In a critical review of seven epidemiological studies, Lawton, Hoffmann, and Triebig (Citation2006) concluded that while chronic simultaneous exposure to styrene and noise may be associated with some degree of hearing loss, “hearing deficits due to occupational exposure to styrene at low concentrations have not been demonstrated by scientifically reliable argument.” However, that same year, an international workshop on the available epidemiological styrene studies concluded that styrene is a risk factor for occupational hearing loss, and that existing OELs may not be sufficiently protective (Śliwinska-Kowalska et al. Citation2007).
More recently, a weight-of-evidence-based review of animal and human epidemiological evidence for ototoxicity of styrene concluded that, although the human data were less clear than animal data in terms of establishing a dose–response relationship, the overall evidence favors the conclusion that styrene is ototoxic (Vyskocil et al. Citation2012). Similarly, while recognizing the complications imposed by multiple confounding factors (including exposure to noise and/or other chemicals as well as age and sex) a 2017 systematic review recommended that chronic styrene-exposed workers be routinely evaluated with a comprehensive audiological test battery to identify early signs of hearing impairment (Pleban, Oketope, and Shrestha Citation2017).
Results of some relevant epidemiological studies published since 1988 are discussed below and summarized in Table S3. Particular attention is paid to: (1) distinguishing effects primarily attributable to styrene from those likely caused by noise or co-exposure to noise; and (2) discerning reliable thresholds and dose–response relationships for these effects for use in developing regulatory criteria. Of note, many of the reported studies often have an important knowledge deficit, namely exposure data not only regarding concentrations, but also the durations and the combination of both. This may lead to severe uncertainties, as ototoxicity is likely governed by short-term, high exposures, and time-integrated exposure metrics may be misleading if only relying on exposures measured at the time of investigation. This leads to the question of whether exposures determined at the time of measuring hearing ability adequately capture potential past higher exposures that may have occurred over the total duration of employment. Specifically, and importantly, the FRP industry is well known for its high styrene concentrations in earlier year operations, while more recently significant efforts have been made to reduce workplace exposures. Therefore, the evaluation of data in humans must not only concentrate on the standard parameters, including group size, selection of controls or the effects observed, but also on the availability and reliability of exposure data over time.
Muijser, Hoogendijk, and Hooisma (Citation1988) examined the relationships between styrene exposures and workplace noise at a time when major exposure reductions had yet to be introduced. Therefore, the findings are not confounded to a large extent by earlier higher exposures. The exposed male workers (n = 59, 95% participation rate) were recruited from two branches of a company of FRP industries. Worker age ranged from 19 to 55 years (mean 33.8 years) and their tenure ranged from 1 month – 24 years (mean 8.6 years). A control group of comparable age and socioeconomic status consisted of 94 male workers in the production of photographic films without exposure to styrene or other chemicals. Background noise for styrene-exposed workers was 70 A-weighted decibels (dBAFootnote3) in one and 66 dBA in the other branch, but occasionally, in the vicinity of noisy machines, levels reached 73–96 dBA and 70–104 dBA, respectively. It is noted by Sass-Kortsak, Corey, and Robertson (Citation1995) that exposures of 66–70 dB are rather typical for office work, but highly atypical for a manufacturing/industrial environment. Noise for the control group was rather constant and higher with 80–85 dBA. Pure-tone threshold audiometry (PTA) was performed with an audiometer up to 8 kHz and a special instrument for high frequencies (8–20 kHz). Exposure to styrene was measured on 3 consecutive workdays over the whole work shift. The styrene workforce was subdivided into two subgroups: (1) workers only indirectly exposed to styrene (n = 28; mean 14 ppm, maximum 32 ppm); and (2) workers directly exposed to styrene (n = 31; mean 32 ppm, maximum 84 ppm). Occasional peaks up to 160 ppm occurred. The age distribution in both subgroups was similar. By multivariate analyses, directly exposed workers were compared to unexposed controls and to indirectly exposed workers. There were no statistically significant differences between directly exposed workers and controls, but a significantly increased threshold was observed for the directly exposed workers in the high-frequency region (especially near 8 kHz). The lack of significant differences between all exposed or directly exposed styrene workers and the unexposed control group may have been due to the considerable background noise in the control workplace. In addition, this noise shared a high-frequency content rich with impulse noise. This study with reliable styrene exposure data showed an increase of hearing threshold at 32 ppm accompanied by occasional peaks up to 160 ppm. The main limitation of this study is that a NOAEC cannot be defined because no deficits in hearing ability were observed against the control group, probably because of the high noise exposure of the controls. In addition, the relatively high exposure of the indirectly exposed workers (mean of 14 ppm) that served for comparison to the directly exposed workers (mean of 32 ppm) might have led to an underestimate of the hearing deficit at 32 ppm.
Moller et al. (Citation1990) studied 18 workers (mean age 40 years, range 28–61 years) with long-term exposure to styrene (mean duration 10.8 years, range 6–15 years) for ototoxic and vestibulotoxic effects. Only endpoints related to hearing ability are discussed here. Measurements of airborne styrene were performed annually. High exposures were between 11 and 23 ppm, low exposures below 5.8 ppm and peak exposures above 70 ppm were exceptional. The auditory system was investigated by four methods and the following results were obtained: (1) PTA for lesions of the cochlea: no indication for adverse effects; (2) maximum speech discrimination (compared to a normal reference group of 513 subjects): no indication for adverse effects; (3) discrimination of distorted speech (compared to a normal reference group of 105 subjects): 3 workers with abnormal results; and (4) cortical response audiometry (CRA) (compared to a normal reference group of 44 subjects): 6 workers with abnormal results. This study found that tests primarily reflecting function of the cochlea were normal in exposed workers. However, central auditory pathways may have been affected by styrene exposure, as indicated by discrimination of distorted speech and CRA. Overall, while no effects were noted in the peripheral auditory system, there were indications of effects on central processing. The value of this study, however, is limited due to the relatively low number of exposed subjects and the crude exposure data.
A well-designed study conducted prior to the implementation of many exposure reduction measures (Sass-Kortsak, Corey, and Robertson Citation1995) is informative with respect to both relatively high styrene exposures and workplace noise. The authors evaluated hearing in 299 male workers from 14 Canadian FRP manufacturing facilities. Full-shift personal TWA styrene exposure measurements were taken for each worker and each wore a personal noise dosimeter for one full work shift. The TWA equivalent sound level (Leq) was calculated in dBA. Workers were divided into directly exposed (laminators; n = 170, mean styrene TWA = 25.5 ppm, Leq = 88.1 dBA), indirectly exposed (assembly workers, foremen; n = 86, mean styrene TWA = 8.5 ppm, Leq = 89.2 dBA), and not exposed groups (n = 43, mean styrene TWA = 2.5 ppm, Leq = 80.0 dBA). The ages of workers in the three groups were similar. The directly- and indirectly exposed groups had similar noise exposures, both significantly greater than that of the not-exposed group. Cumulative lifetime exposures were also estimated for styrene and noise in order to assess the effects of chronic styrene and/or noise exposures on hearing. Cumulative styrene exposure was calculated as the sum of the product of the mean styrene exposure at each job multiplied by total duration (months) spent at the job, corrected for respirator use. For not-exposed subjects, styrene exposure was assumed to be 0. Lifetime cumulative styrene exposure ranged from 0 to about 12,500 ppm-months (about 1040 ppm-years). Industrial hygienists assigned an average noise exposure estimate for each job position based on a 6-point scale ranging from 80 dB (believed not to cause noise-induced hearing loss) to 95 dB, corrected for self-reported use of hearing protection. Hearing levels were measured in each subject in both ears at 3, 4, 6, and 8 kHz at the beginning and at the end of the shift using PTA. Age was a highly significant determinant of hearing loss, and noise was also important. A significant interaction was observed between age and noise exposure, suggesting that older workers may be more sensitive to noise than younger workers. Styrene exposure was not significantly associated with hearing loss and no interaction between styrene exposure and noise level was reported. Thus, hearing loss in workers was associated with noise but not styrene exposure at an arithmetic mean concentration of 26 ppm. A particular strength of this study is its detailed assessment of noise exposure (Sass-Kortsak, Corey, and Robertson Citation1995). However, identification of a NOAEC and dose–response evaluation are not possible as historical exposures were not well characterized.
Similar results were reported in a smaller Italian study conducted in the same time period. Calabrese et al. (Citation1996) evaluated auditory function in 20 workers from three FRP factories with a mean occupational tenure of 7.6 years (range = 2–23 years). There was no control group. Styrene exposure was measured by passive dosimetry in the breathing zone over the work shift and by biological monitoring (urinary MA + PGA). These workers were also exposed to acetone. The mean airborne styrene exposure concentration was 36.3 ppm (range = 3.3–97 ppm); four workers’ exposure concentrations exceeded the contemporaneous ACGIH TLV-TWA of 50 ppm. The audiometric test battery consisted of PTA, tympanometry, stapedial reflex threshold, and ABR in response to clicks of 0.1 msec duration was used to evaluate central function. No abnormalities were observed in any of the auditory tests. The relatively high exposure and long occupational tenure of the workers are noted.
A preliminary study of male workers in a German FRP boat-building factory contrasted auditory function in workers exposed to styrene (laminators) (n = 16) with a reference group (n = 16) exposed to similar (unspecified) noise levels but without direct styrene exposure (Hoffmann et al. Citation2006). Airborne styrene concentrations were not reported; exposure was evaluated as the sum of creatinine-normalized MA + PGA in post-shift spot urine samples. Mean MA + PGA was 656 mg/g creatinine (range = 72–2213) in the styrene-exposed group and 130 mg/g creatinine (range = 25–478) in the referents. Duration of employment was used as an indicator of chronic exposure. Auditory function was evaluated in both ears at the end of shift via both PTA at 0.125, 0.25, 0.5, 1, 2, 4, and 8 kHz and transient evoked otoacoustic emissions (TEOAE), and differences between groups were examined by t-tests. Among six correlations between hearing thresholds and styrene exposure indices, there was one significant correlation with exposure duration at a frequency of 1 kHz and one significant correlation for the current internal exposure at a frequency of 0.5 kHz. No significant correlations were found for TEOAE results. Acknowledging that the reference group was exposed to styrene (albeit at lower levels than the nominal exposed group), auditory function was also compared in 10 controls with lower exposure (mean MA + PGA = 51 mg/g creatinine, range = 25–84) vs. 15 laminators (mean MA + PGA = 695 mg/g creatinine, range = 105–2213). No significant correlations were observed in this comparison. Hoffmann et al. (Citation2006) did not consider the observed associations to provide convincing evidence of a styrene effect under conditions prevailing in Germany when this study was conducted. However, further studies with a design capable of distinguishing the potential impacts of styrene from noise were recommended.
Mascagni et al. (Citation2007) studied a group of 32 workers (20 men, 12 women; aged between 21 and 51 years) in comparison to a control group (52 men, 8 women; aged 22–65 years). The exposed workers were explicitly selected to be exposed to styrene but not to noise. Styrene exposure, as determined by urinary MA + PGA, was 120 mg/g creatinine (median; range 20–410). According to Triebig, Bruckner, and Seeber (Citation2009), this would correspond to a median of slightly below 10 ppm and a range of <10 to approximately 15 ppm. Audiometry was carried out between 0.5 and 8 kHz. The authors observed normal hearing at low and mid-frequencies, a mild deficit at high and very high frequencies, and for frequencies of 4 and 6 kHz an increased hearing weakness of 20 and 25 dB, respectively. For all frequencies investigated except 8 kHz, the exposed subjects showed a lower median value than the controls. The authors acknowledge the limited number of subjects studied. The authors concluded that styrene can cause a mild (≤25 dB) hearing loss. Although hearing impairment was statistically significant, the authors did not consider the severity of being of medical or legal interest and would not compromise hearing in social environments. In addition to the study limitation on the small number of subjects, the study is described in a short communication paper that lacks detailed data and hence prohibits assessment for study quality and reliability. Also, the paper lacks information about long-term/past exposure to styrene and noise. As such, this study is considered as a preliminary investigation.
In an effort to more clearly define the dose-response for styrene-induced ototoxicity in humans, Triebig, Bruckner, and Seeber (Citation2009) extended the preliminary investigation reported by Hoffmann et al. (Citation2006), performing a cross-sectional study with repeated effects measurements using the same styrene exposure data from workers in a German boat-building plant as were used to investigate effects on neurobehavioral effects (Seeber, Bruckner, and Triebig Citation2009a) and color vision (Seeber, Bruckner, and Triebig Citation2009b). Importantly, Triebig, Bruckner, and Seeber (Citation2009) is the only study systematically examining hearing loss at high former exposures in comparison to that at the time of investigation after improvement of the workplace exposure conditions. Hearing ability was measured by standard (0.125–8 kHz) and high frequency (9–16 kHz) PTA and TEOAE as objective methods not confounded by subjective factors. Exposure at the time of investigation was determined by styrene in blood and urinary MA + PGA; the latter served to estimate airborne exposure in ppm. Three groups were defined for current exposure levels: laminators with high (n = 31, 38.8–48.5 ppm), laminators with medium (n = 118, 7.6–15.2 ppm) and non-laminators with low exposure (n = 99, 1.7–3.4 ppm). The low exposure of non-laminators was justified by styrene cross-contamination in the factory hall. The participation rate was 100% according to the predefined inclusion criteria and accounting for absenteeism from work. Noise was not measured individually and ranged between 70 and 83 dBA for all groups. Participants with noise exposures of >85 dBA were excluded from the analysis. The unique strength of this 2005 investigation was that exposure measurement for this company dated back for several decades during which the workplace exposures were reduced several times. The following historical exposures were derived by urinary MA + PGA: 1982–1990: median 100 ppm (range 10–200), 1990–1995: median 80 ppm (range 5–150), and after 1995: median 30 ppm (range 5–100). This solid historical database allowed definition of “high-long” (n = 17, mean job tenure 14.6 years) and “low-short” exposure groups (n = 34, mean job tenure 6.4 years). The high-long subgroup exposed workers were employed at a time before improvements of ventilation systems in the plant led to a significant reduction of airborne styrene levels in the workplaces. The Chronic Exposure Index (CEI MA + PGA) represents individual worklife exposure at different jobs, calculated as the product of exposure concentration and time in months. The Lifetime Weighted Average Exposure (LWAE MA + PGA) represents the individual level of exposure, calculated as CEI divided by job tenure in months. The CEIs for the high-long and low-short exposure subgroups differed by a factor of 10, although current exposures were both in the range designated “medium.” Thus, this approach provides a uniquely robust characterization of historical exposures.
For TEOAE, there was no direct association for the current exposure groups with signal to noise or amplitude. However, signal-to-noise at different frequencies showed a “normal” pattern for the low-short and a deviation from this pattern for the high-long subgroup. Regarding PTA, no clear exposure effect was obtained by variance analysis and linear regression for the current exposure groups. However, when comparing the high-long with the low-short subgroups, significantly higher thresholds were obtained for the high-long at frequencies up to 1500 Hz. In addition, similar to the approach of Morata and Campo (Citation2002) and Śliwińska-Kowalska et al. (Citation2003) (discussed below), the participants were grouped into 105 cases and 132 non-cases according to the criterion of more than 25 dB hearing loss at 3000–6000 Hz. When comparing the current low to medium group, the odds ratio was 1.07 (95% CI 0.58–1.98), clearly non-significant, but for comparison of low to high the odds ratio was 2.47 (CI 0.97–6.33), which approached significance. That said, the comparison of the low-short to the high-long subgroup was clearly significant with an odds ratio of 7.46 (CI 1.08–51.4). For the comparison of the current high vs. low exposure groups, it must be taken into consideration that in the former group participants of the high-long subgroup were probably over-represented.
Triebig, Bruckner, and Seeber (Citation2009) found no hearing loss for current exposures of 7.6–15.2 ppm (“medium” exposure group), and also no evidence of hearing loss in workers with job tenures of approximately 6 years and were also exposed to approximately 39–49 ppm (“high” exposure group). However, in the 39–49 ppm worker group, a non-significant effect could not be excluded because of an odds ratio of marginal significance that might have been influenced by over-representation of the high-long exposure subgroup (workers with median job tenure of approximately 15 years). Clear effects were observed by comparison of high-long and low-short subgroups. This finding shows that former high exposures have to be taken into consideration for the assessment of ototoxicity of exposed workers. The authors themselves conclude that “at levels of about 30–50 ppm as an average inhaled styrene per work day over a period of about 15 years with higher exposure levels above 50 ppm in the past [note: workers described as “high-long”, or approximately 15 years of work history pre-2005, experienced approximately 5 years of past exposure to a median TWA styrene exposure of 80 ppm between 1990–1995], an elevated risk for impaired hearing thresholds can be expected. The formerly published results on ototoxic effects below 20 ppm could not be confirmed”. As mentioned, a potential weakness of the study is that it specifically excluded any analysis of styrene–noise interaction that might have occurred above 85 dBA, and the absence of individual noise exposure measurements at less than this level also excluded evaluation of meaningful styrene–noise interactions. If exposure to noise and styrene occurred at the workplaces, this could contribute to an underestimate of the NOAEC for styrene-alone-induced hearing deficits. Additional limitations of this study are the unbalanced sample sizes among the comparison groups, which might have contributed to the absence of dose–response relationships, there was no indication of accounting for other risk factors of auditory dysfunction, and uncertainty in the transformation of biomonitoring values to airborne exposure estimates.
Evidence of additive and synergistic interactions between noise and solvents, including styrene, has been demonstrated in humans. Śliwińska-Kowalska et al. (Citation2003) evaluated hearing in Polish FRP workers exposed to solvent mixtures in which styrene was a major component. Subgroups of workers exposed to styrene only (n = 194), styrene + noise (n = 56), and noise only (n = 66) were compared with unexposed referents described as white-collar and metal factory workers (n = 157). Current styrene concentrations were measured by personal sampling over most of a work shift, and ranged from 0.05 to 52 ppm. Prior exposures were estimated from the results of workplace inspections over the last 15 years. Worklife exposure averaged about 14 ppm for the styrene-only subgroup (range = 0.81–71.8 ppm, indicating high exposures in former years) and 8 ppm for the styrene + noise subgroup. 60.8% of average worklife exposure exceeded the Polish OEL (11.4 ppm) for the styrene-only subgroup vs. 14.3% for the styrene + noise subgroup. Mean noise levels were 80.3 dBA for styrene-only, 88.6 dBA for styrene + noise, and 89.2 dBA for noise-only subgroups.
Hearing ability was assessed by PTA from 1 to 8 kHz. Examiners were blind to subjects’ exposure status. Odds ratios for hearing loss were calculated on the basis of normal audiograms when none of the single hearing thresholds in both ears exceeded 25 dB. The percentages of abnormal audiograms were 56.2% in the styrene-only subgroup, 63.3% in the noise + styrene subgroup, and 33.8% in referents. Considering the entire solvent-exposure subgroup, a significant, nearly four-fold increase in adjusted odds ratio related to styrene exposure was found (adjusted for age, gender, and current and past noise). The most pronounced effects were seen at high frequencies (6 and 8 kHz) because at these frequencies a significant correlation was found between averaged worklife exposure and the profoundness of hearing loss. The odds ratio also was significantly increased related to current noise exposure, but not to noise in the past.
The odds ratios of hearing loss were 5.2 in the styrene-only subgroup, 3.4 in the noise-only subgroup, and 10.9 in the styrene + noise subgroup. It is noteworthy that styrene exposure was clearly lower for the styrene + noise group as compared to the styrene-only group. Because the odds ratio for hearing loss in the styrene + noise subgroup exceeded the sum of odds ratios for styrene only and noise only, Śliwińska-Kowalska et al. (Citation2003) concluded that the combined exposures caused at least additive effects, as observed in animal studies. The fact that no dose–response relationship was observed in logistic regression analysis between averaged and cumulative lifetime styrene concentrations and the presence of abnormal audiograms when age, gender, and noise exposure were included as confounding factors indicate the limitations of available cumulative exposure metrics in which past peak exposures were averaged out.
A significant increase in hearing thresholds was found for all exposure groups. The least hearing loss occurred in the styrene-only subgroup, and the greatest occurred in the styrene + noise subgroup. The styrene + noise subgroup only differed significantly from the noise-only subgroup at 8 kHz. The effect of noise-only was dominant mainly between 3 and 6 kHz and the combined exposure led to an additional impairment at 8 kHz. Multiple linear regression analysis indicated a positive linear relationship between worklife styrene exposure and hearing thresholds at frequencies of 6 kHz and 8 kHz in the right ear and 6 kHz in the left ear. That high exposures prevailed in the years before the study began is indicated by the high percentage of workers with lifetime average exposures exceeding the Polish OEL in force at the time the study was conducted. Thus, the lack of detailed historical exposure data that capture peak styrene concentrations limits this study’s usefulness for dose–response assessment.
Morata and Campo (Citation2002) examined the effects of styrene, styrene + noise, and noise alone on hearing. Styrene-exposed workers employed for at least a year were recruited from 11 FRP products manufacturers (n = 154) in Sweden. These workers were divided into groups exposed to lifetime noise levels <85 dBA (n = 65) and >85 dBA (n = 89) and without high noise exposure. For comparison, 78 workers from metal product manufacturing companies with high noise levels (mean 85; 75–116 dBA) and 81 subjects not exposed to styrene or excessive noise (mean 77 dBA) were included. No mention was made of respiratory protection use. Styrene exposure was measured by passive personal sampling twice over 3 h and 50 min. For assessment of historical exposures, the total cumulative styrene exposure (CSE) was calculated as the product of time and airborne concentrations from the company mandatory annual sampling records over the preceding 10 years. The current styrene exposure levels measured by passive personal sampling were 3.7 ppm (0.05–22.3) for styrene-only and 2.8 ppm (0.01–11.6) for styrene + noise exposed workers. The 10-year CSE for both groups were 303 and 206 ppm x years, respectively. In addition, biomonitoring was carried out by MA in urine collected over 24 h the same day as for determination of airborne styrene; MA concentrations were only weakly but statistically significantly correlated with styrene air exposures (r = 0.27, p < .001). It is noted that the measured workplace air exposures are extremely low for FRP industries even if respiratory protection is used (Triebig, Bruckner, and Seeber Citation2009; Van Rooij et al. Citation2008). These exposures in the 11 companies studied by Morata and Campo (Citation2002) are lower than the mean reported for contemporary air concentrations in FRP companies operating in Nordic European countries by a factor of nearly 10 (Van Rooij et al. Citation2008). The reason for this remains unexplained. However, it is important to note that the past 10-year CSE values of 303 and 206 ppm-years reported in Morata and Campo (Citation2002) suggest that past years exposures were substantially higher and aligned with past Nordic European FRP industries, i.e., averages of 30.3 and 20.6 ppm-year styrene alone and noise + styrene, respectively (based on annual mandatory sampling). Thus, average annual exposures to styrene in Morata and Campo (Citation2002) may have been substantially higher in each of the preceding 10 years than the mean concentrations measured across the 11 companies by passive dosimetry in this study.
Noise was assessed by personal noise dosimeters over 2.5–12 h (mean 7.6 h). Historical noise exposures were based on qualitative information given by workers, like “quiet” or “very noisy”, and the cumulative noise exposure (CNE) was calculated. PTA was performed at 1–8 kHz. An audiogram was considered normal if the thresholds did not exceed 25 dB at any frequency; otherwise, it was classified as high-frequency hearing loss. Group differences were tested by ANOVA of covariates and thresholds. Multiple logistic regression was done to estimate odds ratios and test for interactions.
Styrene exposures in Morata and Campo (Citation2002) never exceeded the Swedish OEL of 20 ppm in workers directly measured in this study, but noise was above the recommended limits (85 dBA) in 130 of the 313 participants. The prevalence of hearing loss was 48% for simultaneous noise + styrene exposure, 47% for styrene-only, 42% for noise-only, and 33% for non-exposed; also, the differences in prevalence were not statistically significant. Significantly poorer thresholds were observed in styrene-exposed workers at 2, 3, 4, and 6 kHz compared with both of the styrene not-exposed worker groups. Logistic regression showed statistically significant odds ratios for dB >85 developing hearing loss by age (calculated for each year of age), current noise (for each dB over 85 dB) and current MA concentrations. No significant interaction other than additive was noted between styrene and noise. No significant associations were found for cumulative lifetime exposure to styrene or noise (CSE or CNE). According to the authors, the findings suggest that exposure to styrene even below the recommended TLV (20 ppm) had a toxic effect on the auditory system.
A major drawback of Morata and Campo (Citation2002) in comparison to Triebig, Bruckner, and Seeber (Citation2009) is the uncertainty about former potential high exposures. It is unclear when the study was performed, at what times possibly workplace improvements were initiated by the companies to comply with the Swedish TLV and what the exposure levels were in former years. No information is given about the use of respiratory protection, neither at the time of investigation nor in former years, that might help to explain the extremely low exposure by urinary MA. It has been shown by Triebig, Bruckner, and Seeber (Citation2009) that exposure protection depends very much on the kind of respiratory protection devices used. Calculation of the CSE cannot alleviate this concern because high exposures over short periods of time (even months in former years) will be averaged out by periods of lower exposure. Thus, the CSE cannot account for high exposures before the workplace situations were improved. Furthermore, the CSE was only calculated over 10 years while the mean tenures in the FRP companies were 15 and 17 years. Thus, the CSE does not take into account a major part of the total exposure. In conclusion, the authors observed poorer thresholds for styrene-exposed workers compared to both groups not exposed to styrene, but those associations were based on current exposures that did not reflect the likelihood of substantially higher past exposures.
Johnson et al. (Citation2006) extended Morata and Campo (Citation2002) using the same workforce by: (1) including additional parameters related to the auditory system (distortion product otoacoustic emissions or DPOAE) measuring the ability of the peripheral auditory system to follow intensity modulations at various frequencies, psychoacoustic modulation of transfer function (PMTF), recognition of interrupted (distorted) speech, speech recognition in noise, and CRA testing central pathways of the auditory system); (2) comparing the pure tone audiometry results of Morata and Campo (Citation2002) to a Swedish population database of adults not exposed to noise (n = 603, age 20–79 years); and (3) retesting 30 workers of the original study after 4 years. Peripheral damage to the auditory system is demonstrated by PTA, DPOAE, and PMTF. The interrupted speech test and CRA are relatively insensitive to peripheral damage and indicate retrocochlear and central dysfunction.
Comparing the PTA results of Morata and Campo (Citation2002) to a Swedish population database, the authors noted significant differences by t-test for styrene-exposed workers, as well as for those exposed to noise (as may be expected for some frequencies). Over all frequencies and considering the best and the worst ear, there was no clear indication that the styrene + noise group performed worse than the styrene-only group. Thus, an interaction of noise with styrene cannot be concluded by these comparisons. In the retesting of workers, styrene and noise levels (78–92 dB; mean 84 dB) showed no remarkable difference compared to Morata and Campo (Citation2002). Five workers had a significant worsening of hearing threshold (>10 dB) at one frequency and one worker at more than one test frequency; in total, this represented 20% of retested workers. The authors note that threshold shift incidence rates greater than 3–6% are indicative of ineffective preventive practices. As no details are given regarding the noise exposure of the individual retested workers with such large total spans, no conclusion is possible regarding the potential effects of styrene. Interestingly, the authors point to an unexpected finding of the Morata and Campo (Citation2002) study, namely that at 2, 3, and 8 kHz, the group of styrene-only workers had poorer thresholds than the styrene + noise group. It is speculated that variations in exposure history might have been the cause. This can be taken as an indirect evidence of the influence of former high styrene exposure.
Reduction or absence of the DPOAE indicates impairment of OHC function (Abdala and Visser-Dumont Citation2001). At low signal levels up to 50 dB, the control and noise groups had somewhat higher DPOAE levels compared to the styrene and styrene + noise groups. At >50 dB the control group leveled off in comparison with the other groups. This correlated to the hearing thresholds at 4 kHz in control and noise-only exposed but not in the styrene exposure groups. For PMTF, there were significant differences for noise (with and without styrene) and non-noise (with and without styrene) groups. This may be interpreted as indicating that this parameter seems to be more sensitive to noise than to styrene. A significant difference was seen in the latency of CRA between controls and exposed groups, but the authors did not consider the group differences to be clinically meaningful. Speech recognition in noise showed significant differences of all three groups to controls and also the Swedish reference group. Furthermore, the results were correlated to current noise. There were no significant differences in recognition of interrupted (distorted) speech between means of the groups, but there was a tendency (p < .06) for the styrene-only group compared to controls. In comparison to the Swedish reference group, there were significant effects for both styrene-exposed groups. In addition, there was a correlation with cumulative exposure. This may indicate the importance of former high exposures. This parameter was correlated (as may be expected) with speech recognition in noise and CRA.
The authors concluded that the combined results suggest a location of styrene damage both in the peripheral and central portion of the auditory system, with recognition of interrupted speech and speech recognition in noise being more sensitive for styrene effects. The significant limitations of this study include missing information regarding former potentially high styrene exposure and the extraordinary low styrene exposures compared to the broad database of Van Rooij et al. (Citation2008). It should also be mentioned that no clear interactions, and certainly not over-additive effects, were observed for the combined exposure to styrene and noise.
Zamyslowska-Szmytke et al. (Citation2009) also examined the effects of styrene exposure on both peripheral and central auditory functions. Two groups were selected from workers in Polish FRP factories: styrene-exposed (n = 59 production workers, 10% female) and control (n = 50 maintenance and administrative staff, 47% female). None of the subjects was exposed to occupational noise levels >85 dBA. Mean worklife styrene exposure for each subject was calculated from individual styrene exposure levels covering more than 20 years. The overall average worklife styrene exposure was about 8.7 ± 5.2 ppm. The mean noise level for the styrene-exposed group was 79 dBA, with 15% of subjects exposed to noise in the range 81–85 dBA. The mean noise level for the control group was 67 dBA, with 8% of subjects exposed to noise in the range 81–85 dBA. Peripheral auditory function was evaluated in both ears via PTA at frequencies of 0.125–8 kHz. 86.4% of styrene-exposed subjects exhibited abnormal audiograms (at least one audiometric threshold for a single frequency in either ear above 25 dB) vs. 34% of controls. Styrene exposure was also associated with significantly worse hearing thresholds at most frequencies in both ears. Central function was evaluated via three temporal processing tests designed to assess the ability to analyze acoustic events over time: gaps-in-noise, frequency pattern test, and duration pattern test. Group differences in the temporal processing tests were evaluated by analysis of covariance (ANCOVA). ANCOVA covariates were age and hearing thresholds. Higher percentages of styrene-exposed subjects than controls also presented abnormal results in each of the three temporal processing tests. Significant differences between styrene-exposed and control workers in the gaps-in-noise disappeared after adjusting for the covariates of hearing level and age, but remained in the frequency and duration pattern tests, which reflect temporal ordering processes.
Given the greater noise exposure in the styrene-exposed group, the authors suggested that hearing deficits at the high frequencies (3–6 kHz) might be related to noise, while effects at the middle and low frequencies could arise from exposure to styrene. Zamyslowska-Szmytke et al. (Citation2009) speculated that styrene exposure may be related to central auditory dysfunction characterized by a temporal processing disorder. Dose–response evaluation was not possible as historical peak exposures to both styrene and noise were not well characterized. Importantly, in view of the fact that men are much more prone to hearing loss than women (Agrawal, Platz, and Niparko Citation2008), the fact that the control group was nearly half female presents a significant impediment to interpretation not addressed by the authors.
Morata et al. (Citation2011) reported on a cross-sectional multicenter study that included 423 styrene-only and 268 noise + styrene-exposed workers all from FRP industries. For comparison, 359 noise-only and 354 unexposed workers were included. Ages ranged between 18 and 63 years and styrene exposure occurred for at least 6 months. Styrene concentrations were measured by passive sampling over at least 80% of the shift for 85–100% of workers. Noise exposure was also assessed by personal measurements and was dichotomized by <85 dB and ≥85 dB. Styrene + noise-exposed workers had lower levels of styrene exposure as compared to the styrene-only exposed. PTA at 0.5–8 kHz served to determine hearing ability. Styrene exposure concentrations differed in the different participating countries, being lowest in Finland (mean 1.6 ppm) and Sweden (mean 3 ppm) and highest in two factories in Poland (means 15.8 and 14.2 ppm). Noise levels ranged from 54–95 dB (Finland), 70–100 dB (Sweden), 70–97 dB or 59–99 dB (two factories in Poland). Tenure ranged from 1 to 53 years over all factories. An audiogram was defined as normal if the thresholds did not exceed 25 dB. The audiometric thresholds were compared to those of a reference population; the proportions of persons with thresholds exceeding the 50th and 95th percentiles were calculated and the t-test was applied. Styrene-exposed participants had significantly poorer thresholds as compared to the normal reference population, especially for males for both ears at nearly all frequencies, while in women this was only true for their worst ear. Noise exposure was not significant as a variable by itself but it significantly interacted with styrene even at noise levels between 80 and 84 dB increasing the probability of hearing loss. At mean noise exposures ≥85 dB, the effects from noise dominated.
In conclusion, this study confirmed an association between hearing thresholds and occupational exposure to styrene and noise. While no significant effect of noise was noted at means between 80 and 84 dB, a significant interaction occurred with styrene. The authors noted that noise and styrene levels generally were below the local exposure limits, and cautioned that the participants could have been exposed to higher levels in the past. A precise identification of the contribution of each factor was not possible because of lack of exposure histories. Although the data indicate that low exposures to noise and styrene were associated with an increased probability of hearing loss (without quantification of possible past higher styrene exposures), dose–response calculations or proposals for safe exposure levels for styrene are not possible. The authors of this study postulated that the most informative information comes from animal studies (Lataye et al. Citation2005) that led the French National Research and Safety Institute for the Prevention of Occupational Accidents (INRS) to reduce the OEL from 50 to 30 ppm, in addition to compulsory use of hearing protection.
Interestingly, the odds ratios for hearing loss were not significantly increased when comparing both of the Polish facilities with high styrene exposures (14.2 and 15.8 ppm) to the Swedish facility with a mean exposure of 3 ppm. In addition, although styrene exposures were quite different between the Scandinavian (1.6 and 3 ppm) and the Polish companies, the authors do not analyze hearing loss in relation to the mean styrene exposures. Thus, this large study cannot be used to distinguish effects with respect to exposure levels. Instead, the authors caution not to use these data for setting an OEL because of uncertainties of historical exposures. This caution would also apply to the use of the findings of Morata and Campo (Citation2002) and Johnson et al. (Citation2006).
There were a number of limitations to the Morata et al. (Citation2011) study that precludes definitive conclusions. Characterization of the study population was lacking. Characteristics were provided by research center for the global initial population but not the study participants. No indication of comparability between the study groups for age, job tenure, and gender was provided and no inclusion/exclusion criteria or hearing risk factors considered were provided. The study only considered current exposure to styrene, whereas long term and past styrene and noise exposures were not considered. In their evaluations of the proportion of persons with threshold worse than the P50 and P90 metrics, there was no clear distinction between the results of the group exposed to styrene only, the group exposed to styrene and noise, and the group exposed only to noise. The study results also did not support dose–response analyses.
Sisto et al. (Citation2013) determined function of the cochlea by TEOAE and DPOAE as biomarkers of mild cochlear damage in a small group of FRP factory workers. Styrene exposure was determined by personal dosimetry of airborne styrene and by biological monitoring of MA + PGA in urine and noise exposure by wearable phonometers. Historical exposure levels were not provided and no information was given as to eventual improvements of styrene exposures in former years. Workers employed in molding were defined as styrene exposure group (S, n = 9, age 28–47 years, tenure 5–26 years) with styrene exposure levels in the order of 20 ppm and noise levels below the action level of 85 dB with a mean of 83 dB (range 80.7–84.2 dB). Slightly different levels were given by Tognola et al. (Citation2015): mean 82.4 dB (range 80.7–83 dB). Refinery workers defined as the noise + styrene group (NS) group (n = 6, age 32–52 years, tenure 3–27 years according to Tognola et al. Citation2015) were exposed to lower styrene concentrations by about 1 order of magnitude (according to Tognola et al. (Citation2015) ≪ 2.3 ppm), but higher noise levels with a mean of 87.7 dB (range 86.7–88 dB). All subjects of the NS group used hearing protection during the whole workshift, so the actual noise exposure is unclear. A range of 1.1–35 ppm was given for styrene exposures, but it is unclear whether it related to the S group or both, the S and the NS groups. The working zone of the S group was separated from that of the NS workers ensuring low noise exposure to the S workers. But this separation was only established 10 years prior to the time of the study and therefore in the preceding years, the S workers had also been exposed to considerable noise. A control group (C, n = 13, age 24–46 years) was composed of management employees, Ph.D. students, and researchers. TEOAE was recorded at 0.5–5 kHz and DPOAE at 1–6.4 kHz. To better discriminate ototoxic effects of noise and styrene, two subgroups were defined (n = 3, in each subgroup) consisting of younger subjects of the S and NS groups (SY and NSY) with a mean age of 32 and 34 years, respectively, and a total professional exposure duration of <10 years. These subgroups allowed the exclusion of possible hearing loss associated with age.
DPOAE was capable of discriminating at a statistically significant level group C from both, the S and the NS group by ANOVA and multivariate analysis of variance (MANOVA). A significant difference was also found for the SY and NSY groups by which hearing loss potentially associated with age was potentially excluded. Statistically significant differences over all frequencies (1–6.4 kHz) were observed when comparing the S, NS and NSY groups to controls. Pairwise comparison by t-test gave significant differences between the C group and the S and NS groups for almost all frequency bands. The authors concluded that the levels of styrene and noise exposure were sufficient to significantly affect otoacoustic emissions and a negative correlation was found with urinary styrene metabolites. DPOAE allowed discrimination from normal hearing with hearing thresholds ≤20 dB (at 2 and 3 kHz) and mild hearing loss with thresholds ≤30 dB for all subjects at all frequencies. A hearing loss of 20 dB is considered as the maximum compatible with a standard definition of normal hearing. The TEOAE results were qualitatively similar to those of DPOAE, but the diagnostic capability was slightly lower for TEOAE. A limitation of the study noted by the authors was the small group sizes under investigation that would warrant confirmation by larger cohorts. Although the S and NS groups were clearly separated by present noise levels according to the permissible level of 85 dB, the lack of former noise exposure levels of the S group before local separation of S and NS groups does not allow effects of potential former higher noise exposures to be excluded. In addition, similar to many of the other studies referenced above, no information is available for former styrene exposures that might have led to irreversible damage to hearing at that time. The study population characteristics also indicate a number of limitations, including, lack of information on inclusion, exclusion criteria and hearing risk factors, the small sample size (from 3 to 9 subjects per exposure group, 13 for the controls), and the small groups were not matched for age or gender. The statistics used in the study were also not clear and in some cases were confusing. For instance, the authors conclusion that measured levels of exposure to styrene are sufficient to affect the OAE response level as the exposed subjects belonging to the group S were exposed to styrene concentration on the order of the ACGIH TLV of 20 ppm, was presumably based on the (M)ANOVA which was performed on groups of small size that were not matched. There conclusion of good correlation between styrene in air and MA + PGA in end shift urine had a regression analysis that predicted that an airborne styrene concentration of 85 mg/m3 would correspond to a MA + PGA concentration of about 200 mg/g creatinine and not 400 mg/g creatinine as estimated by ACGIH, which the authors explain is to their highly specific analytical method (HPLC-MS/MS) that leads to more reliable, but systematically lower urinary levels that less specific techniques, such as HPLC-UV, an assertion that was not justified. There are also questions on the study’s dose–response analyses. Although measured and results provided for the S group, styrene concentration in air was not introduced in the dose–response analyses and, although not provided, MA + PGA concentration was used at the “best approximation of the inhaled dose”. The current biological concentrations were not used and rather the “chronic exposure level” was included among the linear predictors, a concept that lacked explanation and its statistical handling unclear. The linear predictors tested were also not specified.
Chiaramello, Moriconi, and Tognola (Citation2014) applied a different TEOAE technique in a subgroup of FRP workers exposed only to styrene that was previously examined by Sisto et al. (Citation2013). This bispectral TEOAE technique calculates the amplitude of quadratic frequency couplings (QFCs), which are consequences of non-linearities. Healthy cochleae exhibit highly non-linear acoustic behavior, whereas with cochlear damage, a linear change occurs due to a progressive loss of compression in the cochlear amplifiers. TEOAEs are the by-products of active and non-linear cochlear amplification mechanisms and hence are used to estimate the degree of non-linearity of the active mechanisms in the cochlea. This study examined the TEOAEs in both ears of seven workers that were previously recorded by Sisto et al. (Citation2013) and 27 control subjects who were not exposed to noise and styrene. Sisto et al. (Citation2013) reportedly studied nine styrene-exposed workers and 13 controls, hence there is an unexplained discrepancy in the number of study subjects reported in these studies. Chiaramello, Moriconi, and Tognola (Citation2014) found a difference in amplitude of QFCs between the workers and controls with the workers showing TEOAE non-linear components in the 1.5–4 kHz frequency range and the controls showing these components in a lower frequency region, ranging from 1 to 3 kHz. The authors concluded the QFCs amplitude demonstrated differences in TEOAEs between the workers and controls, although the study’s small sample size and need for further confirmation in a larger study was acknowledged.
Tognola et al. (Citation2015) reported an extension of Sisto et al. (Citation2013) using the same groups of styrene (S) and noise + styrene (NS) exposed workers. The control groups were composed slightly differently with 9 subjects matched to the S and 6 subjects matched to the NS group. Audiometric thresholds were determined by PTA at 0.5–8 kHz. In all examined ears, no audiometric threshold exceeded 30 dB at any frequency. In addition, thresholds were compared to those expected for a matched population of otologically normal people, as described in the ISO 7029 standard (ISO, Citation2017). For the S group, higher thresholds were observed in 8 of 18 ears at 0.5 kHz, 4 of 18 ears at 4 kHz and 2 of 18 ears at 6 kHz. For the NS group, higher thresholds were found in 8 of 12 ears at 0.5 kHz and in 2 of 12 ears at 1 kHz. Interestingly, the most frequent deviations from normal were observed at the lowest frequency at 0.5 kHz. In both of the control groups, no subjects with hearing thresholds higher than the International Organization for Standardization (ISO) reference values were found.
TEOAE analyses that proved to be less sensitive than DPOAE endpoints in the Sisto et al. (Citation2013) study were analyzed by three different features to detect subclinical changes in interaction cochlear mechanisms responsible for otoacoustic emission generation. Exposed subjects showed significantly lowered signal-to-noise ratios at mid-to-high frequencies (above 1.6 kHz) and a shift of quadratic frequency couplings towards lower frequencies than controls. No systematic differences were observed in latency. The authors concluded that low-level exposure to styrene may have induced modifications of cochlear functionality without affecting latency and that the lack of change in latency seems to suggest that the otoacoustic emissions components, where generation region and latency are tightly coupled, may not have been affected by the styrene and noise exposure levels considered. The authors cautioned however that these findings should be confirmed with cohorts of larger size. Overall, the same critiques with regard to ototoxicity of different exposure levels of styrene and its combination with noise apply as mentioned above for Sisto et al. (Citation2013). The small sample size, the absence of information on inclusion, exclusion criteria and considerations of hearing risk factors, the poor descriptions of styrene and noise exposure characterization, and the absence of evaluations for dose–response relationships are among the limitations of this study.
Sisto et al. (Citation2016) recently repeated the DPOAE tests in a group of styrene-exposed molders from the same Italian FRP facility using a new technique. The mean styrene exposure of the exposed group (n = 9 women) was higher than previously reported (26.5 ppm), with a concurrent noise exposure level of 82 dBA. The control group (n = 8, 6 females and 2 males) of the same age as the exposed group, with no exposure to solvents, noise, or other ototoxic agents. Urinary metabolites MA + PGA were used as biomarkers of exposure. A time-frequency wavelet filtering method was applied to separate the two DPOAE components (zero- and long-latency) according to their different phase-gradient delay, assumed to reflect the different otoacoustic emission (OAE) generation mechanisms (Moleti, Longo, and Sisto Citation2012). Unlike the previous DPOAE results (Sisto et al. Citation2013), the significant decrease in DPOAE amplitude was localized to the mid-frequency range (2–4 kHz). Like the more detailed TEOAE results reported by Tognola et al. (Citation2015), this effect localization is similar to that reported in animal studies (e.g., Chen et al. Citation2007). The authors of these three related studies interpreted their results as suggesting that exposures to styrene and noise may have modified both linear and nonlinear OAE generation mechanisms in the cochlea that resemble effects reported in animal studies. Limitations of these studies for dose–response evaluation are the very small sample sizes and incomplete exposure histories.
Of interest with regard to the potential ototoxicity of styrene in the general population is a Ph.D. thesis project examining the relationship between exposure to styrene and other simple aromatic solvents (assessed via concentrations in blood from subjects aged 20–59 years measured in the NHANES 1999–2004 data sets) and hearing impairment assessed as self-reported hearing loss or tinnitus and audiometrically assessed hearing loss (pure tone threshold change greater than 25 dB in either ear) (Staudt Citation2016). The number of study participants was 2513 but the sample size varied with analysis as the available data for each of the studied solvents and outcomes was variable. The median styrene concentration in blood was 0.28 µg/L (193 times lower than the styrene blood concentration in the “low exposed” worker group examined by Triebig, Bruckner, and Seeber (Citation2009) and 13,650 times lower than the calculated peak concentration in rat blood at the rat oral NOAEL, 200 mg/kg (Chen, Tanaka, and Henderson Citation2008). Potential effects on low-frequency (defined as average pure-tone threshold change at 0.5, 1, or 2 kHz greater than 15 dB in either ear) and high-frequency (defined as average pure-tone threshold change at 3, 4, 6, or 8 kHz greater than 15 dB in either ear) deficits were considered separately. Covariates considered were age, gender, race/ethnicity, self-reported use of ototoxic medications during the past month (aminoglycosides, antineoplastic drugs, nonsteroidal anti-inflammatory drugs, or loop diuretics), smoking, diabetes, non-occupational noise exposure, and total household income. There were no significant increases in crude or adjusted odds ratios for styrene exposure and self-reported or audiometrically assessed hearing loss or self-reported tinnitus. Crude odds ratios for low- and high-frequency hearing loss were slightly but significantly elevated for styrene as well as benzene, toluene, ethylbenzene, and xylenes. After adjustment for covariates, odds ratios for styrene were no longer elevated; those for benzene, toluene, and ethylbenzene and high-frequency hearing loss were elevated. As noted by the author, blood concentrations of volatile organic compounds (VOCs) are reflective of recent rather than chronic exposures, and thus are not an ideal exposure metric for a chronic health effect (Staudt Citation2016). However, when background exposure is constant, as it is with styrene and the other aromatics considered in the thesis, blood concentrations can provide an accurate representation of chronic exposure. As such, these results provide reassurance that the general public is not at risk of styrene-induced ototoxicity.
Mode of action
Studies in rats have shown that styrene-induced ototoxicity results from sufficient short term rather than cumulative exposures (see discussion above of the Chen, Tanaka, and Henderson Citation2008 animal toxicity study). Styrene causes hearing loss by damaging the organ of Corti in the cochlea, initially targeting Deiters’ cells (or possibly Hensen’s cells), followed by OHCs, with a susceptibility gradient from the third row (most sensitive) to the first row (least sensitive) (Campo et al. Citation2001; Chen et al. Citation2007; Fetoni et al. Citation2016; Lataye, Campo, and Loquet Citation2000; Loquet, Campo, and Lataye Citation1999). IHCs and SGNs are also sensitive to injury by styrene (or its metabolites), but usually at higher styrene exposures and after the appearance of OHC lesions (Lataye et al. Citation2001).
Along with other supporting cells, Deiters’ cells are involved in creation and modulation of extracellular matrices, removal of the neurotransmitter glutamate from synaptic clefts, and active regulation of the ionic composition of endolymph and perilymph through the recycling of potassium (K+) from the basolateral side of hair cells back to the endolymph (Monzack and Cunningham Citation2013; Wan, Corfas, and Stone Citation2013). Thus, as suggested by Campo et al. (Citation2001), destruction of supporting cells could doom associated OHCs via buildup of K+ as well as loss of physical support. Loss of supporting cells could also result in the loss of SGNs observed at higher styrene concentrations, as cochlear supporting cells have been shown to perform glia-like trophic functions in enabling neuronal function and survival (Monzack and Cunningham Citation2013; Wan, Corfas, and Stone Citation2013).
It is not clear whether styrene, SO, some other styrene metabolite or some combination thereof is responsible for damaging the cochlea. Implication of a metabolite is suggested by the observation that co-exposure with ethanol (4 g/kg bw), an inducer of CYP2E1, both enhanced styrene metabolism and markedly potentiated its ototoxicity in rats (Loquet et al. Citation2000). This result is in striking contrast to that obtained in a similar experimental design with toluene, which is not capable of forming alkene-epoxide metabolites (Campo et al. Citation1998). Rats pretreated with the enzyme inducer phenobarbital exhibited enhanced metabolism of toluene and protection from ototoxicity, indicating that the parent compound is responsible for this effect (Pryor et al. Citation1991). Ethanol, a known competitive inhibitor of toluene metabolism (Sato, Nakajima, and Koyama Citation1981), slightly increased the ototoxicity of co-administered toluene, presumably due to the increase in circulating parent compound (Campo et al. Citation1998). Further support for a styrene metabolite’s role in cochlear damage is suggested by a study that found older rats (25–27 months of age) with presumed lower styrene metabolic capacity, were less sensitive to OHC loss and hearing threshold shift than young (3-month-old) rats exposed to 700 ppm for four consecutive weeks, with no evidence of recovery six weeks post-exposure (Campo et al. Citation2003). The older rats had heavier body weights (500 gm versus 300 gm for young rats) which could have impacted the findings of this study.
The same research group later examined age-dependence of ototoxicity in rats without the potentially complicating factor of age-related body weight differences by manipulating the diets of 3- and 5-month-old animals to equalize body weights (Lataye et al. Citation2004). The key finding was that 3-month-old rats were more sensitive than 5-month-old rats, regardless of body weight. Because cochlear structures in the rat are said to be fully mature by three months of age, it was hypothesized that age-related increases in hepatic metabolic capability might be responsible for the lesser susceptibility of older animals, i.e., implicating parent compound as the proximate ototoxicant (Lataye et al. Citation2004; Pouyatos, Campo, and Lataye Citation2005). However, the effects of the dietary manipulations on relevant enzyme activities were not investigated.
The mechanism by which styrene and/or metabolites damage cochlear cells is also unresolved. The mode of cell death in the majority of both Deiters’ cells and OHCs appears to be apoptosis, with activation of both mitochondrial-dependent caspase-9 (cysteine-aspartic acid protease) and death receptor-dependent (caspase-8) pathways (Chen et al. Citation2007). As noted previously, the fact that higher concentrations of glutathione in apical cells seem to spare these cells from styrene-induced damage suggests the involvement of SO, with its ability to react with cellular glutathione, as the active metabolite. Similarly, one of the reasons that guinea pigs are not susceptible to styrene-induced ototoxicity has been postulated to be due to much higher concentrations of glutathione and glutathione-related enzyme activities in both the liver and cochlear sensory epithelium of guinea pigs as compared to rats (Lautermann et al. Citation1997). The hearing threshold shift and OHC death (especially via apoptosis) in rats receiving 400 mg styrene/kg for three weeks were reduced by administration of the pro-glutathione synthesis drug N-acetyl-L-cysteine, suggested by the authors as possible involvement of oxidative damage in eliciting apoptosis (Yang et al. Citation2009). Alternatively, this co-treatment protection could also implicate parent compound as the proximate toxicant in that maintenance and elevation of glutathione in the liver, a primary site of systemically absorbed styrene metabolism, would be expected to reduce release of free SO from liver to blood due to enhanced liver detoxification of SO via glutathione-transferase-mediated conjugation of SO with glutathione.
A recent mechanistic study supports the importance of oxidative stress in ototoxicity and provides further definition of cochlear responses to styrene treatment. Fetoni et al. (Citation2016) evaluated the efficacy of the water-soluble coenzyme Q10 analog Qter® in protecting against ototoxicity (evaluated by ABR threshold and amplitude of DPOAEs) and combating oxidative stress (as evidenced by production of superoxide anion and lipid peroxidation) in both OHCs and Deiters’ cells from rats administered 400 mg styrene/kg bw via gavage in olive oil for 1, 2, or 3 weeks. Coenzyme Q10 is a component of the electron transport chain and participates in aerobic cellular respiration. This substance performs as an electron carrier and hence can act as a free-radical scavenging antioxidant. As reported by others, styrene at this dose impacted hearing most strongly at mid-frequencies and caused preferential damage to Deiters’ cells and OHCs in the cochlear middle turn, with a gradient of increasingly severe injury from the third to first OHC rows. There was a much smaller impact on SGNs in the middle turn. Styrene increased superoxide levels in the organ of Corti, SGNs, and the stria vascularis, and increased 8-isoprostane expression (a biomarker of lipid peroxidation) primarily in the stria vascularis and SGNs, with greater involvement of Deiters’ cells than OHCs.
Qter® ameliorated the styrene-induced decrease in DPOAE amplitude (especially at the later time points) and ABR threshold shift. Loss of OHCs and SGNs was reduced by Qter®, but the treatment notably did not save Deiters’ cells. Different patterns were also evident in the two indicators of oxidative stress. Qter® treatment significantly decreased superoxide production, and also stimulated superoxide dismutase expression in OHCs but not in Deiters’ cells. Whereas Qter® was able to ameliorate lipid peroxidation in OHCs, Deiters’ cells were not protected. These results provide support for a free radical-mediated mode of toxicity for styrene in the inner ear, but suggest a different mechanism of styrene toxicity and/or greater sensitivity of the apparent critical target, Deiters’ cells. Fetoni et al. (Citation2016) also investigated the interaction of styrene with noise exposure (98 dB for 1 hour/day, 5 days/week, for 3 weeks). The significant styrene-induced decrease in OHCs, SGNs, and Deiters’ cells, not affected by noise alone, was accentuated in the combined exposure.
Some data in humans also support the importance of oxidative stress in ototoxicity. Glazier et al. (Citation2010) reported that specific antioxidant enzyme genotypes modified susceptibility to hearing impairment in organic solvent-exposed workers. Oxidative stress biomarkers have recently been associated with sensitive indices of hearing impairment in solvent-exposed workers. As discussed previously, workers in an FRP facility exposed to mean styrene concentrations of about 26.5 ppm (and noise levels of 82 dB) exhibited reduced amplitude of total DPOAEs in the mid-frequency range compared to age- and sex-matched controls said to have no exposure to solvents, noise, or other ototoxic agents (Sisto et al. Citation2016). Urinary concentrations of MA + PGA and the DNA and RNA oxidation products 8-oxo-7,8-dihydroguanine (oxoGua), 8-oxo-7,8-dihydro-20-deoxyguanosine (oxodGuo), and 8-oxo-7,8-dihydroguanosine (oxoGuo) were measured in the exposed workers. Oxidation products were not measured in controls, but concentrations were said to be elevated compared to published levels in unexposed workers (Manini et al. Citation2009). A relationship between styrene metabolites and oxidation products was only observed for the RNA oxidation product oxoGuo in non-smokers. However, a significant negative relationship was reported for oxoGuo and DPOAE components at specific frequencies (Sisto et al. Citation2016). The authors interpreted this study as supporting the mechanistic hypothesis of styrene-induced damage of the cochlear amplifier in the mid-frequency range, consistent with OHC apoptosis associated with oxidative stress. A critical limitation of this conclusion is that urinary oxoGuo is not an indicator of organ-specific toxicity. Because liver is the primary locus of styrene metabolism, and has a much greater tissue mass than the inner ear, it rather than the target tissue may be the dominant source of urinary oxoGua.
Summary of ototoxicity
Ototoxicity is the most thoroughly evaluated neurosensory consequence of styrene exposure. It appears to be an irreversible effect, resulting rapidly from sufficiently high short-term rather than cumulative lower exposures, and not worsening with continuing exposure. Styrene and/or its metabolite(s) act by damaging the organ of Corti in the cochlea, initially targeting Deiters’ cells (or possibly Hensen’s cells), followed by OHCs. The mode of cell death in the majority of both Deiters’ cells and OHCs has not been defined, but appears to involve apoptosis triggered by oxidative stress. Noise and styrene have different targets and modes of action and can act additively, and under some circumstances synergistically, in damaging the cochlea (Campo et al. Citation2014; Chen and Henderson Citation2009; Fetoni et al. Citation2016; Lataye, Campo, and Loquet Citation2000; Mäkitie et al. Citation2002, Citation2003; Venet et al. Citation2015). Given the well-established importance of industrial noise as the most important ototoxic workplace hazard, adequate control of this variable is imperative for reliable attribution of hearing loss to styrene exposure.
Overall, the animal and human data support several conclusions regarding styrene and ototoxicity:
Styrene-induced ototoxicity has been demonstrated in rats, resulting in defined NOAECs and LOAECs.
Functional, electrophysiological and histopathological markers have been defined.
The underlying histopathological effect is irreversible.
The NOAEC defined by histopathology changes to the cochlea is (slightly) lower than that for hearing impairment.
Ototoxicity is a systemic effect occurring after oral and inhalation exposure.
Ototoxic effects noted with other aromatic solvents are similar to those observed with styrene.
Synergism is observed for co-exposure to noise and styrene. The effect of noise peak exposures is more pronounced than that of continuous noise.
Ototoxicity was not observed in workers with job tenures of approximately 6 years and exposed to TWA exposures of 39–49 ppm. However, the possibility of mild otoxicity could not be excluded among workers experiencing average exposures between 30 and 50 ppm at the time of the study (Citation2005) and who also had mean job tenures of approximately 15 years and experienced higher median exposures of 80 ppm from 1990 to 1995. Thus, higher historical TWA styrene exposures of approximately 80 ppm in longer-term employees likely accounted for possible evidence of mild ototoxicity observed in all workers (pooled shorter and longer term job tenures) experiencing and average of 30–50 ppm styrene TWA exposures.
Given that rat studies noted that ototoxicity is dependent upon high short-term exposures as compared to no effects in longer term exposures resulting in higher cumulative exposures than the high short-term exposures, adjustment of styrene ototoxicity risks for the general population for time of exposure is not warranted, e.g. correction of worker 8 h/day, 5 days/week exposures to general population 24 h/day, 7 days/week exposures.
While thresholds for styrene-induced ototoxicity have been identified in animals exposed via both oral and inhalation routes, comparable thresholds are difficult to identify in occupationally exposed humans given the wide range of human susceptibility, the large uncertainties inherent in historical exposure estimation in epidemiological studies, and the confounding influences of other chemical exposures (including drug and alcohol use), and noise in both workplaces and the general environment. As noted previously, it is well known that high exposures with inconsistent use of personal protection were historically common in FRP industries, especially for laminators (the workforce most often studied for effects on hearing). Thus, the fact that hearing deficits have been reported to occur in some studies only after years of occupational exposure (especially prior to institution of modern exposure controls) suggests that uncharacterized historical high short-term exposures may have been responsible for the effect.
Triebig, Bruckner, and Seeber (Citation2009) provide the most robust exposure assessment of the studies reviewed for this report, characterizing current and historical styrene exposure regardless of protective equipment use in a relatively detailed manner and excluding workers likely to have experienced noise-induced hearing loss. Audiometric thresholds were not affected in the group with current high exposure of about 39–49 ppm with job tenure of about 6 years (per the results reported by Sass-Kortsak, Corey, and Robertson (Citation1995) and Calabrese et al. (Citation1996)), but were significantly elevated in the high-long exposure group (with a job tenure of up to 26 years and exposed to high styrene levels of 30–50 ppm as an overall average, with concentrations of 80–100 ppm prior to 1995). Taking into account the apparent irreversibility of styrene-induced hearing loss, a NOAEC for humans of 20 ppm can be derived from this study.
Reproductive and developmental toxicity
Cohen et al. (Citation2002) concluded that styrene was not an apparent reproductive toxicant although acknowledged that thorough testing was lacking. The authors noted that the available developmental toxicity studies did not indicate styrene to be a major concern (no malformations reported); however, delayed postnatal development had been reported in rat offspring following prenatal or postnatal inhalation exposure; additionally, rat teratology studies had shown evidence of fetotoxicity, fetal body weight reduction, and reduced pup survival at doses that also produced maternal toxicity.
Since the Cohen et al. (Citation2002) review was published, OECD guideline two-generation reproductive and developmental neurotoxicity studies have been conducted in rats for styrene (Cruzan et al. Citation2005a, Citation2005b) and two major authority reviews have been completed which assessed styrene’s potential reproductive and developmental toxicity (20 ppm (equates to 400 mg urinary metabolites mandelic acid + phenylglyoxylic acid/g creatinine) (NTP CERHR, Citation2006); U.K. HSE, Citation2008). Overall, these studies and reviews provide further support for Cohen’s conclusions that styrene is a low concern for reproductive and developmental toxicity at environmental and occupational exposures.
The updated assessment of styrene’s reproductive and developmental toxicity focuses on the authority reviews and conclusions and descriptions of the studies upon which the review’s conclusions are based, as well as some more recent studies.
Reproductive (fertility) toxicity
Styrene has been well tested for reproductive toxicity effects in animal studies and a number of human studies are reported, although this information is limited. Both the NTP CERHR (Citation2006) and U.K. HSE (Citation2008) assessments reach the conclusion that there is no indication of adverse effects on reproductive parameters in humans and experimental animals related to styrene exposures. However, both assessments did identify elevated prolactin levels in exposed workers as a finding noting that the interpretation of the clinical relevance is uncertain. Below is a summary of the human data and experimental animal data for styrene and reproductive toxicity; the available information on prolactin is summarized in the endocrine disruption discussion at the end of this section.
Human studies
A number of human studies have examined styrene and effects on female fertility. Those studies evaluated by the NTP CERHR (Citation2006) and/or U.K. HSE (Citation2008) are summarized below; in addition, summaries of a few studies not evaluated by these authorities or more recently reported are also provided. The comments in a review of styrene reproductive toxicity by Brown (Citation1991) and Brown et al. (Citation2000) are also presented.
Lemasters, Carson, and Samuels (Citation1985) described historical styrene exposure information in the U.S. giving valuable information on exposure levels for the years 1969–1981. In total, 1500 occupational exposure values form 28 FRP manufacturers were available for the years 1969–1981. Average exposures to styrene in most open-mold companies (24–82 ppm) were generally two- to three-times the exposures in press-mold companies (11–26 ppm). Manufacturers of smaller boats had mean exposures of 82 ppm compared to 37 ppm for yacht companies. There was a considerable overlap among job titles classified as directly exposed within open and press-mold processing. In the subsequent retrospective cohort study Lemasters, Hagen, and Samuels (Citation1985) evaluated 174 styrene exposed and 449 unexposed women working in 36 FRP companies. Menstrual histories were obtained by questionnaire and mean exposures were estimated as 52 ppm for open mold and 13 ppm for all other processes. The authors found no association of exposure with menstrual abnormalities (dysmenorrhea, intermenstrual bleedings, amenorrhea, menstrual blood clots, and hypermenorrhea). According to Brown (Citation1991) this is a most comprehensive study on potential menstrual dysfunction. In a later investigation, Lemasters et al. (Citation1989) studied the length of gestation and birth weight of children from mothers in 36 FRP companies between 1974 and 1981. Reproductive and work histories were obtained by telephone interviews. The final cohort consisted of 229 exposed and 819 unexposed single-birth pregnancies. Categorical styrene exposures were defined as none, low (<30 ppm), and high. A subset of the 50 highest exposed pregnancies in boat building (average exposure 82 ppm over at least 1 month) was identified. No effect of exposure on length of gestation was found. The observations on birth weight are reported in the “Human studies (malformations, spontaneous abortions)” section of this article.
Mutti et al. (Citation1988) performed a retrospective cohort study of 35 exposed men and 43 women at 12 FRP plants and 78 unexposed manual workers selected from local blood donors. According to Brown et al. (Citation2000), this likely is not an unbiased control group as blood donors are self-selected and health screened. By biological monitoring, the average 8-h TWA was calculated to be 25 ppm (range 10–105 ppm). The results indicated that the duration of the menstrual cycle was significantly shorter in exposed individuals than in controls and that the exposed individuals had more irregular cycles. In the exposed group, fewer children were reported than in control group with or without ever using contraceptives. Brown et al. (Citation2000) commented that this finding may reflect reduced fertility or may be due to non-contraceptive birth control in the exposed and it is not possible to distinguish between an occupational exposure effect and the difference between reproductive choices of both groups. The authors suggest that exposure to styrene may be associated with gynecological disturbances and reduced fertility. However, according to Brown et al. (Citation2000), no conclusion can be drawn because of the pronounced differences in contraceptive use and reproductive aspirations in both groups.
Tabacova and Balabaeva (Citation1993) studied pregnancy complications in 130 women living in a region contaminated with organic solvents from a petrochemical plant. Exposure to styrene was estimated by urinary MA. Significantly higher MA concentrations were found in women with complications in pregnancy (60.6 mg/L) than in women without complications (42.4 mg/L). The highest levels were observed for late toxemia with nephropathy (72.5 mg/L), arterial hypertension (70 mg/L), proteinuria (61 mg/L), hospitalized threatened spontaneous abortion (68.6 mg/L) and hyperemesis (67.9 mg/L), all being statistically significant compared to normal pregnancies (42 mg/L). Similarly, when comparing the number of cases with urinary concentration of >60 mg/L, the % incidences were significant for hospitalized threatened spontaneous abortions (71.4%), proteinuria (58.3%), arterial hypertension (100%), nephropathy (100%) and hyperemesis (71.4%) in comparison to normal pregnancies (16%). No differences were found for pregnancies with and without complications in regard to age, order of pregnancy, number of births, previous spontaneous abortions, or smoking. For the interpretation of the findings, the high environmental exposure first has to be considered reaching about one-tenth of the Biological Exposure Index (BEI) with a relatively small difference between normal pregnancies and those with complications. In addition, the number of pregnancies in the study was small: normal pregnancies n = 25, hospitalized threatened spontaneous abortions n = 14, proteinuria n = 24, arterial hypertension n = 6, nephropathy n = 6, and hyperemesis n = 7. Finally, other important confounders, although mentioned in the paper to have been asked for, were not included in the analysis (such as medication and drug use, drinking habits, and socioeconomic status). Overall, although some indications were obtained for complications during pregnancy, the findings of this study are not conclusive.
Georgieva et al. (Citation1998) examined menstrual cycle characteristics in 110 women working at a petrochemical plant in Bulgaria [140 according to of the paper] (ages ranged between 23 and 51 years) exposed to a mixture of aromatic hydrocarbons (benzene, toluene, xylene, 1,3 butadiene, and styrene) compared to 45 administrative personnel controls. Ambient air concentrations for most of the workplaces were above time-weighted average [presumably for Bulgaria] but no further data are given. No influence of exposure on menstrual cycle characteristics was reported. The study is, however, of limited value not only because of the small group size (as stated by the authors) but also due to insufficient exposure characterization.
Cho et al. (Citation2001) performed a retrospective study on the prevalence of oligomenorrhea in 1408 women aged 20–40 years recruited from a governmental petrochemical industrial park that had applied for permission to marry or to become pregnant in China. Exposure to benzene, toluene, styrene, and/or xylene was assessed based on industrial hygienist evaluation and exposure was defined if any of these solvents was present. The average levels of these solvents were <1 ppm, for benzene, it was <0.2 ppm. There were 440 women with exposure to any aromatic solvent, of whom 276 were exposed to styrene (3 were exposed only to styrene). Information on estrous cycle was obtained by questionnaire. Only oligomenorrhea as defined as average cycle length >35 days was prevalent enough to allow for statistical analysis. Of women not exposed to any aromatic solvent, 8.5% reported oligomenorrhea. Among women exposed to any solvent, 12.7% reported oligomenorrhea, and among women whose exposure included styrene, 14.5% reported oligomenorrhea. After adjustment for potential confounders, the odds ratios were 1.24 (95% CI 0.9–1.99) for any aromatic solvent and 1.65 (95% CI 1.05–2.55) for styrene with or without coexposure to other solvents. According to NTP CERHR (Citation2006) the use of industrial hygiene data, the large sample, and the adjustment for confounders are strengths of this study. Limitations include a lack of individual exposure data, exposure to multiple other chemicals, and the low average styrene concentration.
Franck et al. (Citation2014) investigated as part of the LINA project (Lifestyle and Environmental Factors and their Influence on Newborn Allergy) the potential impacts of redecorating homes on infants in Germany being treated for wheeze. Renovating activities were ascertained for 465 recruited mother-child pairs between week 20–34 of pregnancy up to the age of 1 year of the child. Potential confounders such as smoking or pets were considered. The study concentrated on wheeze requiring treatment by a doctor. Exposure to VOCs was verified by passive sampling over a time of 1 month and included 87 VOCs. The majority of women never smoked in the dwelling during pregnancy (89%) and during the first year thereafter (96%). Floor covering during pregnancy was significantly associated with wheeze, in particular for children with an atopic predisposition. The study found a significant association for six of the analyzed VOCs, including styrene. Compared to pregnancy, redecoration only during the first year of age had less detrimental associations and only the association with styrene remained significant. It remains unclear how the low concentrations of styrene and its only slight increase by floor covering may lead to wheezing in infants, especially for exposures at the end of pregnancy. The concentrations of styrene significantly increased after redecoration. With no redecoration, styrene concentrations were 0.28 (0.12; 0.58), and with floor covering, styrene concentrations were 0.42 (0.16; 1.2) (median and inter-quartile ranges in µg/m3).
Fewer studies have examined human males for styrene-induced effects on fertility. Jelnes (Citation1988) performed a cross-sectional study on semen quality of workers, from an FRP factory, based on 25 exposed workers compared to an age-matched control group from men attending an infertility clinic without matching for other confounders. The semen parameters from the control group could be poor in comparison to the general population. Only one semen sample was taken. Mean styrene exposure levels were 68, 84, and 128 ppm with peak levels about twofold higher some weeks before semen sampling. There were no differences observed between exposed and controls for luteinizing hormone (LH), follicle-stimulating hormone (FSH), semen volume, and sperm count. Live sperm and percentage of mobile sperm were superior in exposed compared to controls (possibly due to inappropriate selection of reference group). Sperm head abnormalities were significantly increased in exposed. As pointed out by Brown (Citation1991), sperm head abnormalities are one of the least variable of sperm parameters and the difference to an appropriate control group might even have been greater.
In a retrospective case referent study, Sallmen et al. (Citation1998) investigated whether paternal exposure to organic solvents (including styrene) was associated with delayed conception. Cases were taken 6 years later from the study of Taskinen et al. (Citation1989) and defined as men married to women with spontaneous abortion or malformed children. Referents were men married to women who had given birth without spontaneous abortion or malformation, three referents for abortions and five for malformation. The final study population consisted of 282 couples. Biological measurements complemented the self-reported data on exposure of the exposed male workers. Styrene exposure often exceeded the national threshold limit. A Fecundability Density Ratio (FDR) was defined meaning that for an FDR of 0.5, the sexually active members were half as likely to achieve pregnancy as the controls. The adjusted FDR for styrene were 1.10 (95% CI 0.73–1.66) for low/intermediate and 0.98 (95% CI 0.64–1.36) for high exposure. The results of this study did not substantiate the findings of Jelnes (Citation1988), namely an increased number of abnormal sperm heads in FRP industry workers.
Bonde et al. (Citation1999) describe the Asclepios Research Project, a research initiative on occupational hazards to male reproduction sponsored by the EU and carried out in 14 European centers between 1993–1998. Some of the Asclepios studies involved men exposed occupationally to styrene (discussed below). It is noted that styrene concentrations in ambient air had been declining for 25 years and concentrations during the time period of the Asclepios Research Project were about 3–30 ppm [estimated from graphs by NTP CERHR, Citation2006]. One of the aims of the Asclepios Research Project was to evaluate semen parameters in men longitudinally, from before (or early in) employment to after some period of employment in styrene-exposed workplaces. But longitudinal studies of sperm quality were restricted to Danish workplaces because of the low worker turnover in many of the participating centers.
Kolstad et al. (Citation1999a), Kolstad et al. (Citation1999b) are case referent studies conducted under the Asclepios Research Project for assessment of semen quality and sperm chromatin structure of men exposed in FRP industries. Semen quality was analyzed in 23 workers in FRP industry at the time of hire and after 6 months of exposure to styrene. In addition, vulnerable chromatin structure as defined by susceptibility to acid-induced denaturation was quantified by flow cytometry. Only 30% of the eligible population agreed to participate and 11 plastic workers dropped out during follow-up (the authors speculated that the dropouts only participated to get a free infertility check). Twenty-one non-exposed farmers served as controls (these controls are only mentioned by Kolstad et al. Citation1999b). Sperm parameters were related to biological monitoring. The highest exposures corresponded to only 33% of the ACGIH’s BEI (ACGIH, Citation2015) and to an external exposure of 16 ppm. A significant decline in sperm density and sperm count was observed during styrene exposure, but not during the same period in farmers. On the other hand, the proportion of non-vital sperm decreased. While these effects were significant in the paired t-test, there was no relationship to the internal exposure. No exposure-related effect was found for sperm morphology, viability, or velocity. For sperm chromatin structure parameters, a dose–response was found, but the effects were small and within the range of the interassay variability of the method. The authors could not exclude an imbalance in study design that might have contributed to the changes observed, because there is a seasonal variability of semen quality, and, in many cases, the season for the second sampling did not correspond to that of the first sampling. The authors concluded that spermatogenesis may be vulnerable to styrene exposure, and cautioned that due to the small numbers the findings were only preliminary. According to Brown et al. (Citation2000), the study is severely constrained by the limited worker participation and, in addition, the high drop-out rate for the second sampling; also, the potential impact of seasonal changes in semen quality should be considered.
Kolstad et al. (Citation1999c), also carried out under the Asclepios Research Project further studied time to pregnancy of women married to men exposed to styrene in FRP industries, as a measure of male fecundity. The study was conducted in Danish, Italian, and Dutch companies using hand or spray lamination and included 541 men. Styrene concentrations declined significantly from 150 ppm in the early 1970s to 25 ppm during the late 1990s. From the year preceding the reported year of pregnancy for each worker, exposure was categorized as unexposed (n = 353 workers), low (n = 61 workers), medium (n = 77 workers) or high (n = 50 workers). Fecundity was defined as the reported time to pregnancy, i.e., the number of months a couple needed to conceive a child. Italian workers had an overall fecundability ratio 50% higher than that of Danish workers. This may explain the unexpected increase of the fecundability with increasing exposure. Taking the fecundability ratio of the unexposed as 1, for the exposed workers the ratios were for low 0.75 (95% CI 0.51–1.09), medium 0.82 (95% CI 0.57–1.18), high 0.9 (95% CI 0.57–1.4). This study found no detrimental effect of styrene exposure on fecundity.
Kolstad et al. (Citation2000) is an extension of Kolstad et al. (Citation1999a, Citation1999b). Six hundred and two Workers participated in the study, including 220 exposed and 382 unexposed workers (the latter serving as referents). However, the high number of workers refusing to participate (122) or not responding (296) should be noted. A semiquantitative exposure index was defined and categorized into four groups with a comparable number of exposed workers. Fecundity ratios were calculated, indicating a shorter time to pregnancy for a higher fecundity ratio. A statistically non-significant reduced fecundity was found for exposed FRP workers compared to the unexposed workers, 0.79 (95% CI 0.59–1.05), but no consistent pattern emerged related to exposure levels as workers with high exposure had a higher fecundity ratio of 1.09 (95% CI 0.69–1.72). In addition, workers exposed long term were more fecund than those exposed short term. This study did not corroborate the indications for reduced sperm counts in FRP workers of Kolstad et al. (Citation1999a); Kolstad et al. (Citation1999b).
Animal studies
Styrene has been well studied in animals for reproductive toxicity, including a guideline two-generation rat reproductive toxicity studied performed after the Cohen et al. (Citation2002) review. Some of these studies were available for the NTP CERHR (Citation2006) and/or U.K. HSE (Citation2008) reviews and there are a number of animal studies that have been performed more recently.
Several subchronic and chronic styrene rodent inhalation studies have examined male and female reproductive organs for weight and structural changes and found no evidence of effects (Cruzan et al. Citation1998, Citation1997; Jersey et al. Citation1978).
Salomaa, Donner, and Norppa (Citation1985) investigated sperm morphology in mice after styrene intraperitoneal (175, 350, or 700 mg/kg bw/day) and inhalation exposure (150 or 300 ppm, 6 hours/day), each conducted over 5 consecutive days. This study found no statistically significant increase in abnormal sperm heads 3 weeks (spermatids exposed) or 5 weeks (late spermatogonia/early spermatocytes exposed) after beginning of exposure.
Testicular toxicity, including alterations of testicular enzymes, was studied by Srivastava, Seth, and Srivastava (Citation1989) in adult rats at 200 or 400 mg/kg bw/day styrene doses over 60 days (6 days/week). There were no effects observed in testes at 200 mg/kg bw/day. At 400 mg/kg bw/day, histopathological alterations were noted in testes (shrunken seminiferous tubules and some tubules lined by a single layer mainly consisting of Sertoli cells with few spermatogonia and no sperm) accompanied by decreased epididymal sperm counts. Weights of testes and epididymis were unaffected. Testicular enzyme activities were decreased for sorbitol dehydrogenase and acid phosphatase and increased for lactate dehydrogenase, glucose-6-phosphate dehydrogenase, and gamma-glutamyl transpeptidase, and ß-glucuronidase. The low number of animals (6/dose group) is a limitation of this study. In addition, preservation of testicular tissue was not optimal, the pathological meaning of changes in the activity of testicular enzyme was not established, and historical data were not presented.
Chun et al. (Citation2005) examined rats (3/dose group) dosed orally with styrene at 50, 100, or 500 mg/kg bw/day over 5 days. This treatment did not influence testes, epididymis, and body weights. In epididymis at the high dose, statistically significant decreases of sperm mobility and sperm counts (already at the mid dose in testes) were observed, while the number of abnormal sperm cells was strongly increased. The production of reactive oxygen species (ROS) in sperm cells was significantly increased in all dose levels and the mRNAs for superoxide dismutase 2 (but not of superoxide dismutase 1) and catalase were decreased while glutathione peroxidase 4 remained unchanged. The authors concluded that the toxic effects of styrene are related to an enhanced oxidative stress on sperm cells.
In an intraperitoneal injection study of styrene, Chamkia et al. (Citation2006) examined adult rats (n = 6) administered daily dosages of 600 mg/kg bw/day over 10 days. This study found an increase in the relative weight of testes without effects on the weights of epididymis and seminal vesicles. The level of blood testosterone was decreased and those of LH and FSH were increased. Histopathology of testes showed marked alterations (enlarged intracellular spaces, dramatic loss of gametes in the lumen of seminiferous tubules, and disappearance of Sertoli cells). Epididymal sperm count was severely decreased, as was sperm motility. The high dose and the unphysiological application route by which styrene came into direct contact with testes are limitations of this study.
Han et al. (Citation2007) examined differential gene expression in the testis of rats exposed to styrene orally at 50, 100, or 500 mg/kg bw/day over 5 days. There were five genes induced (testis specific expressed gene 101, protein kinase C, H+-ATPase isoform 2, peroxiredoxin 1, and aquaporin 9), while gene expression of clusterin was suppressed up to 79%. In liver, heart, lung, and kidney, clusterin was not significantly changed. It is noted that different dose levels were used but the number of animals per group is not given. In addition, the authors do not give any clear indication about the dose dependency of the gene expression levels. By examining Figure 3 of this paper, it may be tentatively assumed that the expression of clusterin might already have been reduced at 100 mg/kg bw/day.
Beliles et al. (Citation1985) performed a combined chronic/reproduction study in rats exposed to styrene via drinking water at 125 or 250 ppm, corresponding to approximately 14 or 21 mg/kg bw/day for males and females, respectively. This study found no indications for adverse effects of styrene on reproductive performance.
Cruzan et al. (Citation2005a) reported on an OECD guideline 2-generation study in rats for styrene that was conducted by inhalation at 50, 150, or 500 ppm (6 h/day) with 25 animals/gender/dose. Exposure before mating lasted at least 70 days for F0 and F1 parents. On lactation days 1 to 4, inhalation of F0 and F1 females was interrupted and the dams were instead exposed to an equivalent oral dose. Rats exposed to 150 and 500 ppm styrene of both parental generations gained weight more slowly compared to controls and at 500 ppm degeneration of the olfactory epithelium was found. There were no indications for adverse effects on reproductive performance in the F0 or F1 generation and ovarian follicle counts and corpora lutea counts in F1 females at 500 ppm were comparable to controls. At 500 ppm, F2 birthweights were reduced and F2 offspring gained weight more slowly at 150 and 500 ppm than controls. 50 ppm was the NOAEC for F0 and F1 parental systemic toxicity and for reproductive toxicity, the NOAEC was 500 ppm.
Developmental toxicity, including spontaneous abortions
Developmental toxicity including evaluation of spontaneous abortions has been well tested in experimental animals, whereas the available human information, although consisting of a number of studies, is limited. Both the NTP CERHR and U.K. HSE assessments concluded that there is no indication for adverse effects on development in humans and experimental animals with the exception of reduced pup growth and pup developmental delays at 300–500 ppm noted by the U.K. HSE (Citation2008), concentrations well above environmental and occupational exposures.
Human studies (malformations, spontaneous abortions)
The conclusions of the authoritative reviews of styrene exposure and developmental toxicity, as well as spontaneous abortions, were based on the human studies reviewed below.
Holmberg (Citation1977) is the first report of a series of register-based case-control studies citing associations between congenital malformations and workplace exposure. Mothers of all children with central nervous system defects notified to the Finland’s Register of Congenital Malformations, over a period of nine months in 1976–1977, were identified and exposure was assessed by questionnaire. Among 43 cases and referents, 2 case mothers (hydrocephalus, anencephaly) were employed in FRP industries but none of the referents was employed in FRP industries. Due to the low rate of these malformations (0.5/1000 live births), the occupational group was strongly overrepresented. This study was subsequently extended in several follow-up publications. Holmberg (Citation1979) extended the observation period over 2 years and included 120 cases and referents. No further cases with styrene exposure were identified, in spite of an increase of cases by a factor of three. The emphasis shifted to exposure to solvents in general, and there appeared a significant difference between cases and referents. In a study with a more detailed statistical analysis of the 1979 study, Holmberg and Nurminen (Citation1980) concentrated only on exposures at the workplace, excluding non-occupational exposures, and found exposure to organic solvents was still significantly more common in cases than in controls. In Citation1982, Holmberg et al. investigated oral clefts and found these to be more common in cases with organic solvent exposure in general compared to the referents, but an association with styrene was not observed. In 1983, the authors extended the observation period to five years (1976–1981) and malformations of the CNS (289 cases), the skeleton (200 cases), the cardiovascular system (137 cases) and oral clefts (421 cases) were included (Kurppa et al. Citation1983). In spite of the substantial prolongation of the observation period, only one additional oral cleft occurred in cases and referents. As “organic solvents” were not further specified, no specific information is available for styrene, although in former studies exposure to styrene was specifically identified. Overall from the series of studies, the original association of exposure in FRP industries and CNS malformations could not be substantiated in follow-up studies, and no indication was demonstrated for other malformations.
Harkonen et al. (Citation1984) analyzed malformation rates in children born to 1698 male and 511 female workers exposed in 160 Finnish FRP workplaces between 1963–1979. Expected malformation rates were drawn from Finland’s Register of Congenital Malformations. Children were divided into those born before and those during exposure to styrene. This study found no evidence that exposure of fathers or mothers in FRP industries was associated with birth defects.
In a study of Finnish women and spontaneous abortions in relation to occupation, Hemminki, Franssila, and Vainio (Citation1980) identified 52 abortions among chemical industry workers. The percentages were related to pregnancies (rate) and births (ratio). For all Finnish women, the rate was 5.52% and the ratio 7.98%. For styrene industries, a higher rate of 15.00% and a ratio of 31.59% was calculated, but this was based on only 6 cases out of a total of 15,482 cases. Factors that may influence spontaneous abortion were not analyzed, such as marital status, urban/rural residence, religion, smoking, diet, and socioeconomic status. The small number of cases limits the utility of the study.
Harkonen and Holmberg (Citation1982) evaluated the incidence of spontaneous abortions in 67 female lamination workers compared to 67 age-matched referents not exposed to chemicals. There was no significant difference for number of births, pregnancies, spontaneous or induced abortions during and prior to exposure period. Only 4 birth defects were reported, 2 each in exposed and controls. In both cases, one defect occurred during the study period and one prior to it. Thus, there was no indication that styrene exposure may be associated with increased incidences of spontaneous abortion or malformations.
In a case control study of spontaneous abortions and malformations, Hemminki et al. (Citation1984) analyzed about 1700 pregnancies in Sweden and Norway for women employed in the plastics industries. All relative risks for malformations were close to unity, including plastics industries with 9 cases and 18 controls. Two cases of CNS defects were found, but it is unclear whether these may be the same cases as reported in Holmberg (Citation1977). For women in styrene production and use, nine spontaneous abortions were found during employment (rate 6.8%; ratio 10.2%) and 19 before or thereafter (rate 12.2%; ratio 22.1%). Because rate and ratio of spontaneous abortions during employment was only half of that at other times (but not statistically significant), this study does not support the findings of Hemminki, Franssila, and Vainio (Citation1980).
Lindbohm, Hemminki, and Kyyronen (Citation1985) investigated spontaneous abortions in a case control study for plastic industries covering the years 1973–1980. Each case was matched to three controls. Based each on four cases, the odds ratio was 0.4 (CI 0.1–1.2) for workers processing cold styrene and 0.6 (CI 0.2–2.3) for those processing heated styrene, but the low statistical power of the study has to be considered.
Lindbohm et al. (Citation1990) performed a case referent study on spontaneous abortions for exposure to organic solvents, including styrene, within the period of 1965–1983. For each case, three referents were selected. Assessment of occupational exposures during the first trimester primarily relied on questionnaires; biological monitoring data were used to support that estimate. For organic solvents in general, the odds ratio was 2.2 (95% CI 1.2–4.1) significant for styrene, the odds ratio was 0.3 (95% CI 0.1–1) for reduced incidence. The authors offer two possible hypotheses for the unexpected result with styrene: 1) that this may be the sign of pathology in an earlier phase of the chain of reproductive events; or 2) that this may be related to an excess production pf prolactin.
In a study of Canadian women, McDonald et al. (Citation1988) investigated spontaneous abortions in Montreal between 1982 and 1984. The expected incidence of women working ≥30 hours/week at the start of pregnancy was 14%. Possible exposure was identified by occupations, but without more detailed data. Seventy-six Women who had 18 spontaneous abortions were exposed to styrene with. The women were employed in the polystyrene industry, and not in the FRP industry. The observed/expected ratio was 1.58 (90% CI 1.02–2.35), a statistically significant finding. For 78 women not working with polystyrene, this ratio was 0.99 (90% CI 0.57–1.6). The authors conclude that these findings raise the level of suspicion that work in the production of polystyrene may carry a hazard for spontaneous abortion. Limitations of this study were the small number of women and imprecise exposure information.
Ahlborg, Bjerkedal, and Egenaes (Citation1987) reported on separate case control studies conducted in Sweden and Norway for pregnancy outcomes for the period of 1973–1981 for female workers in plastic industries analyzed for selected malformations, still births or infant deaths and low birth weight. For each case, two matched controls were selected and 44 Swedish and 10 Norwegian triplets were identified. Exposure data were obtained from employers. While an increased odds ratio was observed for polyvinylchloride processing industries (2.2; CI 1.1–4.5), no increase was found for processing styrene plastics (odds ratio of 0.8 based on 18 cases).
Lemasters et al. (Citation1989) examined the length of gestation and birth weight of children from mothers that reported styrene exposure. This study has already been mentioned in the “Reproductive toxicity, human studies, females” section of this paper. Only the findings on birth weight are reported here. Exposures were derived from “historical” exposure concentrations obtained by telephone interviews from mothers employed between 1974–1991 and categorized as none, low (<30 ppm) and high. A subset of the 50 highest exposed pregnancies in boat building (average exposure 82 ppm over at least 1 month) was identified. There was no dose–response trend in decreasing birth weight. For the 50 highest exposed pregnancies, there was a 4% reduction (95% CI: −7.7% – +06%) in birth weight compared to the unexposed after adjustment for other factors, but was not significant. The authors suggest a cautious interpretation as exposure estimates were not specific to individual pregnancies but calculated from historical measurements.
A case referent study on spontaneous abortions and congenital malformations in wives of men occupationally exposed to organic solvents, including styrene, was reported by Taskinen et al. (Citation1989). For each case, 3 referents were selected for spontaneous abortion and 5 for each congenital malformation. Besides exposure information by questionnaire for the time of spermatogenesis before pregnancy, exposure levels were supported by biological monitoring. For spontaneous abortion based on 37 cases exposed to styrene, the odds ratio for paternal exposure was 1.3 (95% CI 0.8–2.1). For low/rare, intermediate and high/frequent exposure to styrene, the odds ratios were 1, 0.9, and 0.7, respectively, after correction for confounders. For comparison, 103 cases and 182 referents exposed to organic solvents in general had an odds ratio of 2.7 (95% CI 1.3–5.6) being significantly increased. For malformations, the response rate was similar for 25 cases and 96 referents.
In several studies, potential interactions between autism spectrum disorders (ASD) and exposure to environmental styrene were investigated. These studies were not reviewed by the NTP CERHR (Citation2006) or U.K. HSE (Citation2008). The environmental exposure prediction models used provide only limited approximate measures of exposure without refined resolutions for indoor vs. outdoor exposures or for the time span under consideration. Windham et al. (Citation2006) compared 284 ASD cases with 657 controls born in 1994 in the San Francisco Bay area of California for 19 chemicals identified as potential neurotoxicants or endocrine disruptors. Exposure estimates for the birth year were based on the U.S. EPA’s 1996 Hazardous Air Pollutant concentrations. Mean concentrations of styrene (± SD) were for cases 0.1 (± 0.06) and for controls 0.09 (± 0.05) µg/m3. For statistical analysis, aromatic solvents were grouped together, namely benzene, ethylbenzene, styrene, toluene, and xylene. The adjusted OR for the 3rd quartile of exposure was 0.84 (95% CI 0.59–1.2) and for the 4th quartile 1.15 (95% CI 0.80–1.65). While the aromatic solvent group did not show an association between exposure and ASD, for chlorinated solvents and heavy metals, the adjusted ORs were significantly elevated by 50% in the top 4th quartile of exposure.
Kalkbrenner et al. (Citation2010) estimated environmental exposure based on modeled annual averages for residency using the U.S. EPA National Air Toxics Assessments (NATA) during the end of pregnancy and the first years of life. The author’s compared ASD cases from North Carolina (NC: n = 201) and West Virginia (WV: n = 173) to controls with speech and language impairments (NC: n = 1733; WV: n = 1146) born in 1992–1996 and verified residency for the time from pregnancy to 8 years of age. ORs were calculated by comparing the 80th percentile to the 20th percentile. Geometric mean ambient styrene concentrations were 23.4 (SD 2.3) for NC and 9.6 (SD 4.2) ng/m3 for WV (combined urban and not urban concentrations). While the ORs calculated separately for NC and WV were not statistically significant, the OR for both combined was significant with an OR 1.8 (95% CI 1–3.1). Similarly, a positive association was found for quinolone, while for about 35 other ambient air pollutions (metals, particulates, and volatile organic substances) near-null ORs were obtained. In comparison to the null finding of Windham et al. (Citation2006) for 5 aromatic solvents as a group, Kalkbrenner et al. (Citation2010) proposed that in the former study, by grouping styrene with other organic solvents, a positive association for styrene might have been masked. The authors proposed styrene, besides methylene chloride and quinolone, as candidates for further research.
Roberts et al. (Citation2013) used data from the U.S. Nurses’ Health Study II and identified 325 ASD cases in comparison with 22,101 controls for the years 1987–2002, ORs by exposure quintiles 1 vs. 5 and exposure-related trends were calculated. Styrene concentrations ranged from 7 to 185 ng/m3 for quintile 1 to quintile 5. Neither the OR nor the trend calculations led to statistically significant results.
Kalkbrenner, Schmidt, and Penlesky (Citation2014) reviewed studies on ASD available at that time and concluded that some environmental exposures showed associations with autism, especially traffic-related air pollutants, some metals, and several pesticides. For VOCs (e.g. methylene chloride, trichloroethylene, and styrene), suggestive trends existed but definitive conclusions could not be drawn.
Talbott et al. (Citation2015) conducted a population-based case-control study in Pennsylvania for a potential association between ASD and the U.S. NATA (Citation2005) estimates for environmental exposure to 30 neurotoxicants. Two hundred and seventeen ASD cases born between 2005–2009 were compared to two different control groups. One consisted of 224 interviewed controls matched by year of birth; and the other consisted of 5007 controls from a random sample of birth certificates using residence at birth. Exposure estimates were calculated for pregnancy and the first and second year of life. Styrene exposures varied between 25.22 (25th percentile) and 51.39 ng/m3 (75th percentile) for cases and between ~23 (25th percentile) and 40.34 and 48.71 ng/m3 (75th percentile) for the two control groups. ORs were calculated comparing the 4th to the 1st percentile of exposure. During pregnancy, the OR for styrene was 2.04 (95% CI 1.17–3.58) for the interviewed controls and 1.61 (95% CI 1.08–2.4) for the other control group. During the first year of life, the OR was 1.86 (95% CI 1.07–3.25) for the interviewed controls. An elevated OR was also observed for chromium and borderline significances for methylene chloride and PAHs. The authors concluded that living in an area with higher levels of styrene (or chromium) was associated with an increased risk of ASD. But it was cautioned that it was unclear whether these chemicals are risk factors in themselves or reflect effects of mixtures. For all studies on ASD, the very low environmental exposures to styrene should be noted.
McCanlies et al. (Citation2012) compared 93 families having children with ASD to 81 families with unaffected children in relation to occupational exposure. Self-reported and industrial hygienist-assessed occupational exposures (from 3 months prior to pregnancy until birth or weaning) were used to compare ASD vs. non-ASD cases. Self-reported exposures to asphalt and solvents were more often associated with ASD and industrial hygienist-assessed exposures to lacquers, varnish and xylene showed an association with ASD. Specifically, for styrene, 6 ASD cases (6.5%) were identified compared to two controls (2.5%). These small numbers preclude any firm conclusion for styrene and the authors admit that the study was limited by the overall small sample size.
Windham et al. (Citation2013) used the cases and controls of the Windham et al. (Citation2006) study to investigate a potential association with occupational exposure, either self-reported or assessed by an industrial hygienist. Eight exposure/chemical groups were used. The exposure categories with the greatest frequencies among case mothers were exhaust and combustion products with OR 12 (95% CI 1.4–104.6) and disinfectants with OR 4.0 (95% CI 1.4–12). For solvents as a group, the OR was 1.4 (95% CI 0.7–3). Exposure to styrene was not specifically analyzed.
Animal studies (non-neurotoxicity endpoints after prenatal exposure)
The conclusions of NTP CERHR (Citation2006) and/or the U.K. HSE (Citation2008) on non-neurotoxic endpoints after prenatal exposure were based on the following studies with experimental animals.
Ponomarkov and Tomatis (Citation1978) performed a limited study on prenatal and preweaning mortality in two strains of mice and one rat strain. The different strains of mice were dosed on gestational day 17 with either 1350 or 300 mg/kg bw styrene. Rats were dosed with 1350 mg/kg bw styrene. No effects were observed on litter size. Preweaning mortality was increased in rats and mice at 1350 mg/kg bw, but not in the mouse strain with 300 mg/kg bw.
Murray et al. (Citation1978) conducted a developmental toxicity study for styrene in rats after oral and inhalation exposure and in rabbits after inhalation. The study was performed in accordance with the OECD test guideline available at the time of the investigation was carried out, which specified exposure of rats only from gestation days 6–15 and for rabbits from gestation days 6–18, and not until the day before cesarean section, as presently specified for both species. After oral exposure at 180 or 300 mg/kg bw/day and after inhalation 300 or 600 ppm (7 hours/day), no malformations were found in rats or rabbits. In rats, maternal weight gain was significantly reduced on gestation days 6–9 at all exposure levels associated with decreased feed consumption, but not at later time intervals. A few skeletal variations were significantly increased in comparison to control litters, but the occurrence of these variants was indicated to be within historical incidences. At 300 ppm, the crown-rump length was significantly reduced but not at 600 ppm, i.e. without dose–response relationship. For the rabbit, there was no effect on maternal weight gain. A skeletal variation (unossified 5th sternebra) was significantly increased at 600 ppm in comparison to contemporary control litters, but the incidence was consistent with historical control data. In conclusion, no developmental toxicity can be deduced from this study.
Srivastava, Srivastava, and Seth (Citation1990) performed a developmental toxicity study similar to the former OECD test guideline with exposure only from gestation days 6–15. Small groups of rats were exposed to 250 mg/kg bw/day (n = 10), and 400 mg/kg bw/day (n = 12) with a control group of 14 rats. Maternal weight gain was significantly reduced at 400 mg/kg bw/day, 20 vs. 60 g in controls and numerically also at 250 mg/kg bw. The authors speculated that this may have been partly due to fetal resorptions and retarded fetal growth. In addition, loss of implantation sites, increased resorption of fetuses, and decreased fetal weight at 400 mg/kg bw/day were reported, but no gross or skeletal abnormalities were reported. While the fetal effects were clearly associated with reduced maternal weight gain at the high dose, no effects occurred at 250 mg/kg bw/day.
In a study that focused on fetal hepatic enzyme changes, Srivastava, Seth, and Srivastava (Citation1992c) examined rats at gestation day 20 after intrauterine exposure, from gestation days 1 to 20, at dose levels of 200 or 400 mg/kg bw/day styrene in small groups of 12 dams. Significantly reduced body and absolute liver weight were observed at 400 mg/kg bw/day in fetuses, but there was no significant effect on relative liver weight. It is noted that a clear maternal toxicity was found in Srivastava, Srivastava, and Seth (Citation1990), as demonstrated by a significantly reduced maternal body weight at 400 mg/kg bw/day on gestation day 20 after exposure from gestation days 6–15. Regarding liver enzymes, significantly decreased aminopyrine-N-demethylase activity and content of cytochrome P-450 at 400 mg/kg bw/day and of aniline hydroxylase, aryl hydrocarbon hydroxylase, and glutathione-S-transferase; glutathione content was significantly decreased and at both dose levels. It is difficult to draw a conclusion since the roles of maternal toxicity, reduced fetal weight, and the actions on liver function cannot be separated from these observations.
A study by Chernoff et al. (Citation1990) studied pregnant rats dosed with styrene from gestation days 6 to 15 with 1147 mg/kg bw/day with sacrifice on gestation day 20. Maternal body weight was reduced, especially in the early phase of treatment. Fetal weights were slightly, though not significantly, reduced, but there were no effects on the number of litters and fetuses, fetal weight and deaths. No skeletal or soft tissue abnormalities were observed, apart from enlarged pelvis only at one side. As this effect was only recorded for one side, its significance is unclear especially as another substance studied in parallel affected the pelvis on both sides. According to NTP CERHR (Citation2006), this study adds weight that even high doses do not lead to adverse developmental effects.
Daston et al. (Citation1991) also studied liver changes, specifically hepatic metallothionein, altered zinc status and developmental toxicity after exposure to styrene on gestation day 11 by gavage at 300 mg/kg bw using 8 exposed and 7 control litters. This study found reduced maternal weight and feed uptake occurred at the day following treatment with styrene and developmental effects did not occur.
In a styrene inhalation study, Kankaanpaa et al. (Citation1980) examined pregnant mice after inhalation at 250 ppm (n = 13) and hamsters from 300 − 1000 ppm (n = 2–7). In mice, signs of maternal toxicity were not reported, but likely occurred as 500 ppm was lethal to 2 of 6 pregnant mice. The number of dead or resorbed fetuses was significantly increased, but the analysis was not done on a litter basis. More fetuses with malformations occurred in exposed vs. controls without statistical significance (2.9 vs. 0.9), but again the analysis was not based on litter distribution. In the hamster, a significant increase in dead or resorbed fetuses occurred at 1000 ppm, but no malformations. No data about maternal effects were reported.
Ninomiya et al. (Citation2000) is published in Japanese, and therefore the descriptions provided by NTP CERHR (Citation2006) and U.K. HSE (Citation2008) are noted here. This study exposed mice at 2, 20, and 100 ppm (24 h/day) on gestation days 0–15. Dams were observed to be hyperkinetic at 100 ppm. No treatment-related effects were reported on proportion of pregnant animals, number of implantations, number of live fetuses, percent resorptions, or percent dead fetuses. At 100 ppm, maternal weight was reduced by 18%, accompanied by reduced adipose tissue, liver, kidney, and spleen weights. Fetal weight was reduced by 25% and placental weights were also decreased. It is not clear whether visceral and skeletal examinations were performed, and the statistical treatment of data appears not to be on a litter basis.
Developmental neurobehavioral endpoints
The conclusions of NTP CERHR (Citation2006) and/or U.K. HSE (Citation2008) on neurobehavioral endpoints were based on the following studies with experimental animals:
Zaidi et al. (Citation1985) studied styrene’s effects on some aspects of brain function, after exposure of rats during gestation and lactation by the gavage at only one dose level of 200 mg/kg bw/day. One group was treated throughout gestation and the pups were raised without further treatment either by treated or untreated mothers. Another group was exposed during gestation and lactation up to 2 and 3 weeks and a third group from postnatal day 1 up to 2 or 3 weeks. Animals were sacrificed at the age of 2 or 3 weeks. The number of litters investigated was very small (n = 3 or 4), especially in regard to the non-routine parameters studied. The study concentrated on the measurement of dopamine receptor binding in corpora striata, amphetamine-induced locomotor activity, and apomorphine-induced stereotypy. Dopamine receptor binding was not affected for exposure only during gestation, but was increased by exposure during lactation. The increased binding was due to an increased number of receptors. Amphetamine-induced locomotor activity was increased by combined exposure throughout gestation and lactation. Apomorphine-induced stereotypy was potentiated by styrene exposure. A clear interpretation of the study is limited by the small number of litters.
Khanna et al. (Citation1991) examined exposure to styrene in pregnant rats until weaning, with normal and low protein diet at an oral dose of 100 mg/kg bw/day, from gestation day 6 until weaning. Only 6 litters were used for control and exposed animals, which may be insufficient, especially in regard to the non-routine parameters studied. In pup brain tissue, the activities of monoamine oxidase, succinate dehydrogenase, and Na/K-ATPase were measured; binding to dopamine and serotonin receptors in corpus striatum and frontal cortex were also determined, as were developmental landmarks and amphetamine-induced locomotor activity. Styrene had no effect on any of the parameters in rats fed a normal diet. When fed a protein-deficient diet, amphetamine-induced locomotor activity was markedly increased only in pups of styrene-exposed rats. A similar pattern was observed for the decreases of monoamine oxidase, succinate dehydrogenase, Na/K-ATPase, as well as for an increase in neuro-receptor binding. The authors propose that protein-deficient diet may augment developmental neurotoxicity in combination with styrene exposure that may be important in developing countries. This is an artificial experimental design with questionable relevance for risk assessment.
Placental transfer of 14C-labelled styrene, by autoradiography and liquid scintillation counting, after intravenous injection in mice, was reported by Kishi et al. (Citation1989). By means of autoradiography, the authors differentiated semi-quantitatively between volatile (mainly styrene) and non-volatile chemical species by keeping the slices at +48 and −70°C. Concentrations of styrene and metabolites measured by liquid scintillation counts were twice as high in dams as compared to the fetus. The authors noted that radioactivity was retained in the fetus at relatively constant levels for at least 24 h and speculated that, after prolonged exposure, styrene may accumulate in fetal tissue. However, a clear decision about potential retention in the fetus is compromised by the very low concentrations of radioactivity at the end of the observation period. Overall, the study found that the placenta acts as a partial barrier for the fetus.
Kishi et al. (Citation1992) investigated reproductive effects in pregnant rats and neurochemistry in CNS, at styrene concentrations of 0 (n = 14), 50 (n = 3), and 300 ppm (n = 7) from gestation days 7 to 21 administered 6 h/day. The study found no effects on maternal weight (but there was a dose-related numerical decrease not attaining statistical significance), length of gestation, or number of offspring. Body weight of offspring on postnatal day 1 was significantly decreased for both exposure groups without a dose–response relationship. A significant decrease was found in concentrations of serotonin, dopamine, 5-hydroxyindoleacetic acid, and homovanillic acid in the cerebrum and of serotonin in the cerebellum. A clear interpretation of the results is compromised due to the low number of litters and lack of historical control data for the neurotransmitters that are not part of routine toxicological investigations.
In an extension of the Kishi et al. (Citation1992) study, Kishi et al. (Citation1995) examined neurobehavioral development, activity, motor coordination, and learning after prenatal styrene exposure of rats. Due to the limited number of inhalation chambers, only 12 litters exposed at the same periods were evaluated (controls n = 5, 50 ppm n = 2, 300 ppm n = 5). For postnatal behavioral development, a delay was observed at 300 ppm for auditory startle reflex, air righting reflex, eye opening, and incisor eruption; even at 50 ppm, auditory startle reflex and air righting reflex were delayed. Preweaning behavioral tests were delayed at 300 ppm for pivoting, bar holding, and surface righting. In postweaning tests at 300 ppm, open field activity was significantly increased, but the effect seemed to become smaller with age and was no more significant at postnatal day 127/128. The rotarod performance, as an indication for neurotoxicity, revealed a deficit in motor coordination at 300 ppm and postnatal day 30 and 60 that did not prevail until postnatal day 120. Total spontaneous activity and activity in the dark of males at 300 ppm was increased. Data suggested that prenatal exposure leads to higher activities in the developmental stage; however, the very low numbers of litters severely compromise the interpretation of the study.
Katakura et al. (Citation1999) further extended Kishi et al. (Citation1992). To control for effects related to reduced feed uptake in the 300 ppm styrene group (n = 14), one control group received the same amount of feed as consumed by the 300 ppm group (n = 12) and one control group was fed ad libitum (n = 14). The 50 ppm group (n = 10) was also pair-fed as compared to the 300 ppm group. Neurotransmitters were measured in five different regions of the brain. Here only the results are reported in relation to pair-fed controls and if there was an indication for a dose-related effect. In newborn offspring, homovanillic acid was reduced in the cerebrum; at postnatal day 21, there was a reduction of 5-hydroxyindoleacetic acid in the hippocampus. The authors noted the possibility of chance findings because of the high variability of many of the neurochemical parameters. In addition, the number of different brain regions analyzed should be taken into consideration.
Katakura et al. (Citation2001) performed a study on postnatal development and serotonin and catecholamine levels in CNS at weaning relied on the same animals used in Katakura et al. (Citation1999), but only 9 rats were analyzed for the 5 ppm styrene group. It was reported that maternal weight gain was not affected in comparison to both control groups. Again, only effects in comparison to pair-fed controls and those with indications for dose–response relationship are taken into consideration. At 300 ppm, neonatal death rate was increased. According to U.K. HSE (Citation2008), the increase in neonatal death became non-significant when analyzed on a litter basis, indicating that this was due to a high rate of death in just one litter. At postnatal day 21, reduced body weight of males and reduced homovanillic acid in cerebrum were described. There was a delay in eye opening, lower incisor eruption, and air-righting reflex at 300 ppm.
An OECD guideline rat developmental neurotoxicity study was conducted for styrene by Cruzan et al. (Citation2005b) in conjunction with the rat two-generation study of Cruzan et al. (Citation2005a) in the F2 generation. F1 parents were exposed during pregnancy until postnatal day 21 at 50, 150, or 500 ppm (6 h/day); F2 offspring were not further treated. On lactation days 1 to 4, inhalation was interrupted and the dams were instead exposed to an equivalent oral dose. Developmental landmarks were assessed in F1 and F2 animals. The following were evaluated to assess neurological development of F2 animals: a functional observational battery, locomotor activity, acoustic startle response, learning and memory, brain weights, dimensions, morphometry, and histopathology. Slight body weight reductions and histopathological alterations of the olfactory epithelium were found in F1 and F2 parents at 500 ppm and to a lower extent already at 150 ppm. There were exposure-related reductions of body weights in F1 and F2 offspring at 150 or 500 ppm which continued through postnatal day 70 with slightly delayed acquisitions of physical landmarks of development. No effects were seen in the functional observational battery for F1 dams during gestation and lactation or in F2 offspring. Of all parameters investigated, only straight channels escape times were increased on postnatal day 24 and grip strength on postnatal day 60 at 500 ppm. These changes identified in F2 pups born to dams exposed at 500 ppm are related to endpoints known to be age- and weight-sensitive and were observed in the absence of any other remarkable indicator of neurobehavioral toxicity. Based on these findings, the authors concluded the study NOAEC for growth of F2 offspring and developmental neurotoxicity was 50 ppm and 500 ppm, respectively. The U.K. HSE (Citation2008) interpreted the study findings to indicate that the overall NOAEC for reproductive performance was 500 ppm, while a NOAEC of 150 ppm for developmental toxicity was supported by the observation of male and female pup body weight loss of less than 10% only in the F2 generation pups on postnatal day 21 (terminal sacrifice).
Effects after postnatal treatment
There are only a few animal studies that have examined styrene for postnatal treatment effects and the majority of these were reviewed by the NTP CERHR (Citation2006) and/or U.K. HSE (Citation2008).
Shigeta et al. (Citation1989) evaluated behavioral and developmental effects of styrene postnatal exposure from postnatal day 1 to 48 without prior in utero exposure in rats at 25 or 50 ppm (7 h/day, 6 days/week). Offspring were exposed together with their dams until weaning and then male and female offspring were separately exposed. Body weights of males and females of both exposure groups were significantly below those of controls, but the three groups were not equivalent at the start of exposure because body weights of the two exposure groups were significantly smaller than controls already on day 1 for both sexes without a difference between both exposure groups. This difference persisted throughout the exposure. Incisor eruption and pinna detachment (only for the 25 ppm group) were significantly delayed, but again without an indication for a dose–response relation. Again, the possibility has to be considered that the initial differences in body weight between controls and exposed may have been a critical factor. Some significant differences in relation to controls were observed in the open field test, especially for the 50 ppm group. In the Sidman avoidance test with electro shocks, there was a tendency for lower avoidance rates for the exposed groups without dose-related trends. The lack of concordance between control and exposed rats at the start of the experiment severely compromises the interpretation of the study.
In a study of postnatal testicular effects, Srivastava, Seth, and Srivastava (Citation1992a) examined young male rats orally exposed to styrene from postnatal days 1–60 at 100 or 200 mg/kg bw/day (6 days/week). Each group consisted of 3 mothers with 21 pups (7 pups with each mother). Pups were directly dosed with styrene but not the lactating dams. After weaning dams and pups were separated. At 200 mg/kg bw/day absolute and relative weights of testes and spermatozoa counts in epididymis were decreased. In testes the following enzyme activities were increased: lactate dehydrogenase (germ cell marker), glucose-6-phosphate dehydrogenase (Leydig cell marker), ß-glucuronidase (Sertoli cell marker), and gamma-glutamyl transpeptidase (Sertoli cell marker); the following were decreased: sorbitol dehydrogenase (germ cell marker) and acid phosphatase (the specific cell lines are given in parentheses for which the enzymes may serve as markers). The authors suggested that in the young rat styrene might lead to a decrease in sperm counts and alterations in various testicular enzymes. However, the relevance of the altered testicular enzymes is unclear since they do not belong to the standard toxicological repertoire and historical control data are missing. In addition, randomization was insufficient as each group consisted of test animals all derived from only three mothers.
Srivastava, Seth, and Srivastava (Citation1992b) examined the same parameters investigated by Srivastava, Seth, and Srivastava (Citation1992a), but the dams were treated with 200 and 400 mg/kg bw/day and the pups were indirectly exposed during lactation. Only four litters each with eight male pups were used per dose group. After weaning treatment was discontinued and males were analyzed at the age of 31, 61, and 91 days. The study found no effects at 200 mg/kg bw/day. At 400 mg/kg bw/day and the age of 31 and 61 days, the testicular enzymes showed similar alterations as observed by Srivastava, Seth, and Srivastava (Citation1992a). However, no significant changes were observed for glucose-6-phosphate dehydrogenase and for all enzymes at day 91. The number of spermatozoa was significantly reduced at 400 mg/kg bw/day at day 61 and 91. No effects on body weight, weights and histopathology of testis and weight of epididymis were reported. Again, the toxicological relevance of the testicular enzymes is unclear.
The effect of protein-deficient diet in combination with styrene on neurobehavioral effects was studied in female rats by Khanna, Husain, and Seth (Citation1994). Normal and protein-deficient diet was supplied from the age of 21 days followed by oral exposure at 0 or 250 mg/kg bw/day from postnatal days 36–51. For this dosing period, half of the animals were fed normal diets, and half were fed protein-deficient diets. This study found body weight reduction, an increase in foot shock-induced aggressive behavior and an increase in amphetamine-induced locomotor activity under deficient diet that was aggravated by combined styrene exposure. Levels of norepinephrine, dopamine, and serotonin in the brain were significantly decreased after the combination of styrene exposure and deficient diet in comparison to protein-deficient diet without styrene. A similar pattern was observed for effects on dopamine and serotonin receptor binding in corpus striatum. No effects were noted after styrene treatment under normal diet. The study indicates that protein deficiency during early development is a potential predisposing factor in the expression of neurobehavioral toxicity of styrene. However, the significance of the interaction of styrene with malnutrition for human risk assessment is not clear.
Takao et al. (Citation2000) examined male mice (7/dose group) exposed to styrene in drinking water at 5 or 50 ppm (corresponding to 1.2 or 12.3 mg/kg bw/day according to NTP CERHR, Citation2006 and U.K. HSE, Citation2008) over 4 weeks beginning at the age of 5 weeks. Free testosterone, corticosterone, and LH were measured in blood; testes and spleen were the only organs studied. At 50 ppm, testosterone was decreased to 3% of control (estimated by NTP CERHR, Citation2006), while body weight, testes weights, histopathology, and the other hormones measured were not affected. The authors concluded that peripubertal exposure might disrupt male reproductive function. NTP CERHR (Citation2006) noted as important weakness that the extreme decrease of testosterone was not accompanied by other alterations in testes and LH; the U.K. HSE (Citation2008) noted the lack of historical data for testosterone at this age.
Kuwada et al. (Citation2002) injected styrene subcutaneously once into neonatal rats at postnatal day 1 at an estimated dose of 1 mg/kg bw. No rationale for dose selection was given. The number of animals is unclear and might have been between 3 and 10. The animals were sacrificed on day 21 (juvenile), 35 (prepubertal), and 50 (pubertal). Testes were weighed and examined by histopathology after fixation in formaldehyde. Steroidogenesis was determined in testicular microsomes by measuring T, 17-hydroxyprogesterone and 4-androstene-3,20-dione after incubation with progesterone. At day 21, testis weight was significantly lower as compared with control rats. At days 35 and 50, testis weights were similar to controls. At day 21, biosynthesis of androgens was reduced and histopathological alterations in the testes (organization of Leydig cells around the seminiferous tubules) were described but the suboptimal fixation should be noted. By day 50, these effects had reverted but not completely to control levels. The description of the study is very poor and a clear conclusion is not possible.
Kuwada et al. (Citation2012), using the same procedure as in Kuwanda et al. (Citation2002), investigated the effects on the ovary. No rationale for dose selection was given. For styrene, it is only noted that ovary weights “were restored to those of the untreated” controls on postnatal day 50 but the findings on day 21 or 35 are not described. No effects for histopathology of the ovaries were reported. Metabolism of T to E2 by ovarian homogenate was increased on day 21 and, as stated by the authors, was “considerably restored … but still reduced” on day 50, but numerical data and statistical analysis are missing. The very poor description of this study does not allow any conclusion.
Endocrine system disruption
Styrene’s potential to disrupt the endocrine system is an area of concern in the U.S. and Europe. The European Commission lists styrene as an endocrine disruptor (BKH Citation2000) and the U.S. EPA has included styrene in its List 2 for study in the EPA’s Endocrine Disruption Program (U.S. EPA, Citation2014a). In response to this concern, Gelbke et al. (Citation2015) performed a critical review for styrene’s effects on (anti)estrogenic, (anti)androgenic, thyroid, and prolactin activities. Interest in the latter hormone was based on reports of increased prolactin levels in styrene-exposed workers. This included a thorough evaluation of all reported studies for quality and relevance followed by a weight of evidence analysis. A brief summary of the review’s key conclusions follows.
Consistently negative results in a battery of in vitro and in vivo screening tests are reported for styrene and (anti)estrogenicity (Date et al. Citation2002; Ohno et al. Citation2001) which is supported by findings of no indication for such an activity in reliable guideline repeated dose and multigeneration studies (Cruzan et al. Citation2001, Citation1998, Citation1997, Citation2005a, Citation2005b). Similarly, in vitro and in vivo screening studies demonstrate no (anti)androgenic effects for styrene (Date et al. Citation2002). There are some reports of limited evidence for styrene interference with the androgenic system but these were non-guideline repeated-dose studies with important deficits (Chamkhia, Sakly, and Rhouma Citation2006; Kuwada et al. Citation2002; Srivastava, Seth, and Srivastava Citation1989, Citation1992a, Citation1992b; Takao et al. Citation2000) and the findings of these studies are not supported by the available guideline repeated-dose and multigeneration studies. For the thyroid axis, specific screening data are not available apart from a negative TR-binding assay that may only cover one of the various modes for a possible interference with this system. There is one reported study of exposed workers (Santini et al. Citation2008) that gave some indication for an interaction of styrene with the thyroid, but this study has important deficits and this finding is not supported by a large number of repeated-dose and multigeneration guideline studies showing no effects on thyroid histopathology or organ weight. Therefore, the weight-of-evidence analysis of the experimental data for styrene supports the conclusion that styrene does not interfere with the estrogen-androgen-thyroid systems.
Styrene association with prolactin effects is less clear. There are some studies that report evidence for elevated serum concentrations in FRP workers with high styrene exposures (Bergamaschi et al. Citation1996, Citation1997; Luderer et al. Citation2004; Mutti et al. Citation1984). However, the prolactin levels reported were within normal ranges and adverse effects associated with these findings have not been identified. A conclusion that these changes are not adverse is in part supported by observations indicating reversibility of increased prolactin levels as these were predominantly associated with recent acute but not with subchronic or chronic exposures (Luderer et al. Citation2004; Mutti et al. Citation1984). Mechanistic animal studies also support reversibility for prolactin changes.
The physiology of prolactin changes should be considered. The only known physiological function of prolactin is the stimulation of milk production and many normal stress situations may lead to elevations without any chemical exposure (Theorell et al. Citation1990). Although screening or guideline studies do not exist for experimental verification of the human observations, mechanistic studies in animal on dopamine, the prolactin-regulating neurotransmitter, do not support an explanation of how styrene may affect prolactin levels (Gagnaire et al. Citation2006; Jarry et al. Citation2002; Umemura et al. Citation2005). Therefore, given the lack of a plausible mechanistic explanation, coupled with the nature of the changes, unspecific acute workplace-related stress is a possible alternative explanation to styrene exposure in these workers. Workplace stress is certainly possible for laminators in the FRP industry, given the high physical demand, working in confined spaces often associated with higher temperatures, or wearing of respiratory masks. Also, styrene has a strong and unpleasant odor which may be a contributing factor. In addition, at high exposures, acute reversible effects such as headache, dizziness, and fatigue can occur and these may also influence prolactin levels. As habituation to stress leads to a decrease in prolactin level, this could explain why prolactin changes are observed with acute recent (and not subchronic/chronic) exposures as indicated by Luderer et al. (Citation2004). None of the reported studies with styrene-exposed workers considered a possible influence of stress on prolactin serum concentrations, and no information is available for the studies of Mutti et al. (Citation1984) and Bergamaschi et al. (Citation1996), Bergamaschi et al. (Citation1997) as to whether or how stress was taken into consideration when selecting control groups. The study of Luderer et al. (Citation2004) did not include a control group. Therefore, workplace-related stress in FRP workers is a plausible explanation for observed prolactin elevations and no specific (neuro)endocrine mode of actions has been identified for styrene.
Summary of reproductive and developmental toxicity
In summary, there is no indication that styrene produces adverse effects on fertility or development from studies in humans and experimental animals at occupational or environmental exposures. Animal findings of reduced pup growth and pup developmental delays are reported in rats but at high exposure concentrations (300–500 ppm). There are also no indications from experimental studies for an effect of styrene on estrogen, androgen, and/or thyroid pathways (endocrine disruption). The finding of increased prolactin serum concentrations in FRP workers is not supported by an underlying neuroendocrine mechanism from a large number of animal mechanistic studies and rather may have been related to workplace-stress.
Immunotoxicity
Cohen et al. (Citation2002) identified immunotoxicity as an endpoint of potential concern for styrene based on limited evidence in human and animal studies. The authors noted suggestive evidence in FRP workers exposed to 10–50 ppm styrene of an effect on lymphocytes (Bergamashi et al., Citation1995), in vitro suppression of mouse splenic T-lymphocyte killer activity (Grayson and Gill Citation1986), impaired humoral and cell-mediated immunity in mice orally administered styrene at 27 or 45 mg/kg bw/day for 5 days (Dogra et al. Citation1989), and decreased resistance to viral and malarial infections in mice that received styrene oral doses of 27 or 45 mg/kg bw/day for 4 weeks and decreased resistance to hookworm infections in rats that received 295 mg/kg bw/day (Dogra et al. Citation1992).
Since the publication of Cohen et al. (Citation2002), a few more studies on styrene potential effects on the immune system have appeared in the literature, but these are also not insightful.
In humans, several studies have examined markers of immune function, but have not assessed immune responses. Tulinska et al. (Citation2000) reported reduced proliferation of lymphocytes in response to concanavalin A, but not pokeweed in 29 FRP laminators compared to 19 controls. Workers had worked for an average of 13 years and had an average exposure of 27 ppm. There was no effect on the percentage of monocytes in white blood cell differential, immunoglobulins, C3+, or alpha2-microglobulin, but there was a slight increase in C4+. A decrease in the proportion of T-helper cells, along with reduced C3+ and C4+, was reported in a group of FRP workers (Bergamaschi et al. Citation1995). One study reported an increase in C4+ and another decrease (above). Increased adhesion molecules were reported on white blood cells of FRP workers (Jahnova et al. Citation2002). Impaired sHLA-G production and reduced serum IL-10 were reported in FRP workers (Rizzo et al. Citation2009). Strafella et al. (Citation2013) reported that styrene workers had induced stress-response genes that are involved in cytoprotection and cytotoxicity. Thus, there are contradictory or slight effects on markers of immune system reported in styrene-exposed workers.
In a mouse study involving several organic solvents, styrene was administered by inhalation at 100, 200, or 300 ppm. Mice exposed at 300 ppm had an increased response to sheep red blood cells in lung tissue, but not in spleen compared to controls (Ban, Hettich, and Bonnet Citation2003). The significance of this observation is unclear, since all the solvents tested reacted in exactly the same way. In another study, styrene was administered as a mixture with dioctyl phthalate (1:13). An LD50 was established for the mixture at 8100 mg/kg; rats were administered 0.2%, 0.3%, or 0.5% of the LD50 in groundnut oil 5 days/week for 4 weeks. (It is presumed that this was by gavage, but the report does not say.) There was decreased cellularity in the spleen in rats dosed at 0.5% of LD50 of the mixture (Dogra et al. Citation1993). Styrene was not tested separately, so no conclusion can be drawn about its role in this response. Of note, in the number of repeated exposure studies that have been conducted for styrene, no effects on spleen or thymus histopathology were observed in rats (exposed to up to 1000 ppm) or mice (exposed to up to 160 ppm) following 13 or 104 weeks of inhalation (Cruzan et al. Citation2001, Citation1998, Citation1997). Merker, Metzner, and Raabe (Citation2006) reported increased TH1 production in vitro from incubation of white blood cells with equal to or greater than 14 ng/ml SO. It should be noted that blood SO levels from inhalation of 50 ppm styrene for 2 h were 0.3–1.5 ng/mL. Thus, the response from SO in this in vitro study occurred at SO concentrations 10–50-fold higher than human SO levels from styrene.
Toxicity reference values derivation
Cohen et al. (Citation2002) estimated toxicity benchmarks for styrene inhalation exposure based on mouse lung tumorigenicity and occupationally related color vision impairment and, for styrene oral exposure, the toxicity benchmark was based on testicular changes in a rat subchronic study. For their inhalation cancer assessment, a range of values from 2 to 20 ppm was identified based on benchmark dose estimates of a 10% incremental probability of developing a lung tumor using the data from the Cruzan et al. (Citation2001) mouse carcinogenicity study. For non-cancer inhalation toxicity, 50 ppm was identified as the point of departure for occupational exposures from the Gobba et al. (Citation1991) study of workers; this value was adjusted for exposure period differences to 12 ppm for non-occupational exposures. For non-cancer oral toxicity, a value of 30 mg/kg bw/day was identified based on an equivalent lifetime dose adjustment (60 days/365 days) of 200 mg/kg bw/day, the dose that produced testicular changes in rats exposed orally for the first 60 days of life (Srivastava, Seth, and Srivastava Citation1989). No further adjustments were applied to these values. Since the Cohen et al. (Citation2002) assessment, significant new additional human and animal toxicity data on these and other toxicity endpoints have become available; these data further inform appropriate toxicity benchmarks for styrene inhalation and oral exposures. Several studies representing various toxicity endpoints of concern were considered as a potential basis for deriving styrene toxicity reference values. These select studies are summarized briefly in . Color vision and ototoxicity are the neurological endpoints considered for toxicity reference value derivation. As these effects appear to be the most sensitive, derived values are protective for neurological effects that may occur at higher exposures, such as delayed response time and drowsiness. Although this evaluation and assessments by NTP CERHR (Citation2006) and/or U.K. HSE (Citation2008) found there to be no indication for styrene to induce adverse effects on fertility and development in humans and experimental animals, with the exception of reduced pup growth and pup developmental delays observed in rats at 300–500 ppm (concentrations that are well above environmental and occupational exposures), this finding has resulted in classification as Category 2 (suspected of damaging the unborn child) for Reproductive toxicity in Europe (6th Adaptation to Technical Progress (Regulation (EU) No 605/2014 of 5 June 2014), the Harmonized Classification (Regulation (EC) No 1272/2008 Article 37 and Annex VI). Therefore, this observation was conservatively included in the evaluation of toxicity reference values.
Table 8. Studies considered for styrene OEL, RfC, and RfD derivation.
Similar to Cohen et al. (Citation2002), human neurotoxicity is identified as the key health effect for inhalation exposure and animal reproductive and developmental toxicity is identified as the key health effect for oral exposure. In contrast, however, human ototoxicity rather than color vision impairment is now identified as the most sensitive neurotoxicity endpoint; furthermore, developmental rather than reproductive toxicity is now identified as a concern from rat studies. In addition, despite clear evidence of styrene-induced mouse lung specific tumorigenicity, this endpoint is not considered for risk assessment because extensive MOA evidence reveals that this response is mouse-specific and is likely qualitatively, and possibly quantitatively, not relevant to human toxicity and carcinogenicity.
Selection of key studies, endpoints, and point-of-departure (POD) doses
An overall evaluation of the animal and human toxicology data for styrene reveals that ototoxicity and developmental/reproductive toxicity represent the most sensitive and appropriate endpoints for assessment of human-relevant health risks. Ototoxicity is a well-characterized response in both animal studies and occupationally exposed workers primarily in FRP industries. Importantly, animal MOA and human toxicity evaluations also reveal the most appropriate approach for consideration of the dose-response for informing risks related to styrene ototoxicity. Due to inadequate available developmental and reproductive toxicity data in humans, this important endpoint concern is addressed through high-quality guideline-based animal studies. Because of the robust and high-quality nature of human ototoxicity findings, these data are considered for calculation of styrene 8-h TWA OEL, RfC, and RfD values used to support the overall risk assessment. The animal developmental/reproductive toxicity data and human dyschromatopsia are evaluated for potential impact on what health values are selected for the risk assessment.
Ototoxicity key study
The key study used for development of the RfC and RfD values is Triebig, Bruckner, and Seeber (Citation2009) in which historical and current occupational exposures were evaluated for potential to induce hearing deficits. As described in previous sections of this review, strengths of this study included evaluation of reasonable numbers of exposed workers, use of robust hearing evaluation methods, a focus on styrene hearing impacts outside of potential confounding by noise, and an examination of the impact of historical higher levels of styrene exposure relative to exposures measured at the time of the hearing evaluations. This latter consideration is of particular importance to styrene ototoxicity risk in that, as detailed in previous sections of this review, animal and human data indicate that this response is due to short-term high-level styrene exposures with no substantive additional hearing loss with continued exposures. It is also important to note the data indicate that styrene-related hearing loss is not associated with cumulative styrene exposures but rather only short-term high exposures, i.e., exposures below the high-dose hearing loss inducing exposure, regardless of whether total concentration x time (C x T) exposures are equal to or greater than the short-term high C x T styrene exposures, are not ototoxic. Consideration of past styrene exposures is a key risk concern in that there is strong evidence that historical styrene exposures in the FRP industries have declined substantially over the past several decades, with median exposures of approximately 100 ppm in 1982–1990, 80 ppm in 1990–1995 and 30 ppm after 1995. Thus, failure to include an assessment of potential past higher-level styrene exposures in long-term styrene workers whose hearing is assessed only against later contemporary (e.g., post-1995) styrene exposures overestimates styrene’s ototoxicity risks. To address this critical styrene ototoxicity dose–response concern, Triebig, Bruckner, and Seeber (Citation2009) characterized hearing losses in worker subgroups that had experienced “high-long” versus “low-short” styrene exposures.
When past and present exposed individuals were compared, Triebig, Bruckner, and Seeber (Citation2009) concluded that workers currently exposed to about 39–49 ppm styrene with a job tenure of 6 years did not show evidence of styrene ototoxicity. In contrast, hearing deficits were detected in long-term exposed workers with styrene levels of 30–50 ppm as an overall average. However, those long-term workers (mean job tenures of approximately 15 years) experienced distinctly higher median exposures of 80 ppm and higher years prior to 1995.
Development of ototoxicity-based OEL, RfC and RfD values
The data of Triebig, Bruckner, and Seeber (Citation2009) indicate that FRP workers contemporarily exposed to styrene at approximately 39–49 ppm does not result in ototoxicity, while past exposures exceeding this range result in hearing loss. Thus, and as detailed further below, these data indicate that an 8-h Time-Weighted Average (TWA) occupational exposure of 20 ppm styrene represents a reasonable and conservative NOAEC (POD) dose for consideration as the basis for derivation of occupational exposure, and RfC and RfD general population health-protective values.
The default assessment factors (AFs) used to derive styrene OEL, RfC, and RfD values from human and animal toxicity data generally follow the recommendations of ECETOC (Citation2003, Citation2010). Those AFs address key uncertainties associated inter- and intra-species extrapolation, study duration, dose-response, and specific/severity of the response and overall quality of the data supporting the derived value. Although the AFs recommended by ECETOC are less than the standard inter- and intra-species AFs of 10 each (total 100) commonly used by U.S. EPA (Citation2002), the ECETOC values (ECETOC, Citation2003, Citation2010) represent recent data-driven refinements to these historical defaults.
Occupational exposure limit (ototoxicity)
Triebig, Bruckner, and Seeber (Citation2009) studied occupationally exposed workers and thus the 20 ppm POD hearing loss exposure represents a reasonable and conservative occupational exposure limit estimate without application of additional AFs for final derivation of an 8-h TWA OEL = 20 ppm. The OEL is based on high-quality FRP worker data of appropriate long and short durations, and is set at a value below the range of 30–50 ppm styrene identified as not compromising human hearing. However, because styrene-induced hearing loss is impacted by exposure to excessive workplace noise (>85 dBA), the 20 ppm styrene OEL assumes that the workplace also is in compliance with occupational noise standards reducing workplace noise to <85 dBA.
The occupational ototoxicity data of Triebig, Bruckner, and Seeber (Citation2009) indicate that the 8-h TWA OEL of 20 ppm styrene does not require any additional exposure notation such as a Short-Term Exposure Limit (STEL) designation. A STEL is an OEL notation designed to limit peak exposures when data indicate that short-term peak excursions during a workshift may induce rapid-onset toxicity (ACGIH, Citation2018). Triebig, Bruckner, and Seeber (Citation2009) characterized styrene workplace exposures by extrapolation from end-of-shift urinary mandelic and phenylglyoxylic acid concentrations, and because biomonitoring captures only cumulative workshift exposures, such extrapolations reflect only TWA exposures. Thus, workers experiencing 30–50 ppm exposures identified as protective of ototoxicity could have still experienced workshift short-term exposure excursions regarded as complying with a TWA-only OEL. For example, ACGIH (Citation2018) TLV® TWA-only values allow for transient exposure excursions that do not exceed 3 times the TWA for no more than 15 min at a time and 4 occasions during a workshift as long as the excursions are spaced at least 1 h apart. ACGIH guidance also indicates that no peak concentration should exceed fivefold the TWA. The ACGIH TWA criteria indicate that the non-ototoxic TWA exposures of 30–50 ppm styrene reported by Triebig, Bruckner, and Seeber (Citation2009), therefore, could have contained short-term peak excursions reaching 90–150 ppm and still have been in compliance with an ACGIH TWA TLV®. Thus, the 20 ppm TWA-only OEL recommended for styrene is unlikely to present an adverse ototoxicity concern as long as repeated 15-min short-term excursions do not exceed 60 ppm, no excursion exceeds 100 ppm, and an 8-h TWA of 20 ppm is not exceeded. This conclusion is further supported by the observation that the only workers exhibiting possible mild ototoxicity in Triebig, Bruckner, and Seeber (Citation2009) were long-term workers (mean job tenure of 15 years) who also experienced median TWA exposures of 80 ppm and greater prior to 1995. Using ACGIH guidance, an 80 ppm TWA exposure is greater than any 15 min excursion allowed for by a 20 ppm TWA, and 15 min excursions of 240 ppm styrene allowed for within an 80 ppm TWA are substantially higher than any maximum peak excursion of 100 ppm allowed for with a 20 ppm TWA.
No additional AFs are included in the OEL derivation in that:
No AF for interspecies differences is applicable given that the 20 ppm POD derives from human data so it is not necessary to apply a factor to account for interspecies differences.
For intraspecies differences, an AF of 1 is supported given the study findings derive from a large cohort study that inherently addresses human variability.
No additional AF (AF = 1) is needed to account for exposure duration differences because the study findings come from a long-term workplace exposure study.
The OEL basis also encompasses a range of exposure analyses providing information on time- and exposure–response relationships and severity, hence no additional AF (AF = 1) is needed to account for uncertainties in the dose–response relationship.
The quality of the database also warrants an AF of 1, given the derivation is based on a rigorous, and well-reported study.
General population RfC (ototoxicity)
A general population RfC is estimated by applying an AF of 3 to the 20 ppm POD based on styrene worker exposures. An AF of 3 is recommended for extrapolation of a general population health value from data obtained in worker studies (ECETOC, Citation2003, Citation2010). This AF is assumed to capture additional intra-species human population variability beyond that assumed in occupationally exposed individuals such as age, disease-status, gender, and other non-occupational confounders. No additional AFs are included in the RfC derivation in that:
The worker data are of high quality, with adequate numbers, and address the important consideration of past high-level styrene exposures.
Use of AFs to adjust for shorter time duration of worker exposures (8 hours/day, 5 days/week) relative to general population exposures is not necessary in that animal and human data indicate that styrene-induced hearing loss is not impacted by cumulative exposure as long as any short- or long-term exposures remain below an ototoxic threshold of 50 ppm.
Given these considerations, a general population RfC for styrene based on ototoxicity is estimated to be 6 ppm (20 ppm/3 = 6.67 ppm, rounded down to 6 ppm) (6 ppm equals about 25 mg/m3).
General population RfD (ototoxicity)
The styrene general population RfD for ototoxicity is derived from extrapolation of the RfC of 6 ppm (25 mg/m3). A value of 10 m3 of inhaled air is used as the air volume inhaled by workers at light workload for an 8-h work shift (ICRP Citation1975), equating to a total workshift inhaled styrene dose of 25 mg/m3 x 10 m3 = 250 mg. Using a styrene inhalation uptake of 70 percent (Engstrom, Citation1978), the total systemic styrene dose resulting from a 6 ppm RfC exposure equals 175 mg per day.
Because this systemic dose was estimated from adult workers, a 70 kg body weight is assumed, yielding a general population RfD for styrene of 2.5 mg/kg bw/day.
As with the general population RfC derivation, no additional AFs are required to compensate for the greater amount of total inhaled air per day for the general population (20 m3) or for 8 h/day 5 days/week exposure for workers since styrene ototoxicity is driven by short-term high exposure of > 80 ppm in workers and not by cumulative styrene exposures as might be reflected by longer total daily 24-h exposures in the general human population and/or lesser duration of exposure of workers relative to the general population. Thus, general population daily doses below 2.5 mg/kg bw/day are not expected elicit ototoxicity.
Because the proposed RfC and RfC values based on ototoxicity are not time-adjusted from the worker occupational exposure limit of 20 ppm, it must be considered that other endpoints exhibiting a greater human POD exposure might extrapolate to a derived RfC lower than that based on ototoxicity since such endpoints must be appropriately adjusted for exposure duration if based on worker data. In addition, safety values extrapolated from non-ototoxic endpoints identified in animal studies may result in estimated health values below those based on occupational ototoxicity when dose-duration adjustments are made to the endpoint POD dose and after application of appropriate AFs.
Developmental/reproductive toxicity key study
The key study selected for assessment of potential developmental and reproductive toxicity in workers and the general population is the rat two-generation reproduction study using 0, 50, 150, or 500 ppm styrene exposures encompassing 6 h/day, 7 days/week and involving 70 days premating F0 parental generation males and females, F0 females through end of weaning, continuous F1 generation male/female exposures through mating and females to gestation day 20 of the F2 generation (Cruzan et al. Citation2005a). The F0 and F1 generation parental females were gavaged with 66, 117 or 300 mg/kg bw/day styrene in olive oil (divided into three equal doses administered 2 h apart) on lactation days 1–4. The overall NOAEC for reproductive performance was 500 ppm, while a NOAEC of 150 ppm for developmental toxicity was determined by the U.K. HSE (Citation2008) based on the observation of male and female pup body weight loss of less than 10% only in the F2 generation pups on postnatal day 21 (terminal sacrifice).
Development of developmental/reproductive toxicity-based OEL, RfC and RfD values
The Cruzan et al. (Citation2005a) study developmental findings indicate that 150 ppm represents a reasonable and conservative NOAEC point of departure dose for consideration as the basis for derivation of an estimated OEL, and RfC and RfD general population health-protective values.
The default AFs used to derive styrene OEL, RfC, and RfD values from human and animal toxicity data generally follow the recommendations of ECETOC (Citation2003; Citation2010). Those AFs address key uncertainties associated inter- and intra-species extrapolation, study duration, dose-response, and specific/severity of the response and overall quality of the data supporting the derived value.
Occupational exposure limit (developmental/reproductive toxicity)
For extrapolation of these data to a worker OEL, the NOAEC of 500 ppm was used since weight loss observed only in F2 offspring was derived from F1 parental animals, which included substantial exposure periods to F1 offspring that are not relevant to possible occupational exposures, i.e., direct exposures of F1 rats by inhalation between weaning and puberty. Since no body weight effects were noted in F1 pups exposed indirectly through lactation, selection of 500 ppm as the developmental and reproductive NOAEC is used as the basis for derivation of the OEL.
Since workers are exposed for up to 8 h/day while the rats were exposed for 6 h/day, the 500 ppm starting NOAEC is adjusted by a factor of 0.75 (6 h per day divided by 8 h per day). The 7 days per week exposure in rats is adjusted to the worker 5 days per weeks by using the factor of 7/5 = 1.4 (7 days divided by 5 days). Finally, because the rodent data were developed in animals at rest and workers are assumed as engaged in light activity, an additional correction factor of 0.67 is included (6.7 m3 of inhaled air per 8 h of humans at rest divided by 10 m3 at light work). Application of these adjustments to the 500 ppm NOAEC results in a worker 8-h POD exposure of 352 ppm (500 ppm x 0.75 × 1.4 x 0.67 = 352 ppm). The worker POD exposure is further adjusted by a total worker inter- and intra-species AF = 3 (ECETOC, Citation2010) to support an estimated inhalation OEL of 117 ppm styrene (497 mg/m3). As per guidance recommendations of ECETOC (Citation2003, Citation2010), AFs of 1 were used for:
The duration of the two-generation study includes all work-related periods of pre- and postnatal exposure vulnerability for developmental and reproductive effects, starting with exposures of young adult animals through pre-mating period and subsequent pregnancy during active work and breastfeeding without maternity leave;
500 ppm styrene (top dose tested) was a clear NOAEC for developmental and reproductive effects in the exposure relevant F0 and F1 generation animals and thus appropriate for dose-response and specific/severity issues;
The 500 ppm NOAEC was based on a protocol reflecting modern regulatory testing standards and was adequately reported.
General population RfC (developmental/reproductive toxicity)
Derivation of the developmental and reproductive toxicity general population RfC is based on the U.K. HSE (Citation2008) conclusion of an overall NOAEC of 150 ppm styrene as determined from minor body weight loss only in F2 generation pups in the 2-generation reproduction study in rats. Since the reproduction study used 7 days/week exposures, only an additional adjustment of 0.25 is required to account for the 6 hours/day rat exposures (6/24), with a resulting POD styrene general population exposure of 37.5 ppm. An AF of 5 was selected to account for intra-species variability in humans and an AF of 2 to account for the minor decrements in body weight observed only in F2 generation pups for a total AF of 10 (5 times 2). The minor decrease in F2 pup body weight was not regarded as sufficient to justify a lowering of the NOAEC, but rather is accounted by use of the AF of 2 accounting for dose-response and specific/severity issues. Thus, the styrene general population RfC = 3.7 ppm (15.7 mg/m3) based on mild rat developmental effects. AFs of 1 were used for:
Interspecies extrapolation, as the inhalation RfC is based on an inhalation rat toxicity study;
The duration of the rat study includes all potential vulnerable exposure periods impacting potential adverse developmental outcomes and reproductive cycles;
The 150 ppm developmental/reproductive NOAEC was based on a protocol reflecting modern regulatory testing standards and was adequately reported.
General population RfD (developmental/reproductive toxicity)
A general population developmental and reproductive toxicity for styrene RfD = 3.1 mg/kg bw/day is derived from the inhalation RfC of 3.7 ppm [(15.7 mg/m3 x 20 m3 x 0.7)/70 kg] = 3.1 mg/kg bw/day. 20 m3 is the assumed total inhaled air per day for resting humans; 0.7 is % of systemically absorbed styrene following inhalation exposure (Engstrom, Citation1978); and 70 kg is default human body weight.
Dyschromatopsia key study
The key study for evaluation of dyschromatopsia is Seeber, Bruckner, and Triebig (Citation2009b) in FRP workers. This endpoint provides a reasonable alternative human-based endpoint for derivation of the POD and toxicity reference values.
Development of dyschromatopsia-based OEL, RfC and RfD values
The data of Seeber, Bruckner, and Triebig (Citation2009b) establish a conservative NOAEC for dyschromatopsia in FRP workers of 50 ppm in that no dyschromatopsia was observed in a subset of workers with “high-long” styrene exposures of approximately 100 ppm.
Occupational exposure limit (dyschromatopsia)
The 50 ppm NOAEC derived from Seeber, Bruckner, and Triebig (Citation2009b) is based on well-characterized FRP workers; therefore, no further adjustments are necessary to support an OEL of 50 ppm based on dyschromatopsia.
General population (RfD) (dyschromatopsia)
Because there are no data addressing if dyschromatopsia is impacted by peak versus cumulative styrene exposures, it must be assumed that this response is sensitive to total cumulative exposure versus peak only (as is the case for ototoxicity) and further adjustment is required for derivation of a general population RfC. The 50 ppm OEL value is adjusted to a general population RfC as follows: General population RfC = [(50 ppm x 5/7 x 8/24)/3] = 4 ppm (17 mg/m3). 5/7 = time adjustment for worker exposure 5 days/week; 8/24 = time adjustment for 8 hours/day worker exposure; AF of 3 for variability in general population beyond that of workers.
General population (RfD) (dyschromatopsia)
The styrene general population RfD for dyschromatopsia is derived from extrapolation of the general population RfC of 4 ppm (17 mg/m3). A value of 20 m3 of inhaled air is used as the air volume inhaled by the general population in 24 h (ICRP Citation1975) equating to a total daily styrene dose of 17 mg/m3 x 20 m3 = 340 mg. Using a styrene inhalation uptake of styrene of 70% (Engstrom, Citation1978), the total systemic styrene dose resulting from a 4 ppm RfC exposure equals 238 mg per day.
Because this systemic dose was estimated from adult workers, a 70 kg body weight is assumed, yielding a general population RfD for styrene of 3.4 mg/kg bw/day.
As the general population RfC derivation for dyschromatopsia adjusted for general population versus worker exposure durations and applied an AF of 3 for general population variability, no additional AFs or adjustments are required. Thus, general population daily doses below 3.4 mg/kg bw/day are not expected elicit dyschromatopsia.
Summary of toxicity reference value derivation
No toxicity values for cancer are now proposed for styrene, since the mouse lung tumor mechanistic data indicate that this response is mouse-specific and is quantitatively, and possibly qualitatively, not relevant to human toxicity and carcinogenicity. Human epidemiological cancer evidence is inconclusive; hence it is not sufficient for cancer dose–response assessment.
Based on currently available human and animal toxicity data for styrene, non-cancer toxicity reference values are founded on human ototoxicity (OEL, RfD) and rat developmental toxicity findings (RfC). The estimated styrene inhalation occupational OEL is 20 ppm (equates to BEI for styrene of 400 mgMA +PGA/g and 40 µg styrene/L urine (ACGIH Citation2015)); the general population RfC is 3.7 ppm; and the general population RfD is 2.5 mg/kg bw/day. These styrene toxicity values are all lower than the non-cancer toxicity values derived by Cohen et al. (Citation2002) for similar toxicity endpoints; however, the specific toxicity effects of concern have changed given the more recent toxicity study results. In addition, Cohen et al. (Citation2002) did not apply assessment factors to their values, while the present values have incorporated assessment factors.
Exposure assessment
Cohen et al. (Citation2002) performed a comprehensive evaluation of styrene exposure with focus on the general population, with sources from air, food, water, consumer products, and waste materials, as well as occupational exposures. Because styrene is both naturally occurring and industrially important, it is ubiquitous in the general environment. As a result, virtually everyone in the U.S. is continuously exposed to the compound from a variety of sources via multiple pathways. Exposure to styrene may occur by inhalation, ingestion, and/or dermal absorption. Absorption of styrene by humans following oral exposure is assumed to be 100%, and 60–70% via inhalation (ATSDR, Citation2010). The dominant exposure route for both workers and the general public is inhalation, and available data indicate that exposure to styrene via the dermal route is comparatively low (ATSDR, Citation2010; NTP CERHR, Citation2006). Using charcoal patches fastened to the clothing of FRP workers engaged in spraying and rolling tasks, Eriksson and Wiklund (Citation2004) demonstrated that dermal exposure to styrene occurs. However, they did not determine whether styrene accumulated on the patches was absorbed through the skin. In a subsequent study, Creta et al. (Citation2018) evaluated inhalation and dermal exposure styrene exposures using organic vapor monitors and charcoal patches in four groups of Romanian workers involved in production of thermoplastic panels: (1) sheet moulding composite (SMC) workers, (2) hydraulic press (HP) workers, (3) mechanics workers, and (4) office workers. Internal styrene dose was biologically monitored via measurement of the urinary metabolites mandelic acid (MA), phenylglyoxylic acid (PGA), and the sum of the two (MA + PGA). The HP workers had the highest masses of styrene in dermal patches per unit time (1,640 mg/hour), followed by SMC workers (450 mg/h), but airborne exposure concentrations for the two groups were similar. The fact that there was no significant difference between these groups in concentrations of urinary MA + PGA suggests that dermal exposure was not a significant contributor to internal exposure. However, this study design did not permit direct determination of the relative contributions of inhalation and dermal absorption.
More informative are human volunteer studies in which dermal absorption of styrene was actually quantified. Percutaneous penetration of styrene vapors at air concentrations of 600 ppm for 3.5 h was studied in a dynamic exposure chamber with volunteers wearing respiratory protection, and compared with uptake via inhalation for the same duration at 10 ppm (Riihimaki and Pfaffli Citation1978). To facilitate dermal absorption, subjects were clothed only in thin pajamas and socks. Styrene exposure was assessed by measuring styrene concentrations in blood and breath and MA and PGA concentrations in urine. Dermal absorption resulted in uptake of only 0.1–2% of the amount estimated to be absorbed via inhalation. Berode, Droz, and Guillemin (Citation1985) evaluated styrene uptake by volunteers who dipped one hand in liquid styrene for 10–30 min by periodically measuring the metabolites MA and PGA in urine (creatinine-normalized) and styrene in breath over the following 24 h (at least). They noted that the effect of exposure duration was not proportional, suggesting that dermal uptake may decrease with time. The amount of styrene absorbed was roughly equivalent to 4% of that retained in the body during an 8-h inhalation exposure to 50 ppm. Berode et al. concluded that “ … skin resorption of liquid styrene as compared to exposure by inhalation represents only a very minor form of uptake and is probably negligible in most situations.” Limasset et al. (Citation1999) compared urinary excretion of styrene metabolites MA and PGA by four groups of French FRP workers performing the same task at the same time in the same workshop, 2 h per day for 4 consecutive days, while wearing different PPE: total protection with an insulating suit and mask, respiratory equipment only, percutaneous protection only, and no protection. Mean airborne styrene over the study period ranged from 42 to 59 ppm. There were no significant differences in the levels of urinary styrene metabolites in workers wearing total protective equipment vs. those wearing a respiratory mask only.
As discussed in the European Union RAR, the potential for dermal exposure to styrene in industries using enclosed processes is limited to breaches and during commission of short-term tasks such as sampling, drum filling, and tanker loading. Most companies in these industries reported the use of PPE during breaches (U.K. HSE, Citation2008). Available data indicate that these measures effectively prevent dermal exposure. The NTP CERHR concluded that the amount of styrene exposure through the dermal route is minimal except in cases where there is prolonged and repeated skin contact with liquid styrene, in which case the dermal contribution might be similar to the dose achieved through inhalation at low occupational concentrations (1 to 2 ppm) (NTP CERHR, Citation2006). Finally, ACGIH did not consider a skin designation necessary for styrene “in as much as this route would contribute 0.1% to no more than 5% of total absorbed styrene” (ACGIH, Citation2001). Therefore, dermal exposure was not considered as an important route of human exposure to styrene in this assessment.
Source
Manufactured styrene is produced in high volumes in the U.S. and worldwide. Production totals in the U.S. have remained relatively constant since the 1990s (Cohen et al. Citation2002) with 2012 annual volumes reported in the U.S. EPA Chemical Data Reporting (CDR) information at 10,245,086,182 pounds/year (https://chemview.epa.gov/oppt_chemical_search/) which is approximately equivalent to 5 million tons/year. The U.S. is a net exporter of styrene to the rest of the world; polystyrene and expandable polystyrene account for about two-thirds of global styrene consumption (ICIS Chemical Business Citation2014). The U.S. export of styrene in 2016 was 4.7 billion pounds, up 2.7% from the preceding year and the highest value currently recorded by the U.S. International Trade Commission (United States International Trade Commission Citation2017).
Primary sources of styrene in the environment are industrial emissions, motor vehicle exhaust, and incomplete combustion of natural materials (wood and other fuels) or from incinerators burning various hydrocarbon-containing waste streams (ATSDR, Citation2010; Bari et al. Citation2015; Batterman, Jia, and Hatzivasilis Citation2007; Cohen et al. Citation2002; Gilman et al. Citation2015; Hellén et al. Citation2006; Lemieux, Lutes, and Santoianni Citation2004; Stockwell et al. Citation2015; U.S. EPA, Citation2014b; Yu, Zhu, and Fan Citation2014; Zhao, Hopke, and Karl Citation2004). Styrene is not included on the 2017 ATSDR Substance Priority List (ATSDR, Citation2017), indicating that it is not commonly found at National Priority List sites. Styrene is also released in tobacco smoke both directly to the smoker and indirectly through environmental tobacco smoke (ETS) (Chambers et al. Citation2011; Charles, Batterman, and Jia Citation2007; Charles et al. Citation2008; Kim, Harrad, and Harrison Citation2001; Pazo et al. Citation2016; Talhout et al. Citation2011; Wallace et al. Citation1987a, Citation1987b) and off-gassing from ETS-exposed fabric (Chien, Chang, and Liu Citation2011).
Environmental fate and transport
Level 1 fugacity modeling indicates that over 96.5% of styrene in the environment partitions to the atmosphere, where it exists predominantly in the vapor phase (Figure S1) (ATSDR, Citation2010; ECB, Citation2002; Seth and Mackay Citation2002). Due to its relatively high vapor pressure (5 mm Hg at 20°C) and low-to-moderate water solubility (300 milligrams per liter [mg/L] at 20°C), a small proportion (less than 2%) of styrene may be removed by wet deposition, but a substantial portion in precipitation volatilizes back to the atmosphere. Styrene does not persist in the atmosphere, however, due to its ready photooxidation by hydroxyl radicals and ozone (ATSDR, Citation2010; U.S. EPA, Citation1993b). Styrene half-life in the troposphere due to oxidation by hydroxyl radicals is approximately 3 h, and that due to reaction with ozone is approximately 9 h (Alexander Citation1997; ATSDR, Citation2010; ECB, Citation2002; U.S.EPA, Citation1987). The rapid reaction of organic compounds with hydroxyl radicals in the atmosphere may contribute to the formation of photochemical ozone. However, styrene also reacts relatively quickly with ozone and is partially degraded to benzaldehyde. As a result, its photochemical ozone creation potential (POCP) is lower than that of any aromatic compound except benzaldehyde (which has a negative POCP) (Jenkin et al. Citation2003). Thus, styrene emissions are not expected to contribute significantly to photochemical ozone formation (ECB, Citation2002; Jenkin et al. Citation2003).
The majority of styrene released to water volatilizes to the atmosphere, with reported half-lives ranging from less than 1 h to 51 days, depending on depth, degree of turbulence, and environmental conditions (Alexander Citation1997; ATSDR, Citation2010; ECB, Citation2002; Fu and Alexander Citation1992; U.S. EPA, Citation1987). Styrene is biodegraded “quite readily” in water under aerobic conditions, with estimated half-lives of less than 5 days to 4 weeks (Alexander Citation1997; ATSDR, Citation2010; ECB, Citation2002; Fu and Alexander Citation1992; U.S. EPA, Citation1987).
With a relatively low organic carbon/water partition coefficient (Koc) (log Koc = 2.96), styrene is moderately mobile in soil and sediment (Alexander Citation1997; ATSDR, Citation2010; ECB, Citation2002; Fu and Alexander Citation1992; Seth and Mackay Citation2002). Neither removal from the water column by adsorption to bottom sediment nor aquatic transport by adsorption to suspended sediment are likely to be important processes for styrene in most surface waters (ECB, Citation2002; Fu and Alexander Citation1992; U.S. EPA, Citation1987). Styrene does not persist in soil, as a large fraction will volatilize rapidly from the soil surface. The half-life for volatilization of styrene from soil surfaces was estimated to be approximately 1 min, increasing with increasing depth (ECB, Citation2002). Styrene can also undergo biodegradation in soil under aerobic conditions. Volatilization and biodegradation occur rapidly and simultaneously near the soil surface, but biodegradation dominates at depth under conditions favorable to microbial activity (Alexander Citation1997; ATSDR, Citation2010; ECB, Citation2002; Fu and Alexander Citation1992).
The aquatic bioconcentration factor (BCF) (the ratio of the concentration of a chemical in aquatic organisms to that in the surrounding water at equilibrium) is a key parameter in environmental assessment, as a chemical’s tendency to accumulate in aquatic organisms is an important determinant of food chain exposure. ATSDR estimated a BCF of about 25 for styrene based on its water solubility; the only available measured BCF is 13.5 (ATSDR, Citation2010). Similar BCFs have been calculated based on molecular connectivity (Lu et al. Citation2000) and other theoretical molecular descriptors (Gramatica and Papa Citation2003; Qin, Liu, and Liu Citation2010). Such low BCF values are not considered indicative of significant bioconcentration potential in fish (ATSDR, Citation2010; U.S. EPA, Citation1987).
No information was identified regarding uptake of styrene by terrestrial plants. According to the U.K. Environment Agency’s Contaminated Land Exposure Assessment (CLEA) model, consumption of homegrown produce contributes only 4.2% of the daily styrene intake (as compared to about 30% for benzene) (U.K. Environment Agency, Citation2015). The fact that uptake of benzene by plants is not an exposure pathway of potential human health concern suggests that this pathway is also insignificant for styrene (Collins, Bell, and Crews Citation2000).
Releases of styrene to the environment
Styrene is continuously released to the environment from natural sources, industrial processes and products, and human activities. These sources can be generally categorized as stationary (e.g., prescribed and uncontrolled burning, residential burning, incinerators, factories, refineries, power plants), mobile (e.g., combustion engines in lawnmowers, motorboats, cars, trucks, buses, motorcycles, off-road vehicles and non-road machines, trains, or airplanes), and personal (e.g., use of petroleum products, smoking).
The U.S. EPA administers two databases that record the magnitude of chemical releases from diverse sources in the U.S.: the National Emissions Inventory (NEI) and the Toxics Release Inventory (TRI). The NEI is a comprehensive and detailed estimate of air emissions of both criteria and hazardous air pollutants (HAPs) from all air emissions sources, prepared every three years based primarily on emission estimates and model inputs provided by state, local, and tribal air agencies and supplemented by data developed by the EPA (U.S. EPA, Citation2018b). As such, it provides the “big picture” of U.S. styrene emissions. The NEI currently includes four major classes of HAP emission sources: point sources, non-point sources, mobile sources, and events. The TRI contains information about releases and other waste management activities reported annually by certain covered industry groups as well as federal facilities for over 650 chemicals, including styrene (U.S. EPA, Citation2018c). TRI reporting is required only for facilities that: (1) are included in a specified industrial sector; (2) have 10 or more full-time employees or the equivalent; and (3) exceed any of the following reporting thresholds for manufacturing, processing, or otherwise using a TRI chemical. Limitations on the reliability of TRI data include the two-year time lag between release and data publication, reporting exemptions based on size, primary business activity, and chemical manufacturing, processing, and use thresholds, and potential inaccuracies in self-reported data. TRI air emissions data are included in the point sources category in the NEI database.
In the most recent NEI data-set (2014 NEIv2) (U.S. EPA, Citation2018a), industrial processes contributed the majority of styrene emissions (41%), followed by fires (22%), mobile sources (16%), and waste disposal (13%) (Figure S2). Types of industries in the TRI and NEI databases are categorized according to the North American Industry Classification System (NAICS). As shown in Table S4, the industry sectors contributing the highest styrene emissions in 2016 are NAICS 326 Plastics and Rubber (52% of total releases), NAICS 336 Transportation Equipment (29% of total releases), and NAICS 325 Chemicals (12% of total releases). The major pathway of styrene emissions from these industries in 2015 was released to air (Table S5). On a geographic basis, the highest styrene emissions in 2014 occurred in California, Texas, Florida, and Indiana (Figure S3).
Styrene concentrations in environmental media
Outdoor air
Styrene is emitted by a variety of sources and is often detected in ambient air. An evaluation of the global atmospheric styrene budget indicated that most emissions are of anthropogenic origin, and total emissions are about 0.8 teragrams of carbon per year (Cabrera-Perez et al. Citation2016). The Total Exposure Assessment Methodology (TEAM) studies conducted from 1980–1987 in New Jersey and California showed that styrene concentrations in outdoor air samples from urban California and New Jersey locations were slightly higher than those in suburban Greensboro, North Carolina and rural Devils Lake, North Dakota areas, suggesting a relatively weak relationship with traffic density (Wallace et al. Citation1987b). In a review of factors influencing VOC concentrations in the U.S., Mohamed, Kang, and Aneja (Citation2002) found that ambient concentrations of styrene were “essentially uncorrelated” with those of other prevalent VOCs, appearing to arise principally from industrial sources. Using positive matrix factorization (PMF), Logue, Small, and Robinson (Citation2009) showed that styrene measured at three sites in Pittsburgh, Pennsylvania was associated with industrial influences. In a study of the relative importance of commercial (e.g., dry cleaners, fast food restaurants, photo labs, commercial heating/boilers, nail salons, print shops, etc.), industrial (e.g., textiles, dyes, chemicals, metal fabrication/refinishing/recovery; plastics, printing, electronics, paper/food products, etc.), and mobile sources in determining VOC concentrations in urban Paterson, New Jersey, styrene concentrations were significantly higher at commercial locations (mean = 0.28 µg/m3) than at industrial locations (0.16 µg/m3) and mobile locations (0.17 µg/m3) locations, and associated with solvent emissions from coatings/paints and industrial uses (Yu, Zhu, and Fan Citation2014).
The U.S.EPA sponsors several air monitoring programs designed to characterize the composition and magnitude of air toxics concentrations in or near urban locations: (1) the Urban Air Toxics Monitoring Program (UATMP); (2) the National Air Toxics Trends Stations (NATTS) network; and (3) the Community-Scale Air Toxics Ambient Monitoring Program (CSATAM). In monitoring conducted in 2013, styrene was detected in 1477 of 1883 samples (78%) at concentrations ranging from 0.02 to 140 µg/m3 (U.S. EPA, Citation2015). The mean, median, and standard deviation of this dataset were 0.32, 0.09, and 3.3 µg/m3, respectively (U.S.EPA, Citation2015).
The most comprehensive and up-to-date source of data for air-related risk assessment is the U.S.EPA’s Air Quality System (AQS) database, a repository of data from thousands of air monitoring stations throughout the U.S. (U.S. EPA, Citation2017a). A review of air toxics data collected in the U.S.EPA’s AQS showed that median levels of styrene declined by 7% per year from 2000–2005 (McCarthy et al. Citation2007). National annual average styrene concentrations from 2012–2016 were stable, ranging from 0.17 µg/m3–0.24 µg/m3, with an overall 5-year average of 0.21 µg/m3. Five-year annual average 10th, 50th, 75th, and 95th percentile concentrations for the states with the highest industrial styrene emissions in 2014 (California, Florida, Indiana, and Texas) and the rest of the U.S. are plotted in Figure S4. The fact that ambient styrene concentrations are not strongly elevated in these states may reflect the transience of atmospheric styrene or the importance of non-industrial sources. Mean annual average styrene concentrations in counties classified as rural (n = 49) and urban (n = 100) in this dataset are similar, possibly reflecting (1) the fact that styrene is not strongly associated with motor vehicle emissions; and (2) the bias toward siting monitors in more populated areas (data not shown). Therefore, although it is likely that ambient styrene concentrations are lower in areas less influenced by human activities, no such distinction is apparent in this AQS dataset.
Indoor air
Indoor air quality is a complex function of a building’s location, characteristics, composition, content, and uses. Indoor VOC concentrations are a function of both outdoor sources (such as motor vehicle and industrial emissions) and indoor sources such as construction materials, interior surfaces and coatings, ETS, consumer products, and cooking emissions, which are intensified by modern energy-efficient building and ventilation practices that reduce infiltration air exchange (Derbez et al. Citation2018; Kim, Harrad, and Harrison Citation2001; Willem and Singer Citation2010). The indoor environment has become the dominant venue for exposure assessment, not only because most individuals, including children, spend the majority of their time indoors (Klepeis et al. Citation2001), but also because concentrations of styrene (and most VOCs) are typically higher in buildings than in ambient air (Cometto-Muniz and Abraham Citation2015; ECB, Citation2002). A study of the relative contributions of different microenvironments on personal styrene exposure based on air measurements and time-activity diaries completed by urban, suburban, and rural subjects clearly showed that the home is the locus of greatest exposure, followed by work/school (Harrison et al. Citation2009) (Figure S5). Therefore, this review places the greatest emphasis on residential exposure.
Sources
The U.S.EPA’s TEAM studies, conducted in the 1980s in 8 urban areas, were the first major attempt to quantify Americans’ indoor exposure to chemicals using a probability-based sampling framework (Pellizzari et al. Citation1986; Thomas et al. Citation1993; Wallace Citation1989, Citation1991a, Citation1991b, Citation1993, Citation1996, Citation2001; Wallace et al. Citation1985, Citation1986a, Citation1986b, Citation1987a, Citation1987b, Citation1988, Citation1989; Wallace and Pellizzari Citation1986, Citation1995). The TEAM studies identified a correlation between exposure to paint, plastics, chemical plants, and smoking and personal exposure to styrene (Wallace and Pellizzari Citation1986; Wallace et al. Citation1985). Median concentrations of styrene decreased in indoor (residential) and outdoor air, and median indoor emission rates decreased between the TEAM and Relationships of Indoor, Outdoor, and Personal Air (RIOPA) studies conducted over a decade later (Weschler Citation2009). RIOPA was designed to provide matched indoor, outdoor, and personal concentrations in homes that varied in proximity to outdoor pollution sources and had a wide range of air exchange rates (Weisel et al. Citation2005). A convenience sample of approximately 100 non-smoking households was selected in each of three urban areas with diverse climates and sources of air toxics: Elizabeth, New Jersey (part of an urban corridor, with a high population density, heavy traffic, and multiple point sources, although self-service pumping of gas is forbidden); Houston, Texas (heavy traffic, as well as the highest density of petrochemical facilities in the world); and Los Angeles County, California (vehicular emissions from major freeways). Questionnaires were used to identify homes, neighborhoods, and personal activities that might affect exposures (Weisel et al. Citation2005). The indoor and outdoor contributions to indoor and personal measurements were also quantified. The median fractional outdoor source contribution to indoor concentrations of styrene was 0.58 (as opposed to 0.13 for d-limonene, a compound used commonly in terpene-based solvents and found in air fresheners and as a fragrance in consumer products, and 1.0 for the exclusively gasoline-associated compound methyl tertiary butyl ether) (Weisel et al. Citation2005).
Styrene in indoor air can arise from multiple indoor and outdoor sources. In the European EXPOLIS study, principal component analysis was used to identify sources of styrene and other VOCs for non-smoking urban adults in Helsinki in 1996–1997 (Edwards et al. Citation2001a, Citation2001b). In residential indoor air, styrene was associated with carpets, rubber, and adhesive, while it was associated with long-range transport of compounds associated with traffic emissions and other combustion sources in personal exposure samples (Edwards et al. Citation2001a, Citation2001b). Other European studies have also identified carpets and carpet backings (along with ETS) as significant sources of styrene in indoor air (Gokhale, Kohajda, and Schlink Citation2008; Katsoyiannis, Leva, and Kotzias Citation2008; Sarigiannis et al. Citation2011; Schlink et al. Citation2010). Application of positive matrix factorization to data from the TEAM studies indicated that the main source type associated with styrene was consumer products (Anderson, Miller, and Milford Citation2001). Using simulated personal exposure data, styrene was associated with automobile exhaust and ETS (Miller et al. Citation2002). A study conducted in 1999 evaluating the contribution of various microenvironments on exposure of non-smoking adults living in urban Minneapolis-St. Paul, Minnesota found that styrene exposure was associated with “Water” (showering, bathing, or swimming), but not with ETS or gasoline (Sexton et al. Citation2007).
The School Health Initiative: Environment, Learning, Disease (SHIELD) study, which examined the exposure of low-income urban children in Minneapolis, Minnesota to styrene and other chemicals in 1999–2000, found that elevated personal styrene exposures were associated with adult tobacco use, but not elevated residential indoor air concentrations (Adgate et al. Citation2004a). Focusing on children living in the Minneapolis area, Adgate et al. (Citation2004a) reported significantly higher styrene concentrations in non-urban vs. urban households and in households with smokers, but not in those with attached garages (Adgate et al. Citation2004b). In keeping with this observation, Batterman, Jia, and Hatzivasilis (Citation2007) observed that styrene concentrations in southeast Michigan houses were similar to those in their attached garages. Similarly, another Michigan study observed higher styrene concentrations in houses that had undergone recent renovation, but not those with attached garages (Jia, Batterman, and Godwin Citation2008a). The dominance of indoor sources for styrene was further suggested by the correlation of lower styrene concentrations with higher ventilation (window opening) (Hamidin et al. Citation2013).
Available data indicate that factors that most contribute to styrene levels in indoor air are: (1) ETS; (2) the presence and/or use of certain consumer, office, and household products; and (3) styrenic building and furnishing materials.
Smoking and ETS
Styrene is a constituent of tobacco smoke (Charles, Batterman, and Jia Citation2007; Charles et al. Citation2008; Pankow et al. Citation2004; Pazo et al. Citation2016; Singer, Hodgson, and Nazaroff Citation2003; Talhout et al. Citation2011), and a number of studies have shown that smoking is an important determinant of human exposure to styrene in indoor microenvironments. Xie et al. (Citation2003) examined the influence of ETS on concentrations of styrene and other VOCs in a test room. Factor and correlation analyses showed that styrene concentrations correlated “extremely well” with ETS markers. The authors concluded that smoking is an important source of styrene. A variety of indoor air and personal exposure studies have documented the connection between smoking/ETS and styrene exposure in homes and workplaces. The TEAM studies reported significantly higher overnight indoor air styrene concentrations during the fall and winter in homes with smokers (2.2 µg/m3 in homes with smokers vs. 1.1 µg/m3 in non-smoking homes) (Wallace and Pellizzari Citation1986). This difference was not observed during the spring and summer when homes were more open (Wallace and Pellizzari Citation1986). Heavner, Morgan, and Ogden (Citation1995) reported increased personal styrene exposures for non-smoking women living in smoking (mean = 2.11 µg/m3) vs. non-smoking homes (mean = 1.47 µg/m3) in Columbus, Ohio (then described as “one of the most average cities in the country”), although it was not associated with the number of cigarettes smoked or the vapor phase ETS marker 3-ethenylpyridine. The median % of styrene attributable to ETS was 12.6%, ranging from non-detect to 58.1% (Heavner, Morgan, and Ogden Citation1995). In a similar study involving non-smoking women living and working in the greater Philadelphia, Pennsylvania area, styrene concentrations detected using personal air samplers were not significantly different for women married to a smoking spouse and women married to a non-smoking spouse, or in smoking vs. non-smoking workplaces (Heavner, Morgan, and Ogden Citation1996). The authors concluded, based on 3-ethenylpyridine/styrene ratios, that 13.4% of median personal exposure to styrene in the home, and 6.2% of mean personal exposure to styrene in the workplace, were attributable to ETS (Heavner, Morgan, and Ogden Citation1996).
Using 3-ethenylpyridine as a tracer for ETS, Hodgson et al. (Citation1996) found that ETS contributed 20 − 69% of the detected styrene concentrations in designated smoking areas in office buildings. More recently, Chin et al. (Citation2014) characterized styrene concentrations in living rooms and bedrooms of children with asthma living in Detroit, Michigan. Styrene concentrations were significantly higher in homes with ETS (objectively defined using ETS tracers). The authors noted that apparently minor VOC exposure differences due to smoking shown by area sampling are more clearly identified with more precise personal exposure measurements (Chin et al. Citation2014). Similarly, a comprehensive, population-based Canadian indoor air survey conducted in 2009 − 2011 found significantly higher styrene concentrations in smoking vs. non-smoking houses and apartments (Zhu, Wong, and Cakmak Citation2013). Comparable results have been reported in European studies. The EXPOLIS studies conducted in Helsinki, Finland indicated significantly higher personal styrene exposures for ETS-exposed participants (Edwards et al. Citation2001a). Kim, Harrad, and Harrison (Citation2001) reported non-significantly higher styrene concentrations in smoking vs. non-smoking urban homes in Birmingham, United Kingdom (0.8 ± 0.8 μg/m3 in smoking homes vs. 0.7 ± 0.7 μg/m3 in non-smoking homes, a ratio of 1.1). In a subsequent study, ETS increased personal exposure of 12 urban dwellers to styrene by a factor of 2.7 (a significant difference) (Kim, Harrad, and Harrison Citation2002).
Consumer, office, and household products
Styrene was not detected in 281 household products analyzed by EPA researchers in the 1980s (Sack et al. Citation1992). However, the National Library of Medicine Household Products Database indicates that styrene is currently present in a number of arts and crafts products, home maintenance products, and auto products at proportions ranging from “trace” to 20% (National Library of Medicine (NLM) Citation2018) (Table S6). In a study of cleaning products and air fresheners, styrene was detected only in floor cleaner and liquid wax (Nazaroff and Weschler Citation2004). Styrene was detected in 5 samples of household sprays purchased from Korean markets (air freshener, insect repellent, antibacterial spray, hair spray, and humectant) at concentrations ranging from 22 − 32 mg/L. Estimated airborne styrene concentrations associated with product use ranged from 4.3 − 43 µg/m3 (Rahman and Kim Citation2014). In another recent Korean study, styrene was detected in samples of body wash, air freshener, and windshield wiper fluid at proportions ranging from 0.001 − 0.03%, but not in household lubricants, hair sprays, or insecticides (Dinh et al. Citation2015). Evidence linking styrene to household product emissions is limited. In a study of 10 non-smoking Southeast Chicago, Illinois homes conducted in the mid-1990s, styrene emission was associated only with air freshener use (Van Winkle and Scheff Citation2001). Styrene concentrations were elevated in two non-smoking homes after cleaning (0.3 µg/m3 before vs. 1.0 µg/m3 after), but not after painting (Kim, Harrad, and Harrison Citation2001).
Individuals working with office equipment (in both workplaces and homes) may be exposed to styrene emitted from these devices. Malmgren-Hansen et al. (Citation2003) conducted a literature survey of emissions associated with electronic equipment used in Danish homes, including computers, monitors, game consoles, and audio and video systems. Emissions from new electronic equipment decreased significantly after various periods of aging, suggesting that their contribution to concentrations of styrene in indoor air would be transient. Studies conducted in the U.S., Europe, and Taiwan showed that styrene is present in photocopier toners and emitted from photocopy machines and other office equipment, although variability was considerable and airborne concentrations remained below contemporaneous occupational standards and guidelines (Brown Citation1999; Henschel et al. Citation2001; Lee, Lam, and Fai Citation2001; Leovic et al. Citation1996; Mishra et al. Citation2015; Stefaniak et al. Citation2000; Wolkoff et al. Citation1993). [The maximum detected styrene concentration in a U.S. copy center in the late 1990s, 12.8 µg/m3 (Stefaniak et al. Citation2000) is also well below the U.S. EPA’s current (June 2017) Regional Screening Level for industrial air, 4400 µg/m3 (U.S. EPA, Citation2017b)]. Several studies indicated that styrene emissions from photocopiers are higher than those from printers (with emissions from laser printers exceeding those from inkjet printers and multifunctional devices) and computers (CARB, Citation2011; Destaillats et al. Citation2008; Kowalska, Szewczyńska, and Pośniak Citation2015). While emissions from computers decreased with age, those from printers did not (presumably because toner is the primary source) (CARB, Citation2011; Destaillats et al. Citation2008). These results have been corroborated by a recent study identifying sources of chemicals in indoor air of European office buildings in summer and winter (the OFFICAIR project) (Campagnolo et al. Citation2017). In both seasons, styrene was uniquely associated with printer emissions (Campagnolo et al. Citation2017).
Building-related materials
Recognition of the fact that building materials and furnishings can impact indoor air quality through off-gassing of VOCs has prompted investigation of these materials over the past three decades. Styrene is a component of SBR, the most common binding component used in latex carpet backing and multipurpose carpet adhesives. Studies of VOC emissions from furnishing and building materials have reported styrene in carpet glue and other adhesives, rubber and plastic products, rigid foam insulation, carpets, resilient floor coverings, and printed materials (California Environmental Protection Agency (Cal EPA), Citation1999; Hodgson Citation2003; Kataoka et al. Citation2012; Katsoyiannis, Leva, and Kotzias Citation2008; U.S. EPA, Citation1993a; Wallace et al. Citation1987c; Wolkoff Citation1995; Willem and Singer Citation2010; Yu and Crump Citation1998; Zellweger et al. Citation1997). Source attribution studies results generally support these findings. As noted previously, a principal component analysis of VOC sources in the EXPOLIS-Helsinki study showed that styrene levels in residential indoor air were associated with the factor related to carpets, rubber, and adhesives (Edwards et al. Citation2001b).
Styrene concentrations were measured in six experimental “enhanced indoor air quality homes” built using low-emission materials in rural Colorado in 1992 and 1993 (Lindstrom, Proffitt, and Fortune Citation1995). Data were collected over two consecutive 12-h sampling intervals, pre- and post-occupancy, and compared to styrene levels measured in three conventional style homes with attached garages built at the same time. In the pre-occupancy phase, styrene was detected in two of 6 experimental homes at geometric mean levels of 2.94 and 0.77 µg/m3, compared with 18.5 µg/m3 detected in one of three conventional homes. In follow-up measurements made 5 months after occupancy (by non-smokers in all cases), styrene was detected in all six experimental homes at concentrations similar to pre-occupancy levels (0.27–2.9 µg/m3). Although detected in all conventional homes post-occupancy, styrene concentrations were lower after occupation (ranging from 0.37 to 2.38 µg/m3). These results suggest that low levels of styrene emissions from certain materials may be discernible, especially when the materials are new, but that styrene emissions decrease with time.
Consumer use of styrene-derived resins
Exposure to styrene via home use of liquid and paste styrene resins (used mostly for automobile and boat repair) was evaluated in the European Union Risk Assessment Report (RAR) (U.K. HSE, Citation2008) and REACH Annex XV Transitional Dossier (U.K. Competent Authority, Citation2008). Results of these evaluations are summarized in Table S7. The resin pastes typically contain 11–18% styrene, while liquid resins typically contain 30–40% styrene. In the absence of measured exposure data, several modeling approaches were applied. A scenario of filling dented bodywork in a car for 1 h in a closed garage, without gloves, was assumed, with exposure via both dermal and inhalation routes.
The U.K. HSE (Citation2008) selected values of 68 mg styrene (about 1 mg/kg bw) inhaled per event for pastes and 413 mg styrene (about 6 mg/kg bw) inhaled per event for liquids. For dermal exposure, pastes were estimated to contribute 1.7 g styrene per event and liquids 11 g styrene per event. Inhalation and dermal exposures were further considered by the U.K. Competent Authority (Citation2008). Use of resin paste resulted in estimated airborne styrene concentration of 10 ppm, and dermal uptake of 24.3 mg/kg bw (“typical” exposure) to 78.6 mg/kg bw/day (“reasonable worst case” exposure). Use of liquid resin resulted in estimated airborne styrene concentration of 59 ppm, and dermal uptake of 158.6 mg/kg bw. Inhalation doses were calculated assuming a default inhalation rate of 1.3 m3/hour and body weight of 70 kg (U.K. Competent Authority, Citation2008).
It is noted that the comparatively high modeled short-term styrene exposures arising from consumer use of paste and liquid resins are critically dependent upon assumptions made in the use scenarios, and therefore highly uncertain. Given the variability in the predictions depending upon the assumptions made and the absence of actual exposure data, these predictions of exposure and uptake must be treated with caution. These are therefore included here for completeness, but not considered further in the general population exposure characterization.
Styrene concentrations in homes
An important finding of the TEAM studies is that outdoor concentrations of styrene (and several of the other sampled VOCs) are considerably lower than indoor concentrations, which were in turn lower than personal concentrations. Several large-scale investigations in North America conducted in the past 20 years have provided much information about the sources and magnitude of styrene exposure in the general public’s indoor environment, including the National Human Exposure Assessment Survey (NHEXAS) (Gordon et al. Citation1999); the 1999–2000 National Health and Nutrition Examination Survey (NHANES) VOC study (Jia, D’Souza, and Batterman Citation2008; Lin, Egeghy, and Rappaport Citation2008); the School Health Initiative: Environment, Learning, and Disease (SHIELD) study (Adgate et al. Citation2004a, Citation2004b; Sexton et al. Citation2004a, Citation2004b, Citation2000); the Toxics Exposure Assessment Columbia-Harvard (TEACH) study (Kinney et al. Citation2002, Citation2008, Citation2005; Sax et al. Citation2004, Citation2006); the Relationship of Indoor Outdoor and Personal Air (RIOPA) study (Kwon et al. Citation2006; Weisel et al. Citation2005); and Health Canada’s indoor air quality studies (Bari et al. Citation2015; Héroux et al. Citation2008, Citation2010; Health Canada Citation2010a; Citation2010b; Citation2013; Stocco et al. Citation2008; Wheeler et al. Citation2013; Zhu et al. Citation2005; Zhu, Wong, and Cakmak Citation2013).
Dawson and McAlary (Citation2009) combined statistics for several VOCs (not including styrene) from studies of North American residential indoor air (non-smoking) published between 1990 and 2005 by computing the means of the percentiles reported in individual studies, weighted by sample size. Subsequently published studies of non-smoking (Table S8) and smoking (Table S9) residences (predominantly North American) in which sampling duration was 24 h or greater were compiled in a similar manner for this review. Typical styrene concentrations in homes range from 1 to 4 µg/m3. It should be noted that the purposes, sampling strategies, and sample collection and analytical methodologies vary among these studies, and none of them purports to be nationally representative. Nonetheless, these provide a broad picture of styrene concentrations in a variety of settings.
Styrene concentrations in fiber-reinforced polymer (FRP) composites industry facilities
Workplaces where styrene is manufactured or used have the highest airborne concentrations of styrene, with significant variability among types of facilities and processes (Miller, Newhook, and Poole Citation1994). As discussed previously, inhalation is the primary route of exposure in occupational settings. Occupational exposure to styrene might occur during manufacture of the monomer, production of polystyrene or other styrene-based polymers, processing of styrene-based polymers, and manufacture of FRP. In the National Occupational Exposure Survey conducted in 1981–1983, NIOSH estimated that 333,219 workers at 22,000 facilities, 86,908 females, were exposed to styrene, about 30,000 of these on a full-time basis (NIOSH, Citation1990). In 2011, SIRC estimated that 90,000 American workers, employed by approximately 5000 plants across the U.S., participated in the manufacture of styrene products (SIRC, Citation2011). It is apparent that a high proportion of workers in FRP industries is female: over 26% of workers manufacturing plastics products, one-third of the workforce producing rubber products, and 30% of the workers in the resin, and synthetic rubber, and fiber industry are women (U.S. Bureau of Labor Statistics Citation2014), and the FRP industry in Canada has a higher proportion of women workers than any other industry in the manufacturing sector (Dematteo et al. Citation2013).
Styrene and styrene-based polymers or copolymers are generally manufactured using closed processes that limit potential exposure to the monomer (Miller, Newhook, and Poole Citation1994). During processing of thermoplastics, heating of the plastics can release small amounts of styrene (and other hydrocarbons), with amounts emitted dependent upon the types of polymer, processing, and ventilation equipment, as well as process temperatures and residence time (Miller, Newhook, and Poole Citation1994). Exposures to styrene are also reported to be relatively low during the processing of polymers or copolymers, such as styrene-butadiene rubber (IARC, Citation2002; NTP CERHR, Citation2005).
Worker exposures have decreased over the past several decades. Miller, Newhook, and Poole (Citation1994) estimated average worker exposure for all segments of the industry except FRP to be 5 ppm or less in 1994. Ten exposure studies conducted between the 1960s through 1990s in styrene monomer, polymer, and copolymer manufacturing plants (many in the U.S.) reported mean air levels of styrene of ≤35 ppm, with most values below 10 ppm, and higher values generally associated with older studies (Cohen et al. Citation2002; IARC, Citation2002). Occasional peaks of up 50 ppm occurred during filling of drums, occasional bursts, or equipment leaks (IARC, Citation2002; Cohen et al. Citation2002). Sampling data from 5 U.S. styrene-butadiene rubber plants from 1978–1983 (n = 3649) gave an average styrene concentration of 3.53 ppm (about 16,000 µg/m3), with a standard deviation of 14.3 ppm (Matanoski et al. Citation1993). A study of the same facilities by Macaluso et al. (Citation2004) used industrial hygiene data and air dispersion models to estimate changes in time-weighted average (TWA) styrene concentrations associated with typical tasks (Table S10) and job groups (Table S11) since the 1940s. Mean TWA styrene exposures decreased 15–97% by task, and 64–98% by job (Macaluso et al. Citation2004).
The highest occupational styrene exposures occur during the production of FRP, especially large items such as boats, by open molding processes that involve manual application of materials (Cohen et al. Citation2002; Miller, Newhook, and Poole Citation1994; NTP CERHR, Citation2006; Tranfo et al. Citation2012). Trend analyses of styrene exposure data from 60 reports providing data on 24,145 TWA personal air samples from open-mold workers in the European FRP industry showed that the average styrene concentration in the breathing zone decreased on average by 5.3% per year during the period 1966–1990, but only 0.4% in the period 1990–2002 (Van Rooij et al. Citation2008). Mean TWA styrene concentrations in 2003 for all regions ranged from 9.2 to 32.5 ppm (Van Rooij et al. Citation2008). Urinary biomonitoring data showed a steeper decline in styrene exposure (8.9%), perhaps because urine samples were collected in companies that showed a greater decrease of styrene exposure in air (Van Rooij et al. Citation2008). In a recent study of workers in four FRP plants in Italy, median styrene exposures ranged from 5.5 to 21.6 ppm, and molders had the highest exposures (maximum 36.2 ppm) (Bonanni et al. Citation2015).
Summarizing data from four U.S. plants, Lees et al. (Citation2003) reported TWA styrene exposures ranging from 9.2 to 55 ppm without adjusting for respiratory protection (9.2–24 ppm including adjustment). Personal TWA styrene concentrations obtained from FRP workers at 17 U.S. FRP factories from 1996–1999 ranged from non-detect to 142 ppm, and means ranged from 9.2 to 27.3 ppm (Luderer et al. Citation2004). A further evaluation of these data showed that the type of product and job title were important predictors of styrene exposure. The job titles “laminator” and “grinder/sander” were associated with higher exposures, as was the production of RVs (Serdar et al. Citation2006).
The American Composites Manufacturers Association (ACMA) and the National Marine Manufacturers Association (NMMA) sponsored two industrial hygiene surveys in six open-mold composite plants located in the Midwestern United States and California typifying the range of open molding processes in order to characterize relatively highly exposed workers’ time-weighted average styrene exposures in 2001 and 2003 (Lipiro et al. Citation2004). No estimation of exposure with respirator use was presented. Styrene concentrations in 62 8-h TWA samples ranged from 4 to 122 ppm, with a mean of 43.5 ppm and 95% upper confidence limit (UCL) of 48 ppm calculated using EPA’s ProUCL software (U.S. EPA, Citation2016). Data are summarized in Table S12.
ACMA recently provided a summary of employees’ breathing-zone styrene concentrations at 11 FRP/composite manufacturing facilities, of which five use open-mold processes (one through 5), three are compression molding facilities (6 through 8), and 3 others use the pultrusion operation (ACMA, Citation2018). Both compression molding and pultrusion are closed processes with a lower potential for worker exposures, and generally do not require respiratory protection. As noted previously, processes in the open molding facilities associated with higher styrene exposures are gelcoat and lamination. In these operations, styrene-containing gelcoats and resins are applied to an open mold by mechanical atomized (gelcoat spray), mechanical nonatomized resin, or manual (bucket and brush) application. Because some workers in open processes use respiratory protection, breathing zone samples do not represent actual inhalation exposures. Therefore, the OSHA-recommended 10-fold Assigned Protection Factor for a half-mask organic vapor cartridge was applied to estimate the actual inhalation exposures for workers wearing respirators in plants one through five (ACMA, Citation2018) (Table S13). Figure S6 is a box and whisker plot displaying range, mean, median, and quartile 8-h TWA styrene concentrations for these conditions. Average 8-h TWA styrene concentrations in the three pultrusion plants (the only data given in the ACMA report) ranged from 7.8 to 29.5 ppm (ACMA, Citation2018).
Conservative estimates of central tendency (95% UCL) and upper-bound (95th percentile) 8-h TWA styrene exposures in the U.S. FRP industry were developed for closed-mold and open-mold plants with and without respiratory protection based on the most recent data provided by ACMA (Citation2018). The averages provided for the three pultrusion plants were added to the individual measurements for plants six through eight for the closed process exposure estimates. Central tendency estimates ranged from 4.3 to 29.9 ppm (19,000–129,000 µg/m3), and upper-bound estimates ranged from 7.3 to 61.5 ppm (32,000–266,000 µg/m3) (Table S14).
In order to evaluate the incidence exceedances of occupational styrene exposures in the U.S., NIOSH Health Hazard Evaluations (HHE) published between 2002–2018 were searched. Only two evaluations in which styrene was measured were identified (Table S15) (NIOSH, Citation2006, Citation2016). In both cases, some employees’ styrene exposures exceeded occupational guidelines, and measures to reduce exposure were recommended.
Personal air
An important finding from the TEAM and subsequent individual-based exposure studies mentioned previously was that for styrene and several other VOCs, personal air concentrations (measured with devices placed as close as possible to a subject’s breathing zone) typically exceed not only outdoor but also indoor air concentrations. Thus, area measurements typically underestimate individuals’ exposures to styrene and other common VOCs. Although microenvironmental studies may provide useful information regarding styrene exposure levels and sources, it is virtually impossible to identify and measure concentrations and account for time spent in all potentially important microenvironments. Sampling of personal air concentrations in an individual’s breathing zone throughout daily activities provides an accurate estimate of inhalation exposures because exposure concentrations in all areas are inherently time- and activity-integrated (Harrison et al. Citation2009; Steinle, Reis, and Sabel Citation2013; Weisel et al. Citation2005). Therefore, personal air concentrations are considered the most accurate basis for evaluating inhalation exposure to styrene for the general public.
Published summary statistics from available studies measuring styrene concentrations in adults and children’s personal air from 1999–2007 are summarized in Table S16 and Table S17, respectively. Sample-size-weighted means of the percentiles reported in individual studies were computed as previously described for indoor air data. Overall, adult and children’s exposures appear very similar and encompass only a small range. The only multi-city North American study to collect paired child and adult personal samples is RIOPA, performed in 1999–2001. Personal air samples were collected for both adults (n = 309) and cohabiting children (aged 7 to 19 years, n = 188). Paired personal styrene exposure concentrations for adults and children in each city were not significantly different (Weisel et al. Citation2005), indicating that children’s characteristics and behavior did not result in greater personal air concentrations than adults experienced. This finding is supporting by the results of a smaller study conducted in Baltimore, Maryland (2000 to 2001) that demonstrated close correlation of personal styrene exposure concentrations of non-smoking adults and children (Buckley et al. Citation2005). Therefore, it is reasonable to use personal air concentrations identified for adults to characterize children’s exposures. The median and 90th percentile of sample size-weighted summary statistics for adult personal air concentrations, 0.8 and 2.4 µg/m3, respectively (), are considered appropriate estimates for the general U.S. population of all ages at this time.
Table 9. Age-group-specific central tendency and upper-bound personal styrene exposure concentrations in air in non-smoking and smoking residences (µg/m3).
Current U.S. EPA guidance for inhalation risk assessment recommends that potential inhalation hazards and risks should be computed based on exposure concentrations rather than estimated intakes, and states that no adjustment of exposure concentrations is necessary for children other than activity-weighting (U.S. EPA, Citation2009). However, it is well known that children (especially infants) can receive higher internal doses of inhaled substances, including styrene, compared to adults in the same environment due to their higher respiratory rates and immature metabolic capability (Abraham et al. Citation2005; Ginsberg et al. Citation2010; Sarangapani et al. Citation2003; Valcke and Krishnan Citation2011). To account for differences in dosimetry, Ginsberg et al. suggested application of a generic “children’s inhalation adjustments” (CIAs) of three-fold for the first three years and 1.5-fold for the next seven years to account for young children’s greater exposures within the current EPA inhalation risk assessment paradigm. Using a combined respiratory tract/systemic PBPK model to simulate the inhalation dosimetry of 1 ppm styrene (about 4350 µg/m3), Sarangapani et al. (Citation2003) showed that the styrene concentration in young infants’ blood is almost twice as high as that in a young adult, with no significant difference between males and females. Abraham et al. observed a similar age-dependent difference in modeled blood styrene concentrations at 1 ppm (Abraham et al. Citation2005). This difference decreased with age, and was no longer evident after age 5 in Sarangapani et al. (Citation2003) model. Based upon these results, a reasonable CIA for styrene is 2 for the first three years of life, with no adjustment for older children.
As discussed previously, cigarette smoke is a significant source of exposure to styrene. The few studies comparing concentrations in smoking vs. non-smoking homes indicated elevations of about 1.2-fold on average (). The difference in personal air concentrations between people exposed and not exposed to ETS in the Helsinki, Finland EXPOLIS study was significant, and of similar magnitude (1.1–1.2) (Edwards et al. Citation2001a). Based on these observations, the central tendency and upper-bound personal air concentrations are multiplied by an adjustment factor of 1.2 representing the impact of ETS on styrene exposure. Not surprisingly, biomonitoring data indicate that active smokers experience relative exposures of greater magnitude. Ratios of summary statistics for styrene concentrations in the blood of smokers vs. non-smokers range from 1.2 to 4.2 with the more recent central-tendency statistics averaging 2.7. Therefore, a factor of 2.7 is used to represent the increased styrene exposure to active smokers, assumed in this assessment to be people over age 16. Age group-specific central tendency estimates of personal styrene exposure concentrations ranged from 0.8 to 2.2 µg/m3, and upper-bound estimates ranged from 2.4 to 6.5 µg/m3 ().
Potable water
Styrene is very rarely detected in multiple national surveys of potable groundwater and surface water resources, and rarely at concentrations exceeding or even approaching the Maximum Contaminant Level (MCL) of 0.1 mg/L (Carter, Lapham, and Zogorski Citation2008; Grady Citation2003; Hopple, Delzer, and Kingsbury Citation2009; Kingsbury, Delzer, and Hopple Citation2008; Morrow Citation1999, Citation2003; Citation2010; Moran et al. Citation2002; Rowe et al. Citation2007; U.S. EPA, Citation1999; Zogorski et al. Citation2006). There were only 171 detects of styrene out of 285,131 samples from 2010–2015 in a tap water database assembled by the Environmental Working Group (0.06% detection rate) (EWG, Citation2017). There were no exceedances of the MCL, and the maximum detected concentration was 0.00315 mg/L (EWG, Citation2017).
These data indicate that although localized contamination might occur in connection with specific sources, the general population is not regularly exposed to measurable levels of styrene in drinking water. Therefore, exposures by way of potable water are considered negligible and are not considered quantitatively in this exposure assessment.
Styrene levels in the diet
Styrene appears to occur naturally in many foods and beverages, although it is not clear in some cases whether it is formed endogenously or if its presence is the result of partitioning from the environment (including both air and polystyrene food contact materials) (Cao, Sparling, and Dabeka Citation2016; Cao et al. Citation2018; Jickells et al. Citation1993, Citation1992; Lickly, Breder, and Rainey Citation1995; Miller, Newhook, and Poole Citation1994; Steele et al. Citation1994; Tang, Hemm, and Eisenbrand Citation2000).
Food studies
Styrene is commonly detected at low concentrations in both raw agricultural commodities and processed foods. Cinnamon which contains styrene concentrations as high as 40 mg/kg represents an exceptional case because styrene is the product of oxidation of its major flavoring compound, cinnamaldehyde (Fragnière et al. Citation2003; Lafeuille et al. Citation2009; Steele et al. Citation1994). Styrene was present in fresh samples of bark, wood, and leaves from a cinnamon tree, indicating that it is a natural constituent arising from plant metabolism (Fragnière et al. Citation2003).
Styrene was detected in samples of wheat, oats, peanuts, pecans, coffee beans, peaches strawberries, cinnamon, and beef collected in a manner that avoided contact with styrene or any type of plastic, with highest concentrations in cinnamon (169–39,200 µg/kg) (Steele et al. Citation1994). No detectable styrene was found in tomatoes, milk, or chicken (Steele et al. Citation1994). In a review of styrene levels in foods, Tang, Hemm, and Eisenbrand (Citation2000) reported that low concentrations of styrene have been found in fruits and fruit products, vegetables, cooked meat, mussels, eggs, milk, cheese (especially moldy cheeses produced by certain microorganisms), honey, olives and olive oil, coffee, wine, and beer (Tang, Hemm, and Eisenbrand Citation2000). The styrene concentration in milled olive pulp increased significantly during storage at ambient temperature, but did not change significantly when stored in the refrigerator, suggesting that styrene in olives is a product of metabolism (Biedermann, Grob, and Morchio Citation1995). Styrene is formed by the thermal decarboxylation of cinnamic acid during wort boiling or by enzymatic decarboxylation during fermentation of wheat beer, which can contain concentrations up to 25 µg/L (Schwarz, Boitz, and Methner Citation2012). Use of specialized yeast strains might reduce styrene concentrations in wheat beer without loss of desired aroma (Langos, Gastl, and Granvogl Citation2017; Langos and Granvogl Citation2016).
The Total Diet Study (TDS), or Market Basket Study, is an ongoing FDA program that determines levels of various nutrients and chemicals (including styrene) in table-ready (e.g., items purchased from a grocery store and prepared for consumption as they would be in a domestic kitchen) foods representing the major components of the U.S. diet (U.S. FDA, Citation2016). In datasets collected from 1996–2000, styrene concentrations in foods that had at least one VOC present at a concentration of at least 100 μg/kg ranged from 2 to 550 µg/kg (in raw avocado) (Fleming-Jones and Smith Citation2003). Analytical results for 2003 are presented in Table S18; styrene was not an analyte in the datasets collected after 2003. Of 186 samples in the 2003 survey, more than half (96) were labeled “trace,” indicating a concentration greater than or equal to the limit of detection but less than the limit of quantitation. This suggests that less than half of the food items consumed in the U.S. contained detectable levels of styrene in 2003. In a study comparing analytical methods for VOCs in samples of infant formula, canned tuna, peanut butter, and non-carbonated orange beverage, Nyman et al. (Citation2014) measured styrene only in tuna (about 0.35 µg/kg) and peanut butter (about 7 µg/kg) (Nyman et al. Citation2014). In a Belgian study of VOC concentrations in 377 foods obtained from supermarkets, styrene was detected in 31% of samples, and in all food categories except fresh eggs (Vinci et al. Citation2015). Only maximum concentrations were presented in the publication; the concentrations ranged from 0.4 µg/kg in “sauces” – 111.2 µg/kg in an olive-based “dip and tapenade” packed in a plastic container (Vinci et al. Citation2015).
Most informative with respect to current total dietary exposure in the U.S. are recent results from the Canadian Total Diet Study (Cao, Sparling, and Dabeka Citation2016; Cao et al. Citation2018). In food samples collected from four stores in Vancouver, Canada in 2007, styrene was detected in 133 of 153 different total diet composite food samples (87%). In food samples collected from four stores in Winnipeg, Canada in 2014, styrene was detected in 125 of 159 different total diet composite food samples (79%). Summary statistics for the food samples collected in 2014 are presented in Table S19. The high concentration of styrene in the composite sample of herbs and spices is attributed to the naturally high concentrations of styrene in cinnamon. In a recent updated evaluation of styrene migration from polystyrene food contact materials, Genualdi, Nyman, and Begley (Citation2014) measured styrene concentrations in wrapped food products and chewing gum (which contains styrene-butadiene as a gum base). The generally similar styrene concentrations reported by Cao, Sparling, and Dabeka (Citation2016) in similar food items are provided for comparison in Table S20.
Migration of styrene from food-contact materials
Polystyrene containers are used as packaging for numerous foods and food products, egg cartons, water, milk, oils, hot and cold beverages, dairy products, desserts, and meat products. Thus, the conditions of use of polystyrene food packaging plastics range from low temperatures (refrigeration) for periods of days or weeks (for example, dairy and meat products) to elevated temperatures for short periods of time, for example vending cups. Major categories of polystyrene food packaging materials are general purpose polystyrene (GPPS), high impact polystyrene (HIPS), polystyrene foam (PS), and expandable polystyrene foam (EPS) (American Chemistry Council Plastics Foodservice Packaging Group FDA Task Force, Citation2015; Lickly, Breder, and Rainey Citation1995). During the production process, styrene can become occluded in polystyrene products. It may occur and be released into the atmosphere from polystyrene both as an unchanged monomer and as a polymer degradation product when exposed to high temperatures (Marc and Zabiegala Citation2017).
Styrene in food packaging materials may volatilize and be inhaled by the consumer, or leach into foods and be ingested. Migration of styrene from styrenic (and other) food-contact materials is a recognized means of substance entry into packaged foods and the subject of national and international regulation (Arvanitoyannis and Bosnea Citation2004; Begley et al. Citation2005; Genualdi, Nyman, and Begley Citation2014; Marc and Zabiegala Citation2017). FDA regulates the amount of styrene allowed in food grade polystyrene at 1% by weight (10,000 mg/kg) for contact with non-fatty foods and at 0.5% by weight (5000 mg/kg) for contact with fatty foods (U.S. FDA, Citation2017). Under the same regulation, rubber-modified polystyrene basic polymers may not exceed 0.5% by weight of total residual styrene. Measured styrene concentrations in packaging materials and disposables purchased in the Washington, D.C. area (Genualdi, Nyman, and Begley Citation2014) are summarized in Table S21; residual styrene levels in products provided by seven resin supplier companies in 2012 are presented in Table S22.
Migration in most cases obeys Fick’s laws of diffusion, and may be strongly influenced by the interaction of food components with the packaging material. Major factors affecting styrene migration into food are diffusion within the polymer, solvation and the polymer–food interface, and dispersion into the food. These processes are in turn influenced by polymer type, exposure time, temperature and food composition (especially fat content) (Bhunia et al. Citation2013; Khaksar and Ghazi-Khansari Citation2009; Lau and Wong Citation2000; Sanagi et al. Citation2008; Tawfik and BaAbdullah Citation2014; Tehrany and Desobry Citation2004; Till et al. Citation1982; Wu et al. Citation2010). Both styrene content and migration into isooctane were greater in recycled expanded than virgin polystyrene containers (Lin et al. Citation2017).
Styrene concentrations ranged from 16 µg/L to almost 30 µg/L in three brands of bottled water bought in Saudi Arabia, with concentrations increasing four- to five-fold over 8 months of storage (Ahmad and Bajahlan Citation2007). However, only “negligible” concentrations (<0.1 µg/L) of styrene were identified in bottled waters purchased in Missouri (Ikem Citation2010). Similarly, styrene was below the detection limit (<0.025 µg/L) in samples of “natural spring” waters (presumed to be bottled) purchased in Canada (Cao, Sparling, and Dabeka Citation2016; Cao et al. Citation2018). Therefore, it does not appear that bottled water is likely to be a significant source of styrene exposure in the U.S.
Melski, Zabielski, and Kubera (Citation2003) evaluated three styrenic objects commonly used for food packaging. Refrigerated food contact was simulated by placing a piece of the material in a sealed vial with acidic, alcoholic, and fatty food simulants. The calculated migration reference values for styrene were approximately 5, 22, and 81 mg/dm2 in ethanol, acetic acid, and olive oil, respectively (Melski, Zabielski, and Kubera Citation2003). Studies with dairy products have consistently shown the importance of fat content in influencing solvation and dispersion of VOCs (Ehret-Henry et al. Citation1994; López et al. Citation2008; Tawfik and BaAbdullah Citation2014). Fat content and storage temperature significantly increased the migration of styrene from polystyrene packaging into dairy products (Tawfik and BaAbdullah Citation2014). Higher styrene concentrations occurred in whole vs. skimmed milk powder heated in containers made of polycarbonate, polypropylene random, polypropylene copolymer and polypropylene 20% talcum powder, and styrene-acrylonitrile (Tawfik and BaAbdullah Citation2014). By far the highest styrene concentrations were observed in styrene-acrylonitrile containers (Tawfik and BaAbdullah Citation2014). Similarly, migration of styrene from GPPS and HIPS cups into hot beverages was highly dependent on temperature and fat content, with the highest level of migration into hot cocoa made with milk (Khaksar and Ghazi-Khansari Citation2009). GPPS showed higher migration than HIPS (Khaksar and Ghazi-Khansari Citation2009).
Styrene migration into potato or beef cooked conventionally in thermoset polyester dishes containing 9000 µg/kg or 380,000 µg/kg styrene was related but not proportional to the dishes’ styrene content, differing by factors of 1–3 for potatoes and 2–6 for beef (Jickells et al. Citation1993). Pork belly was cooked in a conventional oven in thermoset polyester containing 50 to 1400 mg/kg styrene (Gramshaw and Vandenburg Citation1995). The fat content of the meat was not reported, but the authors remarked that fat content was high, and may therefore be a more aggressive extractant than typically consumed meats. Styrene migration ranged from 0.42 to 148 µg/dm2 plastic following first use, and from 0.95 to 188 µg/dm2 plastic on second and third uses. Concentrations of styrene in the cooked meat ranged from 6–1200 μg/kg on first use, and increased to 11–2,400 μg/kg on subsequent uses. The authors speculated these increases might be due to differing weight losses in the meats being cooked, and less rigorous sealing of the dish in the first compared to later trials, although breakdown of the polymer with release of monomers was not ruled out. Leaving the dish uncovered resulted in lower migration rates and concentrations in the meat, presumably due to volatilization into the oven (Gramshaw and Vandenburg Citation1995).
Migration of residual VOCs from microwaved styrenic materials has been recognized as a potential pathway for styrene exposure. Jickells et al. (Citation1992) observed that any influence of microwave energy on migration in excess of thermal influence is small, but the authors did not test styrene. Melski, Zabielski, and Kubera (Citation2003) examined the effect of microwaving on global migration of volatiles from styrenic components into food simulant solutions representing acidic, alcoholic, and fatty foods. Compared with migration of total VOCs after 10 days of cold storage, microwaving increased migration from all materials ranging from a minimum of less than 150% of reference migration to a maximum of about 425%. As the migrant compounds were not distinguished, the contribution of styrene to these results could not be determined.
Marc and Zabiegala (Citation2017) observed significantly greater styrene release from polystyrene coffee to-go lids heated at 80°C (1000–5300 µg/kg) than 40°C (300–1000 µg/kg). Wittrig (Citation2002) evaluated VOC emissions from four materials comprising a single-serving microwavable bowl: an inner bowl containing the food item, a plastic lid, a printed shrink-wrapped label sampled at the seam, and the label sampled without the seam. The highest levels of styrene derived from the label sampled at the seam; the lid emitted trace amounts, and the bowl no significant levels (Wittrig Citation2002). Nerín et al. (Citation2002) heated microwave-safe plastic containers made of polycarbonate, polypropylene random, polypropylene copolymer and polypropylene 20% talcum powder, and styrene-acrylonitrile to 100°C and measured volatile compounds released. Styrene was detected in all container types evaluated, and was released upon heating from all but styrene-acrylonitrile. The amounts of styrene released as vapor ranged from 1.01 to 1.78 μg/kg plastic. Assuming that migration to food is 100%, and accounting for the weight to surface ratio of each container, the projected concentrations of styrene in heated foods were 0.11–0.2 μg/kg (Nerin, Acosta, and Rubio Citation2002). Nerín and Acosta (Citation2002) also studied the behavior of solid food simulants, Tenax® and Porapak®, in contact with styrene-acrylonitrile and other plastics used in microwave ovens. Food concentrations of styrene ranged from 0.0018 to 0.0066 μg/kg for Tenax® and from 0.0098 to 0.67 μg/kg for Porapak®.
Migration from plastic toys
Widely used polymers such as polystyrene and acrylonitrile-butadiene-styrene contain residual amounts of styrene from the production process, and may also release styrene as a result of product degradation. These polymers are used not only in food packaging materials, but also in children toys. Greatest exposures would occur from toys that are mouthed by young children. For this analysis, two highly conservative simplifying assumptions were made: (1) all mouthed toys are brand-new and made of acrylonitrile-butadiene-styrene; and (2) the styrene migration rate does not decrease with time (i.e., mass balance is ignored). In order to estimate potential transfer of styrene from toys made of styrene-containing polymers, a simple model based on Fick’s diffusion theory was used. When equilibrium partitioning has little effect, Fick’s diffusion theory equation reduces to:
where:
| Mt = | = | cumulative mass migration of styrene over time (µg/cm2) |
| Cp0 = | = | initial residual styrene level in polymer x polymer density (µg/cm3) |
| Dp = | = | diffusion coefficient of styrene in the polymer (cm2/sec) |
| t = | = | time over which mass release is calculated (seconds) |
Residual concentrations of styrene recently measured in new toys made from acrylonitrile-butadiene-styrene (purchased in Japan) ranged from 71 to 2600 mg/kg, with a mean of 928 mg/kg (Abe et al. Citation2013). With an assumed density of 1 gm/cm3, the estimated mean initial residual styrene concentration is 928 μg/cm3. Lv et al. (Citation2015) used data from a simulated saliva model system to calculate a diffusion coefficient for styrene in acrylonitrile-butadiene-styrene toys of 5.5752 × 10⁻¹⁴ cm2/second.
The hourly styrene migration rate was then calculated as change in Mt over 1 h for a brand-new toy (1-h old):
where:
| DMR. = | = | hourly migration rate of styrene from a new toy (µg/cm2-h) |
| Mt = | = | cumulative mass migration of styrene at designated time (µg/cm2) |
| Cp0 = | = | 928 μg/cm3 (Abe et al. Citation2013) |
| Dp = | = | 5.58E-14 cm2/sec (Lv et al. Citation2015) |
| t1 hour = | = | 3,600 seconds |
| t2 hours = | = | 7,200 seconds |
Styrene levels in human tissues
Styrene typically has a short half-life in the human body, but its widespread presence in the environment is a source of continuous exposure to the general population. Thus, styrene, along with other common VOCs (and their metabolites), are frequently detected in human tissues, including breath, blood, urine, and milk. The results of biomonitoring studies provide insight into not only typical styrene levels in human tissues but also important sources of exposure.
Biomonitoring data are considered the “gold standard” for accurate evaluation of chemical exposures, requiring no environmental measurements or modeling assumptions to establish internal dose (NRC, Citation2006; Sexton et al. Citation2006; Sexton, Needham, and Pirkle Citation2004c). Styrene is well absorbed by oral and inhalation exposure routes, rapidly distributed throughout the body, and eliminated with an overall half-life of less than a day (Ramsey et al. Citation1980). However, because styrene is ubiquitous, and human exposure to it is continuous, biomonitoring data from blood and urine may provide a reasonable dosimeter under consistent exposure regimes in daily life (Aylward et al. Citation2010, Citation2013; Kirman et al. Citation2012).
General population
Blood
Members of the general population with no occupational exposure to styrene, including children, may have levels of styrene in blood in the parts-per-trillion range. Nationally representative U.S. and Canadian data are summarized in Table S23. Participants in the U.S. Centers for Disease Control and Prevention’s (CDC’s) National Health and Nutrition Examination Survey (NHANES) are selected to be nationally representative using a stratified, multistage, probability-based sampling design. Adults aged 20–59 years were sampled for cohorts between 1988 and 2004, and younger (12–19 years) and older (>60 years) groups were added in 2005–2006 and after (CDC, Citation2019). According to the CDC’s National Biomonitoring Program Styrene Factsheet, measurable levels of styrene were found in less than half of the participants (CDC, Citation2017). Fiftieth percentile results for the total population and most subgroups were below the limit of detection. An upper-bound estimate (90th percentile) for the general population is around 0.1 µg/L (Table S23).
Evaluating trends in cotinine-adjusted NHANES data from 1988–1991 vs. 1990–2000, Su, Mukherjee, and Batterman (Citation2011) observed no significant decrease in styrene concentrations in blood per year. However, annual reductions of 8.2–12.3% (depending on the quantile) occurred between 1999–2000 and 2003–2004 data sets. Styrene concentrations in the 2005–2006, 2007–2008, and 2009–2010 NHANES datasets not included in Su, Mukherjee, and Batterman (Citation2011) analysis are similar to those from 2003–2004, suggesting no further decrease in that time period (CDC, Citation2019). Styrene concentrations in blood samples from the 12- to 19-year-old group also declined in the two rounds for which they were measured.
As expected, elevated styrene concentrations in blood and other tissues is associated with smoking. In the TEAM studies, styrene concentrations were 2–19-fold higher in exhaled breath of smokers vs. non-smokers in five U.S. cities, with a strong exposure–dose relationship between number of cigarettes smoked per day and breath VOC levels (Wallace et al. Citation1987a). Smokers were estimated to receive approximately 1.8 μg styrene per cigarette (Wallace et al. Citation1987a). Median whole blood concentrations of styrene were approximately fourfold higher in smokers than non-smokers among a group of people participating in an ATSDR health and exposure investigation (Ashley et al. Citation1995). In an evaluation of data from NHANES III, a marked association was noted between lifetime pack-years of cigarettes smoked and styrene in blood (Churchill, Ashley, and Kaye Citation2001). Participants who drank more than 20 ml alcohol daily were also significantly more likely to have elevated levels of styrene in their blood than those who drank less, perhaps due to the typical co-location of smoking and drinking activities, i.e., in bars and nightclubs (Churchill, Ashley, and Kaye Citation2001).
Styrene concentrations in the blood and smokers vs. non-smokers from NHANES and other studies are presented in Table S24. In the NHANES 2003–2004 dataset, geometric mean and median styrene concentrations were below the detection limit (0.03 ng/ml) in non-smokers; at the 95th percentile, smoking was associated with a more than twofold rise (Chambers et al. Citation2011). Chambers et al. (Citation2011) determined that cigarette smoke exposure was a “primary” source of blood styrene in this dataset as determined by (1) differences in central tendency and interquartile VOC blood levels between smokers and non-smokers, (2) correlation between styrene and smoking biomarker (2,5-dimethylfuran) concentrations in the blood of daily smokers, and (3) regression modeling of styrene blood levels versus categorized cigarette consumption rate. Similar results were reported for subsequent NHANES data sets (Doherty et al. Citation2017; Jain Citation2016, Citation2017). Blood styrene concentrations were also higher among smoking participants in the Gulf Long-Term Follow-up Study (GuLF STUDY) (a prospective cohort study of individuals who participated in the Deepwater Horizon oil spill cleanup) than in combined NHANES 2005–2008 datasets, even after adjustment for blood 2,5-DMF (Doherty et al. Citation2017). Ratios of styrene concentrations in smokers vs. non-smokers in these studies range from 1.2 to 4.2. Spending more than 10 min in the presence of a smoker was associated with a 12% elevation in blood styrene (Jain Citation2017). The average of central tendency ratios from the more recent studies, 2.7, is considered a reasonable approximation of the contribution of smoking to blood styrene levels in the general population.
Urine
Styrene and its metabolites mandelic acid (MA) and phenylglyoxylic acid (PGA) in urine are also used for exposure biomonitoring, and the sum of these metabolites strongly correlates with airborne concentrations (discussed further below). However, MA and PGA are considered nonspecific biomarkers, as these are metabolites of ethylbenzene and other structurally similar chemicals (ACGIH, Citation2015). Results for creatinine-normalized MA and PGA from the NHANES 2011–2012 survey are summarized in Table S25 (CDC, Citation2019). A comparison of MA and PGA urinary levels in smokers vs. non-smokers in NHANES 2005–2006 and NHANES 2011–2012 indicated significantly higher levels of both metabolites in smokers (Capella et al. Citation2019) (Table S26). The fact that urinary concentrations of MA and PGA rose with age was suggested to be due to decreasing lean body mass. Finally, smoking was positively associated with urinary MA in pregnant women surveyed in the National Children’s Vanguard Study (Boyle et al. Citation2016).
FRP industry workers
Blood
Occupational exposures to styrene result in blood concentrations higher than those experienced by the general population (Brugnone et al. Citation1993). As discussed above, the highest occupational styrene exposures occur during the production of FRP. Almost 40 years ago, female workers exposed to averaged styrene concentrations of 50 to over 150 ppm during hand lay-up operations in a fiberglass boat manufacturing plant had end-of-shift blood concentrations of 200 to 1,220 µg/L, depending upon the type of protective equipment used (Brooks et al. Citation1980). End-of-shift blood samples collected from workers at 17 U.S. FRP factories between 1996 and 1999 were lower, ranging from 90 to 330 µg/L (depending on task and respirator use), and were markedly correlated with concentrations in personal air samples (Luderer et al. Citation2004; Serdar et al. Citation2006). Mean blood and personal air styrene concentrations in female workers in this study were 130 µg/L and 11.5 ppm, respectively, while values for male workers were twice as high (270 µg/L and 20.5 ppm, respectively).
Urine
Measurement of the styrene metabolites MA and PGA have long been used as biological indices of occupational exposure. The American Conference of Governmental Industrial Hygienists’ (ACGIH’s) recommended Biological Exposure Indices (BEI) for styrene are 400 mg MA + PGA per gram creatinine and 40 µg styrene/L urine (ACGIH, Citation2015). These BEIs are based upon associations with air concentrations of styrene at the current time-weighted average Threshold Limit Value of 20 ppm, established to minimize neurological effects (ACGIH, Citation2015). The ACGIH BEI for MA + PGA may be conservative, as a recent study conducted for the purpose of establishing an appropriate BEI for the Republic of Korea found that a urinary concentration of 600 mg MA + PGA/g creatinine corresponded to the TLV of 20 ppm (Choi et al. Citation2019).
Persoons et al. (Citation2018) recently evaluated MA and PGA concentrations in urine samples from French workers in various industrial sectors (FRP manufacture, thermoplastic polymers production, vehicle repair shops and cured-in-place pipe lining (CIPP) (Table S27)). The highest concentrations of urinary MA+PGA were detected in FRP and CIPP sectors, with lower exposures in thermoplastic injection and vehicle repair shop workers. The only sector in which any samples exceeded the ACGIH BEI was FRP manufacture. Major factors influencing end-of-week MA+PGA concentrations were levels at the beginning of week, open molding processes, proximity to the emission source, use of respiratory protection, and styrene content in raw materials.
Styrene exposure estimation
Exposure scenarios
Based on its physicochemical characteristics and behavior in the environment, the most likely route of human exposure to styrene is inhalation. Widespread human exposure might also occur via ingestion of food items in which styrene is a natural constituent or has migrated from food contact materials. The following receptor populations and exposure pathways were therefore selected for evaluation:
General population
Inhalation
Food
Mouthing of styrenic toys (young children)
Workers engaged in styrene manufacture
Workplace inhalation
Breastfed infants
General population
Occupationally exposed mothers
Potentially complete exposure pathways evaluated for these groups are summarized in .
Table 10. Exposure pathways examined for representative receptor populations.
Because of its volatility, styrene is not expected to be introduced into workers homes via contaminated clothing. Therefore, exposures for plastics workers and their children are limited to direct inhalation while at work and partitioning to mother’s milk, respectively. Both dietary intake and inhalation of background styrene concentrations are not considered for plastics workers, because it is assumed that their contributions would be small in comparison with workplace exposure. As discussed above, while groundwater and surface water resources can be affected by localized spills and other releases containing styrene, available data consistently indicate low detection frequency and concentrations in both groundwater and surface water used for drinking. Therefore, intake by way of potable water is thought to be negligible and not considered in this exposure assessment.
Inhalation
The representative central tendencyFootnote4 and upper-boundFootnote5 styrene concentrations in FRP industry workplaces and personal air for the general population are suitable for direct comparison with appropriate inhalation toxicological criteria, in accordance with current U.S. EPA guidance (U.S. EPA, Citation2009). In order to estimate the relative contribution of the inhalation route to overall exposure, daily doses were calculated from representative concentrations using age-specific inhalation rates and body weights (U.S. EPA, Citation2011) and a pulmonary absorption fraction of 0.65 (CalEPA, Citation2010). The CIA of 2 for young children was not applied in this exercise because it includes age-related differences in inhalation rate per unit body weight (thereby potentially introducing redundant adjustment). For the general population, central tendency styrene intakes via inhalation ranged from about 1E-04 – 5E-04 mg/kg bw/day, and upper-bound intakes ranged from about 3E-04 – 1E-03 mg/kg bw/day (). FRP industry workers daily intakes were time-averaged over a year assuming 8 h of exposure daily for 250 days of the year. Workers central tendency styrene intakes via inhalation ranged from approximately 0.6–4 mg/kg bw/day, and upper-bound intakes ranged from about 1–8 mg/kg bw/day ().
Table 11. Styrene intakes via inhalation (mg/kg bw-day).
Total dietary intake
Dietary intakes of styrene have been estimated based upon: (1) measured concentrations in foods, and consumption rates of these foods; (2) modeling based on the “consumption factor and food-type distribution factors” published by the FDA (FDA, Citation2007); and (3) kinetic modeling of styrene migration from food-contact materials (based on styrene concentration in the material and material-specific partition and diffusion coefficients). Based upon intake rates of major foods packed in direct contact with styrenic packaging materials together with mean and maximum levels of styrene in each food, the U.K. Ministry of Agriculture, Fisheries and Food estimated that the average and maximum likely intakes per capita of styrene derived from the average U.K. diet are approximately 1 µg/day and 4 µg/day, respectively (17–67 ng/kg-day for a generic 60-kg adult) (U.K. Ministry of Agriculture, Fisheries, and Food Citation1983). Assuming a dietary styrene concentration from polystyrene food contact materials of 3 µg/kg and a food consumption rate of 3 kg per day, Lickly et al. estimated a daily styrene intake of 9 µg/day (about 0.13 µg/kg bw/day for a generic 70-kg adult) (Lickly, Breder, and Rainey Citation1995). Tang, Hemm, and Eisenbrand (Citation2000) estimated an annual average dietary styrene intake for the general German population of 0.8–4.5 mg/person-year (2–12 µg/person-day) (Tang, Hemm, and Eisenbrand Citation2000). Applying the FDA consumption factor (the ratio of the weight of food contacting a specific packaging material to the weight of all food packaged) of 10% reduces intake by a factor of 10 to 0.2–1.2 µg/person-day (3–17.6 ng/kg-day for a generic 70-kg adult) (Tang, Hemm, and Eisenbrand Citation2000). More recently, updated and expanded polystyrene consumption factors were developed and applied to estimate a dietary styrene concentration attributable to food packaging of 2.2 µg/kg (American Chemistry Council Plastics Foodservice Packaging Group FDA Task Force, Citation2015). Assuming (per Lickly) a food consumption rate of 3 kg per day, this concentration would result in a daily styrene intake attributable to packaging of 6.6 µg (about 0.085 µg/kg bw/day for a generic 80-kg U.S. adult).
In a Total Diet Study conducted by the U.K. Food Standards Agency, average consumption rates of 20 main food groups were multiplied by the mean level of styrene in each group, yielding a range of average dietary exposure for a generic 60-kg individual of 30–50 ng/kg bw/day (Food Standards Agency Citation1999). Data are also cited in the European Union Risk Assessment Report (U.K. HSE, Citation2008). Holmes et al. (Citation2005) used these concentration data to perform a probabilistic analysis of the range of exposures to the U.K. general public to styrene due to migration from packaging materials (Holmes et al. Citation2005). The median exposure for adults was very similar (39 ng/kg bw/day). Median exposures for youths (48 ng/kg bw/day) and seniors (35 ng/kg bw/day) were also presented (Holmes et al. Citation2005).
Duffey and Gibney (Citation2007) used data from the Irish National Children’s Food Survey (a food consumption survey that included amount consumed and packaging information) to estimate exposure of children (5–12 years) to styrene from food containers (Duffey and Gibney Citation2007). If a food was packaged in a material that could contain styrene, it was assumed that styrene was present in the food. Styrene concentrations were estimated using both 90th percentile and maximum migration values taken from the literature. Calculated Irish children’s intakes are summarized in Table S28.
Cao et al. (Citation2018) calculated average dietary exposures to styrene for different age-groups based on data from 2014 TDS and food consumption rates from the 2004 Canadian Community Health Survey, Cycle 2.2 (Statistics Canada Citation2004) (). No upper-bound values were calculated, and exclusively nursing infants were not considered. For infants up to 6 months of age assumed to ingest no solid food, styrene intake via formula and mother’s milk were calculated according to U.S. EPA’s currently recommended infant age groups (0 to <1 month, 1 to <3 months, and 3 to <6 months) by multiplying the styrene concentration in milk-based formulas reported by Cao et al. (Citation2018) (0.92 µg/kg) or the maximum styrene concentration reported in human milk (0.69 µg/kg, correcting for milk density of 1.03 g/mL) (Blount et al. Citation2010) by the U.S. EPA’s recommended age group-specific human milk intake rates for exclusively breastfed infants (U.S. EPA, Citation2011) (). It was assumed that the rate of formula intake is equal to that of human milk, and that intake of solid foods is negligible for the first 6 months. Thus, styrene intakes from human milk or formula for infants up to this age are considered total dietary intake. These data indicate that among the general population, young infants’ exposures to styrene via breastfeeding are similar to those derived from infant formulas. Lactational transfer of styrene therefore appears not to be an exposure pathway of concern for the general population. However, styrene concentrations are expected to be higher in the milk of occupationally exposed women. No measured concentrations were identified in the literature, but Fisher et al. (Citation1997) estimated a daily intake of 0.65 mg styrene per day for an infant up to 3 months of age whose mother is exposed to 50 ppm styrene at work. Assuming an average body weight of 5.9 kg and a milk intake rate for this age group of 140 mL/kg BW-day (U.S. EPA, Citation2011), the corresponding concentration of styrene in milk can be calculated (0.65 mg/day ÷ 5.9 kg = 0.11 mg/kg BW-day ÷ of 140 ml/kg BW-day = 787 µg/L styrene in milk). This value is 1000 times higher than the maximum measured concentration in samples from the general population (Blount et al. Citation2010). Although this concentration is uncertain and likely overestimated, it is not implausible given the very large differences in airborne styrene concentrations between FRP workers and the general population. Age group-specific intakes calculated assuming that this concentration pertains throughout the six-month nursing period are also presented in .
Table 12. Average dietary exposures to styrene for different age groups.
Table 13. Age-group specific mean and 95th percentile average daily doses of styrene for formula- vs. breastfed infants aged 0 to 6 months (mg/kg bw-day).
Cao et al. (Citation2018) also calculated the percent of styrene exposure from different food groups for the different age groups. As shown in Table S29, dietary exposures to styrene are mainly from dairy (12.9–46.3%), grain-based foods (11.8–40%), and nuts (2.9–36.2%). In general, dietary exposures to styrene increased from infants to toddlers, subsequently decreased in older children and adults. The average dietary styrene intakes calculated for the age groups considered by Cao et al. (Citation2018), about 1.2E-04–3.8E-04 mg/kg bw/day, are within the range of published estimates. These findings accord with Genualdi, Nyman, and Begley (Citation2014) observation that styrene concentrations in food have not changed significantly since the 1980s.
Mouthing of toys
Commercial styrene-containing polymers are used in the manufacturing of children’s toys. For this assessment, the following conservative assumptions were made:
All mouthed objects are made of acrylonitrile-butadiene-styrene containing 928 mg styrene/kg (Abe et al. Citation2013).
The styrene migration rate does not decrease over the age interval for which exposure is estimated (i.e., mass balance is ignored).
All styrene migrating from the object during contact is ingested by the child.
Mouthing duration depends on the child’s age and the type of object mouthed (Greene Citation2002). Generally, children up to 3 years old mouth their fingers most, followed by pacifiers, and teethers and toys. The surface area of toy in contact with a child’s mouth was assumed to be 10 cm2 (U.S. CPSC, Citation2014). The sum of mean and 95th percentile mouthing durations for various objects by children in three age groups (3 months up to 1 year, 1–2 years, and 2–3 years) developed by the U.S. Consumer Product Safety Commission (Greene Citation2002) were used to characterize central tendency and upper-bound exposures, respectively. The daily styrene exposure from mouthed toys was calculated for each age group as follows:
where
| DMR = | = | hourly migration rate of styrene from a new toy (µg/cm2-h) |
| ET = | = | age-specific time of mouthing activity (hours/day) (Greene Citation2002) |
| SA = | = | surface area of toy in mouth (cm2) |
| BW = | = | age interval-specific body weight (kg) (U.S. CPSC, Citation2014) |
The estimated daily exposures to styrene from mouthing of toys range from 4.7E-06 – 5E-05 mg/kg bw/day (), an order of magnitude lower than dietary exposures.
Table 14. Estimated styrene intake via mouthing of acrylonitrile-butadiene-styrene toys (mg/kg bw-day).
Total styrene intake for the general population
Calculated mean styrene exposures to the general population via inhalation and ingestion (including mouthing) were summed in order to: (1) estimate total exposure for the various age groups, (2) determine the relative contributions of different sources; and (3) identify any notable relationships of exposure patterns with age. In order to sum age group-specific inhalation and dietary intakes, the dietary age groups used by Cao et al. (Citation2018) (shown in ) were adjusted to match inhalation age groups established in accordance with U.S. EPA guidance (shown in ) as follows:
The three youngest age groups (<1 month, 1 < 3 months, and 3 < 6 months) were combined to calculate age-weighted six-month averages for styrene intakes via inhalation () and formula and mother’s milk (). Finally, styrene intakes via toy mouthing for the age group 3 < 12 months () were assumed to pertain to both 0 < 0.5-year and 0.5 < 1-year age groups.
Central tendency and upper-bound styrene intakes via inhalation (non-smoking and smoking), diet, and mouthing behavior are summarized in , and the relative contribution of the central tendency values for these intakes is depicted in . Styene intake rates are highest in young children, for whom inhalation is the primary route of exposure. Both the amount of styrene exposure and the proportion contributed by inhalation decrease with age. The lower daily exposures associated with toy mouthing indicate that this is unlikely to be a significant source of young children’s exposure to styrene. Active smoking is a significant source of styrene exposure for adults.
Figure 2. Age-dependence and relative contribution of the oral (toy mouthing, diet) and inhalation (including smoking) exposure routes on total mean exposure to styrene amongst the general population.
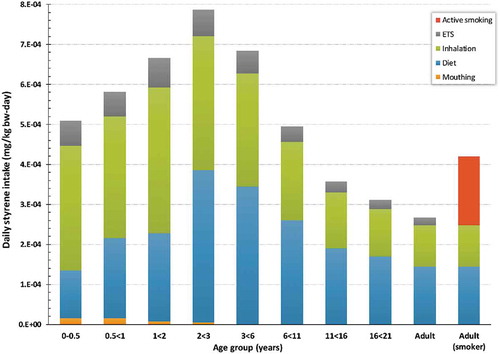
Table 15. Summary of total estimated central tendency and upper-bound styrene intake amongst the general population (mg/kg bw-day).
Risk characterization
Cohen et al. (Citation2002) applied estimated margins of exposure (MOE) in developing a risk characterization for styrene. Based on a conclusion that styrene’s carcinogenicity was only suggestive, the authors elected not to use a dose–response model for cancer and rather used the MOE approach for both cancer (mouse lung tumor) and non-cancer (hearing impairment and male reproductive toxicity) evaluations of risk. For occupational exposures, MOE values smaller than 100 were considered as possibly inadequate and, for non-occupational exposures to the general population, MOE values smaller than 1000 as too small to be protective.
For this updated risk characterization for styrene, calculation of the Hazard Quotient (HQ), expressed as the ratio of human exposure concentration of concern to the exposure appropriate health standard value was used. An HQ of less than 1 indicates that the risk for the effect on which the health standard is based is acceptable, and the exposure is not expected to be associated with an adverse health outcome. HQ values greater than 1 do not necessarily indicate the actual presence of a hazard because conservative assessment factors are used to derive the standard. An HQ above 1 might only imply that additional evaluation of the exposure scenario of concern is warranted. The estimated health standards used for the HQ derivations are: worker µg general population ingestion RfD = 2.5 mg/day/day; and general population inhalation RfC = 3.7 ppm (15.7 mg/m3). The endpoints on which the health standards are based are detailed in a previous section of this review and summarized in .
Although the risk characterization approaches applied in Cohen et al. (Citation2002) and this assessment is nominally different, the bottom-line risk characterization conclusions are comparable.
Occupational exposures
Styrene HQ values are derived for the FRP and synthetic rubber industries, both of which experience the highest worker exposures (). For the FRP industry, HQ values for the central tendency and upper-bound exposures in workers engaged in open-mold processes without any respiratory protection are >1. Importantly, however, the HQ’s are reduced below 1, even for the upper-bound exposures, when appropriate respiratory protection is used in open-molding processes. HQ values are less than 1 in FRP workers using closed-molding processes, indicating that this work scenario may not require additional respiratory protection in order to protect worker health.
Table 16. Hazard Quotient (HQ) estimated from central tendency and upper-bound styrene intake in the general population (mg/kg-day). HQ = total styrene daily dose from /RfD. Styrene general population RfD = 2.5 mg/kg/day.
Table 17. Occupational Hazard Quotient (HQ) estimated from central tendency and upper-bound worker exposures in FRP and Synthetic Rubber industries.
Styrene exposures in the synthetic rubber industry are generally lower than those experienced in FRP industries, and this is reflected in the generally lower HQ’s, all of which are below 1 for this industry. HQ’s are the highest in cleanup crew workers.
Cohen et al. (Citation2002) found similar risk characterization conclusions for occupational exposure and non-cancer effects with FRP industry showing the highest potential risk (MOE lower than 100) whereas other industries had lower risk potential (greater MOE values). The largest difference in the exposure information is that the updated risk assessment includes exposures where respiratory protection is applied whereas respiratory protection was not considered in the Cohen et al. (Citation2002) assessment. Clearly, respiratory protection significantly reduces styrene exposure and hence the potential for health risks; therefore, use of respiratory protection is a recommended risk management measure for high workplace exposures., Other risk management measures, such as local exhaust ventilation and confinement of processes that release styrene, may also be considered for reducing workplace exposures.
General population exposures
For inhalation exposure, general population HQ values for a range of age-groups () or for worst-case exposed individuals living in close proximity to potential high-volume styrene emission plants are all well below 1, indicating the general population is unlikely to experience adverse health outcomes associated with these exposures.
Table 18. Hazard Quotients (HQ) for general population living near styrene emission facilities (modified from , Cohen et al. Citation2002). HQ = exposure/RfC. General population RfC = 3.7 ppm.
Exposures to increasing age groups from newborn to 1 years of age to adults, including those exposed passively to cigarette smoke or as active adult smokers, produce HQ estimates that are substantially less than 1 (). The exposure scenarios for each of the depicted age groups include total daily intake of styrene expressed as mg/kg bw/day resulting from combined inhalation (non-smokers and smokers) and ingestion exposure (diet and mouthing for children up 2–5 years old) (). The HQ’s for breastfed infants of occupationally exposed women were the highest of the calculated HQs but their exposures were based on modeled estimates for 50 ppm worker exposures, versus the recommended worker OEL of 20 ppm. Daily 50 ppm exposures are unlikely to actually occur, whereas with 20 ppm exposures and assuming linear toxicokinetics between 20 and 50 ppm, the HQ would be reduced by a factor of 20/50 = 0.4 or 0.044 × 0.4 = 0.018 (1.8E-2). For these breastfed infant HQs, smoking was not included as the contribution of styrene from passive smoking was significantly smaller than the contribution for workplace inhalation and active smoking is not recommended in pregnant and nursing mothers (CDC, Citation2019).
HQ for worst-case exposed individuals living near low- and high-volume styrene users are all below 1 when determined as either maximum annual or lifetime average exposures. These values were all derived from general population exposures published in 1999, and thus the advent of advanced emission controls in more recent years has likely further reduced these localized generalized population exposures.
Cohen et al.’s (Citation2002) conclusions for non-occupational exposure gave generally similar results with low-risk concerns (high MOE) for most inhalation and oral scenarios. A MOE of 1000 and higher was estimated for typical ambient air exposure, exposures from smoking and living 100 meters from a hypothetical 100,000 pound/year high styrene emitting facility and even lower risk for oral exposures from food and food packaging (MOE = 200,000). The only exposure scenario that resulted in a risk concern (MOE = 20) was an exposure scenario for persons living at a point of greatest exposure in the vicinity of a hypothetical 1 × 10⁶ pounds/year emission facility; however, the authors acknowledged that this scenario purposely overstated exposure. These same exposure metrics were considered in the updated assessment and the HQs were well below and below 1 for styrene risk, respectively, for the 100,000 and 1 × 10⁶ pounds/year hypothetical emitting facility exposure scenarios.
Sources of uncertainty in risk characterization
Sources of uncertainty in the exposure and hazard assessment used in this risk characterization are discussed below. Cohen et al. (Citation2002) identified uncertainty in occupational exposure levels due to poorly characterized workplace exposures, non-occupational exposure levels due to use of models, the human cancer classification based on an insufficient understanding of the mouse lung tumor human health relevance, ototoxicity and color vision impairment due to limited data and subclinical effects and immunotoxicity due to limited data. Since the Cohen et al. (Citation2002) assessment was published, significant new exposure and toxicity data have been developed for styrene; which aided in reduction in uncertainty in risk characterization and increase the confidence in the risk conclusions. However, given the nature of this information, it is not possible to completely eliminate uncertainty.
Uncertainty in exposure assessment
In the exposure assessment performed by Cohen et al. (Citation2002), uncertainty in non-occupational exposure levels was identified based on the author’s use of modeling of styrene facilities and uncertainty in occupational exposure levels was identified based on poorly characterized retrospective workplace exposures from epidemiological studies. The updated assessment attempted to diminish these uncertainties and improve exposure estimations by using representative reported data rather than modeled data for general population exposures and recent workplace exposure data for occupational exposures. However, the process of exposure assessment still inherently involves uncertainties in the data selected, the populations and pathways described, and the values used to quantify exposure. Uncertainties in this assessment were divided into two broad categories: (1) determining the concentration of styrene in human exposure media; and (2) assessing parameters used to describe population contact rates and characteristics. The approach taken was to make generally conservative assumptions, such that potential exposures are much more likely to be overestimated than underestimated.
Uncertainty in inhalation exposure estimates
Measurements of personal air concentrations provide the most reliable estimates of spatially- and temporally integrated styrene exposures via inhalation, and using such measurements obviates a series of uncertain extrapolations based on area concentrations and time budgets. By the same token, specific sources of airborne styrene and microenvironments in which exposures may be particularly high are not identifiable with this approach. Moreover, the availability of personal air monitoring data is limited, especially for children. Although the datasets used in this assessment are of high quality, the breadth of the dataset applicability has not been established.
Although children’s personal air concentrations do not appear to differ from those of cohabiting adults, the internal doses received by children, especially infants, are expected to be greater than those of adults due to children’s higher inhalation rates per unit body weight and immaturity of metabolic capability. It is not clear whether the applied pulmonary uptake factor of 0.65, recommended by the California EPA (CalEPA, Citation2010), is appropriate for children. PBPK exposure to 1 ppm styrene (3 orders of magnitude higher than typical exposure levels for the general U.S. population) indicated a twofold greater internal dose for infants (Sarangapani et al. Citation2003) (hence the proposed CIA used in this risk assessment), but the inhalation intakes calculated based on default age-specific inhalation rates and body weights differ almost fourfold between newborn to 1-month-olds and adults. It therefore does not appear that children’s inhaled doses are underestimated, but this is clearly a source of uncertainty.
ETS and smoking are generally considered to be important styrene sources. Contributions from ETS and active smoking were estimated by applying multipliers based on limited comparative studies to representative central tendency and upper-bound personal air concentrations. Given the continued prevalence of smoking in the U.S. (Dwyer-Lindgren et al. Citation2014), it seems likely that ETS contributes to personal air concentrations even among non-smokers. Given the dramatic variability of smoking prevalence among geographic regions and socioeconomic strata, this assessment could underestimate styrene exposures to non-smokers in heavy smoking areas.
Uncertainty in dietary intake estimates
Data on styrene concentrations in food are sparse, and it is generally not possible to distinguish the unique contributions from the major identified sources, i.e., diffusion from styrenic packaging materials or the atmosphere. Styrene has not been an analyte in FDA market basket studies since 2003, when it was present in only trace amounts in over 50% of the foods examined. Therefore, exposures were based upon sampling data from the Canadian Total Diet Study (Cao, Sparling, and Dabeka Citation2016; Cao et al. Citation2018). The mean concentrations reported by Cao, Sparling, and Dabeka (Citation2016) in various food products were assumed to be representative of all foods in that category, but as detection frequencies and concentration ranges were not provided in the published report, whether overall concentrations in these foods are likely to be over- or under-estimated cannot be determined. Per capita intake data were also not available for the sampled foods; thus, food descriptions were matched with retail commodity intake data compiled by the USDA (USDA, Citation2013) or generic food category intake rates recommended by the U.S. EPA (U.S. EPA, Citation2011). There were no intake rates available for many sampled foods (including the highest-content category, “herbs” and “spices”), and no sampling data for many common foods. These uncertainties notwithstanding, the fact that the intakes calculated herein compare with those estimated in other recent studies lends confidence that the calculated intakes are reliable for the purpose of characterizing U.S. population exposure to styrene.
Few published data on styrene concentrations in human milk are available, and none for occupationally exposed women. Although the exposure to the worker breast-fed infant estimated in this assessment is likely overestimated, it is not inconceivable given the large differences in airborne styrene concentrations between FRP workers and the general population. Given the magnitude of potential exposure to workers infants, this is considered to be a significant area of uncertainty.
Uncertainty in hazard assessment
The Cohen et al. (Citation2002) assessment identified hazard uncertainty with human carcinogen classification and in non-cancer endpoints of color vision impairment, ototoxicity, and immunotoxicity. With the exception of immunotoxicity, which still has limited information, these hazards have been more thoroughly characterized in the past nearly two decades and hence contribute to reduced uncertainty and enhanced confidence in the current assessment of styrene-mediated hazards. There are however some remaining uncertainties that are noted below.
Study/endpoint selection
Styrene has been well studied in animals and there is significant information on styrene and human cancers and neurotoxicity. A variety of toxicity endpoints were considered for derivation of the styrene toxicity reference values, including ototoxicity, dyschromatopsia, and developmental toxicity. For these endpoints, the study/endpoint resulting in the smallest (more health protective) reference value was taken as the key study; this supported the selection of the Triebig, Bruckner, and Seeber (Citation2009) for ototoxicity, the Seeber, Bruckner, and Triebig (Citation2009b) for dyschromatopsia, and Cruzan et al. (Citation2005a) for developmental toxicity. Therefore, although there is uncertainty regarding which study/endpoint is the most appropriate for the human health risk assessment, consideration of alternative studies/endpoints reduces uncertainty in the selection of the study basis for the toxicity values. Cancer was excluded from the toxicity reference value determination. Mouse lung tumors were not considered as potentially relevant to humans given that there is sufficient evidence from mechanistic studies to exclude these tumors as a toxicity endpoint of concern for humans. The available human epidemiological evidence is inconclusive; hence these data do not support derivation of toxicity reference values but the evidence does contribute uncertainty to the toxicity assessment.
Mode of action
The MOAs that explain styrene’s adverse health effects were assessed in the above-referenced toxicity endpoint discussions. For the non-cancer endpoints, several endpoints were considered. The ototoxicity MOA was concluded as relevant to humans and determined to be the most sensitive toxicity endpoint for the OEL and general population RfD. The developmental toxicity MOA was also concluded as relevant to humans and determined as the most sensitive toxicity endpoint for the general population RfC. Any uncertainty in this MOA is mitigated by evaluation of the other endpoints, which were found to yield equal or larger potential toxicity reference values.
For cancer, the mouse lung tumor MOA information unequivocally supports that the conclusion that lung tumors result from mouse-specific metabolism of styrene by CYP2F2, and are unique to the mouse. Thus, as concluded in a comprehensive MOA framework analysis of styrene-induced mouse lung tumors, Cruzan et al. (Citation2018) stated that this “ … MOA demonstrates styrene-induced mouse lung tumors are likely qualitatively, or possibly quantitatively, not relevant to humans.” Uncertainty in this MOA was addressed by evaluating an alternative MOA, specifically that SO cytotoxicity and genotoxicity is responsible for the mouse lung tumor increases. This hypothesis, however, is not supported by data. There are no gene expression indications of a genotoxic response. The gene expression changes indicate a non-genotoxic, rodent and rodent strain-specific MOA-related to activation of nuclear receptor signaling with attendant cell proliferation (primarily mitogenesis), changes in cellular metabolism and activation of immune response pathways, and later alteration in circadian clock genes associated with control of cancer. There is no evidence of club cell toxicity/mitogenicity from SO in the absence of CYP2F2 metabolism and direct administration of SO to mice did not result in lung tumors.
No MOA information is available to support the findings in human cancer epidemiology reports. The reported human cancer findings are not consistent across studies or in exposure–response relationships and hence there is a lack of sufficient information to postulate a MOA. However, it is important to note that even though human and rodents share a common and extensive CYP2E1-mediated metabolism of styrene to SO, animal MOA data strongly support the conclusion that SO is not responsible for styrene toxicity and tumorigenicity in mice, and by inference, humans.
Toxicity reference value derivation
The styrene estimated occupational and general population toxicity values were derived using several sensitive human and animal toxicity endpoints. Key studies and the NOAEC/LOAECs from these studies were identified for human ototoxicity and dyschromatopsia, as well as rat developmental toxicity, and AFs were applied to address extrapolations from the datasets to the estimated safe toxicity value. For the OEL, values of 20, 50, and 117 ppm were estimated for ototoxicity, dyschromatopsia, and developmental toxicity, respectively; the lowest value of 20 ppm for ototoxicity was selected. The estimated RfC for the general population for ototoxicity, dyschromatopsia and developmental toxicity were 6, 4, and 3.7 ppm, respectively; the lowest value of 3.7 ppm for developmental toxicity was selected. The estimated RfD for the general population for ototoxicity, dyschromatopsia and developmental toxicity were 2.5, 3.4, and 3.1 mg/kg bw/day, respectively; the lowest value of 2.5 mg/kg bw/day for ototoxicity toxicity was selected. The development of a range of values for the alternative identified sensitive toxicity endpoints reduces uncertainty in the selected values. For both the RfC and RfD evaluations, the values for all three endpoints were all within a factor of 2 and supporting that selected values.
Conclusions/discussion
Hazard assessment
The toxicological effects of styrene have been thoroughly studied in human and animal investigations. Nearly 20 years of additional information has been amassed since the Cohen et al. (Citation2002) assessment was conducted. Cancer and non-cancer health effects were identified as areas of concern by Cohen et al. (Citation2002) and remain as concerns based on the present assessment, although these endpoints are now better understood.
Cohen et al. (Citation2002) conclusion of suggestive evidence of cancer was based upon a then incomplete understanding of the MOA by which styrene increases mouse lung cancer risk. Since Cohen et al. (Citation2002) review, extensive mechanistic research culminating in a new chronic inhalation mouse study with genetically engineered mice were conducted that may now explain mouse lung cancer and its lack of relevance to humans. This MOA information unequivocally supports the conclusion that lung tumors are unique to the mouse, and result from mouse-specific metabolism of styrene by CYP2F2. In mice, styrene is metabolized to ring-oxidized metabolites that, when produced in sufficient amounts, result in gene expression changes in mouse lung tissue. These gene expression changes indicate a non-genotoxic, rodent- and rodent strain-specific MOA-related to activation of nuclear receptor signaling with attendant cell proliferation (primarily mitogenesis), changes in cellular metabolism and activation of immune response pathways, and, later alteration in circadian clock genes associated with control of cancer. The critical role of CYP2F2 metabolism as a key event (gateway) to styrene mouse lung toxicity is strongly evidenced by both short- and long-term studies in CYP2F2 KO mice in which evidence of lung toxicity is completely attenuated. This species-specific MOA is supported by findings in rats. Rats have less CYP2F (2F4) than do mice, produce less ring-oxidized metabolites, and are demonstrated to have no cytotoxic, proliferative or tumorigenic lung changes at high exposures (up to 1000 ppm) for 2 years. Thus, as concluded in a comprehensive MOA framework analysis of styrene-induced mouse lung tumors, Cruzan et al. (Citation2018) stated that this “ … MOA demonstrates styrene-induced mouse lung tumors are likely qualitatively, or possibly quantitatively, not relevant to humans.” Uncertainty in this MOA was addressed by evaluating an alternative MOA, specifically that SO cytotoxicity and genotoxicity is responsible for the mouse lung tumor increases. This alternative hypothesis, however, is not supported by data. There are no gene expression indications of a genotoxic response in WT mice (e.g., increased DNA-repair-associated genes); there is no evidence of club cell toxicity/mitogenicity from SO in the absence of CYP2F2 metabolism (i.e., SO is not lung toxic in CYP2F2 KO mice); chronic styrene exposure did not produce lung toxicity in CYP2F2 KO mice despite continuing ability to generate substantial SO via CYP2E1 metabolism; and chronic oral administration of SO to mice did not result in lung tumors, even with evidence of substantial SO systemic absorption.
There continues to be limited evidence of an association between occupational exposure to styrene and human cancer. There have been a number of study updates primarily to the FRP industry cohorts but the results of these updates have not substantially changed the overall assessment of styrene and human cancers. There are reports of human cancers in workplaces that have styrene exposures, but the observations are not consistent across studies and lack exposure–response relationships. Confounders and chance findings cannot be ruled out in these cancers. Overall the human cancer evidence for styrene and workplace exposure is inconclusive and not supported by animal toxicity and MOA information but, as such, remains a concern. Studies of general population environmental and consumer styrene exposure and cancer are less informative than the occupational cohort studies given generally lower number of subjects and imprecise exposure information but the available evidence does not suggest these low exposures are a concern.
For non-cancer hazards, Cohen et al. (Citation2002) primarily identified color vision impairment and ototoxicity as health endpoints of concern, but noted questions on reported findings that would benefit from further research. The studies in German boat-building workers that specifically studied color vision impairment (Seeber, Bruckner, and Triebig Citation2009b), ototoxicity (Triebig, Bruckner, and Seeber Citation2009) as well as neurobehavioral changes (Seeber, Bruckner, and Triebig Citation2009a) were conducted as a direct response to the data uncertainties raised in Cohen et al. (Citation2002). These studies are the most important study available on these endpoints and hence the most valuable for hazard and risk characterization given the quality and content of their exposure assessment. A number of other studies, especially on ototoxicity, have also been reported but these investigations suffer from exposure assessment deficiencies particularly with regard to likely higher previous exposures. Seeber, Bruckner, and Triebig (Citation2009b) did not find color vision impairment in workers studied at exposures below 50–100 ppm and hence does not substantiate color vision as a health effect concern at lower and more relevant occupational exposures or for general population exposures. For the ototoxicity endpoint, Triebig, Bruckner, and Seeber (Citation2009) found evidence of effects in workers, although this observation was limited to workers with previous higher (>50 ppm) exposures. The results of the Triebig, Bruckner, and Seeber (Citation2009) study are identified as key for derivation of toxicity reference values for styrene.
Reproductive and developmental toxicity was not found to be a major concern for styrene in the Cohen et al. (Citation2002) assessment, although this endpoint was acknowledged to lack sufficient data. Cruzan et al. (Citation2005a); Cruzan et al. (Citation2005b) guideline two-generation reproductive toxicity and developmental neurotoxicity study conducted in rats now provide detailed testing of these endpoints and establish that styrene inhalation exposure does not affect fertility, but is toxic to development at high exposure concentrations (500 ppm) that also produce effects in the dams. This finding establishes the lowest RfC for assessing general population exposures given the need to include use of adjustment factors accounting for inter- and intra-species differences and exposure-time adjustments from animal testing to humans.
Exposure assessment
The major objectives of the updated exposure assessment were to: (1) document sources and significant pathways of styrene exposure for the general population and highly exposed workers in the FRP industry; and (2) develop central tendency and upper-bound exposure estimates for each source and pathway based upon generally conservative assumptions (tending to over-rather than under-estimate potential exposures) suitable for assessment of potential health risks associated with environmental and occupational styrene exposures.
Primary sources of styrene in the environment are industrial emissions, motor vehicle exhaust, and incomplete combustion of natural materials (wood and other fuels) or from incinerators burning various hydrocarbon-containing waste streams. Data from two publicly available databases, NEI and TRI, document continuing decreases in styrene releases, and ambient monitoring data show declines in both outdoor and indoor concentrations over the past several decades.
As a low molecular weight VOC, styrene is mobile in all environmental media, with a strong tendency to migrate to the atmosphere regardless of the mode of release. With low affinity for soils and sediments, it does not accumulate in soil or sediment but might leach to groundwater. It is not persistent in any media, being degraded primarily biodegradation and photo-oxidation. Available evidence shows that styrene bioconcentration factors for fish and mollusks are low, perhaps due to rapid elimination. Based upon physicochemical characteristics and behavior of styrene in the environment, the most likely route of human exposure is inhalation.
Personal air concentrations are considered the most accurate basis for evaluating inhalation exposure to styrene for the general population. Although children’s personal air concentrations do not appear to differ from those of cohabiting adults, the internal doses received by children, especially infants, are expected to be greater than those of adults due to children’s higher inhalation rates per unit body weight and immaturity of metabolic capability. Current U.S. EPA guidance prescribes that potential inhalation hazards and risks are to be computed based on comparison of exposure concentrations with inhalation-based toxicity criteria (U.S. EPA, Citation2009). Although guidance states that no adjustment of airborne exposure concentrations is necessary for children other than activity-weighting, a CIA of twofold was applied for the first three years to personal air concentrations to account for age-dependent differences in dosimetry. An adjustment factor of 1.2, representing the impact of environmental tobacco smoke, was applied to all age groups, as was a factor of 2.7 to represent active smoking in adults. Age group-specific central tendency estimates of personal styrene exposure concentrations ranged from 0.8 to 2.2 µg/m3 (0.18–0.51 ppb), and upper-bound estimates ranged from 2.4 to 6.5 µg/m3 (0.55–1.5 ppb). These estimates are lower than provided by Cohen et al. (Citation2002) based on 1990s data with 1 ppb estimated for typical ambient maximum annual average exposure and 5 ppb for high-end ambient maximum annual average exposure.
The highest occupational styrene exposures occur during the production of FRP by open molding processes that involve manual application of materials and in the absence of respiratory protection. For closed-mold processes, central tendency and upper-bound TWA styrene concentrations were about 11 ppm and 18 ppm, respectively. Central tendency estimates ranged from 4.3–29.9 ppm (19,000–129,000 µg/m3), and upper-bound estimates ranged from 7.3–61.5 ppm (32,000–266,000 µg/m3) for open molding applications with and without respiratory protection, respectively. These representative central tendency and upper-bound styrene concentrations in personal air for the general population and in FRP industry workplaces are suitable for direct comparison with appropriate inhalation toxicological criteria, in accordance with current U.S. EPA guidance.
Styrene occurs naturally in many foods and beverages, although it is not clear in some cases whether it is formed endogenously or if its presence is the result of partitioning from the environment (including polystyrene food packaging materials). Styrene is commonly detected at low concentrations in both raw agricultural commodities and processed foods. Migration from food packaging materials may be strongly influenced by the interaction of food components with the packaging material. Small amounts of residual styrene in children toys may be ingested via mouthing behavior. Estimated styrene intakes via mouthing of children toys are an order of magnitude lower than are dietary intakes.
Since volatile compounds such as styrene can readily partition into human milk, breastfeeding is a potentially complete exposure pathway for styrene in nursing infants. The few published data on styrene concentrations in milk suggest they are lower than concentrations measured in commercial infant formulas. Estimated styrene concentrations in milk from women working in the FRP industry indicate potentially much higher exposures to their breastfed infants.
Calculated mean styrene exposures to the general population via inhalation and ingestion (including mouthing) were summed in order to: (1) estimate total exposure for the various age groups, (2) determine the relative contributions of different sources; and (3) identify any notable relationships of exposure patterns with age. For the general population, central tendency styrene intakes via inhalation ranged from about 1E-04–5E-04 mg/kg bw/day, and upper-bound intakes ranged from about 3E-04–1E-03 mg/kg bw/day. FRP industry workers daily intakes were time-averaged over a year assuming 8 h of exposure daily for 250 days of the year. Workers central tendency styrene intakes via inhalation ranged from about 0.6–4 mg/kg bw/day, and upper-bound intakes ranged from about 1–8 mg/kg bw/day. Because volatile compounds such as styrene can readily partition into human milk, breastfeeding is a potentially complete exposure pathway for styrene in nursing infants. Young infant exposures to styrene via breastfeeding are about 25% lower than those associated with infant formulas, suggesting that lactational transfer of styrene appears not to be an exposure pathway of concern for the general population. However, estimated total intakes of infants breastfed by occupationally exposed mothers are three orders of magnitude higher. The average total dietary styrene intakes calculated for the age groups considered here, about 1.2E-0–3.8E-04 mg/kg bw-day, are within the range of published estimates. Estimated styrene intakes via mouthing of children’s toys are an order of magnitude lower than dietary intakes.
This comparison showed that inhalation is the primary route of exposure in young children (under age 2) except for workers’ breast-fed infants. After about ages 2 or 3 years, ingestion intakes are slightly higher than inhalation intakes. The daily exposure levels associated with toy mouthing were orders of magnitude lower than those associated with other exposure pathways, suggesting that mouthing of styrenic toys is unlikely to be a significant source of children’s exposure to styrene. Inhalation and dietary exposures in general increase with increasing age up to about 3 years of age and then decrease in young adults and attain lowest levels in older adults. Active smoking was the largest source of styrene exposure for adults.
Current styrene sources of exposure and pathways are similar to those identified by Cohen et al. (Citation2002). The updated exposure assessment supports inhalation as an important route of exposure, but also indicates that ingestion may significantly contribute to total exposure. Cohen et al. (Citation2002) (Table 36) concluded annual average ambient and smoking non-occupational exposure of 1 ppb and 6 ppb, respectively, whereas the updated exposure assessment based upon the more recent styrene exposure data estimated exposures to be lower with central tendency exposures for all age group non-smokers of 0.2 ppb (0.8 µg/m3) and adolescent and adult smokers to be 0.5 ppb (2.16 µg/m3); upper-bound exposures for all age group non-smokers were 0.6 ppb (2.4 µg/m3) and adolescent and adult smokers were 1.5 ppb (6.48 µg/m3) (). For oral exposure from food, Cohen et al. (Citation2002) estimated a daily intake rate of 0.2 µg/kg-day, whereas the updated assessment estimated a range of central tendency daily dietary intakes for the age groups of 0.38 µg/kg bw/day (highest value for 2 to 3-year age group) to 0.15 µg/kg bw/day (lowest value for adult) (), values that span Cohen et al. (Citation2002) value.
For occupational exposure, Cohen et al. (Citation2002) estimated 0.2–3.5 ppm 8-h TWA styrene exposures for industry segments other than FRP workers and 37 ppm for FRP workers. The present exposure assessment provides estimated ranges of exposure for workers. For non-FRP industries, the SBR industry was identified; the latest exposure information available was from 1992 and indicated styrene exposures ranged from a low of 0.67 ppm for tank farm operators to 7.9 ppm for cleanup crews (Table S11). For FRP workers, styrene exposure estimates are provided for three scenarios: open molding, open molding with respiratory protection, and closed molding; the respective central tendency/upper bound exposures are 29.9/61.5, 4.3/7.3 and 11.2/18 ppm (Table S14). Again, the updated exposure assessment estimates based on the presently available information span the exposure values used in Cohen et al. (Citation2002).
Risk characterization
The results of the updated risk assessment indicate occupational exposures in the FRP industry remain as a concern for potential ototoxicity. Both the Cohen et al. (Citation2002) and this updated assessment finds elevated risk for FRP workers, although the updated assessment discriminates between open- and closed-mold processes and the use of respiratory protection with open-mold processes and found only the open-mold process without respiratory protection to show risk exceedances. Non-FRP industry exposures were represented by the SBR industry and found to have low risk. Measures to reduce styrene exposure such as respiratory protection or improved facility ventilation in the FRP industry need to be considered to manage the potential risk of ototoxicity. In addition, given reported interactions of styrene with noise, noise reduction to sustain levels below 85 dB(A) should be in place.
General population exposures to styrene from inhalation or oral intake present low risks for adverse health effects. Both Cohen et al. (Citation2002) and this updated assessment establishes low exposure of general population/consumers to styrene, although Cohen et al. (Citation2002) concluded that populations continuously exposed to high or excessive styrene emitting facilities may have a risk concern; the authors, however, acknowledge that the assumptions used were purposely designed to overestimate exposures, and that most people living near such facilities would receive substantially less exposure. The current evaluation concludes HQs well below 1 for those scenarios, indicating a low concern for risk for this population.
Overall the risk characterization conclusions of the updated and Cohen et al. (Citation2002) assessments are remarkedly similar given the differing exposure and hazard datasets available for styrene before 2002 and newly-developed since that time. Both assessments support the conclusion that styrene is a low concern for human health risk with the exception of highly exposed FRP workers, and those risks can be managed to acceptable risk levels.
Supplemental Material
Download Zip (505.6 KB)Acknowledgments
The authors are grateful to G. Cruzan for his decades of leadership on the science of styrene toxicology, and especially the mouse lung tumor MOA research.
Disclosure Statement
MIB, JSB, JCJ, ED, JEK, MMM, and H-PG received consulting fees for preparation of this manuscript from SIRC. SSS and RW are employed by companies that manufacture styrene. MIB was previously employed by companies that manufacture styrene. The authors have sole responsibility for the content and the writing of the manuscript. The interpretation and views expressed in the manuscript are not necessarily those of the author’s employers.
Supplementary material
Supplementary data for this article can be accessed here.
Additional information
Funding
Notes
1. The editorial boards of most major respiratory journals renamed “Clara cells” as “club cells” in 2013.
2. I2 describes the percentage of total variation across studies that is due to heterogeneity rather than chance (Higgins and Thompson Citation2002; Higgins et al. Citation2003).
3. A-weighted decibels are decibels with the sound pressure scale adjusted to conform with the frequency response of the average human ear.
4. The term “central tendency” refers to statistical measures that characterize a central or typical value of a probability distribution. Depending upon data availability, arithmetic mean, 95% upper confidence limit on arithmetic mean, geometric mean, or median (50th percentile) may be used as estimates of central tendency.
5. The term “upper bound” refers to statistical measures that characterize a “reasonable maximum” for a population – a plausible upper limit to the true value of a quantity. Depending upon data availability, 90-95th percentiles or maximum values may be used as estimates of the upper bound.
Related Research Data
References
- Abdala, C., and L. Visser-Dumont. 2001. Distortion product otoacoustic emissions: A tool for hearing assessment and scientific study. Volta Rev. 103:281–302.
- Abe, Y., M. Yamaguchi, M. Mutsuga, H. Akiyama, and Y. Kawamura. 2013. Volatile substances in polymer toys made from butadiene and styrene. Am. J. Anal. Chem. 4:229–37. doi:10.4236/ajac.2013.45029.
- Abraham, K., H. Mielke, W. Huisinga, and U. Gundert-Remy. 2005. Elevated internal exposure of children in simulated acute inhalation of volatile organic compounds: Effects of concentration and duration. Arch. Toxicol. 79:63–73. doi:10.1007/s00204-004-0599-3.
- Adgate, J. L., L. E. Eberly, C. Stroebel, E. D. Pellizzari, and K. Sexton. 2004b. Personal, indoor, and outdoor VOC exposures in a probability sample of children. Expo. Anal. Environ. Epidemiol. 14 (Suppl 1):S4–S13. doi:10.1038/sj.jea.7500353.
- Adgate, J. L., T. R. Church, A. D. Ryan, G. Ramachandran, A. L. Fredrickson, T. H. Stock, M. T. Morandi, and K. Sexton. 2004a. Outdoor, indoor, and personal exposure to VOCs in children. Environ. Health Perspect. 112:1386–95. doi:10.1289/ehp.7107.
- Agency for Toxic Substances and Disease Registry (ATSDR). 2010. Toxicological profile for styrene. Atlanta, GA: Public Health Service U.S. Department of Health and Human Services.
- Agency for Toxic Substances and Disease Registry (ATSDR). 2017. The ATSDR 2017 substance priority list. Last Modified September 25, 2017, Accessed January 2018. https://www.atsdr.cdc.gov/spl/index.html.
- Agrawal, Y., E. A. Platz, and J. K. Niparko. 2008. Prevalence of hearing loss and differences by demographic characteristics among us adults: Data from the national health and nutrition examination survey, 1999-2004. Arch. Intern. Med. 168:1522–30. doi:10.1001/archinte.168.14.1522.
- Ahlborg, G., Jr., T. Bjerkedal, and J. Egenaes. 1987. Delivery outcome among women employed in the plastics industry in Sweden and Norway. Am. J. Ind. Med. 12:507–17.
- Ahmad, M., and A. S. Bajahlan. 2007. Leaching of styrene and other aromatic compounds in drinking water from PS bottles. J. Environ. Sci. 19:421–26. doi:10.1016/S1001-0742(07)60070-9.
- Albee, R. R., J. L. Mattsson, B. L.Yano, M. J. Beekman, P. J. Spencer. 1992. Ototoxicologic and neurotoxicologic evaluation of rats exposed to styrene for 13 weeks. The Dow Chemical Company.
- Alexander, M. 1997. Environmental fate and effects of styrene. Crit. Rev. Environ. Sci. Technol. 27:383–410. doi:10.1080/10643389709388504.
- American Chemisty Council Plastics Foodservice Packaging Group FDA Task Force. 2015. Update 2013. The Safety of Styrene-Based Polymers for Food-Contact Use Washington, D.C.
- American Composites Manufacturers Association (ACMA). 2018. Styrene exposures in composites manufacturing operations. Data reported from two companies.
- American Conference of Governmental Industrial Hygienists (ACGIH). 2001. Styrene monomer. In TLV® chemical substances 7th edition documentation. Cincinnati, OH
- American Conference of Governmental Industrial Hygienists (ACGIH). 2015. Styrene. In Documentation of the biological exposure indices. 7th.
- American Conference of Governmental Industrial Hygienists (ACGIH). 2018. TLVs and BEIs ® based on the documentation of the threshold limit values for chemical substances and physical agents & biological exposure indices, Cincinnati, OH.
- Andersen, M. E., G. Cruzan, M. B. Black, S. N. Pendse, D. Dodd, J. S. Bus, S. S. Sarang, M. I. Banton, R. Waites, and P. D. McMullem. 2018. Strain-related differences in mouse lung gene expression over a two-year period of inhalation exposure to styrene: Relevance to human risk assessment. Regul. Toxicol. Pharmacol. 96:153–66. doi:10.1016/j.yrtph.2018.05.011.
- Andersen, M. E., G. Cruzan, M. B. Black, S. N. Pendse, D. Dodd, J. S. Bus, S. S. Sarang, M. I. Banton, R. Waites, and P. D. McMullen. 2017. Assessing molecular initiating events (MIEs), key events (KEs) and modulating factors (MFs) for styrene responses in mouse lungs using whole genome gene expression profiling following 1-day and multi-week exposures. Toxicol. Appl. Pharmacol. 335:28–40.
- Anderson, M. J., S. L. Miller, and J. B. Milford. 2001. Source apportionment of exposure to toxic volatile organic compounds using positive matrix factorization. J. Expo. Anal. Environ. Epidemiol. 11:295–307. doi:10.1038/sj.jea.7500168.
- Antilla, A., E. Pukkala, R. Riala, M. Sallmen, and K. Hemminki. 1998. Cancer incidence among Finnish workers exposed to aromatic hydrocarbons. Int. Arch. Occup. Environ. Health. 71:187–93.
- Anwar, W. A., and M. Y. Shamy. 1995. Chromosomal aberrations and micronuclei in reinforced plastics workers exposed to styrene. Mutat. Res. 327:41–47.
- Arvanitoyannis, I. S., and L. Bosnea. 2004. Migration of substances from food packaging materials to foods. Crit. Rev. Food Sci. Nutr. 44:63–76. doi:10.1080/10408690490424621.
- Ashley, D. L., M. A. Bonin, B. Hamar, and M. A. McGeehin. 1995. Removing the smoking confounder from blood volatile organic compounds measurements. Environ. Res. 71:39–45. doi:10.1006/enrs.1995.1065.
- Aylward, L. L., C. R. Kirman, B. C. Blount, and S. M. Hays. 2010. Chemical-specific screening criteria for interpretation of biomonitoring data for volatile organic compounds (VOCs) – Application of steady-state PBPK model solutions. Regul. Toxicol. Pharmacol. 58:33–44. doi:10.1016/j.yrtph.2010.05.011.
- Aylward, L. L., C. R. Kirman, R. Schoeny, C. J. Portier, and S. M. Hays. 2013. Evaluation of biomonitoring data from the CDC national exposure report in a risk assessment context: Perspectives across chemicals. Environ. Health Perspect. 121:287–94. doi:10.1289/ehp.1205740.
- Bagirzadeh, L., J. Beach, and N. Cherry. 2006. Neuropsychological effects of styrene exposure: Review of literature published 1990–2003. SIRC Rev. 10:70–100.
- Ban, M., D. Hettich, and P. Bonnet. 2003. Effect of inhaled industrial chemicals on systemic and local immune response. Toxicology 184:41–50.
- Bari, M. A., W. B. Kindzierski, A. J. Wheeler, M.-È. Héroux, and L. A. Wallace. 2015. Source apportionment of indoor and outdoor volatile organic compounds at homes in Edmonton, Canada. Build. Environ. 90:114–24. doi:10.1016/j.buildenv.2015.03.023.
- Batterman, S., C. Jia, and G. Hatzivasilis. 2007. Migration of volatile organic compounds from attached garages to residences: A major exposure source. Environ. Res. 104:224–40. doi:10.1016/j.envres.2007.01.008.
- Becker, R. A., V. Dellarco, J. Seed, J. M. Kronenberg, B. Meek, J. Foreman, C. Palermo, C. Kirman, I. Linkov, R. Schoeny, et al. 2017. Quantitative weight of evidence to assess confidence in potential modes of action. Regul. Toxicol. Pharmacol. 86:205–20. doi:10.1016/j.yrtph.2017.02.017.
- Begley, T., L. Castle, A. Feigenbaum, R. Franz, K. Hinrichs, T. Lickly, P. Mercea, M. Milana, A. O’Brien, S. Rebre, et al. 2005. Evaluation of migration models that might be used in support of regulations for food-contact plastics. Food Addit. Contam. 22:73–90. doi:10.1080/02652030400028035.
- Beliles, R. P., J. H. Butala, C. R. Stack, and S. Makris. 1985. Chronic toxicity and three-generation reproduction study of styrene monomer in the drinking water of rats. Fundam. Appl. Toxicol. 5:855–68. doi:10.1016/0272-0590(85)90168-X.
- Benignus, V. A., A. M. Geller, W. K. Boyes, and P. J. Bushnell. 2005. Human neurobehavioral effects of long-term exposure to styrene: A meta-analysis. Environ. Health Perspect. 113:532–38. doi:10.1289/ehp.7518.
- Bergamaschi, E., A. Mutti, S. Cavazzini, M. V. Vettori, F. S. Renzulli, and I. Franchini. 1996. Peripheral markers of neurochemical effects among styrene exposed workers. Neurotoxicology 17:753–60.
- Bergamaschi, E., A. Smargiassi, A. Mutti, I. Franchini, and R. Lucchini. 1995. Immunological changes among workers occupationally exposed to styrene. Int. Arch. Occup. Environ. Health. 67:165–71.
- Bergamaschi, E., A. Smargiassi, A. Mutti, S. Cavazzini, M. V. Vettori, R. Alinovi, I. Franchini, and D. Mergler. 1997. Peripheral markers of catecholamine dysfunction and symptoms of neurotoxicity among styrene-exposed workers. Int. Arch. Occup. Environ. Health. 69:209–14. doi:10.1007/s004200050138.
- Berode, M., P. O. Droz, and M. Guillemin. 1985. Human exposure to styrene .6. Percutaneous-absorption in human volunteers. Int. Arch. Occup. Environ. Health. 55:331–36.
- Bertke, S. J., J. H. Yiin, and R. D. Daniels. 2018. Cancer mortality with an exposure response analysis among styrene-exposed workers in the reinforced plastics boatbuilding industry. Am. J. Ind. Med. 61:566–71. doi:10.1002/ajim.22853.
- Betancur-Sánchez, A. M., E. M. Vásquez-Trespalacios, and C. Sardi-Correa. 2017. Impaired colour vision in workers exposed to organic solvents: A systematic review. Arch. Soc. Esp. Oftalmol. 92:12–18. doi:10.1016/j.oftale.2016.09.003.
- Bhunia, K., S. S. Sablani, J. Tang, and B. Rasco. 2013. Migration of chemical compounds from packaging polymers during microwave, conventional heat treatment, and storage. Compr. Rev. Food Sci. F. 12:523–45. doi:10.1111/1541-4337.12028.
- Biedermann, M., K. Grob, and G. Morchio. 1995. On the origin of benzene, toluene, ethylbenzene, and the xylenes in virgin olive oil. Z. Lebensm. Unters. Forsch. 200:266–72.
- Bigbee, W. L., S. G. Grant, R. G. Langlois, R. H. Jensen, A. Anttila, P. Pfaffli, K. Pekari, and H. Norppa. 1996. Glycophorin a somatic cell mutation frequencies in Finnish reinforced plastics workers exposed to styrene. Cancer Epidemiol. Biomarkers Prev. 5:801–10.
- BKH. 2000. European Commission DG ENV. Towards the establishment of a priority list of substances for further evaluation of their role in endocrine disruption – Preparation of a candidate list of substances as a basis for priority setting, BKH Consulting Engineers, Delft, The Netherlands.
- Blanc-Lapierre, A., J. F. Sauve, and M. E. Parent. 2018. Occupational exposure to benzene, toluene, xylene and styrene and risk of prostate cancer in a population-based study. Occup. Environ. Med. 75:562–72. doi:10.1136/oemed-2018-105058.
- Blount, B. C., D. O. McElprang, D. M. Chambers, M. G. Waterhouse, K. S. Squibb, and J. S. Lakind. 2010. Methodology for collecting, storing, and analyzing human milk for volatile organic compounds. J. Environ. Monit. 12:1265–73. doi:10.1039/b927022a.
- Bonanni, R. C., M. P. Gatto, E. Paci, A. Gordiani, M. Gherardi, and G. Tranfo. 2015. Biomonitoring for exposure assessment to styrene in the fibreglass reinforced plastic industry: Determinants and interferents. Ann. Occup. Hyg. 59:1000–11. doi:10.1093/annhyg/mev047.
- Bond, G. G., K. M. Bodner, G. W. Olsen, and R. R. Cook. 1992. Mortality among workers engaged in the development or manufacture of styrene-based products – An update. Scand. J. Work Environ. Health. 18:145–54. doi:10.5271/sjweh.1594.
- Bonde, J. P., M. Joffe, G. Danscher, P. Apostoli, L. Bisanti, A. Giwercman, H. A. Kolstad, P. Thonneau, N. Roeleveld, and M. Vanhoorne. 1999. Objectives, designs and populations of the European Asclepios study on occupational hazards to male reproductive capability. Scand. J. Work Environ. Health. 25 (Suppl 1):49–61.
- Boyle, E., S. Viet, D. Wright, L. Merrill, K. Alwis, B. Blount, M. Mortensen, J. Moye, and M. Dellarco. 2016. Assessment of exposure to VOCs among pregnant women in the national children’s study. Int. J. Env. Res. Public Health. 13:376. doi:10.3390/ijerph13040376.
- Brooks, S. M., L. Anderson, E. Emmett, A. Carson, J. Y. Tsay, V. Elia, R. Buncher, and R. Karbowsky. 1980. The effects of protective equipment on styrene exposure in workers in the reinforced-plastics industry. Arch. Environ. Health 35:287–94.
- Brown, N. A. 1991. Reproductive and developmental toxicity of styrene. Reprod. Toxicol. 5:3–29. doi:10.1016/0890-6238(91)90106-P.
- Brown, N. A., J. C. Lamb, S. M. Brown, and B. H. Neal. 2000. A review of the developmental and reproductive toxicity of styrene. Reg. Toxicol. Pharmacol. 32:228–47. doi:10.1006/rtph.2000.1406.
- Brown, S. K. 1999. Assessment of pollutant emissions from dry-process photocopiers. Indoor Air 9:259–67.
- Brugnone, F., L. Perbellini, G. Z. Wang, G. Maranelli, E. Raineri, E. Derosa, C. Saletti, C. Soave, and L. Romeo. 1993. Blood styrene concentrations in a normal population and in exposed workers 16 hours after the end of the workshift. Int. Arch. Occup. Environ. Health. 65:125–30.
- Buckley, T., D. Payne-Sturges, S. Kim, and V. Weaver 2005. VOC exposure in an industry-impacted community. NUATRC Research Report Number 4.
- Budroni, M., O. Sechi, R. Cesaraccio, D. Pirino, A. Fadda, S. Grottin, M. V. Flore, P. Sale, G. Satta, A. Cossu, et al. 2010. Cancer incidence among petrochemical workers in the Porto Torres industrial area, 1990-2006. Med. Lav. 101:189–98. (Italian).
- Bulka, C., L. J. Nastoupil, J. L. Koff, L. Bernal-Mizrachi, K. C. Ward, J. N. Williams, A. R. Bayakly, J. M. Switchenko, L. A. Waller, and C. R. Flowers. 2016. Relations between residential proximity to EPA-designated toxic release sites and diffuse large B-cell lymphoma incidence. South. Med. J. 109:606–14. doi:10.14423/SMJ.0000000000000545.
- Cabrera-Perez, D., D. Taraborrelli, R. Sander, and A. Pozzer. 2016. Global atmospheric budget of simple monocyclic aromatic compounds. Atmos. Chem. Phys. 16:6931–47. doi:10.5194/acp-16-6931-2016.
- Calabrese, G., A. Martini, G. Sessa, M. Cellini, G. B. Bartolucci, G. Marcuzzo, and E. De Rosa. 1996. Otoneurological study in workers exposed to styrene in the fiberglass industry. Int. Arch. Occup. Environ. Health. 68:219–23.
- California Air Resources Board (CARB). 2011. Quantifying pollutant emissions from office equipment: A concern in energy-efficient buildings. CARB, Sacramento, CA.
- California Environmental Protection Agency (Cal EPA). 1999. Common indoor sources of volatile organic compounds: Emission rates and techniques for reducing consumer exposures. Final Report, Berkeley, CA.
- California Environmental Protection Agency (CalEPA). 2010. Public health goals for chemicals in drinking water. Styrene, Office of Environmental Health Hazard Assessment (OEHHA).
- Campagna, D., F. Gobba, D. Mergler, T. Moreau, C. Galassi, A. Cavalleri, and G. Huel. 1996. Color vision loss among styrene-exposed workers neurotoxicological threshold assessment. Neurotoxicology 17:367–73.
- Campagnolo, D., D. E. Saraga, A. Cattaneo, A. Spinazzè, C. Mandin, R. Mabilia, E. Perreca, I. Sakellaris, N. Canha, and V. G. Mihucz. 2017. VOCs and aldehydes source identification in European office buildings – The OFFICAIR study. Build. Environ. 115:18–24. doi:10.1016/j.buildenv.2017.01.009.
- Campo, P., B. Pouyatos, R. Lataye, and G. Morel. 2003. Is the aged rat ear more susceptible to noise or styrene damage than the young ear? Noise Health 5:1–18.
- Campo, P., G. Loquet, V. Blachère, and M. Roure. 1999. Toluene and styrene intoxication route in the rat cochlea. Neurotoxicol. Teratol. 21:427–34.
- Campo, P., and K. Maguin. 2007. Solvent-induced hearing loss: Mechanisms and prevention strategy. Int. J. Occup. Med. Environ. Health. 20:265–70. doi:10.2478/v10001-007-0031-3.
- Campo, P., K. Maguin, and R. Lataye. 2007. Effects of aromatic solvents on acoustic reflexes mediated by central auditory pathways. Toxicol. Sci. 99:582–90. doi:10.1093/toxsci/kfm180.
- Campo, P., R. Lataye, B. Cossec, V. Villette, M. Roure, and C. Barthelemy. 1998. Combined effects of simultaneous exposure to toluene and ethanol on auditory function in rats. Neurotoxicol. Teratol. 20:321–32.
- Campo, P., R. Lataye, G. Loquet, and P. Bonnet. 2001. Styrene-induced hearing loss: A membrane insult. Hearing Res. 154:170–80. doi:10.1016/S0378-5955(01)00218-0.
- Campo, P., T. Venet, A. Thomas, C. Cour, C. Brochard, and F. Cosnier. 2014. Neuropharmacological and cochleotoxic effects of styrene. Consequences on noise exposures. Neurotoxicol. Teratol. 44:113–20. doi:10.1016/j.ntt.2014.05.009.
- Campo, P., T. Venet, C. Rumeau, A. Thomas, B. Rieger, C. Cour, F. Cosnier, and C. Parietti-Winkler. 2011. Impact of noise or styrene exposure on the kinetics of presbycusis. Hearing Res. 280:122–32. doi:10.1016/j.heares.2011.04.016.
- Cantor, K. P., P. A. Stewart, L. A. Brinton, and M. Dosemeci. 1995. Occupational exposures and female breast cancer mortality in the United States. J. Occup. Environ. Med. 37:336–48. doi:10.1097/00043764-199503000-00011.
- Cao, X. L., M. Sparling, L. Pelletier, and R. Dabeka. 2018. Styrene in foods and dietary exposure estimates. Food Addit. Contam. Part A. 35:2045–51. doi:10.1080/19440049.2018.1512760.
- Cao, X.-L., M. Sparling, and R. Dabeka. 2016. Occurrence of 13 volatile organic compounds in foods from the Canadian total diet study. Food Addit. Contam. Part A. 33:373–82.
- Capella, K. M., K. Roland, N. Geldner, B. Rey deCastro, V. R. De Jesús, D. van Bemmel, and B. C. Blount. 2019. Ethylbenzene and styrene exposure in the United States based on urinary mandelic acid and phenylglyoxylic acid: NHANES 2005-2006 and 2011-2012. Environ. Res. 171:101–10. doi:10.1016/j.envres.2019.01.018.
- Cappaert, N. L. M., S. F. Klis, A. B. Baretta, H. Muijser, and G. F. Smoorenburg. 2000. Ehtylbenzene-induced otototoxicity in rats: A dose-dependent mid-frequency hearing loss. J. Assoc. Res. Otolaryngol. 1:292–99. doi:10.1007/s101620010050.
- Cappaert, N. L. M., S. F. L. Klis, H. Muijser, B. M. Kulig, L. C. Ravensberg, and G. F. Smoorenburg. 2002. Differential susceptibility of rats and guinea pigs to the ototoxic effects of ethyl benzene. Neurotoxicol. Teratol. 24:503–10.
- Carlson, G. P. 2004. Influence of selected inhibitors on the metabolism of the styrene metabolite 4-vinylphenol in wild-type and CYP2E1 knockout mice. J. Toxicol. Environ. Health A. 67:905–09. doi:10.1080/15287390490443696.
- Carter, J. M., W. W. Lapham, and J. S. Zogorski. 2008. Occurrence of volatile organic compounds in aquifers of the United States. J. Am. Water Resour. Assoc. 44:399–416. doi:10.1111/j.1752-1688.2008.00170.x.
- Castillo, L., M. Baldwin, M. P. Sassine, and D. Mergler. 2001. Cumulative exposure to styrene and visual functions. Am. J. Ind. Med. 39:351–60.
- Centers for Disease Control and Prevention (CDC). 2017. National biomonitoring progam styrene factsheet. Accessed April 7, 2017. https://www.cdc.gov/biomonitoring/Styrene_FactSheet.html.
- Centers for Disease Control and Prevention (CDC). 2019. Fourth national report on human exposure to environmental chemicals updated tables, January 2019, Volume one. U.S. Department of Health and Human Services.
- Chambers, D. M., J. M. Ocariz, M. F. McGuirk, and B. C. Blount. 2011. Impact of cigarette smoking on Volatile Organic Compound (VOC) blood levels in the U.S. Population: NHANES 2003–2004. Environ. Int. 37:1321–28. doi:10.1016/j.envint.2011.05.016.
- Chamkhia, N., M. Sakly, and K. B. Rhouma. 2006. Male reproductive impacts of styrene in rat. Toxicol. Ind. Health. 22:349–55. doi:10.1177/0748233706071739.
- Charles, S. M., C. Jia, S. A. Batterman, and C. Godwin. 2008. VOC and particulate emissions from commercial cigarettes: Analysis of 2,5-DMF as an ETS tracer. Environ. Sci. Technol. 42:1324–31.
- Charles, S. M., S. A. Batterman, and C. Jia. 2007. Composition and emissions of VOCs in main- and side-stream smoke of research cigarettes. Atmos. Environ. 41:5371–84. doi:10.1016/j.atmosenv.2007.02.020.
- Chen, G., and D. Henderson. 2011. Ototoxicity of styrene. J .Otol. 6:1–9. doi:10.1016/S1672-2930(11)50016-9.
- Chen, G. D., and D. Henderson. 2009. Cochlear injuries induced by the combined exposure to noise and styrene. Hearing Res. 254:25–33. doi:10.1016/j.heares.2009.04.005.
- Chen, G.-D., C. Tanaka, and D. Henderson. 2008. Relation between outer hair cell loss and hearing loss in rats exposed to styrene. Hearing Res. 243:28–34. doi:10.1016/j.heares.2008.05.008.
- Chen, G.-D., L.-H. Chi, P. J. Kostyniak, and D. Henderson. 2007. Styrene induced alterations in biomarkers of exposure and effects in the cochlea: Mechanisms of hearing loss. Toxicol. Sci. 98:167–77. doi:10.1093/toxsci/kfm078.
- Chernoff, N., R. W. Setzer, D. B. Miller, M. B. Rosen, and J. M. Rogers. 1990. Effects of chemically induced maternal toxicity on prenatal development in the rat. Teratology 42:651–58. doi:10.1002/tera.1420420610.
- Chiaramello, E., S. Moriconi, and G. Tognola. 2014. Extraction of cochlear non-linearities with the bispectral analysis: An applicaton to TEOAEs in styrene-exposed workers. Meth. Inf. Med. 53:364–70. doi:10.3414/ME14-01-0004.
- Chien, Y.-C., C.-P. Chang, and -Z.-Z. Liu. 2011. Volatile organics off-gassed among tobacco-exposed clothing fabrics. J. Hazard. Mater. 193:139–48. doi:10.1016/j.jhazmat.2011.07.042.
- Chin, J. Y., C. Godwin, E. Parker, T. Robins, T. Lewis, P. Harbin, and S. Batterman. 2014. Levels and sources of volatile organic compounds in homes of children with asthma. Indoor Air 24:403–15. doi:10.1111/ina.12086.
- Cho, S. I., A. I. Damokosh, L. M. Ryan, D. Chen, Y. A. Hu, T. J. Smith, D. C. Christiani, and X. Xu. 2001. Effects of exposure to organic solvents on menstrual cycle length. J. Occup. Environ. Med. 43:567–75.
- Choi, A., J. M. Braun, G. D. Papandonatos, and P. B. Greenberg. 2017. Occupational styrene exposure and acquired dyschromatopsia: A systematic review and meta-analysis. Am. J. Ind. Med. 60:930–46. doi:10.1002/ajim.22766.
- Choi, A.-R., S.-G. Im, M.-Y. Lee, and S.-H. Lee. 2019. Evaluation of the suitability of establishing biological exposure indices of styrene. Saf. Health Work 10:103–08. doi:10.1016/j.shaw.2018.07.001.
- Christensen, M. S., J. Hansen, C. H. Ramlau-Hansen, G. Toft, and H. Kolstad. 2017. Cancer incidence in workers exposed to styrene in the Danish reinforced plastics industry 1968-2012. Epidemiology 28:300–10. doi:10.1097/EDE.0000000000000608.
- Christensen, M. S., J. M. Vestergaard, F. d’Amore, J. S. Gorlov, G. Toft, C. H. Ramlau-Hansen, Z. A. Stokholm, I. B. Iversen, M. S. Nissen, and H. A. Kolstad. 2018. Styrene exposure and risk of lymphohematopoietic malignancies in 73,036 reinforced plastics workers. Epidemiology 29:342–51. doi:10.1097/EDE.0000000000000819.
- Chun, Y. J., H. M. Lee, J. H. Han, and Y. K. Oh. 2005. Styrene-mediated oxidative stresses in rat sperm cells. J. Toxicol. Pub. Health. 21:129–35.
- Churchill, J. E., D. L. Ashley, and W. E. Kaye. 2001. Recent chemical exposures and blood volatile organic compounds in a large population-based sample. Arch. Environ. Health. 56:157–66. doi:10.1080/00039890109604068.
- Cocco, P., A. t’Mannetje, D. Fadda, M. Melis, N. Becker, E. S. de Sanjos, L. Foretova, J. Mareckova, A. Staines, S. Kleefeld, et al. 2010. Occupational exposure to solvents and risk of lymphoma subtypes: Results from the Epilymph case-control study. Occup. Environ. Med. 67:341–47. doi:10.1136/oem.2009.046839.
- Coggon, D., C. Osmond, B. Pannett, S. Simmonds, P. D. Winter, and E. D. Acheson. 1987. Mortality of workers exposed to styrene in the manufacture of glass-reinforced plastics. Scand. J. Work. Environ. Health 13:94–99.
- Coggon, D., G. Ntani, E. C. Harris, and K. T. Palmer. 2015. Risk of cancer in workers exposed to styrene at eight British companies making glass-reinforced plastics. Occup. Environ. Med. 72:165–70. doi:10.1136/oemed-2014-102382.
- Cohen, J. T., G. Carlson, G. Charnley, D. Coggon, E. Delzell, J. D. Graham, H. Greim, D. Krewski, M. Medinsky, R. Monson, et al. 2002. A comprehensive evaluation of the potential health risks associated with occupational and environmental exposure to styrene. J. Toxicol. Environ. Health B. 5:1–263. doi:10.1080/10937400252972162.
- Collins, C. D., J. N. B. Bell, and C. Crews. 2000. Benzene accumulation in horticultural crops. Chemosphere 40:109–14.
- Collins, J., and M. Moore. 2019. A meta-analysis of epidemiologic studies of occupationally exposed styrene workers and micronuclei levels. Mutat. Res. Genet. Toxicol. Environ. Mutagen. 837:15–28. doi:10.1016/j.mrgentox.2018.08.011.
- Collins, J. J., and E. Delzell. 2018. A systematic review of epidemiological studies of styrene and cancer. Crit. Rev. Toxicol. 48:443–70. doi:10.1080/10408444.2018.1445700.
- Collins, J. J., K. M. Bodner, and J. S. Bus. 2013. Cancer mortality of workers exposed to styrene in the U.S. reinforced plastics and composite industry. Epidemiology 24:195–203. doi:10.1097/EDE.0b013e318281a30f.
- Cometto-Muniz, J. E., and M. H. Abraham. 2015. Compilation and analysis of types and concentrations of airborne chemicals measured in various indoor and outdoor human environments. Chemosphere 127:70–86. doi:10.1016/j.chemosphere.2014.12.089.
- Compton-Quintana, P. J., R. H. Jensen, W. L. Bigbee, S. G. Grant, R. G. Langlois, M. T. Smith, and S. M. Rappaport. 1993. Use of the glycophorin a human mutation assay to study workers exposed to styrene. Environ. Health Perspect. 99:297–301. doi:10.1289/ehp.9399297.
- Conti, B., C. Maltoni, G. Perino, and A. Ciliberti. 1988. Long-term carcinogenicity bioassays on styrene administered by inhalation, ingestion and injection and styrene oxide administered by ingestion in Sprague-Dawley rats, and para-methylstyrene administered by ingestion in Sprague- Dawley rats and Swiss mice. Ann. N Y Acad. Sci. 534:203–34. doi:10.1111/j.1749-6632.1988.tb30112.x.
- Costa, S., M. Ceppi, C. Costa, S. Silva, C. Pereira, B. Laffon, S. Bonassi, and J. P. Teixeira. 2016. The cytokinesis-block micronucleus (CBMN) assay in human populations exposed to styrene: A systematic review and meta-analysis. Mutat. Res. 770:92–105. doi:10.1016/j.mrrev.2016.06.003.
- Costantini, A. S., A. Benvenuti, P. Vineis, D. Kriebel, R. Tumino, V. Ramazzotti, S. Rodella, E. Stagnaro, P. Crosignani, D. Amadori, et al. 2008. Risk of leukemia and multiple myeloma associated with exposure to benzene and other organic solvents: Evidence from the Italian multicenter case-control study. Am. J. Ind. Med. 51:803–11. doi:10.1002/ajim.20592.
- Coyle, Y. M., L. S. Hynan, D. M. Euhus, and A. T. Minhajuddin. 2005. An ecological study of the association of environmental chemicals on breast cancer incidence in Texas. Breast Cancer Res. Treat. 92:107–14. doi:10.1007/s10549-004-8268-z.
- Creta, M., H. Moldovan, K. Poels, S. Voidazan, L. Godderis, R.-C. Duca, and J. Vanoirbeek. 2018. Integrated evaluation of solvent exposure in an occupational setting: Air, dermal and bio-monitoring. Toxicol. Lett. 298:150–57. doi:10.1016/j.toxlet.2018.07.049.
- Cruzan, G., G. P. Carlson, K. A. Johnson, L. S. Andrews, M. I. Banton, C. Bevan, and J. R. Cushman. 2002. Styrene respiratory tract toxicity and mouse lung tumors are mediated by CYP2F-generated metabolites. Regul. Toxicol. Pharmacol. 35:308–19. doi:10.1006/rtph.2002.1545.
- Cruzan, G., J. Bus, J. Hotchkiss, J. Harkema, M. Banton, and S. Sarang. 2012. CYP2F2-generated metabolites, not styrene oxide, are a key event mediating the mode of action of styrene-induced mouse lung tumors. Regul. Toxicol. Pharmacol. 62:214–20. doi:10.1016/j.yrtph.2011.10.007.
- Cruzan, G., J. Bus, J. Hotchkiss, R. Sura, C. Moore, G. Yost, M. Banton, and S. Sarang. 2013. Studies of styrene, styrene oxide and 4-hydroxystyrene toxicity in CYP2F2 knockout and CYP2F1 humanized mice support lack of human relevance for mouse lung tumors. Regul. Toxicol. Pharmacol. 66:24–29. doi:10.1016/j.yrtph.2013.02.008.
- Cruzan, G., J. Bus, M. Banton, R. Gingell, and G. Carlson. 2009. Mouse lung tumors from CYP2F2-mediated cytotoxic metabolism: An endpoint/toxic response where data from multiple chemicals converge to support a mode of action. Regul. Toxicol. Pharmacol. 55:205–18. doi:10.1016/j.yrtph.2009.07.002.
- Cruzan, G., J. R. Cushman, L. S. Andrews, G. C. Granville, K. A. Johnson, C. Bevan, C. J. Hardy, D. W. Coombs, P. A. Mullins, and W. R. Brown. 2001. Chronic toxicity/oncogenicity study of styrene in CD-1 mice by inhalation exposure for 104 weeks. J. Appl. Toxicol. 21:185–98. doi:10.1002/(ISSN)1099-1263.
- Cruzan, G., J. R. Cushman, L. S. Andrews, G. C. Granville, K. A. Johnson, C. J. Hardy, D. W. Coombs, P. A. Mullins, and W. R. Brown. 1998. Chronic toxicity/oncogenicity study of styrene in CD rats by inhalation exposure for 104 weeks. Toxicol. Sci. 46:266–81. doi:10.1093/toxsci/46.2.266.
- Cruzan, G., J. R. Cushman, L. S. Andrews, G. C. Granville, R. R. Miller, C. J. Hardy, D. W. Cooms, and P. A. Mullins. 1997. Subchronic studies of styrene in CD rats and CD-1 mice. Fundam. Appl. Toxicol. 35:152–65.
- Cruzan, G., J. S. Bus, M. E. Andersen, G. P. Carlson, M. I. Banton, S. S. Sarang, and R. Waites. 2018. Based on an analysis of mode of action, styrene-induced mouse lung tumors are not a human cancer concern. Regul. Toxicol. Pharmacol. 95:17–28. doi:10.1016/j.yrtph.2018.02.010.
- Cruzan, G., J. S. Bus, M. I. Banton, S. Sarang, R. Waites, D. B. Layko, J. Raymond, D. Dodd, and M. E. Andersen. 2017. Complete attenuation of mouse lung cell proliferation and tumorigenicity in CYP2F2 knockout and CYP2F1 humanized mice exposed to inhaled styrene for up to 2 years supports a lack of human relevance. Toxicol. Sci. 159:413–21. doi:10.1093/toxsci/kfx141.
- Cruzan, G., W. D. Faber, K. A. Johnson, L. S. Roberts, J. Hellwig, E. Carney, J. T. Yarrington, and D. G. Stump. 2005a. Two generation reproductive study of styrene by inhalation in Crl-CD rats. Birth Defects Res 74:211–20. doi:10.1002/bdrb.20041.
- Cruzan, G., W. D. Faber, K. A. Johnson, L. S. Roberts, J. Maurissen, M. J. Beck, A. Radovsky, D. G. Stump, and J. Buelke-Sam. 2005b. Developmental neurotoxicity study of styrene by inhalation in Crl-CD rats. Birth Defects Res 74:221–32. doi:10.1002/bdrb.20042.
- Csanady, G. A., W. Kessler, H. D. Hoffmann, and J. G. Filser. 2003. A toxicokinetic model for styrene and its metabolite styrene-7,8-oxide in mouse, rat and human with special emphasis on the lung. Toxicol. Lett. 138:75–102.
- Daston, G. P., G. J. Overmann, M. W. Taubeneck, L. D. Lehman-McKeeman, J. M. Rogers, and C. L. Keen. 1991. The role of metallothionein induction and altered zinc status in maternally mediated developmental toxicity: Comparison of the effects of urethane and styrene in rats. Toxicol. Appl. Pharmacol. 110:450–63.
- Date, K., K. Ohno, Y. Azuma, S. Hirano, K. Kobayashi, Y. Sakurai, Y. Nobuhara, and T. Yamada. 2002. Endocrine-disrupting effects of styrene oligomers that migrated from polystyrene containers into food. Food Chem. Toxicol. 40:65–75.
- Davis, R. R., W. J. Murphy, J. E. Snawder, C. A. F. Striley, D. Henderson, A. Khan, and E. F. Krieg. 2002. Susceptibility to the ototoxic properties of toluene is species specific. Hearing Res. 166:24–32. doi:10.1016/S0378-5955(02)00280-0.
- Dawson, H. E., and T. McAlary. 2009. A compilation of statistics for VOCs from post-1990 indoor air concentration studies in North American residences unaffected by subsurface vapor intrusion. Ground Water Monit. Rem. 29:60–69. doi:10.1111/j.1745-6592.2008.01215.x.
- Deeb, S. S. 2004. Molecular genetics of colour vision deficiencies. Clin. Exp. Optomol. 87:224–29. doi:10.1111/j.1444-0938.2004.tb05052.x.
- Delzell, E., M. Macaluso, N. Sathiakumar, and R. Matthews. 2001. Leukemia and exposure to 1,3-butadiene, styrene and dimethyldithiocarbamate among workers in the synthetic rubber industry. Chem. Biol. Interact. 135-136:515–34. doi:10.1016/S0009-2797(01)00223-X.
- Delzell, E., N. Sathiakumar, J. Graff, M. Macaluso, G. Maldonado, and R. Matthews. 2006. Health effects institute. An updated study of mortality among North American synthetic rubber industry workers. Res. Rep. Health Eff. Inst. 132:1–63. discussion 65-74.
- Dematteo, R., M. M. Keith, J. T. Brophy, A. Wordsworth, A. E. Watterson, M. Beck, A. Rochon, F. Michael, G. Jyoti, P. Magali, et al. 2013. Chemical exposures of women workers in the plastics industry with particular reference to breast cancer and reproductive hazards. New Solut. 22:427–48. doi:10.2190/NS.22.4.d.
- Derbez, M., G. Wyart, E. Le Ponner, O. Ramalho, J. Ribéron, and C. Mandin. 2018. Indoor air quality in energy-efficient dwellings: Levels and sources of pollutants. Indoor Air 28:318–38. doi:10.1111/ina.12431.
- Destaillats, H., R. L. Maddalena, B. C. Singer, A. T. Hodgson, and T. E. McKone. 2008. Indoor pollutants emitted by office equipment: A review of reported data and information needs. Atmos. Environ. 42:1371–88. doi:10.1016/j.atmosenv.2007.10.080.
- Dinh, T.-V., S.-Y. Kim, Y.-S. Son, I.-Y. Choi, S.-R. Park, Y. Sunwoo, and J.-C. Kim. 2015. Emission characteristics of VOCs emitted from consumer and commercial products and their ozone formation potential. Environ. Sci. Pollut. Res. 22:9345–55. doi:10.1007/s11356-015-4092-8.
- Djamgoz, M. B. A., M. W. Hankins, J. Hirano, and S. N. Archer. 1997. Neurobiology of retinal dopamine in relation to degenerative states of the tissue. Vision Res. 37:3509–29. doi:10.1016/S0042-6989(97)00129-6.
- Dogra, R. K., D. Khanna, S. N. Srivastava, L. J. Shukla, and R. Shanker. 1989. Styrene-induced immunomodulation in mice. Int. J. Immunopharmacol. 11:577–86. doi:10.1016/0192-0561(89)90188-4.
- Dogra, R. K., K. Chandra, S. Chandra, S. Gupta, S. Khanna, S. N. Srivastava, L. J. Shukla, J. C. KJatiyar, and R. Shanker. 1992. Host resistance assays as predictive models in styrene immunomodulation. Int. J. Immunopharmacol. 14:1003–09. doi:10.1016/0192-0561(92)90144-A.
- Dogra, R. K. S., S. Khanna, S. N. Srivastava, L. J. Shukla, K. Chandra, G. Saxena, and R. Shanker. 1993. Immunomodulation due to coexposure to styrene and dioctyl phthalate in mice. Immunopharmacol. Immunotoxicol. 15:491–514. doi:10.3109/08923979309035242.
- Doherty, B. T., R. K. Kwok, M. D. Curry, C. Ekenga, D. Chambers, D. P. Sandler, and L. S. Engel. 2017. Associations between blood BTEXS concentrations and hematologic parameters among adult residents of the US Gulf States. Environ. Res. 156:579–87. doi:10.1016/j.envres.2017.03.048.
- Duffy, E., and M. J. Gibney. 2007. Use of a food-consumption database with packaging information to estimate exposure to food-packaging migrants: Expoxidized soybean oil and styrene monomer. Food Addit. Contam. 24:216–25. doi:10.1080/02652030600977833.
- Dumas, S., M. E. Parent, J. Siemiatycki, and J. Brisson. 2000. Rectal cancer and occupational risk factors: A hypothesis-generating, exposure-based case-control study. Int. J. Cancer. 87:874–79.
- Dwyer-Lindgren, L., A. H. Mokdad, T. Srebotnjak, A. D. Flaxman, G. M. Hansen, and C. J. Murray. 2014. Cigarette smoking prevalence in US counties: 1996-2012. Popul. Health Metr. 12:5. doi:10.1186/1478-7954-12-5.
- Edwards, R. D., J. Jurvelin, K. Koistinen, K. Saarela, and M. Jantunen. 2001a. VOC source identification from personal and residential indoor, outdoor and workplace microenvironment samples in EXPOLIS-Helsinki, Finland. Atmos. Environ. 35:4829–41. doi:10.1016/S1352-2310(01)00271-0.
- Edwards, R. D., J. Jurvelin, K. Saarela, and M. Jantunen. 2001b. VOC concentrations measured in personal samples and residential indoor, outdoor and workplace microenvironments in EXPOLIS-Helsinki, Finland. Atmos. Environ. 35:4531–43. doi:10.1016/S1352-2310(01)00230-8.
- Egger, M., G. Davey Smith, M. Schneider, and C. Minder. 1997. Bias in meta-analysis detected by a simple, graphical test. Br. Med. J. 315:629–34. doi:10.1136/bmj.315.7109.629.
- Ehret-Henry, J., V. Ducruet, A. Luciani, and A. Feigenbaum. 1994. Styrene and ethylbenzene migration from polystyrene into dairy products by dynamic purge-and trap gas chromatography. J. Food Sci. 59:990–1001. doi:10.1111/j.1365-2621.1994.tb08174.x.
- Engstrom, K., H. Harkonen, K. Pekari, and J. Rantanen. 1978. Evaluation of occupational styrene exposure by ambient air and urine analysis. Scand. J. Work Environ. Health. 7 (Suppl. 2):121–23. doi:10.5271/sjweh.2755.
- Environmental Working Group (EWG). 2017. EWG’s Tap water database. Styrene. https://www.ewg.org/tapwater/contaminant.php?contamcode=2996#.WZDsfFGGOUk.
- Eriksson, K., and L. Wiklund. 2004. Dermal exposure to styrene in the fibreglass reinforced plastics industry. Ann. Occup. Hyg. 48:203–08. doi:10.1093/annhyg/meh012.
- European Centre for Ecotoxicology and Toxicology of Chemicals (ECETOC). 2003. TR86 – derivation of assessment factors for human health risk assessment, ECETOC, Brussels, Belgium.
- European Centre for Ecotoxicology and Toxicology of Chemicals (ECETOC). 2010. TR110 – guidance on assessment factors to derive a DNEL, ECETOC, Brussels, Belgium.
- European Chemicals Bureau (ECB). 2002. European union risk assessment report. Styrene Part 1 – Environment (CAS No: 100-42-5, EINECS No: 202-851-5), Luxembourg Institute for Health and Consumer Protection.
- Fechter, L. 1999. Mechanisms of ototoxicity by chemical contaminants: Prospects for intervention. Noise Health 1:10–24.
- Fetoni, A. R., R. Rolesi, F. Paciello, S. L. M. Eramo, C. Grassi, D. Troiani, and G. Paludetti. 2016. Styrene enhances the noise induced oxidative stress in the cochlea and affects differently mechanosensory and supporting cells. Free Radic. Biol. Med. 101:211–25. doi:10.1016/j.freeradbiomed.2016.10.014.
- Filser, J. G., H. Greim, W. Kessler, U. Schwegler, X. Jiang, and H. D. Hoffmann 1992. Special report No 3. Studies on toxicokinetics and macromolecular binding of styrene. Vol. 1 Study on the kinetics of styrene and styrene oxide in rats and mice. European Center for Ecotoxicology and Toxicology of Chemicals, Brussels.
- Firsov, M. L., and L. A. Astakhova. 2016. The role of dopamine in controlling retinal photoreceptor function in vertebrates. Neurosci. Behav. Physiol. 46:138–45. doi:10.1007/s11055-015-0210-9.
- Fisher, J., D. Mahle, L. Bankston, R. Greene, and J. Gearhart. 1997. Lactational transfer of volatile chemicals in breast milk. Am. Ind. Hyg .Assoc. J. 58:425–31. doi:10.1080/15428119791012667.
- Fleming-Jones, M. E., and R. E. Smith. 2003. Volatile organic compounds in foods: A five year study. J. Agric. Food Chem. 51:8120–27. doi:10.1021/jf0303159.
- Flodin, U., M. Fredriksson, B. Persson, L. Hardell, and O. Axelson. 1986. Background radiation, electrical work, and some other exposures associated with acute myeloid leukemia in a case-referent study. Arch. Environ. Health. 41:77–84. doi:10.1080/00039896.1986.9937413.
- Food Standards Agency. 1999. Food Surveillance Information Sheet 189: Total Diet Study - Styrene.
- Fragnière, C., J.-N. Aebischer, V. Dudler, and F. Sager. 2003. A short study on the formation of styrene in cinnamon. Mitt. Lebensmittelunters. Hyg. 94:609–20.
- Franck, U., A. Weller, S. W. Röder, G. Herberth, K. M. Junge, T. Kohajda, M. von Bergen, U. Rolle-Kampczyk, U. Diez, M. Borte, et al., for the LiNA Study Group. 2014. Prenatal VOC exposure and redecoration are related to wheezing in early infancy. Environ. Int. 73: 393–401. doi: 10.1016/j.envint.2014.08.013.
- Frentzel-Beyme, R., A. M. Thiess, and R. Wieland. 1978. Survey of mortality among employees engaged in the manufacture of styrene and polystyrene at the BASF Ludwigshafen works. Scand. J. Work Environ. Health. 4 (Suppl 2):231–39. doi:10.5271/sjweh.2742.
- Fu, I., and N. M. Kettner. 2013. The circadian clock in cancer development and therapy. Prog. Mol. Biol. Transl. Sci. 119:221–82. doi:10.1016/B978-0-12-396971-2.00009-9.
- Fu, M. H., and M. Alexander. 1992. Biodegradation of styrene in samples of natural environments. Environ. Sci. Technol. 26:1540–44. doi:10.1021/es00032a007.
- Gagnaire, F., and C. Langlais. 2005. Relative ototoxicity of 21 aromatic solvents. Arch. Toxicol. 79:346–54. doi:10.1007/s00204-004-0636-2.
- Gagnaire, F., C. Langlais, S. Grossmann, and P. Wild. 2007. Ototoxicity in rats exposed to ethylbenzene and to two technical xylene vapours for 13 weeks. Arch. Toxicol. 81:127–43. doi:10.1007/s00204-006-0124-y.
- Gagnaire, F., M. Chalansonnet, N. Carabin, and J.-C. Micillino. 2006. Effects of subchronic exposure to styrene on the extracellular and tissue levels of dopamine, serotonin and their metabolites in rat brain. Arch. Toxicol. 80:703–12. doi:10.1007/s00204-006-0083-3.
- Garcia, E., S. Hurley, D. O. Nelson, A. Hertz, and P. Reynolds. 2015. Hazardous air pollutants and breast cancer risk in California teachers: A cohort study. Environ. Health. 14:14. doi:10.1186/1476-069X-14-14.
- Gelbke, H. P., M. Banton, E. Leibold, M. Pemberton, and S. L. Samson. 2015. A critical review finds styrene lacks direct endocrine disruptor activity. Crit. Rev. Toxicol. 45:727–64. doi:10.3109/10408444.2015.1064091.
- Genualdi, S., P. Nyman, and T. Begley. 2014. Updated evaluation of the migration of styrene monomer and oligomers from polystyrene food contact materials to foods and food simulants. Food Addit. Contam. Part A. 31:723–33. doi:10.1080/19440049.2013.878040.
- Georgieva, T., A. Lukanova, T. Panev, and T. Popov. 1998. Study of erythrocytes, hemoglobin levels, and menstrual cycle characteristics of women exposed to aromatic hydrocarbons. Int. Arch. Occup. Environ. Health. 71 (Suppl):S16–S18.
- Gérin, M., J. Siemiatycki, M. Desy, and D. Krewski. 1998. Associations between several sites of cancer and occupational exposure to benzene, toluene, xylene, and styrene: Results of a case-control study in Montreal. Am. J. Ind. Med. 34:144–56.
- Gibbs, J. E., S. Beesley, J. Plumb, D. Singh, S. Farrow, D. W. Ray, and A. S. Loudon. 2009. Circadian timing in the lung; a specific role for bronchiolar epithelial cells. Endocrinology 150:268–76. doi:10.1210/en.2008-0638.
- Gilman, J., B. Lerner, W. Kuster, P. Goldan, C. Warneke, P. Veres, J. Roberts, J. de Gouw, I. Burling, and R. Yokelson. 2015. Biomass burning emissions and potential air quality impacts of volatile organic compounds and other trace gases from fuels common in the US. Atmos. Chem. Phys. 15:13915–38. doi:10.5194/acp-15-13915-2015.
- Ginsberg, G., B. Foos, R. B. Dzubow, and M. Firestone. 2010. Options for incorporating children’s inhaled dose into human health risk assessment. Inhal. Toxicol. 22:627–47. doi:10.3109/08958371003610958.
- Glazier, R. U. 2010. Antioxidant polymorphisms and susceptibility to solvent-induced hearing loss in factory workers. Doctor of Medicine, Yale University School of Medicine (Yale Medicine Thesis Digital Library. 99). http://elischolar.library.yale.edu/ymtdl/99.
- Gobba, F. 2000. Color vision: A sensitive indicator of exposure to neurotoxins. Neurotoxicology 21:857–62.
- Gobba, F., and A. Cavalleri. 1993. Kinetics of urinary excretion and effects on colour vision after exposure to styrene, 79–88. IARC scientific publications.
- Gobba, F., and A. Cavalleri. 2000. Evolution of color vision loss induced by occupational exposure to chemicals. Neurotoxicology 21:777–81.
- Gobba, F., and A. Cavalleri. 2003. Color vision impairment in workers exposed to neurotoxic chemicals. Neurotoxicology 24:693–702. doi:10.1016/S0161-813X(03)00037-8.
- Gobba, F., C. Galassi, M. Imbriani, S. Ghittori, S. Candela, and A. Cavalleri. 1991. Acquired dyschromatopsia among styrene-exposed workers. J. Occup. Med. 33:761–65.
- Godderis, L., M. De Boeck, V. Haufroid, M. Emmery, R. Mateuca, S. Gardinal, M. Kirsch-Volders, H. Veulemans, and D. Lison. 2004. Influence of genetic polymorphisms on biomarkers of exposure and genotoxic effects in styrene-exposed workers. Environ. Mol. Mutagen. 44:293–303. doi:10.1002/em.20069.
- Gokhale, S., T. Kohajda, and U. Schlink. 2008. Source apportionment of human personal exposure to volatile organic compounds in homes, offices and outdoors by chemical mass balance and genetic algorithm receptor models. Sci. Total Environ. 407:122–38. doi:10.1016/j.scitotenv.2008.08.025.
- Gong, Y., R. Kishi, Y. Katakura, E. Tsukishima, K. Fujiwara, S. Kasai, T. Satoh, F. Sata, and T. Kawai. 2002. Relation between colour vision loss and occupational styrene exposure level. Occup. Environ. Med. 59:824–29. doi:10.1136/oem.59.12.824.
- Good, G. W., and J. J. Nichols. 2006. The effect of styrene exposure on color vision: A review. SIRC Rev. 10:101–45.
- Gordon, S. M., P. J. Callahan, M. G. Nishioka, M. C. Brinkman, M. K. O’Rourke, M. D. Lebowitz, and D. J. Moschandreas. 1999. Residential environmental measurements in the national human exposure assessment survey (NHEXAS) pilot study in Arizona: Preliminary results for pesticides and VOCs. J. Expo. Anal. Environ. Epidemiol. 9:456–70.
- Grady, S. J. 2003. A national survey of Methyl tert-Butyl ether and other volatile organic compounds in drinking water sources: Results of the random survey. U.S. Geological Survey. Water-Resources Investigations Report 02-4079.
- Graff, J. J., N. Sathiakumar, M. Macaluso, G. Maldonado, R. Matthews, and E. Delzell. 2005. Chemical exposures in the synthetic rubber industry and lymphohematopoietic cancer mortality. J. Occup. Environ. Med. 47:916–32.
- Gramatica, P., and E. Papa. 2003. QSAR modeling of bioconcentration factor by theoretical molecular descriptors. Mol. Inform. 22:374–85.
- Gramshaw, J. W., and H. J. Vandenburg. 1995. Compositional analysis of samples of thermoset polyester and migration of ethylbenzene and styrene from thermoset polyester into pork during cooking. Food Addit. Contam. 12:223–34. doi:10.1080/02652039509374297.
- Grayson, M. H., and S. S. Gill. 1986. Effect of in vitro exposure to styrene, styrene oxide and other structurally related compounds on murine cell-mediated immunity. Immunopharmacology 11:165–73.
- Green, T., A. Toghill, and J. R. Foster. 2001. The role of cytochromes P-450 in styrene induced pulomonary toxicity and carcinogenicity. Toxicology 169:110–17. doi:10.1016/S0300-483X(01)00488-7.
- Greene, M. A. 2002. Mouthing times from the observational study. U.S. Consumer Product Safety Commission.
- Guénel, P., E. Imbernon, A. Chevalier, A. Crinquand-Calastreng, and M. Goldberg. 2002. Leukemia in relation to occupational exposures to benzene and other agents: A case-control study nested in a cohort of gas and electric utility workers. Am. J. Ind. Med. 42:87–97. doi:10.1002/ajim.10090.
- Hamidin, N., J. Yu, D. T. Phung, D. Connell, and C. Chu. 2013. Volatile aromatic hydrocarbons (VAHs) in residential indoor air in Brisbane, Australia. Chemosphere 92:1430–35. doi:10.1016/j.chemosphere.2013.03.050.
- Han, J. H., C. S. Choi, M. Y. Kim, and Y. J. Chun. 2007. Differential gene expression by styrene in rat reproductive tissue. J. Toxicol. Environ. Health A. 70:1259–63. doi:10.1080/15287390701434414.
- Hanova, M., R. Stetina, L. Vodickova, R. Vaclavikova, P. Hlavac, Z. Smerhovsky, A. Naccarati, V. Polakova, P. Soucek, M. Kuricova, et al. 2010. Modulation of DNA repair capacity and mRNA expression levels of XRCC1, hOGG1 and XPC genes in styrene-exposed workers. Toxicol. Appl. Pharmacol. 248:194–200. doi:10.1016/j.taap.2010.07.027.
- Harkonen, H., and P. C. Holmberg. 1982. Obstetric histories of women occupationally exposed to styrene. Scand. J. Work Environ. Health. 8:74–77.
- Harkonen, H., S. Tola, M. L. Korkala, and S. Hernberg. 1984. Congenital malformations, mortality and styrene exposure. Ann. Acad. Med. Singapore. 13:404–07.
- Harris, E. C., K. Walker-Bone, G. Ntani, and D. Coggon. 2019. Sinonasal cancer and exposure to styrene. Occup. Environ. Med. 76:69. doi:10.1136/oemed-2018-105341.
- Harrison, R., J. Delgado-Saborit, S. Baker, N. Aquilina, C. Meddings, S. Harrad, I. Matthews, S. Vardoulakis, and H. Anderson 2009. Measurement and modeling of exposure to selected air toxics for health effects studies and verification by biomarkers. Research report (Health Effects Institute). 143.
- Haseman, J. K., J. R. Hailey, and R. W. Morris. 1998. Spontaneous neoplasm incidences in Fischer 344 rats and B6C3F1 mice in two-year carcinogenicity studies: A national toxicology program update. Toxicol. Pathol. 26:428–41. doi:10.1177/019262339802600318.
- Health Canada. 2010a. Regina indoor air quality study (2007): Data summary for volatile organic compound sampling.
- Health Canada. 2010b. Windsor exposure assessment study (2005-2006): Data summary for volatile organic compound sampling.
- Health Canada. 2013. Edmonton indoor air quality study (2010): Volatile organic compounds (VOC) data summary.
- Heavner, D. L., W. T. Morgan, and M. W. Ogden. 1995. Determination of volatile organic compounds and ETS apportionment in 49 homes. Environ. Int. 21:3–21. doi:10.1016/0160-4120(94)00018-3.
- Heavner, D. L., W. T. Morgan, and M. W. Ogden. 1996. Determination of volatile organic compounds and respirable suspended particulate matter in New Jersey and Pennsylvania homes and workplaces. Environ. Int. 22:159–83. doi:10.1016/0160-4120(96)00003-7.
- Hellén, H., H. Hakola, L. Pirjola, T. Laurila, and K.-H. Pystynen. 2006. Ambient air concentrations, source profiles, and source apportionment of 71 different C2−C10 volatile organic compounds in urban and residential areas of Finland. Environ. Sci. Technol. 40:103–08.
- Hemminki, K., E. Franssila, and H. Vainio. 1980. Spontaneous abortions among female chemical workers in Finland. Int. Arch. Occup. Environ. Health. 45:123–26.
- Hemminki, K., M. L. Lindbohm, T. Hemminki, and H. Vainio. 1984. Reproductive hazards and plastics industry. Prog. Clin. Biol. Res. 141:79–87.
- Henschel, D. B., R. C. Fortmann, N. F. Roache, and X. Liu. 2001. Variations in the emissions of volatile organic compounds from the toner for a specific photocopier. J. Air Waste Manage. Assoc. 51:708–17. doi:10.1080/10473289.2001.10464309.
- Héroux, M.-È., D. Gauvin, N. L. Gilbert, M. Guay, G. Dupuis, M. Legris, and B. Lévesque. 2008. Housing characteristics and indoor concentrations of selected volatile organic compounds (VOCs) in Quebec City, Canada. Indoor Built. Environ. 17:128–37. doi:10.1177/1420326X07089005.
- Héroux, M. E., N. Clark, K. Van Ryswyk, R. Mallick, N. L. Gilbert, I. Harrison, K. Rispler, D. Wang, A. Anastassopoulos, M. Guay, et al. 2010. Predictors of indoor air concentrations in smoking and non-smoking residences. Int. J. Environ. Res. Public Health 7:3080–99. doi:10.3390/ijerph7083080.
- Higgins, J. P. T., and D. G. Thompson. 2002. Quantifying heterogenity in a meta-analysis. Stat Med 21:1539–58. doi:10.1002/sim.1186.
- Higgins, J. P. T., S. G. Thompson, J. J. Deeks, and D. G. Altman. 2003. Measuring inconsistency in meta-analyses. Br. Med. J. 327:557–60. doi:10.1136/bmj.327.7414.557.
- Hill, A. B. 1965. The environment and disease: Association or causation? Proc. Roy. Soc. Med. 58:295–300.
- Hodgson, A. T. 2003. Volatile organic chemical emissions from structural insulated panel (SIP) materials and implications for indoor air quality. Lawrence Berkeley National Laboratory LBNL-53768.
- Hodgson, A. T., J. M. Daisey, K. R. R. Mahanama, J. Ten Brinke, and L. E. Alevantis. 1996. Use of volatile tracers to determine the contribution of environmental tobacco smoke to concentrations of volatile organic compounds in smoking environments. Environ. Int. 22:295–307. doi:10.1016/0160-4120(96)00015-3.
- Hodgson, J. T., and R. D. Jones. 1985. Mortality of styrene production, polymerization and processing workers at a site in northwest England. Scand. J. Work Environ. Health. 11:347–52.
- Hoffmann, J., A. Ihrig, S. Hoth, and G. Triebig. 2006. Field study to explore possible effects of styrene on auditory function in exposed workers. Ind. Health. 44:283–86. doi:10.2486/indhealth.44.283.
- Hofmann, C., C. Putz, B. Semder, T. H. Faller, G. A. Csanady, and J. G. Filser. 2006. Styrene-7,8-oxide burden in ventilated, perfused lungs of mice and rats exposed to vaporous styrene. Toxicol. Sci. 90:39–48. doi:10.1093/toxsci/kfj056.
- Holmberg, P. C. 1977. Central nervous system defects in two children of mothers exposed to chemicals in the reinforced plastics industry: Chance or causal relation? Scand. J. Work Environ. Health. 3:212–14.
- Holmberg, P. C. 1979. Central-nervous-system defects in children born to mothers exposed to organic solvents during pregnancy. Lancet 2:177–79. doi:10.1016/s0140-6736(79)91438-7.
- Holmberg, P. C., and M. Nurminen. 1980. Congenital defects of the central nervous system and occupational factors during pregnancy. A case-referent study. Am. J. Ind. Med. 1:167–76.
- Holmberg, P. C., S. Hernberg, K. Kurppa, K. Rantala, and R. Riala. 1982. Oral clefts and organic solvent exposure during pregnancy. Int. Arch. Occup. Environ. Health. 50:371–76.
- Holmes, M. J., A. Hart, P. Northing, P. K. T. Oldring, L. Castle, D. Stott, G. Smith, and O. Wardman. 2005. Dietary exposure to chemical migrants from food contact materials: A probabilistic approach. Food Addit. Contam. 22:907–19. doi:10.1080/02652030500307172.
- Holz, O., G. Scherer, S. Brodtmeier, F. Koops, K. Warncke, T. Rause, A. Austen, J. Angerer, A. R. Tricker, F. Adlkofer, et al. 1995. Determination of low level exposure to volatile aromatic hydrocarbons and genotoxic effects in workers at a styrene plant. Occup. Environ. Med. 52:420–28. doi:10.1136/oem.52.6.420.
- Hopple, J. A., G. C. Delzer, and J. A. Kingsbury 2009. Anthropogenic organic compounds in source water of selected community water Systems that use groundwater, 2002-05. U.S. Department of the Interior, U.S. Geological Survey. 1411326083.
- Hormozi, M., A. Ansari-Moghaddam, R. Mirzaei, J. Dehghan Haghighi, and F. Eftekharian. 2017. The risk of hearing loss associated with occupational exposure to organic solvents mixture with and without concurrent noise exposure: A systematic review and meta-analysis. Int. J. Occup. Med. Environ. Health. 30:521–35. doi:10.13075/ijomeh.1896.01024.
- IARC Monographs Vol 121 Group. 2018. Carcinogenicity of quinoline, styrene, and styrene-7,8-oxide. Lancet Oncol. 19: 728–29. doi:10.1016/S1470-2045(18)30316-4.
- ICIS Chemical Business. 2014. Chemical profile: US styrene. Accessed June, 2017. https://www.icis.com/resources/news/2014/12/12/9846177/chemical-profile-us-styrene/.
- ICRP. 1975. Report of the task group on reference man. International Commission on Radiological Protection. (ICRP), Report No. 23, Pergamon Press, New York, NY.
- Ikem, A. 2010. Measurement of volatile organic compounds in bottled and tap waters by purge and trap GC–MS: Are drinking water types different? J. Food Compost. Anal. 23:70–77. doi:10.1016/j.jfca.2009.05.005.
- International Agency for Research on Cancer (IARC). 1994. Some industrial chemicals. In IARC monogr. Eval. Carcinogen. Risks hum, Vol. 60. Lyon, France: World Health Organization.
- International Agency for Research on Cancer (IARC). 2002. IARC monographs on the evaluation of carcinogenic risks to humans. Volume 82: Some traditional herbal medicines, some mycotoxins, naphthalene, and styrene. Lyon, France: World Health Organization.
- International Organization for Standardization. 2017. Acoustics - Statistical distribution of hearing thresholds related to age and gender. ISO 7029. ISO, Geneva, Switzerland.
- Jahnova, E., J. Tulinska, S. Weissova, M. Dulinska, and L. Fuortes. 2002. Effects of occupational exposure to styrene on expression of adhesion molecule on leukocytes. Human Exp. Toxicol. 21:235–40. doi:10.1191/0960327102ht251oa.
- Jain, R. B. 2016. Selected volatile organic compounds as biomarkers for exposure to tobacco smoke. Biomarkers 21:342–46. doi:10.3109/1354750X.2016.1139182.
- Jain, R. B. 2017. Detection rates, trends in and factors affecting observed levels of selected volatile organic compounds in blood among US adolescents and adults. Environ. Toxicol. Pharmacol. 56:21–28. doi:10.1016/j.etap.2017.08.031.
- Jarry, H., M. Metten, A. O. Gamer, and W. Wuttke. 2002. Effects of 5-day styrene inhalation on serum prolactin and dopamine levels and on hypothalamic and striatal catecholamine concentrations in male rats. Arch. Toxicol. 76:657–63. doi:10.1007/s00204-002-0386-y.
- Jelnes, J. E. 1988. Semen quality in workers producing reinforced plastic. Reprod. Toxicol. 2:209–12.
- Jenkin, M., S. Saunders, V. Wagner, and M. Pilling. 2003. Protocol for the development of the Master Chemical Mechanism, MCM v3 (Part B): Tropospheric degradation of aromatic volatile organic compounds. Atmos. Chem. Phys. 3:181–93. doi:10.5194/acp-3-181-2003.
- Jersey, G. C., M. F. Balmer, J. F. Quast, C. N. Park, D. J. Schuetz, J. E. Beyer, K. J. Olson, S. B. McCollister, and L. W. Rampy. 1978. Two-year chronic inhalation toxicity and carcinogenicity study on monomeric styrene in rats. Midland, MI: Dow Chemical, USA.
- Jia, C., J. D’Souza, and S. Batterman. 2008. Distributions of personal VOC exposures: A population-based analysis. Environ. Int. 34:922–31. doi:10.1016/j.envint.2008.02.002.
- Jia, C., S. Batterman, and C. Godwin. 2008a. VOCs in industrial, urban and suburban neighborhoods—Part 2: Factors affecting indoor and outdoor concentrations. Atmos. Environ. 42:2101–16. doi:10.1016/j.atmosenv.2007.11.047.
- Jickells, S. M., J. W. Gramshaw, L. Castle, and J. Gilbert. 1992. The effect of microwave energy on specific migration from food contact plastics. Food Addit. Contam. 9:19–27. doi:10.1080/02652039209374044.
- Jickells, S. M., P. Gancedo, C. Nerin, L. Castle, and J. Gilbert. 1993. Migration of styrene monomer from thermoset polyester cookware into foods during high temperature applications. Food Addit. Contam. 10:567–73. doi:10.1080/02652039309374179.
- Johanson, G., L. Ernstgård, E. Gullstrand, A. Löf, S. Osterman-Golkar, C. C. Williams, and S. C. Sumner. 2000. Styrene oxide in blood, hemoglobin adducts, and urinary metabolites in human volunteers exposed to (13)C(8)-styrene vapors. Toxicol. Appl. Pharmacol. 168:36–49. doi:10.1006/taap.2000.9007.
- Johnson, A.-C. 2007. Relationship between styrene exposure and hearing loss: Review of human studies. Int. J. Occup. Med. Environ. Health. 20:315–25. doi:10.2478/v10001-007-0040-2.
- Johnson, A.-C., and P. R. Nylen. 1995. Effects of industrial solvents on hearing. Occup. Med. 10:623–40.
- Johnson, A.-C., T. Morata, A.-C. Lindblad, P. Nylen, E. Svensson, E. Krieg, A. Aksentijevic, and D. Prasher. 2006. Audiological findings in workers exposed to styrene alone or in concert with noise. Noise Health 8:45–57.
- Johnson, T. 1999. Estimated incremental exposures to styrene emitted by model composite fabricating facilities. Chapel Hill, NC: TRJ Environmental.
- Kalkbrenner, A. E., J. L. Daniels, J. C. Chen, C. Poole, M. Emch, and J. Morrissey. 2010. Perinatal exposure to hazardous air pollutants and autism spectrum disorders at age 8. Epidemiology 21:631–41. doi:10.1097/EDE.0b013e3181e65d76.
- Kalkbrenner, A. E., R. J. Schmidt, and A. C. Penlesky. 2014. Environmental chemical exposures and autism spectrum disorders: A review of the epidemiological evidence. Curr. Probl. Pediatr. Adolesc. Health Care. 44:277–318. doi:10.1016/j.cppeds.2014.06.001.
- Kankaanpaa, J. T., E. Elovaara, K. Hemminki, and H. Vainio. 1980. The effect of maternally inhaled styrene on embryonal and foetal development in mice and Chinese hamsters. Acta Pharmacol. Toxicol. (Copenh). 47:127–29.
- Karami, S., P. Boffetta, P. Brennan, P. A. Stewart, D. Zaridze, V. Matveev, V. Janout, H. Kollarova, V. Bencko, M. Navratilova, et al. 2011. Renal cancer risk and occupational exposure to polycyclic aromatic hydrocarbons and plastics. J. Occup. Environ. Med. 53:218–23. doi:10.1097/JOM.0b013e31820a40a3.
- Katakura, Y., R. Kishi, T. Ikeda, and H. Miyake. 1999. Effects of prenatal exposure to styrene on neurochemical levels in rat brain. Toxicol. Lett. 105:239–49.
- Katakura, Y., R. Kishi, T. Ikeda, and H. Miyake. 2001. Effects of prenatal styrene exposure on postnatal development and brain serotonin and catecholamine levels in rats. Environ. Res. 85:41–47. doi:10.1006/enrs.2000.4053.
- Kataoka, H., Y. Ohashi, T. Mamiya, K. Nami, K. Saito, K. Ohcho, and T. Takigawa. 2012. Indoor air monitoring of volatile organic compounds and evaluation of their emission from various building materials and common products by gas chromatography-mass spectrometry, In Advanced gas chromatography-progress in agricultural, biomedical and industrial applications InTech.
- Katsoyiannis, A., P. Leva, and D. Kotzias. 2008. VOC and carbonyl emissions from carpets: A comparative study using four types of environmental chambers. J. Hazard Mater. 152:669–76. doi:10.1016/j.jhazmat.2007.07.058.
- Khaksar, M.-R., and M. Ghazi-Khansari. 2009. Determination of migration monomer styrene from GPPS (general purpose polystyrene) and HIPS (high impact polystyrene) cups to hot drinks. Toxicol. Mech. Methods. 19:257–61. doi:10.1080/15376510802510299.
- Khanna, V. K., R. Husain, J. P. Hanig, and P. K. Seth. 1991. Increased neurobehavioral toxicity of styrene in protein-malnourished rats. Neurotoxicol. Teratol. 13:153–59.
- Khanna, V. K., R. Husain, and P. K. Seth. 1994. Effect of protein malnutrition on the neurobehavioural toxicity of styrene in young rats. J. Appl. Toxicol. 14:351–56.
- Kim, S., S. Chen, and R. Tannock. 2014. Visual function and color vision in adults with attention-deficit/hyperactivity disorder. J. Optomol. 7:22–36. doi:10.1016/j.optom.2013.07.001.
- Kim, Y. M., S. Harrad, and R. M. Harrison. 2001. Concentrations and sources of VOCs in urban domestic and public microenvironments. Environ. Sci. Technol. 35:997–1004.
- Kim, Y. M., S. Harrad, and R. M. Harrison. 2002. Levels and sources of personal inhalation exposure to volatile organic compounds. Environ. Sci. Technol. 36:5405–10.
- Kingsbury, J. A., G. C. Delzer, and J. A. Hopple. 2008. Anthropogenic organic compounds in source water of nine community water systems that withdraw from streams, 2002–05. World Wide Web 605:394–3200.
- Kinney, P. L., S. N. Chillrud, S. Ramstrom, J. Ross, and J. D. Spengler. 2002. Exposures to multiple air toxics in New York City. Environ. Health Perspect. 110 (Suppl 4):539–46. doi:10.1289/ehp.02110s4539.
- Kinney, P. L., S. N. Chillrud, S. Sax, J. M. Ross, D. Macintosh, T. A. Myatt, and J. D. Spengler 2008. Toxic exposure assessment: A Columbia-Harvard (TEACH) study (The Los Angeles report). NUATRC Number 9.
- Kinney, P. L., S. N. Chillrud, S. Sax, J. M. Ross, D. C. Pederson, D. Johnson, M. Aggarwal, and J. D. Spengler. 2005. Toxic exposure assessment: A Columbia-Harvard (TEACH) study (The New York City report). In NUATRC Number, 3. Mickey Leland National Urban Air Toxics Research Center, Houston, TX.
- Kirman, C. R., L. L. Aylward, B. C. Blount, D. W. Pyatt, and S. M. Hays. 2012. Evaluation of NHANES biomonitoring data for volatile organic chemicals in blood: Application of chemical-specific screening criteria. J. Expo. Sci. Environ. Epidemiol. 22:24–34. doi:10.1038/jes.2011.37.
- Kishi, R., B. Q. Chen, Y. Katakura, T. Ikeda, and H. Miyake. 1995. Effect of prenatal exposure to styrene on the neurobehavioral development, activity, motor coordination, and learning behavior of rats. Neurotoxicol. Teratol. 17:121–30.
- Kishi, R., S. Tozaki, and -Y.-Y. Gong. 2000. Impairment of neurobehavioral function and color vision loss among workers exposed to low concentration of styrene – A review of literatures. Ind. Health. 38:120–26. doi:10.2486/indhealth.38.120.
- Kishi, R., Y. Katakura, T. Ikeda, B. Q. Chen, and H. Miyake. 1992. Neurochemical effects in rats following gestational exposure to styrene. Toxicol. Lett. 63:141–46.
- Kishi, R., Y. Katakura, T. Okui, H. Ogawa, T. Ikeda, and H. Miyake. 1989. Placental transfer and tissue distribution of 14C-styrene: An autoradiographic study in mice. Br. J. Ind. Med. 46:376–83. doi:10.1136/oem.46.6.376.
- Klepeis, N. E., W. C. Nelson, W. R. Ott, J. P. Robinson, A. M. Tsang, P. Switzer, J. V. Behar, S. C. Hern, and W. H. Engelmann. 2001. The national human activity pattern survey (NHAPS): A resource for assessing exposure to environmental pollutants. J. Expo. Anal. Environ. Epidemiol. 11:231–52. doi:10.1038/sj.jea.7500165.
- Kogevinas, M., G. Ferro, A. Andersen, T. Bellander, M. Biocca, D. Coggon, V. Gennaro, S. Hutchings, H. Kolstad, I. Lundberg, et al. 1994b. Cancer mortality in a historical cohort study of workers exposed to styrene. Scand. J. Work Environ. Health. 20:251–61. doi:10.5271/sjweh.1400.
- Kogevinas, M., G. Ferro, R. Saracci, A. Andersen, M. Biocca, D. Coggon, V. Gennaro, S. Hutchings, H. Kolstad, I. Lundberg, et al. 1993. Cancer mortality in an international cohort of workers exposed to styrene. IARC Sci. Publ. 127:289–300.
- Kogevinas, M., G. Ferro, R. Saracci, A. Andersen, T. Bellander, M. Biocca, J. E. Bjerk, N. O. Breum, D. Coggon, V. Fontana, et al. 1994a. IARC historical multicentric cohort study of workers exposed to styrene. Report of the Epidemiological Study and the Industrial Hygiene Investigation (IARC Internal Technical Report 94/002), Lyon, IARC.
- Kolstad, H. A., E. Lynge, and J. Olsen. 1993. Cancer incidence in the Danish reinforced plastics industry. IARC Sci. Publ. 127:301–08.
- Kolstad, H. A., E. Lynge, J. Olsen, and N. Breum. 1994. Incidence of lymphohematopoietic malignancies among styrene-exposed workers of the reinforced plastics industry. Scand. J. Work Environ. Health. 20:272–78.
- Kolstad, H. A., J. E. Bonde, M. Spano, A. Giwercman, W. Zschiesche, D. Kaae, and N. Roeleveld. 1999a. Sperm chromatin structure and semen quality following occupational styrene exposure. Scand. J. Work Environ. Health. 25:70–73.
- Kolstad, H. A., J. P. Bonde, M. Spano, A. Giwercman, W. Zschiesche, D. Kaae, S. B. Larsen, and N. Roeleveld. 1999b. Change in semen quality and sperm chromatin structure following occupational styrene exposure. ASCLEPIOS. Int. Arch. Occup. Environ. Health. 72:135–41. doi:10.1007/s004200050352.
- Kolstad, H. A., K. Juel, J. Olsen, and E. Lynge. 1995. Exposure to styrene and chronic health effects: Mortality and incidence of solid cancers in the Danish reinforced plastics industry. Occup. Environ. Med. 52:320–27. doi:10.1136/oem.52.5.320.
- Kolstad, H. A., L. Bisanti, N. Roeleveld, J. E. Bonde, and M. Joffe. 1999c. Time to pregnancy for men occupationally exposed to styrene in several European reinforced plastics companies. Scand. J. Work Environ. Health. 25:66–69.
- Kolstad, H. A., L. Bisanti, N. Roeleveld, R. Baldi, J. P. Bonde, and M. Joffe. 2000. Time to pregnancy among male workers of the reinforced plastics industry in Denmark, Italy and The Netherlands. ASCLEPIOS. Scand. J. Work Environ. Health. 26:353–58.
- Kowalska, J., M. Szewczyńska, and M. Pośniak. 2015. Measurements of chlorinated volatile organic compounds emitted from office printers and photocopiers. Environ. Sci. Pollut. Res. 22:5241–52. doi:10.1007/s11356-014-3672-3.
- Kurppa, K., P. C. Holmberg, S. Hernberg, K. Rantala, R. Riala, and T. Nurminen. 1983. Screening for occupational exposures and congenital malformations. Preliminary results from a nationwide case-referent study. Scand. J. Work Environ. Health. 9:89–93.
- Kuwada, M., R. Kawashima, K. Nakamura, H. Hasumi, and J. Maki. 2012. Study of the neonatal exposure to estrogenic and androgenic endocrine disruptors by normal-phase HPLC. Drug Delivery Lett. 2:126–31.
- Kuwada, M., R. Kawashima, K. Nakamura, H. Kojima, H. Hasumi, J. Maki, and S. Sugano. 2002. Neonatal exposure to endocrine disruptors suppresses juvenile testis weight and steroidogenesis but spermatogenesis is considerably restored during puberty. Biochem. Biophy. Res. Commun. 295:193–97. doi:10.1016/S0006-291X(02)00644-7.
- Kwon, J., C. P. Weisel, B. J. Turpin, J. Zhang, L. R. Korn, M. T. Morandi, T. H. Stock, and S. Colome. 2006. Source proximity and outdoor-residential VOC concentrations: Results from the RIOPA study. Environ. Sci. Technol. 40:4074–82.
- Ladefoged, O., H. R. Lam, G. Ostergaard, E. Hansen, U. Hass, S. Lund, and L. Simonsen. 1998. Toxicity of the styrene metabolite, phenylglyoxylic acid, in rats after three months’ oral dosing. Neurotoxicology 19:721–37.
- Lafeuille, J. L., M. L. Buniak, M. C. Vioujas, and S. Lefevre. 2009. Natural formation of styrene by cinnamon mold flora. J. Food Sci. 74:M276–M283. doi:10.1111/j.1750-3841.2009.01206.x.
- Laffon, B., E. Pásaro, and J. Méndez. 2002. Evaluation of genotoxic effects in a group of workers exposed to low levels of styrene. Toxicology 171:175–86.
- Lambert, B., T. Bastlova, A. M. Osterhol, and S. M. Hou. 1995. Analysis of mutation at the hprt locus in human T lymphocytes. Toxicol. Lett. 82–83:323–33. doi:10.1016/0378-4274(95)03485-4.
- Langos, D., M. Gastl, and M. Granvogl. 2017. Reduction of toxicologically relevant styrene in wheat beer using specially produced wheat and barley malts. Eur. Food. Res. Technol. 243(10):1711–1718.
- Langos, D., and M. Granvogl. 2016. Studies on the simultaneous formation of aroma-active and toxicologically relevant vinyl aromatics from free phenolic acids during wheat beer brewing. J. Agric. Food Chem. 64:2325–32. doi:10.1021/acs.jafc.5b05606.
- Lanvers-Kaminsky, C., A. G. Zehnhoff-Dinnesen, R. Parfitt, and G. Ciarimboli. 2017. Drug-induced ototoxicity: Mechanisms, pharmacogenetics, and protective strategies. Clin. Pharmacol. Ther. 101:491–500. doi:10.1002/cpt.603.
- Lataye, R., B. Pouyatos, P. Campo, A. Lambert, and G. Morel. 2004. Critical period for styrene ototoxicity in the rat. Noise Health 7:1–10.
- Lataye, R., P. Campo, B. T. Pouyatos, B. T. Cossec, V. Blachère, and G. Morel. 2003. Solvent ototoxicity in the rat and guinea pig. Neurotoxicol. Teratol. 25:39–50.
- Lataye, R., P. Campo, C. Barthelemy, G. Loquet, and P. Bonnet. 2001. Cochlear pathology induced by styrene. Neurotoxicol. Teratol. 23:71–79.
- Lataye, R., P. Campo, and G. Loquet. 2000. Combined effects of noise and styrene exposure on hearing function in the rat. Hearing Res. 139:86–96. doi:10.1016/S0378-5955(99)00174-4.
- Lataye, R., P. Campo, G. Loquet, and G. Morel. 2005. Combined effects of noise and styrene on hearing: Comparison between active and sedentary rats. Noise Health 7:49–64.
- Lau, O.-W., and S.-K. Wong. 2000. Contamination in food from packaging material. J. Chromatogr. 882:255–70. doi:10.1016/S0021-9673(00)00356-3.
- Lautermann, J., S. A. Crann, J. McLaren, and J. Schacht. 1997. Glutathione-dependent antioxidant systems in the mammalian inner ear: Effects of aging, ototoxic drugs and noise. Hearing Res. 114:75–82. doi:10.1016/S0378-5955(97)00154-8.
- Lawton, B. W., J. Hoffmann, and G. Triebig. 2006. The ototoxicity of styrene: A review of occupational investigations. Int. Arch. Occup. Environ. Health. 79:93–102. doi:10.1007/s00420-005-0030-2.
- Lee, S., S. Lam, and H. K. Fai. 2001. Characterization of VOCs, ozone, and PM 10 emissions from office equipment in an environmental chamber. Build. Environ. 36:837–42. doi:10.1016/S0360-1323(01)00009-9.
- Lees, P. S., A. Stefaniak, E. A. Emmett, and P. Dalton. 2003. Exposure assessment for study of olfactory function in workers exposed to styrene in the reinforced‐plastics industry. Am. J. Ind. Med. 44:12–23. doi:10.1002/ajim.10236.
- Lemasters, G. K., A. Carson, and S. J. Samuels. 1985. Occupational styrene exposure for twelve product categories in the reinforced plastics industry. Am. Ind. Hyg. Assoc. 46:434–41. doi:10.1080/15298668591395120.
- Lemasters, G. K., A. Hagen, and S. J. Samuels. 1985. Reproductive outcomes in women exposed to solventsin 36 reinforced plastics companies. I. Menstrual dysfunction. J. Occup. Med. 27:490–94.
- Lemasters, G. K., S. J. Samuels, J. A. Morrison, and S. M. Brooks. 1989. Reproductive outcomes of pregnant workers employed at 36 reinforced plastics companies. II. Lowered birth weight. J. Occup. Med. 31:115–20.
- Lemieux, P. M., C. C. Lutes, and D. A. Santoianni. 2004. Emissions of organic air toxics from open burning: A comprehensive review. Prog. Energ. Combust. 30:1–32. doi:10.1016/j.pecs.2003.08.001.
- Leovic, W., K. Sheldon, L. S. Whitaker, D. A. Hetes, R. G. Calcagni, and J. N. Baskir. 1996. Measurement of indoor air emissions from dry-process photocopy machines. J. Air Waste Manage. Assoc. 46:821–29. doi:10.1080/10473289.1996.10467517.
- Li, L., Y. Wei, L. Van Winkle, Q.-Y. Zhang, X. Zhou, J. Hu, F. Xie, K. Kluetzman, and X. Ding. 2011. Generation and characterization of a Cyp2f2-null mouse and studies on the role of CYP2F2 in naphthalene-induced toxicity in the lung and nasal olfactory mucosa. J. Pharmacol. Exp. Ther. 339:62–71. doi:10.1124/jpet.111.184671.
- Lickly, T. D., C. V. Breder, and M. L. Rainey. 1995. A model for estimating the daily dietary intake of a substance from food-contact articles: Styrene from polystyrene food-contact polymers. Regul. Toxicol. Pharmacol. 21:406–17. doi:10.1006/rtph.1995.1055.
- Lijinsky, W. 1986. Rat and mouse forestomach tumors induced by chronic oral administration of styrene oxide. J. Natl. Cancer Inst. 77:471–76.
- Limasset, J. C., P. Simon, P. Poirot, I. Subra, and M. Grzebyk. 1999. Estimation of the percutaneous absorption of styrene in an industrial situation. Int. Arch. Occup. Environ. Health. 72:46–51.
- Lin, Q.-B., X.-C. Song, H. Fang, Y.-M. Wu, and Z.-W. Wang. 2017. Migration of styrene and ethylbenzene from virgin and recycled expanded polystyrene containers and discrimination of these two kinds of polystyrene by principal component analysis. Food Addit. Contam. A 34:126–32. doi:10.1080/19440049.2016.1253875.
- Lin, Y., P. Egeghy, and S. Rappaport. 2008. Relationships between levels of volatile organic compounds in air and blood from the general population. J. Expo. Sci. Environ. Epidemiol. 18:421–29. doi:10.1038/sj.jes.7500635.
- Lindbohm, M. L., H. Taskinen, M. Sallmen, K. Hemminki, A. D. McDonald, J. Lavoie, R. Cote, and J. C. McDonald. 1990. Spontaneous abortions among women exposed to organic solvents. Am. J. Ind. Med. 17:449–63.
- Lindbohm, M. L., K. Hemminki, and P. Kyyronen. 1985. Spontaneous abortions among women employed in the plastics industry. Am. J. Ind. Med. 8:579–86.
- Lindstrom, A. B., D. Proffitt, and C. R. Fortune. 1995. Effects of modified residential construction on indoor air quality. Indoor Air 5:258–69. doi:10.1111/ina.1995.5.issue-4.
- Lipiro, D. J., J. B. Jurinski, R. A. Haberlein, and S. Sessions. 2004. Impact of styrene PEL reduction on composites manufacturers in California. Environmental Compliance & Risk Management Inc. American Composites Manufacturers Association, Arlington, VA.
- Logue, J. M., M. J. Small, and A. L. Robinson. 2009. Identifying priority pollutant sources: Apportioning air toxics risks using positive matrix factorization. Environ. Sci. Technol. 43:9439–44. doi:10.1021/es901683j.
- Lomax, R. B., P. Ridgway, and M. Meldrum. 2004. Does occupational exposure to organic solvents affect colour discrimination? Toxicol. Rev. 23:91–121.
- Loomis, D., N. Guha, M. Kogevinas, V. Fontana, V. Gennaro, H. Kolstad, D. M. McElvenny, M. Sallmen, and R. Saracci. 2019. Cancer mortality in an international cohort of reinforced plastics workers exposed to styrene: A reanalysis. Occup. Environ. Med. 76:157–62. doi:10.1136/oemed-2018-105131.
- López, P., R. Batlle, J. Salafranca, and C. Nerin. 2008. Efficiency of whole and skimmed powdered milk for trapping volatile compounds released from plastic containers in high-temperature applications. J. Food Prot. 71:1889–97.
- Loquet, G., P. Campo, and R. Lataye. 1999. Comparison of toluene-induced and styrene-induced hearing losses. Neurotoxicol. Teratol. 21:689–97.
- Loquet, G., P. Campo, R. Lataye, B. Cossec, and P. Bonnet. 2000. Combined effects of exposure to styrene and ethanol on the auditory function in the rat. Hearing Res. 148:173–80. doi:10.1016/S0378-5955(00)00151-9.
- Lu, X., S. Tao, H. Hu, and R. Dawson. 2000. Estimation of bioconcentration factors of nonionic organic compounds in fish by molecular connectivity indices and polarity correction factors. Chemosphere 41:1675–88.
- Luderer, U., R. Tornero-Velez, T. Shay, S. Rappaport, N. Heyer, and D. Echeverria. 2004. Temporal association between serum prolactin concentration and exposure to styrene. Occup. Environ. Med. 61:325–33. doi:10.1136/oem.2002.005561.
- Lv, Q., Z. J. Wang, Q. Zhang, M. L. Qi, and H. Bai. 2015. A novel method to investigate the migration regularity of toxic substances from toys to saliva and sweat. RSC Adv 5:102707–12. doi:10.1039/C5RA21171A.
- Macaluso, M., R. Larson, J. Lynch, S. Lipton, and E. Delzell. 2004. Historical estimation of exposure to 1,3-butadiene, styrene, and dimethyldithiocarbamate among synthetic rubber workers. J. Occup. Environ. Hyg. 1:371–90. doi:10.1080/15459620490452004.
- Mäki-Paakkanen, J. 1987. Chromosome aberrations, micronuclei and sister-chromatid exchanges in blood lymphocytes after occupational exposure to low levels of styrene. Mutat. Res. 189:399–406.
- Mäkitie, A., U. Pirvola, I. Pyykkö, H. Sakakibara, V. Riihimäki, and J. Ylikoski. 2002. Functional and morphological effects of styrene on the auditory system of the rat. Arch. Toxicol. 76:40–47. doi:10.1007/s00204-001-0316-4.
- Mäkitie, A. A., U. Pirvola, I. Pyyko, H. Sakakibara, V. Riihimäki, and J. Ylikoski. 2003. The ototoxic interaction of styrene and noise. Hearing Res. 179:9–20. doi:10.1016/S0378-5955(03)00066-2.
- Malkinson, A. M. 1989. The genetic basis of susceptibility to lung tumors in mice. Toxicology 54:241–71. doi:10.1016/0300-483X(89)90062-0.
- Malmgren-Hansen, B., S. Olesen, K. Pommer, L. Winther Funch, E. Pedersen, O. Willum, and S. Olsen. 2003. Emission and evaluation of chemical substances from selected electrical and electronic products. Danish Technological Institute, Technical University of Denmark, Aarhus C, Denmark.
- Manini, P., G. De Palma, R. Andreoli, B. Marczynski, M. Hanova, P. Mozzoni, A. Naccarati, L. Vodickova, P. Hlavac, and A. Mutti. 2009. Biomarkers of nucleic acid oxidation, polymorphism in, and expression of, hOGG1 gene in styrene-exposed workers. Toxicol. Lett. 190:41–47. doi:10.1016/j.toxlet.2009.06.862.
- Marc, M., and B. Zabiegala. 2017. An investigation of selected monoaromatic hydrocarbons released from the surface of polystyrene lids used in coffee-to-go cups. Microchem. J. 133:496–505. doi:10.1016/j.microc.2017.04.015.
- Marsh, G. M., A. O. Youk, R. A. Stone, J. M. Buchanich, M. J. Gula, T. J. Smith, and M. M. Quinn. 2001. Historical cohort study of US man-made vitreous fiber production workers. I. 1992 fiberglass cohort follow-up: Initial findings. J. Occup. Environ. Med. 43:741–56.
- Mascagni, P., C. Formenti, M. Pettazzoni, G. Feltrin, and Toffotetto. 2007. [Hearing function and solvent exposure: Study of a worker population exposed to styrene] (in italian). G. Ital. Med. Lav. Ergon. 29:277–79.
- Matanoski, G., M. Francis, A. Correa-Villasenor, E. Elliott, C. Santos-Burgoa, and L. Schwartz. 1993. Cancer epidemiology among styrene-butadiene rubber workers. IARC Sci. Publ. 127:363–74.
- McCague, A.-B., J. M. Cox-Ganser, J. M. Harney, K. U. Alwis, B. C. Blount, K. J. Cummings, N. Edwards, and K. Kreiss. 2015. Styrene associated health outcomes at a windblade manufacturing plant. Am. J. Ind. Med. 58:1150–59. doi:10.1002/ajim.22516.
- McCanlies, E. C., D. Fekedulegn, A. Mnatsakanova, C. M. Burchfiel, W. T. Sanderson, L. E. Charles, and I. Hertz-Picciotto. 2012. Parental occupational exposures and autism spectrum disorder. J. Autism Dev. Disord. 42:2323–34. doi:10.1007/s10803-012-1468-1.
- McCarthy, M. C., H. R. Hafner, L. R. Chinkin, and J. G. Charrier. 2007. Temporal variability of selected air toxics in the United States. Atmos. Environ. 41:7180–94. doi:10.1016/j.atmosenv.2007.05.037.
- McDonald, A. D., J. Lavoie, R. Cote, and J. C. McDonald. 1988. Spontaneous abortion in women employed in plastics manufacture. Am. J. Ind. Med. 14:9–14.
- Meek, M. E., A. Boobis, I. Cote, V. Dellarco, G. Fotakis, S. Munn, J. Seed, and C. Vickers. 2014. New developments in the evolution and application of the WHO/IPCS framework on mode of action/species concordance analysis. J. Appl. Toxicol. 34:1–18. doi:10.1002/jat.2949.
- Meek, M. E., M. Bolger, J. S. Bus, J. Christopher, R. R. Conolly, R. J. Lewis, G. M. Paolini, R. Schoeny, L. T. Haber, A. B. Rosenstein, et al. 2013. A framework for fit-for-purpose dose response assessment. Regul. Toxicol. Pharmacol. 66:234–40. doi:10.1016/j.yrtph.2013.03.012.
- Meinhardt, T. J., R. J. Young, and R. W. Hartle. 1978. Epidemiologic investigations of styrene-butadiene rubber production and reinforced plastics production. Scand. J. Work Environ. Health. 4 (Suppl 2):240–46.
- Melski, K., J. Zabielski, and H. Kubera. 2003. Model study on intensified migration of volatile substances from food contacting plastic materials during repeated microwaving. Electron. J Pol. Agric. Univ. Food Sci. Technol. 6 (1):#09.
- Mergler, D., L. Blain, and J.-P. Lagacé. 1987. Solvent related colour vision loss: An indicator of neural damage? Int. Arch. Occup. Environ. Health. 59:313–21.
- Merker, G. H., G. Metzner, and F. Raabe. 2006. TH1-directed modulation of in vitro cytokine production in human peripheral blood mononuclear cells by styrene-7,8-oxide. Toxicol. Lett. 160:105–11. doi:10.1016/j.toxlet.2005.06.014.
- Metwally, F. M., H. M. Aziz, H. Mahdy-Abdallah, K. S. ElGelil, and E. M. El-Tahlawy. 2012. Effect of combined occupational exposure to noise and organic solvents on hearing. Toxicol. Ind. Health. 28:901–07. doi:10.1177/0748233711427051.
- Migliore, L., A. Naccarati, F. Coppedè, E. Bergamaschi, G. De Palma, A. Voho, P. Manini, H. Jarventaus, A. Mutti, H. Norppa, et al. 2006. Cytogenetic biomarkers, urinary metabolites and metabolic gene polymorphisms in workers exposed to styrene. Pharmacogenet. Genomics. 16:87–99.
- Miligi, L., A. S. Costantini, A. Benvenuti, D. Kriebel, V. Bolejack, R. Tumino, V. Ramazzotti, S. Rodella, E. Stagnaro, P. Crosignani, et al. 2006. Occupational exposure to solvents and the risk of lymphomas. Epidemiology 17:552–61. doi:10.1097/01.ede.0000231279.30988.4d.
- Miller, R., R. Newhook, and A. Poole. 1994. Styrene production, use, and human exposure. Crit. Rev. Toxicol. 24:S1–S10. doi:10.3109/10408449409020137.
- Miller, S. L., M. J. Anderson, E. P. Daly, and J. B. Milford. 2002. Source apportionment of exposures to volatile organic compounds. I. Evaluation of receptor models using simulated exposure data. Atmos. Environ. 36:3629–41. doi:10.1016/S1352-2310(02)00279-0.
- Miller, Y. E., L. D. Dwyer-Nield, R. L. Keith, M. Le, W. A. Franklin, and A. M. Malkinson. 2003. Induction of a high incidence of lung tumors in C57BL/6 mice with multiple ethyl carbamate injections. Cancer Lett. 198:139–44.
- Mishra, N., J. Bartsch, G. A. Ayoko, T. Salthammer, and L. Morawska. 2015. Volatile organic compounds: Characteristics, distribution and sources in urban schools. Atmos. Environ. 106:485–91. doi:10.1016/j.atmosenv.2014.10.052.
- Mohamed, M. F., D. Kang, and V. P. Aneja. 2002. Volatile organic compounds in some urban locations in the United States. Chemosphere 47:863–82.
- Moleti, A., F. Longo, and R. Sisto. 2012. Time-frequency domain filtering of evoked otoacoustic emissions. J. Acoust. Soc. Am. 132:2455–67. doi:10.1121/1.4751537.
- Moller, C., L. Odkvist, B. Larsby, R. Tham, T. Ledin, and L. Bergholtz. 1990. Otoneurological findings in workers exposed to styrene. Scand. J. Work Environ. Health. 16:189–94.
- Monzack, E. L., and L. L. Cunningham. 2013. Lead roles for supporting actors: Critical functions of inner ear supporting cells. Hearing Res. 303:20–29. doi:10.1016/j.heares.2013.01.008.
- Moore, M., L. H. Pottenger, and T. House-Knight. 2019. Critical review of styrene genotoxicity focused on the mutagenicity/clastogenicity literature and using current OECD guidance. Environ. Mol. Mutagen. doi:10.1002/em.22278. [Epub ahead of print].
- Moran, M. J., W. W. Lapham, B. L. Rowe, and J. S. Zogorski. 2002. Occurrence and status of volatile organic compounds in ground water from rural, untreated, self-supplied domestic wells in the United States, 1986-99. Rapid City, SD. United States Department of the Interior, U.S. Geological Survey, Water Resources Division, Rapid City, South Dakota.
- Morata, T. C., M. Sliwinska-Kowalska, A.-C. Johnson, J. Starck, K. Pawlas, E. Zamyslowska-Szmytke, P. Nylen, E. Toppila, E. Krieg, and N. Pawlas. 2011. A multicenter study on the audiometric findings of styrene-exposed workers. Int. J. Audiol. 50:652–60.
- Morata, T. C., and P. Campo. 2002. Ototoxic effects of styrene alone or in concert with other agents: A review. Noise Health 4:15–24.
- Morrow, W. S. 1999. Volatile organic compounds in ground water of the lower Illinois river basin. U.S. Department of the Interior, US Geological Survey.
- Morrow, W. S. 2003. Anthropogenic constituents in shallow ground water in the upper Illinois river basin. U.S. Department of the Interior, U.S. Geological Survey.
- Muijser, H., E. M. G. Hoogendijk, and J. Hooisma. 1988. The effect of occupational exposure to styrene on high-frequency thresholds. Toxicology 49:331–40.
- Murray, F. J., J. A. John, M. F. Balmer, and B. A. Schwetz. 1978. Teratologic evaluation of styrene given to rats and rabbits by inhalation or by gavage. Toxicology 11:335–43.
- Mutti, A., S. De Carli, C. Ferroni, and I. Franchini. 1988. Adverse effects of styrene exposure. In Progress in occupational epidemiology, ed. C. Hogstedt, and C. Reuterwall, 177–80. Amsterdam: Elsevier.
- Mutti, A., P. P. Vescovi, M. Falzio, G. Arfini, G. Valenti, and I. Franchini. 1984. Neuroendocrine effects of styrene on occupationally exposed workers. Scand. J. Work Environ. Health. 10:225–28.
- National Institute for Occupational Safety and Health (NIOSH). 1990. Estimated numbers of employees potentially exposed to specific agents by 2-digit standard industrial classification (SIC). National Occupational Exposure Survey Conducted from 1981 to 1983.
- National Institute for Occupational Safety and Health (NIOSH). 2006. NIOSH health hazard evaluation report. HETA #2001-0326-2999, Dixie Cultured Marble, Birmingham, Alabama, U.S. Department of Health and Human Services, Centers for Disease Control and Prevention.
- National Institute for Occupational Safety and Health (NIOSH). 2016. Evaluation of styrene and dust exposures and health effects during fiberglass-reinforced wind turbine blade manufacturing. NIOSH Health Hazard Evaluation Report 2013-0056-3256, U.S. Department of Health and Human Services, Centers for Disease Control and Prevention.
- National Institute of Occupational Safety and Health. (NIOSH). 1982. Extent of exposure to styrene in the reinforced plastic boat making industry. Technical Report DHHS (NIOSH) Pub No 82-110.
- National Library of Medicine (NLM). 2018. Household Products Database – Query for styrene. Last Modified June 2018, Accessed August 2018. https://householdproducts.nlm.nih.gov/cgi-bin/household/brands?tbl=chem&id=287&query=styrene&searchas=TblChemicals1&prodcat=all.
- National Research Council (NRC). 2006. Human biomonitoring for environmental chemicals. National Academies Press, Washington, DC.
- National Toxicology Program (NTP). 2011. Report on Carcinogens, Twelfth edition. Styrene, ntp.niehs.nih.gov.
- National Toxicology Program (NTP) Center for the Evaluation of Risks to Human Reproduction (NTP CERHR). 2006. NTP-CERHR expert panel report on the reproductive and developmental toxicity of Styrene. Report No.: NTP-CERHR-Styrene-05. Research Triangle Park, NC: U.S. Department of Health and Human Services. (also published by: Luderer, U., Collins, T.F.X., Daston, G.P., Fischer, L.J., Gray, R.H., Mirer, F.E., Olshan, A.F., Setzer, R.W., Treinen, K.E., and Vermeulen, R. 2005. NTP-CERHR Expert Panel Report on the Reproductive and Developmental Toxicity of Styrene. Birth Defects Res. (Part B) 77: 110-193).
- Nazaroff, W. W., and C. J. Weschler. 2004. Cleaning products and air fresheners: Exposure to primary and secondary air pollutants. Atmos. Environ. 38:2841–65.
- Nerin, C., and D. Acosta. 2002. Behavior of some solid food simulants in contact with several plastics used in microwave ovens. J. Agric. Food Chem. 50:7488–92.
- Nerin, C., D. Acosta, and C. Rubio. 2002. Potential migration release of volatile compounds from plastic containers destined for food use in microwave ovens. Food Addit. Contam. 19:594–601.
- Nestmann, E. R., B. S. Lynch, and F. Ratpan. 2005. Perspectives on the genotoxic risk of styrene. J. Toxicol. Environ. Health. B. 8:95–107.
- Nicholson, W. J., I. J. Selikoff, and H. Seidman. 1978. Mortality experience of styrene-polystyrene polymerization workers. Initial findings. Scand. J. Work Environ. Health. 4 (Suppl 2):247–52.
- Ninomiya, R., Y. Hirokawa, R. Yamamoto, H. Masui, N. Koizumi, and A. Kubota. 2000. Effects of low concentration of styrene monomer vapor on pregnancy. Nippon Eiseigaku Zasshi 55:547–51.
- Nissen, M. S., A. A. Stokholm, M. Christensen, V. Schlussen, J. M. Vestergarrd, I. B. Iversen, and H. A. Kolstad. 2018. Siinonasal adenocarcinoma following styrene exposure in the reinforced plastics industry. Occup. Environ. Med. 75:412–14.
- Nylen, P., A. C. Hansson, M. Hagman, G. Hoglund, and G. Linder 1987. Inhalation exposure to toluene: Effect of daily dose on auditory sensitivity and nerve conduction velocity in rats. Proceedings of the XXII International Congress on Occupational Health, Sydney, Australia, September 27-October 2, Poster 24.6.
- Nyman, P. J., W. Limm, T. H. Begley, and S. J. Chirtel. 2014. Single-laboratory validation of a method for the determination of select volatile organic compounds in foods by using vacuum distillation with gas chromatography/mass spectrometry. J. AOAC Int. 97:510–20.
- OECD. 2017. Overview of the set of OECD genetic toxicology test guidelines and updates performed in 2014-2015. Series on Testing & Assessment, Report nr 238, Paris: Organisation for Economic Cooperation and Development. http://www.oecd.org/officialdocuments/displaydocument/?cote5env/jm/mono(2016)33&doclanguage5en.
- Ohno, K., Y. Azuma, S. Nakano, T. Kobayashi, S. Hirano, Y. Nobuhara, and T. Yamada. 2001. Assessment of styrene oligomers eluted from polystyrene-made food containers for estrogenic effects in in vitro assays. Food Chem. Toxicol. 39:1233–41.
- Okun, A. H., J. J. Beaumont, T. J. Meinhardt, and M. S. Crandall. 1985. Mortality patterns among styrene-exposed boatbuilders. Am. J. Ind. Med. 8:193–205.
- Ott, M. G., R. C. Kolesar, H. C. Scharnweber, E. J. Schneider, and J. R. Venable. 1980. A mortality survey of employees engaged in the development or manufacture of styrene-based products. J. Occup. Med. 22:445–60.
- Pankow, J. F., W. Luo, A. D. Tavakoli, C. Chen, and L. M. Isabelle. 2004. Delivery levels and behavior of 1,3-butadiene, acrylonitrile, benzene, and other toxic volatile organic compounds in mainstream tobacco smoke from two brands of commercial cigarettes. Chem. Res. Toxicol. 17:805–13.
- Papagiannakopoulos, T., M. R. Bauer, S. M. Davidson, M. Heimann, L. Subbaraj, A. Bhutkar, J. Bartlebaugh, M. G. Vander Heiden, and T. Jacks. 2016. Circadian rhythm disruption promotes lung tumorigenesis. Cell Metab. 24:324–31.
- Paramei, G. V., M. Meyer-Baron, and A. Seeber. 2004. Impairments of colour vision induced by organic solvents: A meta-analysis study. Neurotoxicology 25:803–16.
- Pazo, D. Y., F. Moliere, M. M. Sampson, C. M. Reese, K. A. Agnew-Heard, M. J. Walters, M. R. Holman, B. C. Blount, C. H. Watson, and D. M. Chambers. 2016. Mainstream smoke levels of volatile organic compounds in 50 US Domestic cigarette brands smoked with the ISO and Canadian intense protocols. Nicotine Tobacco Res. 18:1886–94.
- Pellizzari, E. D., T. D. Hartwell, R. L. Perritt, C. M. Sparacino, L. S. Sheldon, H. S. Zelon, R. W. Whitmore, J. J. Breen, and L. Wallace. 1986. Comparison of indoor and outdoor residential levels of volatile organic chemicals in five U.S. geographical areas. Environ. Int. 12:619–23.
- Persoons, R., J. Richard, C. Herve, S. Montlevier, M. Marques, and A. Maitre. 2018. Biomonitoring of styrene occupational exposures: Biomarkers and determinants. Toxicol. Lett. 298:99–105.
- Pleban, F. T., O. Oketope, and L. Shrestha. 2017. Occupational styrene exposure on auditory function among adults: A systematic review of selected workers. Saf. Health Work. 8:329–36.
- Ponomarkov, V., and L. Tomatis. 1978. Effects of long-term oral administration of styrene to mice and rats. Scand. J. Work Environ. Health. 4 (Suppl. 2):127–35.
- Popova, E. 2014. Role of dopamine in distal retina. J. Comp. Physiol. A Neuroethol. Sens. Neural Behav. Physiol. 200:333–58.
- Pouyatos, B., G. Morel, A.-M. Lambert-Xolin, K. Maguin, and P. Campo. 2004. Consequences of noise-or styrene-induced cochlear damages on glutamate decarboxylase levels in the rat inferior colliculus. Hearing Res. 189:83–91.
- Pouyatos, B., P. Campo, and R. Lataye. 2005. Influence of age on noise- and styrene-induced hearing loss in the Long-Evans rat. Environ. Toxicol. Pharmacol. 19:561–70.
- Pryor, G., C. Rebert, K. Kassay, H. Kuiper, and R. Gordon. 1991. The hearing loss associated with exposure to toluene is not caused by a metabolite. Brain Res. Bull. 27:109–13.
- Pryor, G. T., C. S. Rebert, J. Dickinson, and E. M. Feeney. 1984. Factors affecting toluene-induced ototoxicity in rats. Neurobehav. Toxicol. Teratol. 6:223–38.
- Pryor, G. T., J. Dickinson, E. Feeney, and C. S. Rebert. 1987. Hearing loss in rats caused by inhalation of mixed xylenes and styrene. J. Appl. Toxicol. 7:55–61.
- Qin, L.-T., -S.-S. Liu, and H.-L. Liu. 2010. QSPR model for bioconcentration factors of nonpolar organic compounds using molecular electronegativity distance vector descriptors. Mol. Divers. 14:67–80.
- Radican, L., A. Blair, P. Stewart, and D. Wartenberg. 2008. Mortality of aircraft maintenance workers exposed to trichloroethylene and other hydrocarbons and chemicals: Extended follow-up. J. Occup. Environ. Med. 50:1306–19.
- Rahman, M. M., and K.-H. Kim. 2014. Potential hazard of volatile organic compounds contained in household spray products. Atmos. Environ. 85:266–74.
- Ramsey, J. C., J. D. Young, R. J. Karbowski, M. B. Chenoweth, L. P. McCarty, and W. H. Braun. 1980. Pharmacokinetics of inhaled styrene in human volunteers. Toxicol. Appl. Pharmacol. 53:54–63.
- Riihimaki, V., and P. Pfaffli. 1978. Percutaneous absorption of solvent vapors in man. Scand. J. Work Environ. Health. 4:73–85.
- Rizzo, R., S. Quintavalle, M. Stigani, F. Franz, L. Melchiorri, E. DeRosa, and O. R. Baricordi. 2009. Reduced production of anti-inflammatory soluble HLA-G molecules in styrene exposed workers. Environ. Toxicol. Pharmacol. 27:303–05.
- Roberts, A. L., K. Lyall, J. E. Hart, F. Laden, A. C. Just, J. F. Bobb, K. C. Koenen, A. Ascherio, and M. G. Weisskopf. 2013. Perinatal air pollutant exposures and autism spectrum disorder in the children of Nurses’ Health Study II participants. Environ. Health Perspect. 121:978–84.
- Rowe, B. L., P. L. Toccalino, M. J. Moran, J. S. Zogorski, and C. V. Price. 2007. Occurrence and potential human-health relevance of volatile organic compounds in drinking water from domestic wells in the United States. Environ. Health Perspect. 115:1539–46.
- Ruder, A. M., A. R. Meyers, and S. J. Bertke. 2016. Mortality among styrene-exposed workers in the reinforced plastic boatbuilding industry. Occup. Environ. Med. 73:97–102.
- Ruder, A. M., E. M. Ward, M. Dong, A. H. Okun, and K. Davis-King. 2004. Mortality patterns among workers exposed to styrene in the reinforced plastic boatbuilding industry: An update. Am. J. Ind. Med. 45:165–76.
- Ruder, A. M., and S. J. Bertke. 2017. Cancer incidence among boat-building workers exposed to styrene. Am. J. Ind. Med. 60:651–57.
- Sack, T. M., D. H. Steele, K. Hammerstrom, and J. Remmers. 1992. A survey of household products for volatile organic compounds. Atmos. Environ. 26A:1063–70.
- Sallmen, M., M. L. Lindbohm, A. Anttila, P. Kyyronen, H. Taskinen, E. Nykyri, and K. Hemminki. 1998. Time to pregnancy among the wives of men exposed to organic solvents. Occup. Environ. Med. 55:24–30.
- Salomaa, S., M. Donner, and H. Norppa. 1985. Inactivity of styrene in the mouse sperm morphology test. Toxicol. Lett. 24:151–55.
- Sanagi, M. M., S. L. Ling, Z. Nasir, W. Ibrahim, and A. Abu Naim. 2008. Determination of residual volatile organic compounds migrated from polystyrene food packaging into food simulant by headspace solid phase microextraction – Gas chromatography. Malaysian J. Anal. Sci. 12:542–51.
- Santini, F., A. Mantovani, A. Cristaudo, T. Rago, A. Marsili, R. Buselli, A. Mignani, G. Ceccarini, R. Bastillo, D. Taddei, et al. 2008. Thyroid function and exposure to styrene. Thyroid 18:1065–69.
- Sarangapani, R., P. R. Gentry, T. R. Covington, J. G. Teeguarden, and H. J. Clewell. 2003. Evaluation of the potential impact of age- and gender-specific lung morphology and ventilation rate on the dosimetry of vapors. Inhal Toxicol 15:987–1016.
- Sarigiannis, D. A., S. P. Karakitsios, A. Gotti, I. L. Liakos, and A. Katsoyiannis. 2011. Exposure to major volatile organic compounds and carbonyls in European indoor environments and associated health risk. Environ. Int. 37:743–65.
- Sass-Kortsak, A. M., P. N. Corey, and J. M. Robertson. 1995. An investigation of the association between exposure to styrene and hearing loss. Ann. Epidemiol. 5:15–24.
- Sathiakumar, N., I. Brill, M. Leader, and E. Delzell. 2015. 1,3-Butadiene, styrene and lymphohematopoietic cancer among male synthetic rubber industry workers – Preliminary exposure-response analyses. Chem. Biol. Interact. 241:40–49.
- Sato, A., T. Nakajima, and Y. Koyama. 1981. Dose-related effects of a single dose of ethanol on the metabolism in rat-liver of some aromatic and chlorinated hydrocarbons. Toxicol. Appl. Pharmacol. 60:8–15.
- Sax, S. N., D. H. Bennett, S. N. Chillrud, J. Ross, P. L. Kinney, and J. D. Spengler. 2006. A cancer risk assessment of inner-city teenagers living in New York City and Los Angeles. Environ. Health Perspect. 114:1558–66.
- Sax, S. N., D. H. Bennett, S. N. Chillrud, P. L. Kinney, and J. D. Spengler. 2004. Differences in source emission rates of volatile organic compounds in inner-city residences of New York City and Los Angeles. J. Expo. Anal. Environ. Epidemiol. 14:S95–S109.
- Scélo, G., V. Constantinescu, I. Csiki, D. Zaridze, N. Szeszenia-Dabrowska, P. Rudnai, J. Lissowska, E. Fabianova, A. Cassidy, A. Slamova, et al. 2004. Occupational exposure to vinyl chloride, acrylonitrile and styrene and lung cancer risk (Europe). Cancer Causes Control 15:445–52.
- Schlink, U., A. Thiem, T. Kohajda, M. Richter, and K. Strebel. 2010. Quantile regression of indoor air concentrations of volatile organic compounds (VOC). Sci. Total Environ. 408:3840–51.
- Schwartz, S. 2010. Visual perception: A clinical orientation. Fourth ed. McGraw Hill Medical, New York City.
- Schwarz, K. J., L. I. Boitz, and F. J. Methner. 2012. Enzymatic formation of styrene during wheat beer fermentation is dependent on pitching rate and cinnamic acid content. J. I. Brewing 118:280–84.
- Scott, D., and R. J. Preston. 1994a. A re-evaluation of the cytogenetic effects of styrene. Mutat. Res. 318:175–203.
- Scott, D., and R. J. Preston. 1994b. A critical review of the cytogenetic effects of styrene with an emphasis on human populaton monitoring: A synopsis. Crit. Rev. Toxicol. 24 (Suppl):S47–S48.
- Seeber, A., T. Bruckner, and G. Triebig. 2009a. Occupational styrene exposure and neurobehavioural functions: A cohort study with repeated measurements. Int. Arch. Occup. Environ. Health. 82:969–84.
- Seeber, A., T. Bruckner, and G. Triebig. 2009b. Occupational styrene exposure, colour vision and contrast sensitivity: A cohort study with repeated measurements. Int. Arch. Occup. Environ. Health. 82:757–70.
- Seidler, A., M. Mohner, J. Berger, B. Mester, E. Deeg, G. Elsner, A. Nieters, and N. Becker. 2007. Solvent exposure and malignant lymphoma: A population-based case-control study in Germany. J. Occup. Med. Toxicol. 2:2.
- Serdar, B., R. Tornero‐Velez, D. Echeverria, L. A. Nylander‐French, L. L. Kupper, and S. M. Rappaport. 2006. Predictors of occupational exposure to styrene and styrene-7,8-oxide in the reinforced plastics industry. Occup. Environ. Med. 63:707–12.
- Seth, R., and D. Mackay. 2002. Fugacity modeling to predict long-term environmental fate of chemicals from hazardous spills. In The handbook of hazardous materials spills technology, ed. M. F. Fingas. McGraw-Hill, New York.
- Sexton, K., I. A. Greaves, T. R. Church, J. L. Adgate, G. Ramachandran, R. L. Tweedie, A. Fredrickson, M. Geisser, M. Sikorski, and G. Fischer. 2000. A school-based strategy to assess children’s environmental exposures and related health effects in economically disadvantaged urban neighborhoods. J. Expo. Sci. Environ. Epidemiol. 10:682–94.
- Sexton, K., J. L. Adgate, A. L. Fredrickson, A. D. Ryan, L. L. Needham, and D. L. Ashley. 2006. Using biologic markers in blood to assess exposure to multiple environmental chemicals for inner-city children 3–6 years of age. Environ. Health Perspect. 114:453–59.
- Sexton, K., J. L. Adgate, G. Ramachandran, G. C. Pratt, S. J. Mongin, T. H. Stock, and M. T. Morandi. 2004b. Comparison of personal, indoor, and outdoor exposures to hazardous air pollutants in three urban communities. Environ. Sci. Technol. 38:423–30.
- Sexton, K., J. L. Adgate, S. J. Mongin, G. C. Pratt, G. Ramachandran, T. H. Stock, and M. T. Morandi. 2004a. Evaluating differences between measured personal exposures to volatile organic compounds and concentrations in outdoor and indoor air. Environ. Sci. Technol. 38:2593–602.
- Sexton, K., L. L. Needham, and J. L. Pirkle. 2004c. Human biomonitoring of environmental chemicals. Am. Scientist. 92:38–45.
- Sexton, K., S. J. Mongin, J. L. Adgate, G. C. Pratt, G. Ramachandran, T. H. Stock, and M. T. Morandi. 2007. Estimating volatile organic compound concentrations in selected microenvironments using time-activity and personal exposure data. J. Toxicol. Environ. Health. A 70:465–76.
- Sha, S.-H., R. Taylor, A. Forge, and J. Schacht. 2001. Differential vulnerability of basal and apical hair cells is based on intrinsic susceptibility to free radicals. Hearing Res. 155:1–8.
- Sheedy, J. E. 1997. Styrene exposure and color vision. SIRC Rev. 5:7–30.
- Shen, S., L. Lei, X. Ding, and J. Zheng. 2014. Metabolism of styrene to styrene oxide and vinylphenols in cytochrome P450 2F2- and P450 2E1-knockout mouse liver and lung microsomes. Chem. Res. Toxicol. 27:27–33.
- Shigeta, S., K. Miyake, H. Aikawa, and T. Misawa. 1989. Effects of postnatal low-levels of exposure to styrene on behavior and development in rats. J. Toxicol. Sci. 14:279–86.
- Siemiatycki, J., ed. 1991. Risk factors for cancer in the workplace. Boca Raton, FL: CRC Press.
- Singer, B. C., A. T. Hodgson, and W. W. Nazaroff. 2003. Gas-phase organics in environmental tobacco smoke: 2. Exposure-relevant emission factors and indirect exposures from habitual smoking. Atmos. Environ. 37:5551–61.
- Sisto, R., L. Cerini, M. P. Gatto, M. Gherardi, A. Gordiani, F. Sanjust, E. Paci, G. Tranfo, and A. Moleti. 2013. Otoacoustic emission sensitivity to exposure to styrene and noise. J. Acoust. Soc. Am. 134:3739–48.
- Sisto, R., T. Botti, L. Cerini, F. Sanjust, G. Tranfo, R. Bonanni, E. Paci, D. Pigini, and A. Moleti. 2016. Oxidative stress biomarkers and otoacoustic emissions in humans exposed to styrene and noise. Int. J. Audiol. 55:523–31.
- Skoog, K. O., and S. E. G. Nilsson. 1981. Changes in the c-wave of the electroretinogram and in the standing potential of the eye after small doses of toluene and styrene. Acta Ophthalmol 59:71–79.
- Śliwińska-Kowalska, M., E. Zamyslowska-Szmytke, W. Szymczak, P. Kotylo, M. Fiszer, W. Wesolowski, and M. Pawlaczyk-Luszczynska. 2003. Ototoxic effects of occupational exposure to styrene and co-exposure to styrene and noise. J. Occup. Environ. Med. 45:15–24.
- Śliwińska-Kowalska, M., E. Zamyslowska-Szmytke, W. Szymczak, P. Kotylo, M. Fiszer, W. Wesolowski, and M. Pawlaczyk-Luszczynska. 2005. Exacerbation of noise-induced hearing loss by co-exposure to workplace chemicals. Environ. Toxicol. Pharmacol. 19:547–53.
- Śliwinska-Kowalska, M., D. Prasher, C. Rodrigues, E. Zamysłowska-Szmytke, P. Campo, D. Henderson, S. Lund, A.-C. Johnson, M. Schäper, and L. Ödkvist. 2007. Ototoxicity of organic solvents – From scientific evidence to health policy. Int. J. Occup. Med. Environ. Health. 20:215–22.
- Śliwińska-Kowalska, M., and K. Zaborowski. 2017. WHO environmental noise guidelines for the European region: A systematic review on environmental noise and permanent hearing loss and tinnitus. Int. J. Env. Res. Public Health 14:1139.
- Speit, G., and L. Henderson. 2005. Review of the in vivo genotoxicity tests performed with styrene. Mutat. Res. 589:67–79.
- Srivastava, S., P. K. Seth, and S. P. Srivastava. 1989. Effect of styrene administration on rat testis. Arch. Toxicol. 63:43–46.
- Srivastava, S., P. K. Seth, and S. P. Srivastava. 1992a. Effect of styrene on testicular enzymes of growing rat. Indian J. Exp. Biol. 30:399–401.
- Srivastava, S., P. K. Seth, and S. P. Srivastava. 1992b. Biochemical and morphological studies in testes of rat offspring of mothers exposed to styrene during lactation. Pharmacol. Toxicol. 70:314–16.
- Srivastava, S., P. K. Seth, and S. P. Srivastava. 1992c. Altered activity of hepatic mixed function oxidase, cytochrome P-450 and glutathione-S-transferase by styrene in rat fetal liver. Drug Chem. Toxicol. 15:233–44.
- Srivastava, S., S. P. Srivastava, and P. K. Seth. 1990. Embryo/fetotoxicity of styrene in rats. J. Environ. Biol. 11:73–77.
- Statistics Canada. 2004. Canadian community health survey – Nutrition (CCHS). Detailed information for 2004 (Cycle 2.2). http://www23.statcan.gc.ca/imdb/p2SV.pl?Function=getSurvey&Id=7498.
- Staudt, A. M. 2016. Effects of exposure to organic solvents and occupational noise on hearing loss and tinnitus In US adults from 1999 to 2004. The University of Texas School of Public Health.
- Steele, D. H., M. J. Thornburg, J. S. Stanley, R. R. Miller, R. Brooke, J. R. Cushman, and G. Cruzan. 1994. Determination of styrene in selected foods. J. Agric. Food Chem. 42:1661–65.
- Stefaniak, A. B., P. N. Breysse, M. P. Murray, B. C. Rooney, and J. Schaefer. 2000. An evaluation of employee exposure to volatile organic compounds in three photocopy centers. Environ. Res. 83:162–73.
- Steinle, S., S. Reis, and C. E. Sabel. 2013. Quantifying human exposure to air pollution – Moving from static monitoring to spatio-temporally resolved personal exposure assessment. Sci. Total Environ. 443:184–93.
- Stocco, C., M. MacNeill, D. Wang, X. Xu, M. Guay, J. Brook, and A. J. Wheeler. 2008. Predicting personal exposure of Windsor, Ontario residents to volatile organic compounds using indoor measurements and survey data. Atmos. Environ. 42:5905–12.
- Stockwell, C., P. Veres, J. Williams, and R. Yokelson. 2015. Characterization of biomass burning emissions from cooking fires, peat, crop residue, and other fuels with high-resolution proton-transfer-reaction time-of-flight mass spectrometry. Atmos. Chem. Phys. 15:845–65.
- Strafella, E., M. Bracci, S. Staffolani, N. Manzella, D. Giantomasi, M. Valentino, M. Amati, M. Tomasetti, and L. Santarelli. 2013. Occupational styrene exposure induces stress-responsive genes involved in cytoprotective and cytotoxic activities. PLoS ONE 23:e75401. eCollection 2013. doi:10.1371/journal.pone.0075401.
- Styrene Information & Research Center (SIRC). 2011. Jobs and economy: Industry size. Accessed August 2017. http://youknowstyrene.org/jobs-and-economy/industry-size/.
- Su, F.-C., B. Mukherjee, and S. Batterman. 2011. Trends of VOC exposures among a nationally representative sample: Analysis of the NHANES 1988 through 2004 data sets. Atmos. Environ. 45:4858–67.
- Sumner, S. J., and T. R. Fennell. 1994. Review of the metabolic fate of styrene. Crit. Rev. Toxicol. 24:S11–S33.
- Tabacova, S., and L. Balabaeva. 1993. Environmental pollutants in relation to complications of pregnancy. Environ. Health Perspect. 101 (Suppl. 2):27–31.
- Takao, T., W. Nanamiya, H. P. Nazarloo, K. Asaba, and K. Hashimoto. 2000. Possible reproductive toxicity of styrene in peripubertal male mice. Endocr. J. 47:343–47.
- Talbott, E. O., L. P. Marshall, J. R. Rager, V. C. Arena, R. K. Sharma, and S. L. Stacy. 2015. Air toxics and the risk of autism spectrum disorder: The results of a population based case-control study in southwestern Pennsylvania. Environ. Health 14:80.
- Talhout, R., T. Schulz, E. Florek, J. Van Benthem, P. Wester, and A. Opperhuizen. 2011. Hazardous compounds in tobacco smoke. Int. J. Env. Res. Public Health. 8:613–28.
- Tang, W., I. Hemm, and G. Eisenbrand. 2000. Estimation of human exposure to styrene and ethylbenzene. Toxicology 144:39–50.
- Tannock, R., T. Banaschewski, and D. Gold. 2006. Color naming deficits and attention-deficit/hyperactivity disorder: A retinal dopaminergic hypothesis. Behav. Brain Funct. 2:4.
- Taskinen, H., A. Anttila, M. L. Lindbohm, M. Sallmen, and T. Hemminki. 1989. Spontaneous abortions and congenital malformations among the wives of men occupationally exposed to organic solvents. Scand. J. Work Environ. Health. 15:345–52.
- Tawfik, M. S., and H. BaAbdullah. 2014. Migration levels of monostyrene in most vulnerable foods handled and stored in polystyrene containers and their impact on the daily intake. Pakistan J. Food Sci. 24:57–63.
- Tehrany, E. A., and S. Desobry. 2004. Partition coefficients in food/packaging systems: A review. Food Addit.Contamin. 21:1186–202.
- Teixeira, J. P., J. Gaspar, S. Silva, J. Torres, S. N. Silva, M. C. Azevedo, P. Neves, B. Laffon, J. Méndez, C. Gonçalves, et al. 2004. Occupational exposure to styrene: Modulation of cytogenetic damage and levels of urinary metabolites of styrene by polymorphisms in genes CYP2E1, EPHX1, GSTM1, GSTT1 and GSTP1. Toxicology 195:231–42.
- Theorell, T., G. Ahlberg-Hulten, F. Sigala, A. Perski, M. Soderholm, A. Kallner, and P. Eneroth. 1990. A psychosocial and biomedical comparison between men in six contrasting service occupations. Work Stress 4:51–63.
- Thomas, K. W., E. D. Pellizzari, C. A. Clayton, R. L. Perritt, R. N. Dietz, R. W. Goodrich, W. C. Nelson, and L. A. Wallace. 1993. Temporal variability of benzene exposures for residents in several New Jersey homes with attached garages or tobacco smoke. J. Expo. Anal. Environ. Epidemiol. 3:49–73.
- Till, D. E., D. J. Ehntholt, R. C. Reid, P. S. Schwartz, A. D. Schwope, K. R. Sidman, and R. H. Whelan. 1982. Migration of styrene monomer from crystal polystyrene to foods and food simulating liquids. Ind. Eng. Chem. Fundam. 21:161–68.
- Tognola, G., E. Chiaramello, R. Sisto, and A. Moleti. 2015. Susceptibility of linear and nonlinear otoacoustic emission components to low-dose styrene exposure. Int. J. Audiol. 54:199–209.
- Tomanin, R., C. Ballarin, G. B. Bartolucci, E. De Rosa, G. Sessa, G. Iannini, A. R. Cupiraggi, and F. Sarto. 1992. Chromosome aberrations and micronuclei in lymphocytes of workers exposed to low and medium levels of styrene. Int. Arch. Occup. Environ. Health. 64:209–15.
- Tranfo, G., M. Gherardi, E. Paci, M. Gatto, A. Gordiani, L. Caporossi, S. Capanna, R. Sisto, B. Papaleo, C. Fiumalbi, et al. 2012. Occupational exposure to styrene in the fibreglass reinforced plastic industry: Comparison between two different manufacturing processes. Med. Del. Lavoro. 103:402–12.
- Triebig, G., T. Bruckner, and A. Seeber. 2009. Occupational styrene exposure and hearing loss: A cohort study with repeated measurements. Int. Arch. Occup. Environ. Health. 82:463–80.
- Triebig, G., T. Stark, A. Ihrig, and M. C. Dietz. 2001. Intervention study on acquired color vision deficiencies in styrene-exposed workers. J. Occup. Environ. Med. 43:494–500.
- Tulinska, J., M. Dusinska, E. Jahnova, A. Loskova, M. Kuricova, P. Vodicka, L. Vodickova, M. Sulcova, and L. Fuortes. 2000. Changes in cellular immunity among worker occupationally exposed to styrene in a plastics lamination plant. Am. J. Ind. Med. 38:576–83.
- U.K. Ministry of Agriculture, Fisheries, and Food. 1983. Survey of styrene levels in food contact materials and in foods. The Eleventh Report of the Steering Group on Food Surveillance, London.
- U.S. Bureau of Labor Statistics. 2014. Women in the labor force: A databook. Report No.: Report 1052.
- U.S. Consumer Product Safety Commission (US CPSC). 2014. Children’s oral exposure to phthalate alternatives from mouthing soft plastic children’s articles.
- U.S. Department of Agriculture (USDA). 2013. Retail commodity intakes: Mean amounts of retail commodities per individual, 2007-08.
- U.S. Environmental Protection Agency (U.S. EPA). 1987. Occurrence of synthetic organic chemicals in drinking water, food, and air. Report No.: PB89-192520, Washington, D.C.: Office of Drinking Water.
- U.S. Environmental Protection Agency (U.S. EPA). 1993a. Catalog of materials as potential sources of indoor air emissions. Volume 1. Insulation, wallcoverings, resilient floor coverings, carpet, adhesives, sealants and caulks, and pesticides, Washington, D.C.
- U.S. Environmental Protection Agency (U.S. EPA). 1993b. Determination of rates of reaction in the gas-phase in the troposphere. Theory and practice 5. Rate of indirect photoraction: Evaluation of the atmospheric oxidation computer program of syracuse research corporation for estimating the seond-order rate constant for the reaction of an organic chemical with hydroxyl radicals. Report No.: EPA-744-R-93-001, Washington, D.C.: Office of Pollution Prevention and Toxics.
- U.S. Environmental Protection Agency (U.S. EPA). 1999. A review of contaminant occurrence in public water systems, Washington, D.C Office of Water.
- U.S. Environmental Protection Agency (U.S. EPA). 2002. A review of the reference dose and reference concentration processes. Risk Assessment Forum. EPA/630/P-02/002F, U.S. Environmental Protection Agency, Washington DC. https://www.epa.gov/sites/production/files/2014-12/documents/rfd-final.pdf.
- U.S. Environmental Protection Agency (U.S. EPA). 2009. Risk assessment guidance for superfund volume I: Human health evaluation manual (Part F). Report No.: EPA-540-R-070-002, Washington, D.C: Office of Superfund Remediation and Technology Innovation.
- U.S. Environmental Protection Agency (U.S. EPA). 2010. The analysis of regulated contaminant occurrence data from public water systems in support of the second six-year review of national primary drinking water regulations. Office of Water. US EPA, Washington, DC.
- U.S. Environmental Protection Agency (U.S. EPA). 2011. Exposure Factors Handbook: 2011 Edition, Washington, D.C. National Center for Environmental Assessment.
- U.S. Environmental Protection Agency (U.S. EPA). 2014a. Endocrine disruption screening program. https://www.epa.gov/endocrine-disruption/overview-second-list-chemicals-tier-1-screening-under-endocrine-disruptor.
- U.S. Environmental Protection Agency (U.S. EPA). 2014b. EPA positive matrix factorization (PMF) 5.0 fundamentals and user guide. Report No.: EPA/600/R-14/108, Washington, D.C: Office of Research and Development.
- U.S. Environmental Protection Agency (U.S. EPA). 2015. 2013 national monitoring programs annual report (UATMP, NATTS, CSATAM). Final Report. Report No.: EPA-454/R-15-005a, Research Triangle Park, NC: Office of Air Quality Planning and Standards. http://www.epa.gov/ttnamti1/uatm.html.
- U.S. Environmental Protection Agency (U.S. EPA). 2016. Statistical Software ProUCL 5. 1.00 for environmental applications for data sets with and without nondetect observations, https://www.epa.gov/land-research/proucl-software.
- U.S. Environmental Protection Agency (U.S. EPA). 2017a. Air data: Air quality data collected at outdoor monitors across the US. Last Modified June 12, 2017, Accessed June, 2017. https://www.epa.gov/outdoor-air-quality-data.
- U.S. Environmental Protection Agency (U.S. EPA). 2017b. Regional screening levels for chemical contaminants at superfund sites (June 2017). Last Modified June 2017. https://www.epa.gov/risk/regional-screening-levels-rsls-generic-tables-june-2017.
- U.S. Environmental Protection Agency (U.S. EPA). 2018a. The 2014 national emissions inventory version 2 (released February 2018). Last Modified 8/8/2018, Accessed August 2018. https://www.epa.gov/air-emissions-inventories/2014-national-emissions-inventory-nei-data.
- U.S. Environmental Protection Agency (U.S. EPA). 2018b. 2014 National Emissions Inventory, version 2 Technical Support Document, Research Triangle Park, NC: Office of Air Quality Planning and Standards.
- U.S. Environmental Protection Agency (U.S. EPA). 2018c. 2016 toxics release inventory national analysis. Last Modified January 30, 2018, Accessed June 2017. https://www.epa.gov/trinationalanalysis.
- U.S. Food and Drug Administration (FDA). 2007. Guidance for industry: Preparation of premarket submissions for food contact substances: Chemistry recommendations. https://www.fda.gov/Food/GuidanceRegulation/GuidanceDocumentsRegulatoryInformation/IngredientsAdditivesGRASPackaging/ucm081818.htm#iie1.
- U.S. Food and Drug Administration (FDA). 2016. Total diet study. Last Modified 4/08/2016, Accessed June 2017. https://www.fda.gov/food/foodscienceresearch/totaldietstudy/default.htm.
- U.S. Food and Drug Administration (FDA). 2017. Components of paper and paperboard in contact with aqueous and fatty foods. https://www.ecfr.gov/cgi-bin/text-idx?SID=7f2c814102e5ff83a005dfb5e61d669b&mc=true&node=se21.3.176_1170&rgn=div8.
- U.S. National Air Toxics Assessment (U.S. NATA). 2005. 2005 NATA: Assessment results. https://www.epa.gov/national-air-toxics-assessment/2005-nata-assessment-results
- U.S. National Cancer Institute (U.S. NCI). 1979a. Bioassay of styrene for possible carcinogenicity. NCI-CG-TR-185, Bethesda, MD: U.S. Department of Health, Education, and Welfare, Public Health Service, National Institutes of Health.
- U.S. National Cancer Institute (U.S. NCI). 1979b. Bioassay of a solution of beta-nitrostyrene and styrene for possible carcinogenicity. NCI-CG-TR-170, Bethesda, MD: U.S. Department of Health, Education, and Welfare, Public Health Service, National Institutes of Health.
- Umemura, T., N. Kurahashi, T. Kondo, Y. Katakura, F. Sata, T. Kawai, and R. Kishi. 2005. Acute effects of styrene inhalation on the neuroendocrinological system of rats and the different effects in male and female rats. Arch. Toxicol. 79:653–59.
- United Kingdom (U.K.) Competent Authority. 2008. Annex XV Transitional Dossier, Styrene.
- United Kingdom (U.K.) Environment Agency. 2015. Contaminated land exposure assessment (CLEA) tool. https://www.gov.uk/government/publications/contaminated-land-exposure-assessment-clea-tool.
- United Kingdom Health & Safety Executive (U.K. HSE). 2008. European Union risk assessment report. Styrene, Draft.
- United States International Trade Commission. 2017. USITC interactive tariff and trade DataWeb query for styrene exports (HTS 290250). accessed August, 2017. https://dataweb.usitc.gov/scripts/intro.asp.
- Valcke, M., and K. Krishnan. 2011. Assessing the impact of the duration and intensity of inhalation exposure on the magnitude of the variability of internal dose metrics in children and adults. Inhal Toxicol 23:863–77.
- Van Hummelen, P., M. Severi, W. Pauwels, D. Roosels, H. Veulemans, and M. Kirsch-Volders. 1994. Cytogenetic analysis of lymphocytes from fiberglass-reinforced plastics workers occupationally exposed to styrene. Mutat. Res. 310:157–65.
- Van Rooij, J. G. M., A. Kasper, G. Triebig, P. Werner, F. J. Jongeneelen, and H. Kromhout. 2008. Trends in occupational exposure to styrene in the European glass fibre-reinforced plastics industry. Ann. Occup. Hyg. 52:337–49.
- Van Winkle, M. R., and P. A. Scheff. 2001. Volatile organic compounds, polycyclic aromatic hydrocarbons and elements in the air of ten urban homes. Indoor Air 11:49–64.
- Venet, T., P. Campo, A. Thomas, C. Cour, B. Rieger, and F. Cosnier. 2015. The tonotopicity of styrene-induced hearing loss depends on the associated noise spectrum. Neurotoxicol. Teratol. 48:56–63.
- Vettori, M. V., D. Corradi, T. Coccini, A. Carta, S. Cavazzini, L. Manzo, and A. Mutti. 2000. Styrene-induced changes in amacrine retinal cells: An experimental study in the rat. Neurotoxicology 21:607–14.
- Viaene, M., W. Pauwels, H. Veulemans, H. Roels, and R. Masschelein. 2001. Neurobehavioural changes and persistence of complaints in workers exposed to styrene in a polyester boat building plant: Influence of exposure characteristics and microsomal epoxide hydrolase phenotype. Occup. Environ. Med. 58:103–12.
- Vinci, R. M., L. Jacxsens, B. De Meulenaer, E. Deconink, E. Matsiko, C. Lachat, T. de Schaetzen, M. Canfyn, I. Van Overmeire, and P. Kolsteren. 2015. Occurrence of volatile organic compounds in foods from the Belgian market and dietary exposure assessment. Food Control 52:1–8.
- Vodicka, P., J. Tuimala, R. Stetina, R. Kumar, P. Manini, A. Naccarati, L. Maestri, L. Vodickova, M. Kuricova, H. Järventaus, et al. 2004. Cytogenetic markers, DNA single-strand breaks, urinary metabolites, and DNA repair rates in styrene-exposed lamination workers. Environ. Health Perspect. 112:867–71.
- Vodicka, P., P. Soucek, A. D. Tates, M. Dusinska, J. Sarmanova, M. Zamecnikova, L. Vodickova, M. Koskinen, F. A. de Zwart, A. T. Natarajan, et al. 2001. Association between genetic polymorphisms and biomarkers in styrene-exposed workers. Mutat. Res. 482:89–103.
- Vodicka, P., T. Bastlova, L. Vodickova, K. Peterkova, B. Lambert, and K. Hemminki. 1995. Biomarkers of styrene exposure in lamination workers: Levels of O6-guanine DNA adducts, DNA strand breaks and mutant frequencies in the hypoxanthine guanine phophoribosyltransferase gene in T-lymphocytes. Carcinogenesis 16:1473–81.
- Vodicka, P., T. Tvrdik, S. Osterman-Golkar, L. Vodickova, K. Peterkova, P. Soucek, J. Sarmanova, P. B. Farmer, F. Granath, B. Lambert, et al. 1999. An evaluation of styrene genotoxicity using several biomarkers in a 3-year follow-up study of hand-lamination workers. Mutat. Res. 445:205–24.
- Vyskocil, A., G. Truchon, T. Leroux, F. Lemay, M. Gendron, F. Gagnon, N. E. Majidi, A. Boudjerida, S. Lim, C. Emond, et al. 2012. A weight of evidence approach for the assessment of the ototoxic potential of industrial chemicals. Toxicol. Ind. Health. 28:796–819.
- Wallace, L. A. 1989. Major sources of benzene exposure. Environ. Health Perspect. 101:13–16.
- Wallace, L. A. 1991a. Comparison of risks from outdoor and indoor exposure to toxic chemicals. Environ. Health Perspect. 95:7–13.
- Wallace, L. A. 1991b. Personal exposure to 25 volatile organic compounds. EPA’s 1987 TEAM study in Los Angeles, California. Toxicol. Ind. Health. 7:203–08.
- Wallace, L. A. 1993. A decade of studies of human exposure: What have we learned? Risk Anal. 13:135–39.
- Wallace, L. A. 1996. Environmental exposure to benzene: An update. Environ. Health Perspect. 104 (Suppl 6):1129–36.
- Wallace, L. A. 2001. Human exposure to volatile organic pollutants: Implications for indoor air studies. Annu. Rev. Energy Environ. 26:269–301.
- Wallace, L. A., E. Pellizzari, B. Leaderer, H. Zelon, and L. Sheldon. 1987c. Emissions of volatile organic compounds from building materials and consumer products. Atmos. Environ. 21:385–93.
- Wallace, L. A., E. Pellizzari, T. Hartwell, H. Zelon, C. Sparacino, R. Perritt, and R. Whitmore. 1986a. Concentrations of 20 volatile organic compounds in the air and drinking water of 350 residents of New Jersey compared with concentrations in their exhaled breath. J. Occup. Environ. Med. 28:603–08.
- Wallace, L. A., and E. D. Pellizzari. 1986. Personal air exposures and breath concentrations of benzene and other volatile hydrocarbons for smokers and nonsmokers. Toxicol. Lett. 35:113–16.
- Wallace, L. A., and E. D. Pellizzari. 1995. Recent advances in measuring exhaled breath and estimating exposure and body burden for volatile organic compounds (VOCs). Environ. Health Perspect. 103 (Suppl 3):95–98.
- Wallace, L. A., E. D. Pellizzari, T. D. Hartwell, C. Sparacino, R. Whitmore, L. Sheldon, H. Zelon, and R. Perritt. 1987b. The TEAM (total exposure assessment methodology) study: Personal exposures to toxic substances in air, drinking water, and breath of 400 residents of New Jersey, North Carolina, and North Dakota. Environ. Res. 43:290–307.
- Wallace, L. A., E. D. Pellizzari, T. D. Hartwell, C. M. Sparacino, L. S. Sheldon, and H. Zelon. 1985. Personal exposures, indoor-outdoor relationships, and breath levels of toxic air pollutants measured for 355 persons in New Jersey. Atmosp. Environ. 19:1651–61.
- Wallace, L. A., E. D. Pellizzari, T. D. Hartwell, R. Perritt, and R. Zeigenfus. 1987a. Exposures to benzene and other volatile compounds from active and passive smoking. Arch. Environ. Health. 42:272–79.
- Wallace, L. A., E. D. Pellizzari, T. D. Hartwell, R. Whitmore, C. Sparacino, and H. Zelon. 1986b. Total exposure assessment methodology (team) study: Personal exposures, indoor-outdoor relationships, and breath levels of volatile organic compounds in New Jersey. Environ. Int. 12:369–87.
- Wallace, L. A., E. D. Pellizzari, T. D. Hartwell, R. Whitmore, H. Zelon, R. Perritt, and L. Sheldon. 1988. The California TEAM study: Breath concentrations and personal exposures to 26 volatile compounds in air and drinking water of 188 residents of Los Angeles, Antioch, and Pittsburg, CA. Atmosp. Environ. 22:2141–63.
- Wallace, L. A., E. D. Pellizzari, T. D. Hartwell, V. Davis, L. C. Michael, and R. Q. Whitmore. 1989. The influence of personal activities on exposure to volatile organic compounds. Environ. Res. 50:37–55.
- Wan, G., G. Corfas, and J. S. Stone. 2013. Inner ear supporting cells: Rethinking the silent majority. Semin. Cell Dev. Biol. 24:448–59.
- Wang, Y., T. Saito, T. Hosokawa, M. Kurasaki, and K. Saito. 2001. Changes in middle latency auditory-evoked potentials of the rat exposed to styrene. J. Health Sci. 47:175–83.
- Wei, Y., H. Wu, L. Li, Z. Liu, X. Zhou, Q.-Y. Zhang, Y. Weng, J. D’Agostino, G. Ling, X. Zhang, et al. 2012. Generation and characterization of a CYP2A13/2B6/2F1-transgenic mouse model. Drug Metab. Dispos. 40:1144–50.
- Weisel, C. P., J. Zhang, B. J. Turpin, M. T. Morandi, S. Colome, T. H. Stock, D. M. Spektor, L. Korn, A. M. Winer, J. Kwon, et al. 2005. Relationships of Indoor, Outdoor, and Personal Air (RIOPA). Part I. Collection methods and descriptive analyses. Res. Rep. Health Eff. Inst. 130:1–107. discussion 109-127.
- Weschler, C. J. 2009. Changes in indoor pollutants since the 1950s. Atmos. Environ. 43:153–69.
- Wheeler, A. J., S. L. Wong, C. Khoury, and J. Zhu. 2013. Predictors of indoor BTEX concentrations in Canadian residences. Health Rep 24:11–17.
- Willem, H., and B. C. Singer. 2010. Chemical emissions of residential materials and products: Review of available information. Ernest Orlando Lawrence Berkeley National Laboratory, Environmental Energy Technologies Division, Berkeley, CA.
- Windham, G. C., A. Sumner, S. X. Li, M. Anderson, E. Katz, L. A. Croen, and J. K. Grether. 2013. Use of birth certificates to examine maternal occupational exposures and autism spectrum disorders in offspring. Autism. Res. 6:57–63.
- Windham, G. C., L. Zhang, R. Gunier, L. A. Croen, and J. K. Grether. 2006. Autism spectrum disorders in relation to distribution of hazardous air pollutants in the San Francisco Bay Area. Environ. Health Perspect. 114:1438–44.
- Witkovsky, P. 2004. Dopamine and retinal function. Doc. Ophthalmol. 108:17–39.
- Wittrig, B. 2002. Monitoring volatiles in food contact packaging. In Excerpted from food quality magazine, Nov/Dec 2002.
- Wolkoff, P. 1995. Volatile organic compounds sources, measurements, emissions, and the impact on indoor air quality. Indoor Air 5:5–73.
- Wolkoff, P., C. K. Wilkins, P. A. Clausen, and K. Larsen. 1993. Comparison of volatile organic compounds from processed paper and toners from office copiers and printers: Methods, emission rates, and modeled concentrations. Indoor Air 3:113–23.
- Wong, O. 1990. A cohort mortality study and a case-control study of workers potentially exposed to styene in the reinforced plastics and composites industry. Br. J. Ind. Med. 47:753–62.
- Wong, O., L. S. Trent, and M. D. Whorton. 1994. An updated cohort mortality study of workers exposed to styrene in the reinforced plastics and composites industry. Occup. Environ. Med. 51:386–96.
- Wu, Y.-M., C.-Y. Hu, L. Wang, J. Cheng, Z.-W. Wang, and Y. Zhu 2010. Migration of contaminants from packaging materials into dairy products. Proceedings of the 17th IAPRI World Conference on Packaging(IAPRI).
- Xie, J., X. Wang, G. Sheng, X. Bi, and J. Fu. 2003. Determination of tobacco smoking influence on volatile organic compounds constituent by indoor tobacco smoking simulation experiment. Atmos. Environ. 37:3365–74.
- Yager, J. W., W. M. Paradisin, and S. M. Rappaport. 1993. Sister-chromatid exchanges in lymphocytes are increased in relation to longitudinally measured occupational exposure to low concentrations of styrene. Mutat. Res. 9:155–65.
- Yang, W. P., B. H. Hu, G. D. Chen, E. C. Bielefeld, and D. Henderson. 2009. Protective effect of N-acetyl-L-cysteine (L-NAC) against styrene-induced cochlear injuries. Acta Oto-Laryngol 129:1036–43.
- Yano, B. L., D. A. Dittenber, R. R. Albee, and J. L. Mattsson. 1992. Abnormal auditory brainstem responses and cochlear pathology in rats induced by an exaggerated styrene exposure regimen. Toxicol. Pathol. 20:1–6.
- Yu, C., and D. Crump. 1998. A review of the emission of VOCs from polymeric materials used in buildings. Build. Environ. 33:357–74.
- Yu, C. H., X. Zhu, and Z.-H. Fan. 2014. Spatial/temporal variations and source apportionment of VOCs monitored at community scale in an urban area. PLoS ONE 9:e95734.
- Zaidi, N. F., A. K. Agrawal, S. P. Srivastava, and P. K. Seth. 1985. Effect of gestational and neonatal styrene exposure on dopamine receptors. Neurobehav. Toxicol. Teratol. 7:23–28.
- Zamyslowska-Szmytke, E., A. Fuente, E. Niebudek-Bogusz, and M. Śliwińska-Kowalska. 2009. Temporal processing disorder associated with styrene exposure. Audiol. Neurotol. 14:296–302.
- Zellweger, C., M. Hill, R. Gehrig, and P. Hofer. 1997. Emissions of volatile organic compounds (VOC) from building materials. Swiss Federal Office of Energy, Bern, Switzerland.
- Zhao, W., P. K. Hopke, and T. Karl. 2004. Source identification of volatile organic compounds in Houston, Texas. Environ. Sci. Technol. 38:1338–47.
- Zhu, J., R. Newhook, L. Marro, and C. C. Chan. 2005. Selected volatile organic compounds in residential air in the city of Ottawa, Canada. Environ. Sci. Technol. 39:3964–71.
- Zhu, J., S. L. Wong, and S. Cakmak. 2013. Nationally representative levels of selected volatile organic compounds in Canadian residential indoor air: Population-based survey. Environ. Sci. Technol. 47:13276–83.
- Zhu, Y., C. Liang, J. Chen, L. Zong, G.-D. Chen, and H.-B. Zhao. 2013. Active cochlear amplification is dependent on supporting cell gap junctions. Nat. Commun. 4:1786.
- Zogorski, J. S., J. M. Carter, T. Ivahnenko, W. W. Lapham, M. J. Moran, B. L. Rowe, P. J. Squillace, and P. L. Toccalino 2006. Volatile organic compounds in the nation’s ground water and drinking-water supply wells. United States Geological Survey (USGS). Circular 1292.