
 ?Mathematical formulae have been encoded as MathML and are displayed in this HTML version using MathJax in order to improve their display. Uncheck the box to turn MathJax off. This feature requires Javascript. Click on a formula to zoom.
ABSTRACT
This review is intended to provide risk assessors and risk managers with a better understanding of issues associated with total exposures of human populations to ethylene oxide from endogenous and exogenous pathways. Biomonitoring of human populations and lab animals exposed to ethylene oxide has relied upon the detection of hemoglobin adducts such as 2-hydroxyethylvaline (HEV), which provides a useful measure of total exposure to ethylene oxide from all pathways. Recent biomonitoring data from CDC provide an excellent characterization of total exposure to ethylene oxide to the general U.S. population by demographic factors such as age, gender, and race as well as smoking habit, which might be comparable to previous measurements reported for humans and lab animals. The biochemical pathways including gastrointestinal (production by bacteria) and systemic (enzymatic production) pathways by which endogenous ethylene is generated and converted to ethylene oxide are described. The relative importance of endogenous pathways and exogenous pathways via ambient air or tobacco smoke was quantified based upon available data to characterize their relative importance to total exposure. Considerable variation was noted for HEV measurements in human populations, and important sources of variation for all pathways are discussed. Issues related to risk assessment and risk management of human populations exposed to ethylene oxide are provided within the context of characterizing total exposure, and data needs for supporting future risk assessment identified.
Introduction
Ethylene oxide is a reactive epoxide that is used in the manufacture of chemicals including ethylene glycol, glycol ethers, ethanolamines, ethoxylates and acrylonitrile and in the sterilization of materials such as foods, spices, and medical equipment. For decades, ethylene oxide was recognized as an animal carcinogen based upon observations of increased tumor rates in highly exposed mice and rats (Lynch et al. Citation1984; NTP, Citation1987; Snellings, Weil, and Maronpot Citation1984). The results of epidemiology studies, however, have been inconclusive. Increases in certain types of cancers were reported in a large study of sterilant workers (Citation2004; Steenland et al. Citation2003); but these elevations were not seen consistently in other studies, including in a more heavily exposed cohort of chemical workers, followed over an extended time period (Marsh et al. Citation2019; Swaen et al. Citation2009). USEPA (Citation2016) reassessed the cancer potency of ethylene oxide on its IRIS database resulting in the derivation of a unit risk value (a quantitative estimate of cancer potency) that is approximately 50-fold higher (i.e. more potent) than its preceding value. This large change in cancer potency estimated for ethylene oxide has initiated changes in its regulation such as the amount that can be released from facilities that produce or use ethylene oxide and the level of exposure considered acceptable. This has also resulted in enhanced public attention and concern over the potential adverse health effects associated with exposures at or near facilities that use ethylene oxide (Hogue Citation2019; Olaguer et al. Citation2019).
There are multiple ways in which individuals might be exposed to ethylene oxide. First, ethylene oxide is produced in the body from endogenous ethylene via multiple pathways such as bacterial production in the gastrointestinal tract or systemic formation in the liver. For this reason, all individuals have some exposure to ethylene oxide regardless of their exogenous exposures to ethylene oxide in air (Swenberg et al. Citation2011; Thier and Bolt, Citation2000). Second, ethylene oxide is metabolically generated in the body following exposures to exogenous ethylene from a variety of sources including incomplete combustion of cigarette smoke and vehicle fossil fuels, and natural processes including forest fires, ripening of fruits and vegetables and volcanoes (Artati Citation2010; Fennell et al. Citation2004; Filser and Klein Citation2018; Morgott Citation2015; Health Canada Citation2016). Third, ethylene oxide and ethylene are components of tobacco smoke, and therefore smokers and nonsmokers have different exposure profiles to ethylene oxide (Törnqvist et al. Citation1986a; Tates et al. Citation1991; Tavares et al. Citation1994; Farmer, Cordero, and Autrup Citation1996a; Citation1996b; Müller et al. Citation1998; Bono et al. Citation1999, Citation2002; Fennell et al. Citation2000; Wu et al. Citation2004; Baren et al. Citation2004; CDC, Citation2019). Fourth, some workers are exposed to elevated concentrations of ethylene oxide in workplace air (Angerer, Bader, and Krämer Citation1998; Boogaard, Rocchi, and van Sittert Citation1999; Tates et al. Citation1991; van Sittert et al. Citation1993; Yong et al. Citation2001). Fifth, some populations near industrial or sterilization facilities are also exposed to elevated levels of ethylene oxide in air as a result of emissions (Olaguer et al. Citation2019). Finally, additional pathways such as dietary exposures to ethylene (a plant hormone) present in fruits, vegetables, and grains are also possible (Larsen Citation2015; Yin et al. Citation2017; Iqbal et al. Citation2013; Morgott Citation2015; Health Canada Citation2016). All of these pathways contribute to total exposure to ethylene oxide, but their relative importance to human populations and to individuals is both variable and uncertain.
The measurement of hemoglobin adducts, specifically 2-hydroxyethylvaline (HEV), serves as a useful biomarker for characterizing total exposure to ethylene oxide from all exposure pathway(s) including exogenous ethylene oxide, exogenous ethylene, endogenous ethylene oxide (Bailey, Farmer, and Shuker Citation1987; Boogaard, Rocchi, and van Sittert Citation1999; Kirman and Hays Citation2017; Swenberg et al. Citation2011; Yong et al. Citation2001). Because hemoglobin adducts are stable and cumulative, HEV measurements reflect exposures to ethylene oxide from all pathways over several months preceding sample collection/measurement. Since the potential risks of ethylene oxide are expected to be proportionate to total exposure (i.e. aggregated across all pathways), characterization of total exposure is important to risk assessment and risk management decisions.
The goals of this review are the following to:
provide a characterization of total ethylene oxide exposure (exogenous + endogenous) in human populations;
summarize the biochemical pathways that contribute to endogenous exposures;
identify and characterize sources of variation in measured HEV levels in human populations;
identify and address key questions pertaining to the potential risks associated with ethylene oxide exposures;
update the estimates of endogenous action levels derived previously for ethylene oxide (Kirman and Hays Citation2017) and evaluate their utility in interpreting general population exposures to ethylene oxide; and
identify potential data needs for future risk assessment/risk management of ethylene oxide.
Characterization of HEV levels in humans and lab animals
HEV levels in human populations
The Centers for Disease Control (Center for Disease Control (CDC) Citation2019) recently released biomonitoring data for HEV concentrations in the general U.S. population collected over two sampling periods (2013–14, 2015–16) (). These data demonstrated there are differences in HEV levels (and therefore total ethylene oxide exposure), depending upon smoking status (), age, and gender. Among nonsmokers, a decreasing trend with age is observed across age groups (), and non-significant differences were noted across race () and gender (). There are known genetic polymorphisms and differences in ontogenesis for enzyme systems that contribute to ethylene oxide formation (cytochrome P450 2E1) and metabolic clearance (glutathione-S-transferases, epoxide hydrolase) that may help explain some of the differences in HEV levels in demographic subgroups (London, Smart, and Daly Citation2000; Saghir, Khan, and McCoy Citation2012; Worhhoudt et al., Citation1999; Yoshikawa et al. Citation2000).
Figure 1. HEV Levels (pmol/g hemoglobin) in the U.S. Population (n = 4,777) by Demographic Strata for Two Sampling Periods (2013–4, 2015–6; Center for Disease Control (CDC) Citation2019): (a) Smoking Status; (b) Age (nonsmokers only); (c) Race (nonsmokers only); and (d) Gender (nonsmokers only). Columns indicate the geometric mean values as calculated by Center for Disease Control (CDC) (Citation2019), error bars indicate standard deviations
For comparison purposes, Kirman and Hays (Citation2017) conducted a meta-analysis of data from the published literature for HEV in human populations (exposed and unexposed samples). As a result of this analysis, a distribution for HEV burden was characterized assuming a lognormal distribution from a total sample of 661 nonsmokers and 379 smokers (). Similar to the findings of Kirman and Hays (Citation2017), HEV levels reported by CDC (Citation2019) are nearly an order of magnitude higher in smokers compared to nonsmokers ().
Table 1. Summary of HEV levels (Arithmetic mean values) reported in human populations
A comparison of the distribution of HEV levels in unexposed control subjects (Kirman and Hays Citation2017) and in the U.S. nonsmokers from the Center for Disease Control (CDC) (Citation2019) data is provided in and . This comparison shows the HEV distribution described by Kirman and Hays (Citation2017) based upon pooled control data tended to underestimate the distribution in the U.S. as characterized by Center for Disease Control (CDC) (Citation2019). The arithmetic mean HEV level reported by Kirman and Hays (Citation2017) was approximately 70% of that calculated for the combined Center for Disease Control (CDC) (Citation2019) periods. However, the coefficients of variation (CV) for Kirman and Hays (Citation2017) and Center for Disease Control (CDC) (Citation2019) are both large and similar (70% and 80% respectively) indicating moderately high variability in HEV levels in nonsmokers. The difference in the two distributions may be explained in part by variations in demographics, which is expected to exhibit a greater degree of variation with respect to age, race, and gender in the more diverse CDC dataset. Geographical difference may also play a role in the observed differences, as the majority of studies used by Kirman and Hays (Citation2017) measured adducts in subjects outside the U.S. (primarily Europe), whereas the Center for Disease Control (CDC) (Citation2019) data are exclusively from within the U.S. In addition, some difference may be attributable to differences in analytical methods, which primarily relied upon GC-MS (using EI or NCI ionization mode) in the studies analyzed by Kirman and Hays (Citation2017), whereas Center for Disease Control (CDC) (Citation2019) relied upon HPLC-MS/MS (using APCI, positive ion mode). The CDC measurements rely on one analytical method performed by a single lab, whereas the Kirman and Hays (Citation2017) distribution reflects data from publications from different investigators using differing analytical methods. In contrast, the distributions defined for smokers are fairly similar between the pooled data of Kirman and Hays (Citation2017) and the U.S. population as characterized by Center for Disease Control (CDC) (Citation2019) ( and ), with the former dataset exhibiting greater kurtosis than the latter. Both datasets demonstrate differences in HEV levels between smokers and nonsmokers by approximately an order of magnitude.
Figure 2. Distribution of HEV Levels in Human Populations: (a) Nonsmokers; (b) Smokers
From this point forward, the Center for Disease Control (CDC) (Citation2019) dataset for HEV from both sampling periods combined () are considered to be the best representative dataset for characterizing HEV levels in the U.S. general population, and are used to support additional comparisons and analyses below. These HEV levels in human blood may be converted to endogenous equivalent (EE) levels of ethylene oxide based upon the following equation between HEV adduct levels and measured occupational exposures to ethylene oxide adjusted to general population exposures (Kirman and Hays Citation2017).
Using this linear relationship, the arithmetic mean HEV level calculated for the U.S. general population from the Center for Disease Control (CDC) (Citation2019) data (31.4 pmol/g Hb) corresponds to an equivalent air concentration of 2.9 ppb (). Other datasets are also available for characterizing the relationship between occupational exposures to ethylene oxide in air and HEV level (Boogaard, Rocchi, and van Sittert Citation1999; Brugnone et al. Citation1986; Duus et al. Citation1989; Hagmar et al. Citation1991; Norpoth and Bolt Citation1995; Törnqvist et al. Citation1986a), and are generally consistent with the correlation defined in EquationEquation (1)(1)
(1) , within a factor of approximately 2. As discussed in greater detail below, although the HEV levels in blood are expressed as equivalent levels of exogenous ethylene oxide, these HEV levels in nonsmokers are predominately attributed to endogenous levels (see pathway contribution discussion).
HEV levels in lab animals
The levels of HEV in unexposed lab animals have been fairly well characterized in the published literature (). In control rats, mean levels of HEV were reported to range from 25 to 50 pmol/g Hb, excluding the unexpectedly high value reported by Rusyn et al. (2005), with some evidence to support the observation of strain differences (Sprague-Dawley<Lewis~F344). In control mice, mean levels of HEV were noted to range from 8.3 to 100 pmol/g Hb, with evidence of differences across strain (CBA<B6C3F1).
Table 2. Summary of HEV levels reported in laboratory animal control groups
For the purposes of comparing HEV levels across species, focus is placed here on the data collected in F344 rats and B6C3F1 mice by Walker et al. (Citation1993); Walker et al. (Citation2000), since these strains are typically used in studies to support human health risk assessment (i.e. bases for unit risk derivation), and these investigators characterized variation across individual animals, rather than relied upon pooled samples. Based on these data, pooled means and standard deviations for F344 rats and B6C3F1 mice were calculated to be 46.7 ± 13.7 (approximate CV 29%) pmol/g Hb and 82.5 ± 16.1 (approximate CV 20%) pmol/g Hb, respectively. Assuming HEV concentrations in control rats and mice are lognormally distributed, a graphical comparison of these distributions across species is provided in .
Figure 3. Comparison of Background HEV Distributions in Humans (Center for Disease Control (CDC) Citation2019), F344 Rats, and B6C3F1 Mice (Walker et al. Citation1993, Citation2000)
Because of species differences in erythrocyte lifetimes (humans approximate 120 days vs. rodents approximate 60 days), the difference in estimated circulating blood levels of ethylene oxide across species is even greater than depicted in for HEV levels (i.e. distribution for ethylene oxide in blood of humans would be shifted further to the left when compared to distribution for ethylene oxide in blood of rodents). The pattern observed across species for background HEV levels is consistent with known biological and biochemical processes (see discussion of pathways below). For example, the volume of gastrointestinal tract expressed as a fraction of body weight, which is expected to be proportionate to microbial contributions to HEV levels, is consistent with the observed pattern across species where gastrointestinal lumen volume in rodents > gastrointestinal lumen volume in humans when expressed as a fraction of body volume (Kirman et al. Citation2013, Citation2012). There is greater variety in the major taxa of bacteria present in the human gastrointestinal tract when compared to rats and mice (Hillman et al. Citation2017). With respect to systemic factors, the rate of oxidative metabolism of ethylene to ethylene oxide is consistent with this observed pattern (Vmax/Km in rodents > Vmax/Km in humans) (Filser and Klein Citation2018). Species differences in metabolic clearance of ethylene oxide are also apparent for both the epoxide hydrolase pathway (Vmax/Km in humans > Vmax/Km in rodents) and for glutathione conjugation pathway (Vmax/Km in rodents > Vmax/Km in humans) (Filser and Klein Citation2018).
The moderately higher variability for HEV levels in humans (approximate CV 79%) reflects data collected from a genetically heterogenous population sample with different diets, health conditions, and potential exposures to ethylene oxide in air. In contrast, less variation for HEV levels in rodents (approximate CV 19–29%) reflects data from a genetically homogenous population sample consuming the same diet, where exogenous sources of ethylene and ethylene oxide are expected to be negligible under controlled lab conditions.
Pathways contributing to measured HEV levels
The HEV levels detected in blood discussed above serve as measures of total exposure, which reflect combined contributions of endogenous and exogenous exposures pathways for ethylene oxide and ethylene. These pathways are depicted in and discussed below.
Figure 4. Endogenous and Exogenous Pathways of Ethylene/Ethylene Oxide Exposure. *Exogenous chemical exposures, including exposures to ethylene oxide (pathway 1), are also capable of increasing endogenous production of ethylene and ethylene oxide indirectly via oxidative stress (pathway 2; see discussion of Marsden et al. Citation2009)
Endogenous pathways for ethylene oxide production
Endogenous production of ethylene and ethylene oxide in lab animals and humans includes pathways originating from gastrointestinal lumen (bacterial pathways) and systemic pathways.
Gastrointestinal lumen pathways (Bacterial)
Under normal conditions, bacteria are able to produce ethylene from amino acids (methionine, glutamic acid) and their metabolites (2-keto-4-methylthiobutyric acid or KMTB, 2-oxoglutarate or OG, 1-aminocyclopropane-1-carboxylic acid or ACC) (Fukuda, Ogawa, and Tanase Citation1993). The ability to produce ethylene from methionine or KMTB was assessed in 14 species of bacteria (Mansouri and Bunch Citation1989). Most bacterial species were able to generate ethylene from KMTB, while only two (E. coli SPAO, C. violaceum) were able to synthesize ethylene from methionine. Production was also dependent on the carbon/nitrogen source used in the growth medium (glutamate, glucose+ammonia). A survey of 757 bacterial species from soil found that 229 species (approximately 30%) were capable of producing ethylene (Nagahama et al. Citation1992). Most of the producing strains (225/229) were categorized as synthesizing ethylene from methionine (via KMTB). A smaller fraction of the producing species did so from other source material. These include one species generating ethylene from oxoglutarate, three species producing ethylene from meat extract, and two species whose source was not characterized. Induction of oxidative stress in bacteria (via menadione and paraquat addition) increased ethylene synthesis by cells, but not by cell-free extracts of E. coli (Mansouri and Bunch Citation1989). One additional species (P. aeruginosa) was able to produce ethylene from KMTB only when co-incubated with menadione or paraquat.
Some ethylene-producing bacteria are typically found in the human gastrointestinal tract (), although data were not located in the published literature for a majority of the species present. Ethylene produced in the gastrointestinal lumen via bacterial pathways might be absorbed from the intestinal tract into the body. Once absorbed, systemic ethylene may be metabolized to ethylene oxide in tissues via enzymatic oxidation where it might bind to hemoglobin to form HEV ().
Table 3. Bacterial species in the human gastrointestinal tract
The gastrointestinal pathway has been well characterized in lab animals. In a series of experiments Tornqvist et al. (1989) studied the levels of HEV in both control and germ-free CBA mice. Germ-free animals were found to exhibit HEV levels that were on average approximately 35% lower than detected in corresponding controls (), suggesting that bacteria in the gastrointestinal lumen might serve as a major contributing pathway to endogenous HEV levels.
Table 4. HEV levels in control and germ-free CBA mice (Törnqvist et al., Citation1986a)*
Systemic pathways
Fu, Zic, and Ozimy (Citation1979) characterized the enzymatic production of ethylene from methionine and KMTB by Wistar rat liver extracts. Ethylene production by the extracts was reported to be oxygen dependent, and inhibited by sulfhydryl agents. In addition, ethylene production was age-dependent, peaking at an age of approximately 50 days. Lawrence and Cohen (Citation1985) characterized the synthesis of ethylene from KMTB in Swiss-Webster mice. Injection of 1000 mg/kg KMTB resulted in an 8.6-fold rise in ethylene production above normal endogenous levels reported in controls. Induction of lipid peroxidation (via carbon tetrachloride dosing) prior to KMTB produced a 13.9-fold elevation over endogenous levels or approximately 1.6-fold increase over that observed for KMTB alone. Pretreatment of mice in this study with vitamin E (an inhibitor of lipid peroxidation) or metyrapone (inhibitor of mixed function oxidase activity) did not alter ethylene production by KMTB alone or in combination with carbon tetrachloride. For this reason, Lawrence and Cohen (Citation1985) concluded that ethylene production from KMTB did not appear to derive from free radicals generated during lipid peroxidation. In vitro studies showed that oxidation of erythrocyte membranes resulted in the generation of ethylene (Clemens and Remmer Citation1982; Einsele, Clemens, and Remmer Citation1987).
Ethylene produced by these systemic pathways might be metabolized to ethylene oxide in tissues via enzymatic oxidation, and then bound to hemoglobin to form HEV (). Törnqvist et al. (Citation1989a) examined the formation of HEV in CBA mice fed diets differing in lipid source (sunflower oil, lard, or coconut oil), which varied in their fatty acid composition and carbon chain length. In mice fed diets with sunflower oil (high in unsaturated fatty acids) HEV levels were significantly higher (approximately 2- to 3-fold) than in animals fed diets with either lard or coconut oil (low in unsaturated fatty acids) (). These data indicated that dietary fatty acids, presumably via their systemic metabolism, are an important contributor to endogenous HEV levels.
Table 5. HEV levels in CBA mice fed diets with a differing fatty acid composition (Tornqvist et al., 1989)*
Studies in which HEV levels have been characterized in animals after induction of lipid peroxidation may be used to assess the relative importance of cellular macromolecule oxidation to background HEV burden. HEV levels in animals administered agents to induce lipid peroxidation (phenobarbital, carbon tetrachloride, buthionine sulphoximine; alone or in combination) were found to be modestly higher (4–14%) than HEV burdens in corresponding controls (Kautiainen et al. Citation1991). Increased systemic inflammation and associated lipid peroxidation were identified as endogenous sources of ethylene production in humans (Paardekooper et al. Citation2017). These data suggest that induction of oxidative stress via chemical exposures and/or disease states might increase HEV levels. This represents an important aspect of the mode of action for ethylene oxide, since data in rats indicate that exogenous ethylene oxide exposure (Pathway 1 in ) enhances production via the endogenous pathways (Pathway 2 in ). This rise in endogenous production might occur via an oxidative stress mechanism, and perhaps surprisingly, the latter pathway might predominate over the former pathway in its relative contribution to total exposure in exposed rats (see discussion of Marsden et al. Citation2009).
Exogenous pathways
The levels of HEV detected in human populations may be influenced by exogenous sources of exposure, including (1) ethylene oxide in ambient air; (2) ethylene in ambient air; and (3) other potential pathways. Each of these pathways is discussed below.
Ethylene Oxide in Ambient Air
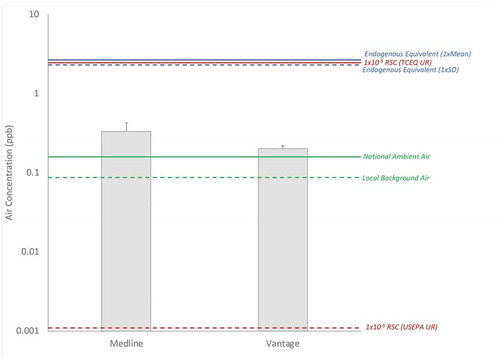
U.S. Environmental Protection Agency (USEPA) (Citation2019a) summarized recent monitoring efforts ethylene oxide in ambient air at rural, suburban, and urban locations across the U.S. (). With arithmetic mean values consistently at or near 0.16 ppb, there appears to be no meaningful difference among ambient air concentrations of ethylene oxide measured in rural, suburban, or urban settings. Higher concentrations of ethylene oxide in air may be detected near emission sources. For example, recent data collected for ethylene oxide concentrations air at multiple locations over a 6-month period near two facilities that use or make ethylene oxide reported weighted mean concentrations of 0.33 ± 0.76 ppb (CV = 230%) (Medline Industries Inc. sterilization facility in Waukegan, IL) and 0.20 ± 0.55 ppb (CV = 270%) (Vantage Specialty Chemicals Inc. facility in Gurnee) (Lake County, Citation2020; raw data provided in Attachment 1). Mean concentrations for both sites are 1.3–2.1-fold higher than national ambient air concentrations (0.16 ppb, ). Ninety-five percent upper confidence limits of the mean were calculated to be 0.43 ppb and 0.22 ppb, respectively, assuming a lognormal distribution (ProUCL 5.1).
Table 6. Summary of ambient air monitoring for ethylene oxide (U.S. Environmental Protection Agency (USEPA) Citation2019a)
Non-point sources of ethylene oxide releases to air have not been well characterized, but may include both anthropogenic and natural sources. Ethylene oxide was identified as a combustion product of hydrocarbons, particularly from n-pentane as a fuel source (Barnard and Lee Citation1972). For this reason, ethylene oxide may be released in automotive exhaust, as well as in exhaust from stationary sources of hydrocarbon combustion. High concentrations of ethylene oxide (25−75 ppm) were determined in an approximate 60–80 ml headspace gas phase of a 100 ml flask following the frying of approximately 20 g of foods in 10–20 of soybean oil (Lin et al. Citation2007). Although specific emission factors are not available for ethylene oxide release from wildfires as they are for ethylene (Urbanski, Hao, and Baker Citation2009), the presence of both ethylene in tobacco smoke (Baren et al. Citation2004) and ethylene oxide in tobacco smoke (based on increased HEV levels; ) suggests wildfires may serve as a source of ethylene oxide emissions.
Ethylene in ambient air
As discussed above, ethylene is produced by bacteria present in soil (Nagahama et al. Citation1992), and as a plant hormone that signals leaf senescence and fruit ripening, ethylene is also generated by plants (Schaller Citation2012). Sawada and Totsuka (Citation1986) estimated that 74% of global ethylene was released from natural sources (terrestrial and aquatic ecosystems), and 26% was released from the anthropogenic sources (biomass burning, combustion of fossil fuels). Wildfires were identified as a significant source of ethylene emissions (Morgott Citation2015; Urbanski, Hao, and Baker Citation2009). Health Canada (Citation2016) recently characterized ambient levels of ethylene in rural air and urban air as displaying mean concentrations of 0.46 ug/m3 (0.40 ppb) and 1.7 ug/m3 (1.5 ppb), respectively. Morgott (Citation2015) reported that continuous personal monitoring at the community level, which is expected to reflect exposures to both indoor and outdoor air, to typically range from 3 to 4 ppb.
Other potential pathways
Two important sources of elevated exogenous exposure to ethylene oxide in air (i.e. above ambient levels) include (1) occupational exposures and (2) tobacco smoke. Occupational exposures to ethylene oxide are associated with specific industries including hospital workers (Haufroid et al. Citation2007), sterilization workers (Bogen et al. Citation2019), chemical manufacturing workers (Swaen et al. Citation2009; Teta, Benson, and Vitale Citation1993), and fruit store workers exposed to plant-produced ethylene (Tornqvist et al., 1989). An exposure reconstruction of sterilization operators exposed to ethylene oxide was recently conducted (Bogen et al. Citation2019). Estimated historical exposures to ethylene oxide by sterilization operators are many orders of magnitude higher than those encountered today. These reconstructed exposures suggest a strong decreasing trend in ethylene oxide concentrations in air over time. Similarly, Teta, Benson, and Vitale (Citation1993) and Swaen et al. (Citation2009) estimated exposures to be approximately 70,000 ppb for the highest exposed workers in 1925–1939, but 1 ppb for the highest exposed workers in 1974–1988 at a chemical manufacturing plant for ethylene oxide. A diminishing trend in occupational exposures to ethylene oxide is also suggested more generally, based upon historical changes in occupational exposure limits for ethylene oxide, which have fallen from 100,000 ppb (ACGIH TLV-TWA in the 1940s-50s) to 1,000 ppb (current OSHA PEL) over the past 70 years.
As noted above, tobacco smoke contains both ethylene and ethylene oxide. Consistent with the Center for Disease Control (CDC) (Citation2019) data for HEV levels in the U.S. population, tobacco smoke is identified as the single largest source of ethylene oxide exposure to the general population. In the U.S., based on trends in smoking intensity and prevalence, along with estimates of HEV level increases per cigarette (Bader, Lewalter, and Angerer Citation1995; Wu et al. Citation2004), tobacco-related exposures to ethylene oxide have been decreasing over time, as estimated in . The levels of HEV estimated for smokers in this table are generally consistent with the levels reported in NHANES for collections around 2015 (i.e. estimated arithmetic mean HEV of 48–52 pmol/g Hb falls between the arithmetic of 72.9 pmol/g Hb and the geometric mean of 38.3 pmol/g Hb based upon measured HEV data for 2014–5; CDC Citation2019).
Table 7. Estimates of historical HEV means for U.S. population based on smoking pattern trends
With respect to dietary exposures to ethylene oxide, although plant vegetation is an important source of ethylene, particularly during fruit ripening, Health Canada (Citation2016) concluded that dietary doses of ethylene from consumption of plant materials are negligible.
Sources of variation in HEV measurements
Based on the CDC data (Center for Disease Control (CDC) Citation2019), the coefficient of variation (CV calculated as the standard deviation divided by the arithmetic mean) for nonsmokers was estimated to be 79%, which is similar to the CV reported from the meta-analysis of nonsmoker control subjects across multiple human studies (69%) (Kirman and Hays Citation2017) (). There are multiple sources of variation that may contribute to differences in HEV measurements in human populations. These include both general sources and pathway-specific sources of variation, as described below.
General sources of variation include intra-individual and inter-lab variation. Although HEV is a stable cumulative biomarker of exposure to ethylene oxide, which reflects exposures over several months (based upon erythrocyte half-life), it does exhibit variation over time. In a single individual with no known exposure to ethylene oxide who was repeatedly sampled over a 15-month period, the HEV burden was observed to vary with a mean and standard deviation of 22.4 and 3.6 pmol/g Hb, respectively (Tornqvist and Kautiainen, Citation1993), suggesting that temporal (intra-individual) variation is relatively small (CV = 16%). In a study that examined the results of four different labs in analyzing eight human hemoglobin samples (Törnqvist et al. Citation1992), data demonstrated a strong correlation, but with systematic differences across labs contributing moderate variation (CV = 28%). Erythrocyte lifespans may also vary across individuals (e.g. mean = 126 days, SD = 26 days (CV = 21%); Zhang et al. Citation2018), and contribute to variation in measured HEV levels in humans.
Several pathway-specific sources of variation were identified for HEV formation. Gut microflora is highly variable in humans and affected by diet (e.g. probiotics, food consumption), geographic location, medication (e.g. antibiotic use), disease states, and other factors (e.g. age, gender, race). As summarized in , although some ethylene-producing bacteria are frequently found in humans (e.g. E. coli), others are detected less frequently (e.g. S. aureus, Klebsiella, Enterobacter, P. aeruginosa). In addition, because bacterial production of ethylene is dependent on the availability of precursor and intermediate molecules (e.g. methionine, KMTB), dietary variation in precursors might contribute to HEV variation, for example, meats, eggs, and fish are excellent sources of methionine, and KMTB is found in a number of food items such as leeks, hickory nuts, brussel sprouts, and giant butterbur (Petasites japonicus) (FOODB Citation2020).
Several sources of variation were identified for endogenous, systemic pathways of HEV formation. Ethylene oxide is detoxified in part by conjugation with glutathione. Investigators noted that genetic polymorphisms for the GST-T1 enzyme might affect HEV burden (Fennell et al. Citation2000; Müller et al. Citation1998; Thier et al. Citation1999; Yong et al. Citation2001). In a sample of 21 people (5 GST-T1-, 16 GST-T1+), mean and SD values for HEV burden were calculated to be 116 ± 53 pmol/g Hb, 45 ± 11 pmol/g Hb, and 62 ± 40 pmol/g Hb, for the GST-T1- subgroup, GST-T1+ subgroup, and for the total sample combined, respectively. These data indicate that GST-T1 polymorphism may contribute markedly to variation in HEV burden in human populations. Because humans rely primarily on epoxide hydrolase for ethylene oxide clearance, Filser and Klein (Citation2018) concluded that it seems doubtful the elevated HEV levels resulted from differences in ethylene oxide glutathione-mediated metabolism alone. Alternatively, because GST-T1 polymorphism is also associated with changes in lipid biomarkers (Block et al. Citation2011; Maciel et al. Citation2009), it remains possible that lipid metabolism or other endogenous pathway factors indirectly affecting HEV formation are impacted by GST-T1 polymorphism.
In addition to genetic factors, based upon studies in mice, dietary lipid composition (i.e. consumption of unsaturated vs. saturated fatty acids) might exert a strong effect on HEV burden (; Tornqvist et al., 1989). Fatty acid intake in the U.S. population is highly variable (CV>100%), with average values reported as follows: total saturated fat = 27 ± 28 g/day; total mono-unsaturated fat = 30 ± 37 g/day; and total polyunsaturated fat = 16 ± 19 g/day (for all ages, both genders based on NHANES, 1999–2000; CDC, Citation2004). For these reasons, variation in dietary lipid consumption is expected to contribute significantly to differences in HEV measurements in human populations.
With respect to sources of variation for exogenous pathways, ambient air concentrations of ethylene oxide and ethylene in air are expected to exhibit some temporal and spatial variation in the U.S (), with higher concentrations and differences associated with locations near emission sources. Spatial variation across sample locations not associated with specific ethylene oxide point sources exhibits a CV of approximately 20% (). Higher variation (CV>200%) might occur near emission sources (example IL site data in Attachment 1). However, ambient air concentrations of ethylene oxide are not expected to be a major contributor to variability in measured HEV levels for most individuals since mean ambient levels of ethylene in air represent only a small % of total exposure (see Section 4.1).
Overall, given the number of sources of variation and their relative magnitudes, the variation in HEV values reported for nonsmokers based upon the Center for Disease Control (CDC) (Citation2019) data (CV = 79%; ), and noted for pooled, control subjects in Kirman and Hays (Citation2017; CV = 69%) is generally consistent with expectations. Variation of HEV levels in smokers is numerically higher (93–94%; ) than for nonsmokers, which is consistent with consideration of contributions from variation in smoking habits (e.g. intensity, frequency) and content of tobacco products.
Risk assessment and risk management of ethylene oxide
Risk assessment for carcinogenic chemicals such as ethylene oxide relies on quantitative estimates of cancer potency such as unit risk values, which reflect the slope of the dose–response relationship at low exposure levels where a high unit risk value indicates a steep slope indicative of a potent carcinogen. Recently, at least two regulatory agencies conducted quantitative dose–response assessments on the same cohort of exposed workers (NIOSH; Steenland, Stayner, and Deddens Citation2004) to derive the cancer unit risk values for ethylene oxide, with values that differ by several orders of magnitude ranging from 0.0000041 per ppb (TCEQ, 2020) to 0.0091 per ppb (USEPA Citation2016, 2019b). Briefly, USEPA’s unit risk value for ethylene oxide is based upon elevated incidence/mortality for two cancer types in exposed workers: (1) mortality data for lymphoid cancer (a special category combining non-Hodgkin lymphoma, myeloma, and lymphocytic leukemia); and (2) incidence data for breast cancer (USEPA, Citation2016). U.S. Environmental Protection Agency (USEPA) (Citation2016) selected a 2-slope model with an initial steep slope at low exposures followed by a shallow slope at higher exposures. U.S. Environmental Protection Agency (USEPA) (Citation2019b) also considered a range of possible regulatory values based upon different dose–response models. TCEQ (Citation2020) also considered the 2-slope model but ultimately selected the more commonly used log-linear Cox-proportional hazards model for lymphoid cancer mortality, which results in a shallower linear slope at the lower exposures of interest than the 2-slope model.
Selecting an appropriate model to extrapolate from the occupationally exposed workers to the general population is especially challenging because the upper percentiles of the NIOSH cohort were exposed to high concentrations of ethylene oxide. Exposures measured between 1979 and 1985 in the NIOSH cohort ranged from 2,200 to 4,600 ppb (Hornung et al. Citation1994), which is 4 orders of magnitude higher than ambient concentrations recently measured by USEPA (). Although a regression model was developed to estimate exposures between 1938 and 1978, historical exposure reconstruction predictions are inevitably uncertain. The NIOSH regression model for exposure, validated only with data collected after 1978 (i.e. pre-1978 measurements are not available), predicted that exposures were lowest in 1938 and rose to peak levels in 1978. A recent analysis by Bogen et al. (Citation2019) yielded an exposure model that better accounts for engineering/industrial hygiene factors (E/IH). The E/IH-based model of Bogen et al. (Citation2019) was developed using historical data on ethylene oxide kill concentrations, residue levels in sterilized materials, post-wash concentrations in a sterilization chamber, and information on sterilizer operator practices prior to 1978. The E/IH exposure more predicts a trend in ethylene oxide exposures for the most highly exposed workers (e.g. sterilizer operators) that are substantially higher pre-1978 compared to post-1978. This prediction is more realistic and consistent with the observation made by NIOSH study authors that exposures to ethylene oxide “were likely to have been higher … .before installation of engineering controls, when the OSHA standard was 50 ppm” (Steenland et al. Citation1991). Consequently, the USEPA calculations of the unit risk value based upon NIOSH study have a high level of uncertainty and potential for underestimating pre-1978 exposures, which subsequently results in an overestimation of cancer potency for ethylene oxide.
Determining the magnitude of the unit risk value (i.e. steepness of the slope for the dose–response relationship) and the nature of the dose–response relationship (i.e. linear vs. nonlinear models) for low exposures to ethylene oxide is complex and uncertain. Ultimately, addressing these uncertainties requires a full consideration of the evidence for ethylene oxide within a mode of action framework, which is beyond the scope of this review. This section of the review examines how endogenous levels together with other biological data and evidence may inform the shape of the dose–response curve at lower exposure levels relevant to the general population within the context of total exposure to ethylene oxide. A number of important questions arise when assessing and/or managing the potential extra risks of ethylene oxide exposures, including the following: What are the contributions of endogenous and exogenous ethylene oxide production to total exposure? How does exogenous exposure to ethylene oxide affect total exposure? What are the risks associated with endogenous and low-level exogenous exposures? How can endogenous levels (considering mean and variability) inform selection of regulatory values for extra risk to the general population? What are the benefits of ethylene oxide use? How should risks associated with total exposure be managed? Information to address these important questions is discussed below.
Contribution of endogenous and exogenous pathways to total ethylene oxide exposure
Characterization of the relative importance of exogenous and endogenous pathways in contributing to background HEV burden measured in human populations is key to understanding the health significance of exogenous exposure and risk management of ethylene oxide. The mean levels of ethylene observed in personal community air samples of approximately 3.5 ppb (Morgott Citation2015), while considering a metabolic conversion rate of approximately 1.25% (based upon PBPK simulations for ethylene concentrations <1 ppm using the model of Filser and Klein Citation2018) correspond to equivalent concentrations of ethylene oxide in air of approximately 0.04 ppb. Combined with the mean ambient air concentration of 0.16 ppb in the U.S. (), total ethylene oxide equivalents for ambient air in the U.S. is estimated to be approximately 0.2 ppb (0.16 ppb + 0.04 ppb). Using the correlation defined in EquationEquation (1)(1)
(1) this air concentration corresponds to an HEV level of 2.2 pmol/g Hb.
For nonsmoking individuals, these results suggest that only a small % (2.2 out of 31.4 pmol/g Hb, or approximately 7%) is associated with exogenous pathways for ethylene and ethylene oxide, leaving a majority (29.2 out of 31.4 pmol/g Hb, or approximately 93%) associated with endogenous pathways (). Similarly for smoking individuals in the U.S., ambient air contributes a small % of total exposures (approximately 0.9% of mean HEV of 236 pmol/g Hb), while a moderate approximate 12% is associated with endogenous production, and the vast majority of HEV adduct burden approximately 87% is correlated with smoking (). At the population level (i.e. considering US population as mix of smokers and nonsmokers), ambient air contributes a small approximately 2.9% of weighted mean HEV of 75.7 pmol/g Hb exposure (), while a moderate approximate 39% is associated with endogenous production, and the majority of HEV adduct burden approximately 59% is correlated with smoking ().
Figure 5. Estimated Pathway Contribution to HEV Burden in the U.S. Population Via Endogenous and Exogenous (Ambient Air, Smoking) Pathways. Equivalent air concentration for 2nd y-axis are based on the correlation described in EquationEq.1(1)
(1) . Sys = systemic production; GI = gastrointestinal production
With respect to characterizing the relative importance of the gastrointestinal tract and systemic pathway to endogenous pathways, no apparent data were located to address this issue specifically in humans. However, in lab animals, there appears to be sufficient information to provide an initial characterization of their relative importance. Based upon measurements of HEV in germ-free vs. control mice (), approximately 35% of endogenous HEV production is associated with gastrointestinal pathways, leaving the remainder approximately 65% of total endogenous production correlated with systemic pathways. Assuming these relative contributions also reflect ethylene oxide production in humans, estimates of the relative contribution of endogenous and exogenous pathways in U.S. nonsmokers and smokers are illustrated in (dashed line dividing the light gray region in each column).
Effects of exogenous ethylene oxide exposure on total exposure
While the direct effects of ethylene oxide on the exogenous pathway for HEV formation are expected, evidence in rats suggests that these exposures also indirectly affect endogenous production pathways. Marsden et al. (Citation2009) exposed rats to a broad range of C14-radiolabeled ethylene oxide doses (0.0001–0.1 mg/kg, via single i.p. injections/day for 3 days) and measured the formation of DNA adducts [i.e. N7-(2-hydroxyethyl)guanine or N7-HEG] in several tissues by two different methods: (1) 14C-radiolabeled adducts (via liquid scintillation), which reflect those formed by the exogenous pathway (pathway 1 in ); and (2) unlabeled adducts (via LC-MS/MS), which reflect those formed by the endogenous pathway (i.e. systemic formation; pathway 2 in ). To put these i.p. doses in perspective, the dose range used in this study corresponds to equivalent inhalation exposures of approximately 0.27–270 ppb in rats exposed for 6 hr/day [assuming BW = 0.18 kg (USEPA, Citation1988), an inhalation rate of 0.2 m3/24 hr day (U.S. Environmental Protection Agency (USEPA) Citation1988), and an inhalation absorption fraction of 0.75 (Brugnone et al. Citation1986)]. Data for liver adducts in exposed animals (adjusted for background) are presented in .
Figure 6. Liver DNA Adducts Produced by Endogenous and Exogenous Pathways in Rats Exposed to Ethylene Oxide via i.p. Injection. Columns indicate the mean value (n = 3), error bars indicate SE (adapted from Marsden et al. Citation2009)
There are several conclusions that might be supported by these data. First, DNA adducts are increased in a treatment-related manner, becoming significant for adducts produced by the exogenous pathway at doses of 0.005 mg/kg and higher, and for adducts synthesized by the endogenous pathway at doses of 0.05 mg/kg and higher. Second, the treatment-related effects of ethylene oxide on adduct formation are far greater for the endogenous pathway when compared to the exogenous pathway (i.e. pathway 2 in ≫ pathway 1 in ). Because the route of exposure (i.p. injection) used in this study effectively bypasses ethylene oxide production via the gastrointestinal tract, the elevated adduct number generated by the endogenous pathway reflects modulation of endogenous, systemic processes by ethylene oxide, possibly by increasing the source of reactive oxygen species (ROS) via oxidative stress, as proposed by Marsden et al. (Citation2009). Finally, the relative importance of the exogenous pathway rises as a function of dose (<1% at the treatment group corresponding to approximate 0.27 ppb, increasing to 23% at the highest treatment corresponding to approximately 270 ppb), a trend that is presumed to continue up to the tumorigenic exposure range in rats (10,000–100,000 ppb)(Lynch et al. Citation1984; Snellings, Weil, and Maronpot Citation1984). Depending upon the nature of this trend at higher doses, adduct formation via the exogenous pathway may predominate at tumorigenic exposure levels.
Contribution of endogenous and low-level exogenous ethylene oxide exposures to risk
In determining the magnitude of the unit risk value for ethylene oxide (i.e. the steepness of the dose–response slope) used to predict cancer risk in the general population (e.g. at exposures well below those experienced in the NIOSH cohort), it is important to understand how observations at higher occupational concentrations need to be extrapolated to lower exposures. Inferences for low-exposure risk from available animal and human datasets are discussed below.
Inference from animal data sets
Two hypotheses that relate to the precautionary assumption of low-dose linearity adopted for endogenously produced chemicals such as ethylene oxide are as follows: (1) endogenous levels of ethylene oxide contribute to background cancer risk; and (2) low-level exposures to ethylene oxide (e.g. endogenous plus ambient exogenous exposures well below the tumorigenic point of departure) result in increased risk of cancer. HEV values, as a measure of total ethylene oxide exposure, might be used to assess these hypotheses by examining the data on the carcinogenicity of ethylene oxide in rats, along with data on the carcinogenicity of ethylene in rats. Cancer bioassay data collected in rats exposed to 10,000–100,000 ppb ethylene oxide showed significant elevation in several cancer types, including mononuclear cell leukemia, testicular peritoneal mesothelioma, and brain tumors (Lynch et al. Citation1984; Snellings, Weil, and Maronpot Citation1984). In contrast, cancer bioassay data collected in rats for ethylene at 300, 1,000, and 3,000 ppm demonstrated no marked change in tumors of any kind (Hamm, Guest, and Dent Citation1984). Levels of HEV, which reflect total exposure to ethylene oxide (via all pathways) were measured for rats exposed to ethylene oxide or to ethylene under conditions similar to those corresponding to the rat cancer bioassays (Filser et al. Citation2013), as well as in unexposed control animals (Walker et al. Citation1993, Citation2000).
Take together these data may be assembled to characterize the dose–response relationship for ethylene oxide assessed in terms of HEV levels and extra risk (summed across the three cancer types observed in rats) (). Combined, these data appear inconsistent with an assumption of low-dose linearity below a 10% point of departure, but cannot differentiate between alternative nonlinear dose–response relationships (i.e. one with a decreasing slope with diminishing dose vs. one with a threshold). Evidence of low-dose nonlinearity in the cancer dose–response relationship for ethylene oxide is supported by data collected for ethylene. HEV levels measured in rats resulting from ethylene exposure under conditions of the cancer bioassay (Hamm, Guest, and Dent Citation1984) (300–3,000 ppm) are well above background levels in rats (i.e. approximately 50- to 160-fold higher than endogenous levels based on HEV data of Walker et al. Citation2000), and yet these enhanced systemic exposures did not result in an increased incidence of tumors. The lack of an elevated tumor response in ethylene-exposed animals (Hamm, Guest, and Dent Citation1984) is particularly robust given the study design (testing of 120 rats of each gender per treatment group, which is more than twice the number of animals typically used in cancer bioassays studies). If either of the low-dose linear hypotheses described above were valid, then a rise in risk would be observable in rats under conditions of the ethylene cancer bioassay (which increased ethylene oxide exposure by more than two orders of magnitude). Because an elevation in tumor incidence was not detected under these conditions, and thus neither hypothesis is supported.
Figure 7. Total Extra Risk vs. Total Ethylene Oxide Internal Dose (HEV, pmol/g Hb) in Rats Exposed to Ethylene or Ethylene Oxide. X-axis displayed on log-scale to clear depict the broad range of internal doses (4 orders of magnitude), and not to accentuate a nonlinear dose-response relationship
While it is recognized that these data characterize the dose–response relationship of ethylene oxide in rats rather than humans, there is no mechanistic rationale to suggest that the dose–response relationship in is unique to rats. Although some species differences in toxicokinetic factors are noted, PBPK modeling indicating ethylene oxide blood concentrations in rats, mice, and humans are expected to be equivalent up to 200 ppm ethylene oxide exposures (Fennell and Brown Citation2001). Further, as an alkylating agent, the mode of action for ethylene oxide was proposed to involve genetic damage via adduction to DNA, resulting in gene mutation and chromosomal aberration (U.S. Environmental Protection Agency (USEPA) Citation2016), processes that are expected to be generally applicable across species.
Inference on risk at low concentrations of ethylene oxide in humans
As noted above, ethylene oxide exposures in smokers are significantly higher than in nonsmokers (, ), but are also lower than occupational exposures to workers in the upper percentiles of the NIOSH cohort. Thus, as representative of intermediate exposures to ethylene oxide human data from smoking populations may inform the shape of the dose–response curve (i.e. steepness of the slope) and provide some insight on potential risks of lymphohematopoietic and breast cancer from low-level exposures to ethylene oxide.
Neither the Surgeon General’s Report (Citation2014) nor the American Cancer Association (Citation2020) correlated any of the lymphoid cancers (non-Hodgkin’s lymphoma, myeloma, lymphocytic leukemia) with smoking. These findings reflect the weight of evidence collected over 50 years since the 1st Surgeon General’s report on smoking, and stand in contrast to findings for cancer types in which the weight of evidence for a causal relationship with smoking is sufficient (e.g. lung, liver, colorectal cancers). In addition, there is no clear relationship with breast cancer based on the General’s (Citation2014), which concludes “evidence is suggestive but not sufficient to infer a causal relationship between tobacco smoke and breast cancer.” These data suggest that the cancer potency for ethylene oxide for lymphoid and breast cancers at lower exposures is low, and does not support the use of a steep exposure–response model at lower exposures. In a recent example, a cross-sectional study of Jain (Citation2020) relied upon NHANES/CDC data to assess the potential associations between ethylene oxide (i.e. using the same HEV depicted in ) and prevalence of self-reported physician diagnosis of cancers in general (n = 3,593), and of breast cancer for females (n = 1,919). These data reported in Jain (Citation2020) are collected across the range of ethylene oxide exposures for smokers and nonsmokers. Jain (Citation2020) concluded that for the general US population, levels of ethylene oxide were not found to be associated with cancers including breast cancer in females (p-values for regression slopes: 0.34 for males and females combined; 0.52 for females only). The results of this limited study suggest that ethylene oxide exposures as measured by HEV levels in nonsmokers and smokers are not associated with an observable increase in self-reported cancer prevalence, including for cancer types used to estimate the cancer potency of ethylene oxide by USEPA.
Assuming a genotoxic mode of action for ethylene oxide, the magnitude of the unit risk value for ethylene oxide (i.e. steepness of the slope at low exposures) is dependent upon the type of genetic damage produced by exposure, and may be moderated at low exposures by overlapping biological defenses. A thorough review of the mechanistic data within a mode of action framework is beyond the scope of this review, but there are some mechanistic data available that lend support to a nonlinear dose–response relationship for ethylene oxide, and include the following observations: (1) evidence showing that ethylene oxide-induced DNA damage is readily repairable in humans (Tates et al. Citation1995); (2) consideration that for cancer endpoints dependent on the reciprocal translocations by chemical alkylators (e.g. leukemia), cancer response is expected to be proportionate to the square of the dose (Preston et al. Citation1995); and (3) evidence in human cells exposed to ethylene oxide that a certain level of promutagenic adducts must be attained before mutations become detectable above background (Tompkins et al. Citation2009). Empirically, there are two pieces of evidence that are important to understanding low-dose risk: (1) absence of clear association for cancers of interest in smokers exposed to up to an order of magnitude higher ethylene oxide exposures than endogenous levels; and (2) positive results for some cancers in only the highest exposed workers (Steenland, Stayner, and Deddens Citation2004) whose exposures are up to many orders of magnitude higher than endogenous levels. Taken together combined evidence provides a dose–response pattern for humans that appears consistent with that observed in ethylene- and ethylene oxide-exposed rats in .
Managing ethylene oxide risks
Information regarding endogenous equivalent values (Kirman and Hays Citation2017; as updated with the NHANES HEV data), risk-specific concentrations (using unit risk values from USEPA and TCEQ), potential health benefits, and their application to an example site-specific data for ethylene oxide are discussed below.
Endogenous equivalent levels
Kirman and Hays (Citation2017) proposed endogenous equivalent concentrations in air (action levels) for ethylene oxide based on a consideration of its endogenous production. Endogenous action levels reflect air concentrations of ethylene oxide that are equivalent to the levels that are produced endogenously. The endogenous action levels are recalculated here for ethylene oxide in , with two important changes: (1) mean HEV values from CDC for nonsmokers in the U.S. (31.4 pmol/g Hb; ) were used as the basis, instead of relying upon pooled data for unexposed control subjects used in Kirman and Hays (Citation2017); and (2) background levels of HEV were adjusted for contributions from exogenous exposure pathways (2.2 pmol/g Hb), instead of assuming that contributions from exogenous exposures were negligible. By analogy to characterizations of background metals in soil (USEPA, Citation2002), there are several options for identifying what concentration constitutes a “substantial difference” from background to warrant additional attention/action. These options include (1) multiples of the mean background (exogenous) level; (2) multiples of the standard deviation for background levels; and (3) percentiles for the distribution of background levels (). These endogenous equivalent values are intended to help risk managers in search of a more pragmatic, science-based approach to managing the potential risks from ethylene oxide exposure. For example, the mean and SD endogenous equivalent levels are used as a basis of comparing to site-specific data below (see ).
Table 8. Endogenous equivalent values for ethylene oxide calculated using HEV levels in nonsmokers (based on data from Center for Disease Control (CDC) Citation2019)
Figure 8. Example Comparison of Site Concentrations (gray columns = mean; error bars = 95% UCL, assuming a lognormal distribution, ProUCL 5.1) to Background Concentrations (green lines; solid = national, dashed = local), 1 × 10⁻⁵ Risk-Specific Concentrations (red lines; solid = TCEQ unit risk basis, dashed = USEPA unit risk basis), and Endogenous Equivalent Levels (blue lines; solid = 1xCDC Mean, dashed = 1xCDC SD). RSC = Risk-Specific Concentration, UR = Unit Risk
Risk-specific concentrations
As described previously, state and federal agencies within the U.S. have conducted assessments to estimate the cancer potency of ethylene oxide (). Although both assessments are derived from the same epidemiology study, their values differ by several orders of magnitude owing to different approaches and decisions made at multiple steps in the derivation process, with the primary difference being the selection of different dose–response models. Using USEPA’s and TCEQ’s inhalation unit risk value, air concentrations corresponding to 1 × 10⁻⁵ extra cancer risk can be calculated as 0.0011 and 2.4 ppb, respectively, with the former being three orders of magnitude below ambient concentrations of ethylene oxide in air (), and the latter nearly equivalent to ambient air concentrations.
Table 9. Unit risk values derived for ethylene oxide using epidemiology data
Public health benefits considerations
Health care-associated infections (i.e. infections resulting from treatment for another condition; HAIs) are of great importance to public health. A survey of 199 hospitals reported the prevalence of HAIs in 2015 to be approximately 3.2%, which was lower than the 4% noted from a similar survey conducted in 2011 (Magill et al., Citation2018). Sterilization of medical equipment and health-care products is essential to ensuring that the prevalence of HAIs remains as low as possible. Ethylene oxide is used to sterilize health-care products (e.g. drapes, gowns), implantable medical devices (e.g. bare metal stents, heart valves, vessel closure devices, etc.), and materials used during implantation procedures (e.g. catheters, guidewires, etc.) (Lambert et al., Citation2011). Ethylene oxide is an effective sterilizing agent against a wide variety of bacteria (e.g. E. coli, E. faecalis, P. aeruginosa, M. chelonei, B. stearothermophilus, B. subtilis, B. circulans, S. aureus, M. terrae, B. atrophaeus, G. stearothermophilus, C. difficile), viruses (herpes, vaccinia, parainfluenza, polio), and fungi (e.g. A. flavus, A. niger, A. fumigatus, A. versicolor, N. fischeri, E. chevalieri, P. chrysogenum, C. globosum, Ulocladium) (Ries et al., Citation1996; Alfa et al., Citation1996; Rakotonirainy et al., Citation2003; Rutala et al., Citation2020; Shintani, et al., Citation2017).
Ethylene oxide is particularly useful for sterilizing devices made from materials that are sensitive to heat, moisture, and/or radiolytic stress, for which alternative sterilization methods (e.g. autoclave, radiation) are incompatible (Shintani et al., 2017). Because ethylene oxide is compatible with a wide variety of materials, it is used to sterilize combination products where devices, drugs, and/or biologics are contained within a single product/packet (Lambert et al., 2011). Careful aeration of sterilized devices is needed to ensure that residual ethylene oxide concentrations are safe for use (Shintani et al., 2017).
Changes in ethylene oxide regulation due to the approximate 50-fold change in cancer potency estimate (USEPA, Citation2019) have affected operations at sterilization facilities in the U.S., which in turn affect the supply of medical devices. Shortages of sterilized medical devices might pose a threat to public health by delaying or disrupting critical care for patients, and is of even greater importance given the sterilization demands of hospitals as they manage the Covid-19 pandemic.
Example application to site-specific data for ethylene oxide
Considering the exogenous pathway in isolation, a comparison of site-specific air concentrations, using the data for the Illinois sites mentioned above (Medline, Vantage; Attachment 1), to background levels (local and national), 1 × 10⁻⁵ risk-specific concentrations (RSCs based on USEPA and TCEQ unit risk values), and endogenous equivalent levels is provided in . For both sites, mean concentrations of ethylene oxide in air in the vicinity of the facility are within a factor of 2 to background national ambient air concentrations. Mean concentrations of ethylene oxide in air at both sites are below the 1 × 10⁻⁵ RSC calculated using TCEQ’s unit risk value, but are well above the corresponding RSC calculated using USEPA’s unit risk value (which is also the case for local and national background concentrations). Both site mean concentrations fall approximately an order of magnitude below the endogenous equivalent concentrations based upon either the mean or SD for HEV levels in the U.S. population or that experienced by the 50th percentile of the U.S. nonsmoking population. Based upon the comparison in and on the information provided in this paper, the authors suggest that a risk manager might opt to use endogenous equivalent levels in at least two possible ways: (1) conclude that site-related exposures to ethylene oxide are negligible when compared to the magnitude and variation of endogenous exposures, and therefore no action is required to reduce site-related exposures; or (2) determine that site-related exposures to ethylene oxide are better managed using the unit risk from TCEQ (shallow linear slope assumption) rather than the unit risk from USEPA (steep linear slope assumption), since its predictions of risk fall within a more biologically plausible range when compared to magnitude and variation of endogenous exposures.
Potential risks from ethylene oxide are expected to be related to total exposure (i.e. from exogenous and endogenous pathways combined). When the exposures via the exogenous pathway are viewed within the context of total exposure to ethylene oxide in nonsmoking individuals, smoking individuals, and to a mixed population of smokers and nonsmokers (medium gray region of the columns in ), it may be concluded that the exogenous exposure pathway in the vicinity of these facilities is not an important contributor. Comparison of the total exposures for different exogenous exposures (ambient levels, 1 × 10⁻⁵ RSCs, site-related concentrations based on Medline IL site) in might be used to support a conclusion that site-related exposures do not contribute to a “substantial difference” from background total exposure that would warrant additional attention/action. That is, the column heights for each of the three exogenous exposure options are essentially the same, particularly when the variation in the endogenous and tobacco smoke pathways (error bars = SD in ) are taken into consideration. Since the increased prevalence of cancer was not observed with the elevated exposures to ethylene oxide from smoking (dark gray regions in ) (Jain Citation2020), and since the exogenous pathway (medium gray regions in ) is not an important contributor to total exposure in most cases, managing the potential risks from the exogenous pathway by investing resources to reduce ambient or site-related air concentrations of ethylene oxide to 1 × 10⁻⁵ RSC levels are not expected to result in a meaningful change to public health for nonsmoking individuals, smoking individuals, or a mixed population of smokers and nonsmokers.
Figure 9. Comparison of Ambient Background, 1 × 10⁻⁵ RSC, and Site-Related Air Concentrations to Total Exposure to Ethylene Oxide. RSC = Risk-Specific Concentration, UR = Unit Risk, UCL = Upper Confidence Limit
Discussion and conclusions
This review is intended to provide a better understanding of issues associated with total exposures to ethylene oxide from endogenous and exogenous pathways. Based upon information available in the published literature, a number of general conclusions may be supported for ethylene oxide.
HEV is a useful biomarker exposure that reflects total exposure to ethylene oxide from all pathways (endogenous and exogenous combined) for the several months prior to sampling.
HEV is detectable in nearly all samples collected in the U.S. population (Center for Disease Control (CDC) Citation2019), indicating that all individuals have some level of exposure to ethylene oxide via endogenous and/or exogenous pathways.
For nonsmokers, endogenous exposures to ethylene oxide serve as the largest contributor to total exposure:
Endogenous exposures to ethylene oxide result from multiple pathways, including those associated with the gastrointestinal lumen (bacterial) and systemic production.
There is considerable variation in measured HEV levels in the U.S. population, and this variation is generally consistent with the current understanding of variation in underlying factors and pathways for endogenous production.
Species differences in endogenous exposures to ethylene oxide are observed, with humans generally experiencing lower endogenous exposures than experienced by laboratory animals (with some species and strain differences noted).
Some human populations (e.g. workers in specific industries, smokers) experience elevated exposures to ethylene oxide compared to the general population of nonsmokers. However, exposure trends in workers have been decreasing over time in the U.S. due to better industry hygiene, engineering controls, and changes in occupational exposure limits. Similarly, tobacco-related exposures to ethylene oxide have also been decreasing over time due to changes in smoking habits in the U.S.
Although diminishing over time, smoking remains the largest single source of ethylene oxide exposure to smoking individuals, and to the U.S. population considered as a whole (mix of smokers and nonsmokers).
Exogenous exposure to ethylene oxide also indirectly affects endogenous production pathways possibly via an oxidative stress mechanism, and the latter pathway might be more important than the former pathway in contributing to total exposure.
Risk associated with low-level environmental exposures (i.e. well below the point of departure estimated from dose–response modeling for cancer effects) is highly uncertain, and may be considerably lower than that estimated using USEPA’s unit risk value (steep linear slope assumption), based on data collected in rats, on human experience with smoking, and on the unit risk for ethylene oxide derived by TCEQ (shallow linear slope assumption).
Risk management of ethylene oxide exposures is challenging, and has important public health implications.
RSC values based on USEPA’s unit risk value (U.S. Environmental Protection Agency (USEPA) Citation2016) are negligible compared to endogenous production and its variation in contributing to total exposure.
Ambient air concentrations of ethylene oxide are generally small compared to endogenous production in their contribution to total exposure.
Use of ethylene oxide as a sterilizing agent provides a benefit to public health in reducing HAIs.
Endogenous equivalent action levels provide a means for risk management decisions to be considered within the context of total exposure to ethylene oxide, so that the health impact of exogenous exposure pathways can be considered.
Although ethylene oxide is a well-studied chemical, substantial sources of uncertainty remain with respect to assessing potential risk to exposed human populations. Data needs for improving our understanding of ethylene oxide exposures and potential risks are identified below.
Endogenous Exposure Pathways – The bacteria present in the human gastrointestinal tract has been characterized (), but data on the ethylene production status of many of these strains were not located. A more complete characterization of ethylene production by human gut bacteria is needed. In addition, a better understanding of the relative contribution of gastrointestinal tract vs. systemic endogenous pathways in humans would be useful (e.g. studies of HEV levels measured in humans following long-term antibiotic use, total parenteral nutrition).
Exogenous Exposure Pathways – Recent monitoring efforts suggest ethylene oxide levels in air are widespread, and are generally consistent across rural, sub-urban, and urban locations (; U.S. Environmental Protection Agency (USEPA) Citation2019a). Better information is needed to understand the sources of ethylene oxide detected in ambient air, as well as for characterizing temporal and spatial variation in measured concentrations.
Mode of Action – Although low-dose linearity is assumed for genotoxic agents as a matter of policy, there exists some empirical and mechanistic evidence for ethylene oxide that lends support for nonlinear dose–response relationship. In addition, data in rats (Marsden et al. Citation2009) indicate that exogenous exposure to ethylene oxide increases its production by endogenous pathways. Full consideration of the available evidence within a mode of action framework would be useful to support low-dose extrapolation assumptions. Additional mechanistic studies are needed to help inform low-dose extrapolations assumptions (e.g. characterization of the dose–response relationship for key events in the proposed mode of action and relative contribution of endogenous and exogenous pathways following inhalation exposures to ethylene and ethylene oxide in B6C3F1 mice and F334 rats).
Cancer Potency Estimate – USEPA recently derived unit risk value for ethylene oxide is approximately 50-fold higher than the previous derived unit risk value. This unit risk value could be reconciled with a number of data sets and analyses.
Recent exposure reconstruction efforts which indicate that historical worker exposures may have been considerably higher than estimated for USEPA unit risk values (Bogen et al. Citation2019). In addition, the unit risk value should be assessed in terms of total exposures to workers, rather than relying solely on the characterization of the exogenous pathway, and include three components: (A) endogenous production; (B) exogenous occupational exposure; and (C) exogenous exposures from smoking, for which historical exposures are expected to be larger than current exposures due to changes in smoking habits ();
The combined concentration-response data for ethylene and ethylene oxide () indicate that the default assumption of low-dose linearity may be invalid for this chemical;
Epidemiology data for smokers, as a subset of the population with moderate exposure levels to ethylene oxide, provide an independent dataset which should be used to inform USEPA’s unit risk value and its low-dose assumptions.
Risk-Benefit Analysis – Because the use of ethylene oxide as a sterilizing agent provides a benefit to public health in reducing HAIs, a risk-benefit analysis would be useful in quantifying the net effects of any changes ethylene oxide use and release as a result of the USEPA’s revised unit risk value. A draft case study of the “health-risk tradeoff” associated with managing ethylene oxides public health benefits and risks has been developed (ARA, Citation2020; Frasier Citation2020), serves as a good starting point for such an analysis.
From a public health standpoint, the potential health effects of ethylene oxide are best managed by carefully considering total exposures to human populations, and the relative contributions of underlying pathways. With smoking identified as the single largest source of ethylene oxide exposure to the U.S. population (), efforts to reduce total exposures to ethylene oxide are best focused on maintaining the decreasing trends for tobacco use in the U.S. population (). Although dietary factors such as fatty acid consumption may exert a significant effect on total exposure to ethylene oxide, changes in fatty acid intakes cannot be recommended since the health benefits of consuming unsaturated fats over saturated fats are well recognized (USDA, Citation2010), and far outweigh any theoretical risks associated with increased endogenous ethylene oxide production. Similarly, attempts to reduce endogenous ethylene oxide production via management of gastrointestinal bacteria populations (e.g. reduction of ethylene-generating strains) is strongly not advised given the potential unforeseen consequences of gut biome manipulation and the potential impact this can have on human health. Exogenous ethylene oxide/ethylene exposure is identified as a relatively small contributor to total exposure. Because exogenous exposures represent only a small component of total exposure to ethylene, risk management efforts that rely on risk-based concentrations using USEPA’s unit risk value are not expected to produce a meaningful impact on total exposure. For this reason, such approaches are not expected to produce a meaningful benefit to public health (i.e. reduced cancer risk). In contrast, to the extent that reliance on risk-specific concentrations for ethylene oxide results in reduced availability of sterilized medical equipment, this practice has the potential to cause a net detriment to public health (e.g. increased rate of HAIs). The updated endogenous equivalent levels for ethylene oxide provided herein enables risk managers to place decisions within the context of total exposure, so that risk management decisions are informed.
Acknowledgments
The work in this manuscript was sponsored by the Ethylene Oxide Panel of American Chemistry Council (contract 10003701). The authors of this manuscript (CRK, AAL, PJS, RCL, JSB, SMH) are independent consultants. Ethylene Oxide Panel members were given an opportunity to review the draft manuscript for completeness and clarity; however, the authors of this paper had complete control over the content of the manuscript. The authors would like to thank Dr. Lesa Aylward for her assistance in analyzing the NHANES HEV data, and Drs. Patricia Ruiz (ATSDR) and Jane Teta (Exponent) for helpful comments and input on the draft manuscript. The authors, CRK and SMH, are owners of Summit Toxicology and thus have a financial interest in the content of this manuscript.
Additional information
Funding
References
- Alfa MJ, DeGagne P, Olson N, Puchalski T. Comparison of ion plasma, vaporized hydrogen peroxide, and 100% ethylene oxide sterilizers to the 12/88 ethylene oxide gas sterilizer. Infect Control Hosp Epidemiol. 1996 Feb;17(2):92–100. doi:10.1086/647252.8835444
- Alliance for Risk Assessment (ARA). 2020. Beyond Science and Decisions: From Problem Formulation to Risk Assessment Workshop XI.
- American Cancer Association (ACA). 2020. Smoking and Cancer. https://www.cdc.gov/tobacco/campaign/tips/diseases/cancer.html
- American Lung Association (ALA). 2020. Overall tobacco trends. https://www.lung.org/our-initiatives/research/monitoring-trends-in-lung-disease/tobacco-trend-brief/overall-tobacco-trends.html
- Angerer, J., M. Bader, and A. Krämer. 1998. Ambient and biochemical effect monitoring of workers exposed to ethylene oxide. Int. Arch. Occup. Environ. Health 71: 14–18. PMID: 9523244. doi:10.1007/s004200050244.
- Artati, A. 2010. Toxicokinetics of ethylene and ethylene oxide in the male B6C3F1 mouse. Doctoral Thesis, Lehrstuhl für Chemisch-Technische Analyse und Chemische Lebensmitteltechnologie, Technische Universität München. https://mediatum.ub.tum.de/doc/997729/997729.pdf
- Bader, M., J. Lewalter, and J. Angerer. 1995. Analysis of N-alkylated amino acids in human hemoglobin: Evidence for elevated N-methylvaline levels in smokers. Int. Arch. Occup. Environ. Health 67: 237–42. PMID: 7591184. doi:10.1007/BF00409405.
- Bailey, E., P. B. Farmer, and D. E. Shuker. 1987. Estimation of exposure to alkylating carcinogens by the GC-MS determination of adducts to hemoglobin and nucleic acid bases in urine. Arch. Toxicol. 60: 187–91. PMID: 3619640. doi:10.1007/BF00296978.
- Baren, R. E., M. E. Panisha, K. H. Shafer, C. N. Harward, Q. Shi, D. D. Nelson, B. McManus, and M. S. Zahniser. 2004. Quad quantum cascade laser spectrometer with dual gas cells for the simultaneous analysis of mainstream and sidestream cigarette smoke. Spectrochim. Acta Part A 60: 3437–47. PMID: 15561630. doi:10.1016/j.saa.2003.11.048.
- Barnard, J. A., and R. K. Y. Lee. 1972. Combustion of n-hexane in a shock tube. Combust. Sci. Technol. 6:143–50. doi:10.1080/00102207208952315.
- Block, G., N. Shaikh, C. D. Jensen, V. Volberg, and N. Holland. 2011. Serum vitamin C and other biomarkers differ by genotype of phase 2 enzyme genes GSTM1 and GSTT1. Am. J. Clin. Nutr. 94:929–37. doi:10.3945/ajcn.111.011460.
- Bogen, K. T., P. J. Sheehan, C. Valdez-Flores, and A. A. Li. 2019. Reevaluation of historical exposures to ethylene oxide among U.S. sterilization workers in the national institute of occupational safety and health (NIOSH) study cohort. Int. J. Environ. Res. Public Health 16: 1738. PMID: 31100939; PMCID: PMC6572526. doi:10.3390/ijerph16101738.
- Bono, R., M. Vincenti, U. Saglia, C. Pignata, R. Russo, and G. Gilli. 2002. Tobacco smoke and formation of N-(2-hydroxyethyl)valine in human hemoglobin. Arch. Environ. Health 57: 416–21. PMID: 12641182. doi:10.1080/00039890209601430.
- Bono, R., M. Vincenti, V. Meineri, C. Pignata, U. Saglia, O. Giachino, and E. Scursatone. 1999. Formation of N-(2-hydroxyethyl)valine due to exposure to ethylene oxide via tobacco smoke: A risk factor for onset of cancer. Environ. Res. 81: 62–71. PMID: 10361027. doi:10.1006/enrs.1998.3937.
- Boogaard, P. J., P. S. Rocchi, and N. J. van Sittert. 1999. Biomonitoring of exposure to ethylene oxide and propylene oxide by determination of hemoglobin adducts: Correlations between airborne exposure and adduct levels. Int. Arch. Occup. Environ. Health 72: 142–50. PMID: 10392561. doi:10.1007/s004200050353.
- Brugnone, F., L. Perbellini, G. B. Faccini, F. Pasini, G. B. Bartolucci, and E. DeRosa. 1986. Ethylene oxide exposure. Biological monitoring by analysis of alveolar air and blood. Int. Arch. Occup. Environ. Health 58:105–12. doi:10.1007/BF00380761.
- Center for Disease Control (CDC). 2004. Dietary intake of fats and fatty acids for the United States population: 1999–2000. Advance Data. Number 348. pp 3-7.
- Center for Disease Control (CDC). 2019. National Report on Human Exposure to Environmental Chemicals: Ethylene Oxide Hemoglobin Adducts. https://www.cdc.gov/exposurereport/ethylene_oxide_hemoglobin.html
- Clemens, M. R., and H. Remmer. 1982. Volatile alkanes produced by erythrocytes: An assay for in vitro studies on lipid peroxidation. Blut 45: 329–35. PMID: 7139130. doi:10.1007/BF00319527.
- Duus, U., S. Osterman-Golkar, M. Törnqvist, J. Mowrer, S. Holm, and L. Ehrenberg. 1989. Studies of determinants of tissue dose and cancer risk from ethylene oxide exposure. In Proceedings of the Symposium on Management of Risk from Genotoxic Substances in the Environment, 141–53. Solna.
- Eide, I., R. Hagemann, K. Zahlsen, E. Tareke, M. Törnqvist, R. Kumar, P. Vodicka, and K. Hemminki. 1995. Uptake, distribution, and formation of hemoglobin and DNA adducts after inhalation of C2–C8 1-alkenes (olefins) in the rat. Carcinogenesis 16: 1603–09. PMID: 7614695. doi:10.1093/carcin/16.7.1603.
- Einsele, H., M. R. Clemens, and H. Remmer. 1987. In vitro aging of red blood cells and lipid peroxidation. Arch. Toxicol. 60: 163–66. PMID: 3619637. doi:10.1007/BF00296972.
- Farmer, P. B., O. Sepai, R. Lawrence, H. Autrup, P. Sabro Nielsen, A. B. Vestergård, R. Waters, C. Leuratti, N. J. Jones, J. Stone, et al. 1996b. Biomonitoring human exposure to environmental carcinogenic chemicals. Mutagenesis 11:363–81. doi:10.1093/mutage/11.4.363.
- Farmer, P. B., R. Cordero, and H. Autrup. 1996a. Monitoring human exposure to 2-hydroxyethylating carcinogens. Environ. Health Perspect 104 (Suppl. 3):449–52. PMID: 8781362; PMCID: PMC1469654. doi:10.1289/ehp.96104s3449.
- Fennell, T. R., and C. D. Brown. 2001. A physiologically based pharmacokinetic model for ethylene oxide in mouse, rat, and human. Toxicol. Appl. Pharmacol. 173: 161–75. PMID: 11437638. doi:10.1006/taap.2001.9184.
- Fennell, T. R., J. P. MacNeela, R. W. Morris, M. Watson, C. L. Thompson, and D. A. Bell. 2000. Hemoglobin adducts from acrylonitrile and ethylene oxide in cigarette smokers: Effects of glutathione S-transferase T1-null and M1-null genotypes. Cancer Epidemiol. Biomarkers Prev. 9:705–12. PMID: 10919741.
- Fennell, T. R., R. W. Snyder, C. Parkinson, J. Murphy, and R. A. James. 2004. The effect of ethylene exposure on ethylene oxide in blood and on hepatic cytochrome P450 in Fischer rats. Toxicol. Sci. 81: 7–13. Epub 2004 May 12. PMID: 15141094. doi:10.1093/toxsci/kfh170.
- Filser, J. G., and D. Klein. 2018. A physiologically based toxicokinetic model for inhaled ethylene and ethylene oxide in mouse, rat, and human. Toxicol. Lett. 286: 54–79. Epub 2017 Jul 31. PMID: 28774830. doi:10.1016/j.toxlet.2017.07.896.
- Filser, J. G., W. Kessler, A. Artati, E. Erbach, T. Faller, P. E. Kreuzer, Q. Li, J. Lichtmannegger, W. Numtip, D. Klein, et al. 2013. Ethylene oxide in blood of ethylene-exposed B6C3F1 mice, Fischer 344 rats, and humans. Toxicol. Sci. 136: 344–58. Epub 2013 Sep 25. PMID: 24068676; PMCID: PMC3858200. doi:10.1093/toxsci/kft218.
- FOODB. 2020. Online data access: https://foodb.ca/compounds/FDB030353
- Frasier, L. H. 2020. Beyond science and decisions: from issue identification to dose-response assessment: summary of preliminary case study: Health risk tradeoffs in regulating emissions of ethylene oxide (EtO) from commercial sterilization plants. Case study #5 for ARA (2020) workshop proceedings. https://www.tera.org/Alliance%20for%20Risk/Workshop%20XI/Feb_2020
- Fu, P. C., V. Zic, and K. Ozimy. 1979. Studies of ethylene-forming system in rat liver extract. Biochim. Biophys. Acta 585: 427–34. PMID: 486541. doi:10.1016/0304-4165(79)90087-4.
- Fukuda, H., T. Ogawa, and S. Tanase. 1993. Ethylene production by micro-organisms. Adv. Microb. Physiol. 35: 275–306. PMID: 8310882. doi:10.1016/s0065-2911(08)60101-0.
- General, S. 2014. The health consequences of smoking—50 years of progress: A report of the surgeon general. USDHHS, 283. https://www.ncbi.nlm.nih.gov/books/NBK179276/pdf/Bookshelf_NBK179276.pdf
- Hagmar, L., H. Welinder, K. Lindén, R. Attewell, S. Osterman-Golkar, and M. Törnqvist. 1991. An epidemiological study of cancer risk among workers exposed to ethylene oxide using hemoglobin adducts to validate environmental exposure assessments. Int. Arch. Occup. Environ. Health 63: 271–77. PMID: 1743769. doi:10.1007/BF00386377.
- Hamm, T. E., Jr, D. Guest, and J. G. Dent. 1984. Chronic toxicity and oncogenicity bioassay of inhaled ethylene in Fischer-344 rats. Fundam. Appl. Toxicol. 4 (473–478):473–78. PMID: 6745536. doi:10.1016/0272-0590(84)90205-7.
- Haufroid, V., B. Merz, A. Hofmann, A. Tschopp, D. Lison, and P. Hotz. 2007. Exposure to ethylene oxide in hospitals: Biological monitoring and influence of glutathione S-transferase and epoxide hydrolase polymorphisms. Cancer Epidemiol. Biomarkers Prev. 16:796–802. doi:10.1158/1055-9965.EPI-06-0915.
- Health Canada 2016. Screening assessment ethene (Ethylene) chemical abstracts service registry number (CAS RN) 74-85-1. Environment and Climate Change Canada, Health Canada. Cat. No.: En14-237/2015E-EPUB ISBN 978-0-660-03472-0
- Hillman, E. T., H. Lu, T. Yao, and C. H. Nakatsu. 2017. Microbial ecology along the gastrointestinal tract. Microbes Environ. 32:300–13. doi:10.1264/jsme2.ME17017.
- Hogue, C. 2019. Is it time to crack down on ethylene oxide emissions? Chemical makers push back on possible tighter controls of carcinogen in the US. Chem Eng News 97:38.
- Hornung RW, Greife AL, Stayner LT, Steenland NK, Herrick RF, Elliott LJ, Ringenburg VL, Morawetz J. Statistical model for prediction of retrospective exposure to ethylene oxide in an occupational mortality study. Am J Ind Med. 1994 Jun;25(6):825–36. doi:10.1002/ajim.4700250607.8067360
- Iqbal, N., A. Trivellini, A. Masood, A. Ferrante, and N. A. Khan. 2013. Current understanding on ethylene signaling in plants: The influence of nutrient availability. Plant Physiol. Biochem. 73:128–38. doi:10.1016/j.plaphy.2013.09.011.
- Jain, R. B. 2020. Associations between observed concentrations of ethylene oxide in whole blood and smoking, exposure to environmental tobacco smoke, and cancers including breast cancer: Data for US children, adolescents, and adults. Environ. Sci. Pollut. Res. Int. 27:20912–19. doi:10.1007/s11356-020-08564-z.
- Kautiainen, A., M. Törnqvist, B. Anderstam, and C. E. Vaca. 1991. vivo hemoglobin dosimetry of malonaldehyde and ethene in mice after induction of lipid peroxidation. Effects of membrane lipid fatty acid composition. Carcinogenesis 12: 1097–102. PMID: 1670288. doi:10.1093/carcin/12.6.1097.
- Kautiainen A, Midtvedt T, Törnqvist M. Intestinal bacteria and endogenous production of malonaldehyde and alkylators in mice. Carcinogenesis. 1993 Dec;14(12):2633–6. doi:10.1093/carcin/14.12.2633.8269637
- Kirman, C. R., L. L. Aylward, M. Suh, M. A. Harris, C. M. Thompson, L. C. Haws, D. M. Proctor, S. S. Lin, W. Parker, and S. M. Hays. 2013. Physiologically based pharmacokinetic model for humans orally exposed to chromium. Chem. Biol. Interact. 204:13–27. doi:10.1016/j.cbi.2013.04.003.
- Kirman, C. R., and S. M. Hays. 2017. Derivation of endogenous equivalent values to support risk assessment and risk management decisions for an endogenous carcinogen: Ethylene oxide. Regul. Toxicol. Pharmacol. 91: 165–72. Epub 2017 Oct 28. PMID: 29111443. doi:10.1016/j.yrtph.2017.10.032.
- Kirman, C. R., S. M. Hays, L. L. Aylward, M. Suh, M. A. Harris, C. M. Thompson, L. C. Haws, and D. M. Proctor. 2012. Physiologically based pharmacokinetic model for rats and mice orally exposed to chromium. Chem. Biol. Interact. 200: 45–64. [published correction appears in Chem Biol Interact. 2013 Aug 25;204(3):201-6]. doi:10.1016/j.cbi.2012.08.016.
- Lake County. 2020. EtO monitoring results. Air monitoring results spreadsheet. Lake County, Illinois: Health Department & Community Health Center. Updated June 16, 2020. https://www.lakecountyil.gov/4188/EtO-Monitoring-Results
- Lambert BJ, Mendelson TA, Craven MD. Radiation and ethylene oxide terminal sterilization experiences with drug eluting stent products. AAPS PharmSciTech. 2011 Dec;12(4):1116–26. doi:10.1208/s12249-011-9644-8.20112.21887604
- Larsen, P. B. 2015. Mechanisms of ethylene biosynthesis and response in plants. Essays Biochem. 58:61–70. doi:10.1042/bse0580061.
- Lawrence, G. D., and G. Cohen. 1985. In vivo production of ethylene from 2-keto-4-methylthiobutyrate in mice. Biochem. Pharmacol. 34: 3231–36. PMID: 4038334. doi:10.1016/0006-2952(85)90339-9.
- Lin, J. S., K. T. Chuang, M. S. Huang, and K. M. Wei. 2007. Emission of ethylene oxide during frying of foods in soybean oil. Food Chem. Toxicol. 45: 568–74. Epub 2006 Oct 17. PMID: 17141388. doi:10.1016/j.fct.2006.10.002.
- London, S. J., J. Smart, and A. K. Daly. 2000. Lung cancer risk in relation to genetic polymorphisms of microsomal epoxide hydrolase among African-Americans and Caucasians in Los Angeles County. Lung Cancer 28: 147‐155. PMID: 10717332. doi:10.1016/s0169-5002(99)00130-0.
- Lynch, D. W., T. R. Lewis, W. J. Moorman, J. R. Burg, D. H. Groth, A. Khan, L. J. Ackerman, and B. Y. Cockrell. 1984. Carcinogenic and toxicologic effects of inhaled ethylene oxide and propylene oxide in F344 rats. Toxicol. Appl. Pharmacol. 76: 69–84. PMID: 6484993. doi:10.1016/0041-008x(84)90030-9.
- Maciel, S. S., C. Pereira Ada, G. J. Silva, M. V. Rodrigues, J. G. Mill, and J. E. Krieger. 2009. Association between glutathione S-transferase polymorphisms and triglycerides and HDL-cholesterol. Atherosclerosis 206:204–08. doi:10.1016/j.atherosclerosis.2009.02.011.
- Magill SS, O'Leary E, Janelle SJ, Thompson DL, Dumyati G, Nadle J, Wilson LE, Kainer MA, Lynfield R, Greissman S, Ray SM, Beldavs Z, Gross C, Bamberg W, Sievers M, Concannon C, Buhr N, Warnke L, Maloney M, Ocampo V, Brooks J, Oyewumi T, Sharmin S, Richards K, Rainbow J, Samper M, Hancock EB, Leaptrot D, Scalise E, Badrun F, Phelps R, Edwards JR; Emerging Infections Program Hospital Prevalence Survey Team. Changes in Prevalence of Health Care-Associated Infections in U.S. Hospitals. N Engl J Med. 2018 Nov 1;379(18):1732–1744. doi:10.1056/NEJMoa1801550.30380384
- Mansouri, S., and A. W. Bunch. 1989. Bacterial ethylene synthesis from 2-oxo-4-thiobutyric acid and from methionine. J. Gen. Microbiol. 135: 2819–27. PMID: 2559143. doi:10.1099/00221287-135-11-2819.
- Marsden, D. A., D. J. Jones, R. G. Britton, T. Ognibene, E. Ubick, G. E. Johnson, P. B. Farmer, and K. Brown. 2009. Dose-response relationships for N7-(2-hydroxyethyl)guanine induced by low-dose [14C]ethylene oxide: Evidence for a novel mechanism of endogenous adduct formation. Cancer Res. 69:3052–59. doi:10.1158/0008-5472.CAN-08-4233.
- Marsh, G. M., K. A. Keeton, A. S. Riordan, E. A. Best, and S. M. Benson. 2019. Ethylene oxide and risk of lympho-hematopoietic cancer and breast cancer: A systematic literature review and meta-analysis. Int. Arch. Occup. Environ. Health 92: 919–39. Epub 2019 May 20. PMID: 31111206. doi:10.1007/s00420-019-01438-z.
- Morgott, D. A. 2015. Anthropogenic and biogenic sources of Ethylene and the potential for human exposure: A literature review. Chem. Biol. Interact. 241: 10–22. Epub 2015 Aug 19. PMID: 26296759. doi:10.1016/j.cbi.2015.08.012.
- Müller, M., A. Krämer, J. Angerer, and E. Hallier. 1998. Ethylene oxide-protein adduct formation in humans: Influence of glutathione-S-transferase polymorphisms. Int. Arch. Occup. Environ. Health 71: 499–502. PMID: 9826084. doi:10.1007/s004200050312.
- Nagahama, K., T. Ogawa, T. Fujii, and H. Fukuda. 1992. Classification of ethylene-producing bacteria in terms of biosynthetic pathways to ethylene. J. Ferment. Bioeng. 73:1–5. doi:10.1016/0922-338X(92)90221-F.
- National Toxicology Program (NTP). 1987. Toxicology and carcinogenesis studies of ethylene oxide (CAS no 75-21-8) in B6C3F1 mice (inhalation studies). Natl. Toxicol. Program. Tech. Rep. Ser. 326:1–114. https://ntp.niehs.nih.gov/ntp/htdocs/lt_rpts/tr326.pdf?utm_source=direct&utm_medium=prod&utm_campaign=ntpgolinks&utm_term=tr326
- Norpoth, K., and H. M. Bolt. 1995. Ethylene oxide. In The MAK collection part IV, BAT value documentations, 2, 146–61. Wiley VCH, Weinheim, Germany. https://doi.org/10.1002/3527600418.bb7521e0002
- Olaguer, E. P., A. Robinson, S. Kilmer, J. Haywood, and D. Lehner. 2019. Ethylene oxide exposure attribution and emissions quantification based on ambient air measurements near a sterilization facility. Int. J. Environ. Res. Public Health 17: 42. PMID: 31861610; PMCID: PMC6981767. doi:10.3390/ijerph17010042.
- Paardekooper, L. M., G. van den Bogaart, M. Kox, I. Dingjan, A. H. Neerincx, M. B. Bendix, M. T. Beest, F. J. M. Harren, T. Risby, P. Pickkers, et al. 2017. Ethylene, an early marker of systemic inflammation in humans. Sci. Rep. 7: 6889. PMID: 28761087; PMCID: PMC5537290. doi:10.1038/s41598-017-05930-9.
- Preston, R. J., T. R. Fennell, A. P. Leber, R. L. Sielken Jr., and J. A. Swenberg. 1995. Reconsideration of the genetic risk assessment for ethylene oxide exposures. Environ. Mol. Mutagen. 26:189–202. doi:10.1002/em.2850260303.
- Rakotonirainy MS, Héraud C, Lavédrine B. Detection of viable fungal spores contaminant on documents and rapid control of the effectiveness of an ethylene oxide disinfection using ATP assay. Luminescence. 2003 Mar-Apr;18(2):113–21. doi:10.1002/bio.710.12687632
- Ries MD, Weaver K, Beals N. Safety and efficacy of ethylene oxide sterilized polyethylene in total knee arthroplasty. Clin Orthop Relat Res. 1996 Oct;(331):159-63. doi:10.1097/00003086-199610000-00022.8895633
- Rusyn, I., S. Asakura, Y. Li, O. Kosyk, H. Koc, J. Nakamura, P. B. Upton, and J. A. Swenberg. 2005. Effects of ethylene oxide and ethylene inhalation on DNA adducts, apurinic/apyrimidinic sites and expression of base excision DNA repair genes in rat brain, spleen, and liver. Repair 4: 1099–110. PMID: 16051529. doi:10.1016/j.dnarep.2005.05.009.
- Rutala WA, Gergen MF, Sickbert-Bennett EE, Weber DJ. Comparative evaluation of the microbicidal activity of low-temperature sterilization technologies to steam sterilization. Infect Control Hosp Epidemiol. 2020 Apr;41(4):391–395. doi:10.1017/ice.2020.2.202026.32098638
- Saghir, S. A., S. A. Khan, and A. T. McCoy. 2012. Ontogeny of mammalian metabolizing enzymes in humans and animals used in toxicological studies. Crit. Rev. Toxicol. 42: 323–57. PMID: 22512665. doi:10.3109/10408444.2012.674100.
- Sawada, S., and T. Totsuka. 1986. Natural and anthropogenic sources and fate of atmospheric ethylene. Atmos. Environ. 20: 821–32. PMID: 15092358. doi:10.1016/0269-7491(89)90239-x.
- Schaller, G. E. 2012. Ethylene and the regulation of plant development. BMC Biol. 10:9. doi:10.1186/1741-7007-10-9.
- Shintani H.Ethylene Oxide Gas Sterilization of Medical Devices. Biocontrol Sci. 2017;22(1):1-16. doi: 10.4265/bio.22.1. PMID: 28367865.
- Snellings, W. M., C. S. Weil, and R. R. Maronpot. 1984. A two-year inhalation study of the carcinogenic potential of ethylene oxide in Fischer 344 rats. Toxicol. Appl. Pharmacol. 75 (105–117). PMID: 6464016. doi:10.1016/0041-008x(84)90081-4.
- Steenland, K., L. Stayner, A. Greife, W. Halperin., R. Hayes, R. Hornung, and S. Nowlin. 1991. Mortality among workers exposed to ethylene oxide. N. Engl. J. Med. 324: 1402–07. PMID: 2020295. doi:10.1056/NEJM199105163242004.
- Steenland, K., L. Stayner, and J. Deddens. 2004. Mortality analyses in a cohort of 18 235 ethylene oxide exposed workers: Follow up extended from 1987 to 1998. Occup. Environ. Med. 61:2–7. PMID: 14691266; PMCID: PMC1757803.
- Steenland, K. E., J. D. Whelan, L. Stayner, and E. Ward. 2003. Ethylene oxide and breast cancer incidence in a cohort study of 7576 women (United States). Cancer Causes Control. 14: 531–39. PMID: 12948284. doi:10.1023/a:1024891529592.
- Swaen, G. M. H., C. Burns, J. M. Teta, K. Bodner, D. Keenan, and C. M. Bodnar. 2009. Mortality study update of ethylene oxide workers in chemical manufacturing: A 15 year update. J. Occup. Environ. Med. 51:714–23. doi:10.1097/JOM.0b013e3181a2ca20.
- Swenberg, J. A., K. Lu, B. C. Moeller, L. Gao, P. B. Upton, J. Nakamura, and T. B. Starr. 2011. Endogenous versus exogenous DNA adducts: Their role in carcinogenesis, epidemiology, and risk assessment. Toxicol. Sci. 120 (Suppl 1):S130–S145. Epub 2010 Dec 16. PMID: 21163908; PMCID: PMC3043087. doi:10.1093/toxsci/kfq371.
- Tates, A. D., P. J. Boogaard, F. Darroudi, A. T. Natarajan, M. E. Caubo, and N. J. van Sittert. 1995. Biological effect monitoring in industrial workers following incidental exposure to high concentrations of ethylene oxide. Mutat. Res. 329:63–77. doi:10.1016/0027-5107(95)00018-e.
- Tates, A. D., T. Grummt, M. Törnqvist, P. B. Farmer, F. J. van Dam, H. van Mossel, H. M. Schoemaker, S. Osterman-Golkar, C. Uebel, Y. S. Tang, et al. 1991. Biological and chemical monitoring of occupational exposure to ethylene oxide. Mutat. Res 250: 483–97. Erratum in: Mutat Res 1992, 280:73.PMID: 1719390. doi:10.1016/0027-5107(91)90205-3.
- Tavares, R., P. Ramos, J. Palminha, M. A. Bispo, I. Paz, A. Bras, J. Rueff, P. B. Farmer, and E. Bailey. 1994. Transplacental exposure to genotoxins. Evaluation in haemoglobin of hydroxyethylvaline adduct levels in smoking and non-smoking mothers and their newborns. Carcinogenesis 15: 1271–74. PMID: 8020166. doi:10.1093/carcin/15.6.1271.
- TCEQ. 2020. Ethylene Oxide Carcinogenic Dose-Response Assessment. CAS Registry Number: 75-21-8. Development Support Document Final, May 15, 2020. Texas Commission on Environmental Quality.
- Teta, M. J., L. O. Benson, and J. N. Vitale. 1993. Mortality study of ethylene oxide workers in chemical manufacturing: A 10 year update. Br. J. Ind. Med. 50: 704–09. PMID: 8398856; PMCID: PMC1012173. doi:10.1136/oem.50.8.704.
- Their, R., and H. M. Bolt. 2000. Carcinogenicity and genotoxicity of ethylene oxide: New aspects and recent advances. Crit. Rev. Toxicol. 30:595–608. doi:10.1080/10408440008951121.
- Thier, R., J. Lewalter, M. Kempkes, S. Selinski, T. Brüning, and H. M. Bolt. 1999. Haemoglobin adducts of acrylonitrile and ethylene oxide in acrylonitrile workers, dependent on polymorphisms of the glutathione transferases GSTT1 and GSTM1. Arch. Toxicol. 73: 197–202. PMID: 10463383. doi:10.1007/s002040050606.
- Todar, K. 2012. Online textbook of bacteriology. The normal bacterial flora of humans. http://www.textbookofbacteriology.net/normalflora_3.html
- Tompkins, E. M., K. I. McLuckie, D. J. Jones, P. B. Farmer, and K. Brown. 2009. Mutagenicity of DNA adducts derived from ethylene oxide exposure in the pSP189 shuttle vector replicated in human Ad293 cells. Mutat. Res. 678:129–37. doi:10.1016/j.mrgentox.2009.05.011.
- Törnqvist, M., and A. Kautiainen. 1993. Adducted proteins for identification of endogenous electrophiles. Environ. Health Perspect. 99: 39–44. PMID: 8319656; PMCID: PMC1567046. doi:10.1289/ehp.99-1567046.
- Törnqvist, M., A. L. Magnusson, P. B. Farmer, Y. S. Tang, A. M. Jeffrey, L. Wazneh, G. D. Beulink, H. van der Waal, and N. J. van Sittert. 1992. Ring test for low levels of N-(2-hydroxyethyl)valine in human hemoglobin. Anal. Biochem. 203: 357–60. PMID: 1416033. doi:10.1016/0003-2697(92)90325-2.
- Törnqvist, M., B. Gustafsson, A. Kautiainen, M. Harms-Ringdahl, F. Granath, and L. Ehrenberg. 1989a. Unsaturated lipids and intestinal bacteria as sources of endogenous production of ethene and ethylene oxide. Carcinogenesis 10: 39–41. PMID: 2910529. doi:10.1093/carcin/10.1.39.
- Törnqvist, M., J. Mowrer, S. Jensen, and L. Ehrenberg. 1986a. Monitoring of environmental cancer initiators through hemoglobin adducts by a modified Edman degradation method. Anal. Biochem. 154: 255–66. PMID: 3706730. doi:10.1016/0003-2697(86)90524-5.
- Törnqvist, M. A., J. G. Almberg, E. N. Bergmark, S. Nilsson, and S. M. Osterman-Golkar. 1989b. Ethylene oxide doses in ethene-exposed fruit store workers. Scand J Work Environ Health 15: 436–38. PMID: 2617260. doi:10.5271/sjweh.1829.
- U.S. Environmental Protection Agency (USEPA). 1988. Recommendations for and documentation of biological values for use in risk assessment. EPA/600/6-87/008.
- U.S. Environmental Protection Agency (USEPA). 2016. Evaluation of the inhalation carcinogenicity of ethylene oxide (CASRN 75-21-8). In support of summary information on the integrated risk information system (IRIS). EPA/635/R-16/350Fa
- U.S. Environmental Protection Agency (USEPA). 2019a. Ethylene oxide ambient concentrations at national air toxics trends stations and urban air toxics monitoring program stations October 1, 2018 – March 31, 2019. https://www.epa.gov/sites/production/files/2019-11/documents/data_summary_stations.pdf
- U.S. Environmental Protection Agency (USEPA). 2019b. Sensitivity of ethylene oxide risk estimates to dose-response model selection. Memorandum from Paul White to Kristina Thayer date October 18, 2019.
- Urbanski, S. P., W. M. Hao, and S. Baker. 2009. Chemical composition of wildland fire emissions. In Developments in Environmental Science, ed. A. Bytnerowicz, M. Arbaugh, A. Riebau, and C. Andersen, Vol. 8, 79. DOI:10.1016/S1474-8177(08)00004-1
- USDA. 2010. 2010 Dietary Guidelines Advisory Committee: Systematic Reviews of the Fatty Acids and Cholesterol Subcommittee. United States Department of Agriculture
- USEPA. 2002. Guidance for Comparing Background and Chemical Concentrations in Soil for CERCLA Sites. Office of Emergency and Remedial Response U.S. Environmental Protection Agency. Washington, DC 20460. EPA 540-R-01-003, OSWER 9285.7–41
- van Sittert, N. J., G. D. Beulink, E. W. van Vliet, and H. van der Waal. 1993. Monitoring occupational exposure to ethylene oxide by the determination of hemoglobin adducts. Environ. Health Perspect. 99: 217–20. PMID: 8319627; PMCID: PMC1567050. doi:10.1289/ehp.9399217.
- van Sittert, N. J., P. J. Boogaard, A. T. Natarajan, A. D. Tates, L. G. Ehrenberg, and M. A. Törnqvist. 2000. Formation of DNA adducts and induction of mutagenic effects in rats following 4 weeks inhalation exposure to ethylene oxide as a basis for cancer risk assessment. Mutat. Res 447: 27–48. PMID: 10686305. doi:10.1016/s0027-5107(99)00208-0.
- Walker, V. E., K. Y. Wu, P. B. Upton, A. Ranasinghe, N. Scheller, M. H. Cho, J. S. Vergnes, T. R. Skopek, and J. A. Swenberg. 2000. Biomarkers of exposure and effect as indicators of potential carcinogenic risk arising from in vivo metabolism of ethylene to ethylene oxide. Carcinogenesis 21: 1661–69. PMID: 10964097. doi:10.1093/carcin/21.9.1661.
- Walker, V. E., T. R. Fennell, P. B. Upton, J. P. MacNeela, and J. A. Swenberg. 1993. Molecular dosimetry of DNA and hemoglobin adducts in mice and rats exposed to ethylene oxide. Environ. Health Perspect. 99: 11–17. PMID: 8319608; PMCID: PMC1567016. doi:10.1289/ehp.939911.
- Wormhoudt, L. W., J. N. Commandeur, and N. P. Vermeulen. 1999. Genetic polymorphisms of human N-acetyltransferase, cytochrome P450, glutathione-S-transferase, and epoxide hydrolase enzymes: Relevance to xenobiotic metabolism and toxicity. Crit. Rev. Toxicol. 29: 59‐124. PMID: 10066160. doi:10.1080/10408449991349186.
- Wu, K. Y., S. Y. Chiang, T. H. Huang, Y. S. Tseng, Y. L. Chen, H. W. Kuo, and C. L. Hsieh. 2004. Formation of N-(2-hydroxyethyl)valine in human hemoglobin-effect of lifestyle factors. Mutat. Res 559: 73–82. PMID: 15066576. doi:10.1016/j.mrgentox.2003.12.011.
- Yin, C. C., H. Zhao, B. Ma, S. Y. Chen, and J. S. Zhang. 2017. Diverse roles of ethylene in regulating agronomic traits in rice. Front Plant Sci. 8:1676. doi:10.3389/fpls.2017.01676.
- Yong, L. C., P. A. Schulte, J. K. Wiencke, M. F. Boeniger, L. B. Connally, J. T. Walker, E. A. Whelan, and E. M. Ward. 2001. Hemoglobin adducts and sister chromatid exchanges in hospital workers exposed to ethylene oxide: Effects of glutathione S-transferase T1 and M1 genotypes. Cancer Epidemiol. Biomarkers Prev. 10:539–50. PMID: 11352866.
- Yoshikawa, M., K. Hiyama, S. Ishioka, H. Maeda, A. Maeda, and M. Yamakido. 2000. Microsomal epoxide hydrolase genotypes and chronic obstructive pulmonary disease in Japanese. Int. J. Mol. Med. 5: 49‐53. PMID: 10601573. doi:10.3892/ijmm.5.1.49.
- Zhang, H. D., Y. J. Ma, Q. F. Liu, T. Z. Ye, F. Y. Meng, Y. W. Zhou, G. P. Yu, J. P. Yang, H. Jiang, Q. S. Wang, et al. 2018. Human erythrocyte lifespan measured by Levitt’s CO breath test with newly developed automatic instrument. J. Breath Res. 12: 036003. Published 2018 March 9. doi:10.1088/1752-7163/aaacf1.