
 ?Mathematical formulae have been encoded as MathML and are displayed in this HTML version using MathJax in order to improve their display. Uncheck the box to turn MathJax off. This feature requires Javascript. Click on a formula to zoom.
ABSTRACT
Polycyclic aromatic hydrocarbons (PAHs) are ubiquitous pollutants of significant public health concern, with several that are highly toxic to humans, including some proven or suspected carcinogens. To account for the high variability of PAH mixtures encountered in occupational settings, adjusting urinary 1-hydroxypyrene (1-OHP) levels by the total airborne pyrene (PyrT)/benzo[a]pyrene (BaP) ratio is essential for human biomonitoring (HBM). Given the complexity and cost of systematically monitoring atmospheric levels, alternative approaches to simultaneous airborne and HBM are required. The aim of this review was to catalog airborne PyrT/BaP ratios measured during different industrial activities and recommend 1-OHP-dedicated biological guidance values (BGV). A literature search was conducted. Seventy-one studies were included, with 5619 samples pertaining to 15 industrial sectors, 79 emission processes, and 213 occupational activities. This review summarized more than 40 years of data from almost 20 countries and highlighted the diversity and evolution of PAH emissions. PyrT/BaP ratios were highly variable, ranging from 0.8 in coke production to nearly 40 in tire and rubber production. A single PyrT/BaP value cannot apply to all occupational contexts, raising the question of the relevance of defining a single biological limit value for 1-OHP in industrial sectors where the PyrT/BaP ratio variability is high. Based upon the inventory, a practical approach is proposed for systematic PAH exposure and risk assessment, with a simple frame to follow based upon specific 1-OHP BGVs depending upon the occupational context and setup of a free PAH HBM interactive tool.
Introduction
Polycyclic aromatic hydrocarbons (PAHs) are ubiquitous pollutants of significant public health concern (Barbosa et al. Citation2023; Louro et al. Citation2022). PAHs are formed during the incomplete combustion of organic materials such as environmental tobacco smoking, industrial emissions, fossil fuels, wood, petroleum products, residential heating, and even food preparation (Barros, Oliveira, and Morais Citation2023; Mallah et al. Citation2022; Zhang et al. Citation2021). PAHs are released into the environment as a mixture of both anthropogenic and natural origins, with the former being predominant (Barbosa et al. Citation2023; Haber et al. Citation2022). There are more than a thousand PAHs composed of two or more fused aromatic rings. PAHs with low molecular weight (2–3 rings) are abundant in the gaseous phase, while four-ring PAHs are distributed in both particulate and gaseous phases. PAHs with a high molecular weight (>5 rings) are abundant in the particulate phase and more toxic (Barbosa et al. Citation2023; Mallah et al. Citation2022).
Sixteen PAHs were classified as priority contaminants by the United States Environmental Protection Agency (US EPA) owing to their toxicity (Mallah et al. Citation2022), while several PAHs were classified as probable or possible carcinogens by the International Agency for Research on Cancer (IARC) (Cattley et al. Citation2023; IARC Citation2024). Benzo[a]pyrene (BaP) is the only PAH currently classified as carcinogenic to humans (IARC Group 1) (IARC Citation2024; Louro et al. Citation2022). Three PAHs (cyclopenta[cd]pyrene, dibenz[a,h]anthracene, and dibenzo[a,l]pyrene) are categorized as probably carcinogenic to humans (IARC group 2A), while 12 PAHs (anthracene, benzo[a]anthracene, benz[j]aceanthrylene, benzo[b]fluoranthene, benzo[c]phenanthrene, benzo[j]fluoranthene, benzo[k]fluoranthene, chrysene, dibenzo[a,h]pyrene, dibenzo[a,i]pyrene, indeno[1,2,3-cd]pyrene, and naphthalene) are classified as possibly carcinogenic to humans (IARC group 2B). Nine alkylated PAH derivatives are categorized as probable or possible carcinogens, in particular 5 derivatives of pyrene, namely 1-nitropyrene (group 2A), 1,3-dinitropyrene (group 2B), 1,6-dinitropyrene (group 2B), 1,8-dinitropyrene (group 2B), and 4-nitropyrene (group 2B). In addition, some PAH mixtures and occupations are classified as carcinogenic by IARC, with outdoor air pollution, aluminum production, coke production, diesel engine exhaust, firefighter, iron and steel founding, mineral oils (untreated or mildly treated), rubber manufacturing industry, and soot in Group 1. Bitumen (during roofing), carbon electrode manufacture, and frying (emissions from high temperatures) are classified in Group 2A, while bitumen (during mastic asphalt work and road paving), gasoline engine exhaust, and printing processes are designated as Group 2B.
The continuous emission of PAHs represents a constant concern for individual and population health. Human exposure to PAHs arises from a broad range of emission sources. PAHs can enter the body through different absorption pathways, including inhalation, dietary intake, and dermal exposure. Occupational PAH exposures represent the main concern. Indeed, workers are more frequently exposed to higher levels and for longer periods of their lives than the general population (Louro et al. Citation2022). Millions of workers are exposed to PAHs, including road pavers, firefighters (mainly wildland), aluminum, silicon, or electrode production workers (Barbosa et al. Citation2023; Barros, Oliveira, and Morais Citation2023; Cherry et al. Citation2023; Louro et al. Citation2022; Mallah et al. Citation2022; Taeger et al. Citation2023; Valière et al. Citation2022; Wallace et al. Citation2019). However, PAH exposures differ greatly from one industrial sector to another (Maître et al. Citation2018; Valière et al. Citation2022). The primary routes of occupational exposure are inhalation and, to a lesser extent, dermal contact.
Assessing the potential toxicological impact of PAHs on human health requires monitoring PAH levels. Two complementary approaches may be used: air monitoring and human biological monitoring (HBM). The use of HBM has become more common in recent years because this approach takes into account all uptake pathways and efficiency of personal protective equipment (PPE). The predominant PAH metabolites include urinary mono-hydroxylated metabolites. 1-Hydroxypyrene (1-OHP), the main urinary metabolite derived from pyrene (Pyr), is the most widely used PAH biomarker to assess human exposure to PAHs (Barbosa et al. Citation2023; ECHA Citation2022; Ifegwu and Anyakora Citation2016; Jeng and Pan Citation2014; Jongeneelen Citation2014; Louro et al. Citation2022; Taeger et al. Citation2023). 1-OHP has been extensively employed as a bioindicator over the past 30 years (ACGIH, Citation2020; Louro et al. Citation2022; SCOEL Citation2016; Taeger et al. Citation2023). The measurement of 1-OHP for PAH HBM is recommended by many health agencies around the world (ACGIH, Citation2020; HSE Citation2024; SCOEL Citation2016). 1-OHP is considered a sensitive and specific marker of PAH exposure (ECHA Citation2022; Ifegwu and Anyakora Citation2016; Jeng and Pan Citation2014; Louro et al. Citation2022). However, 1-OHP does not directly reflect carcinogenic PAH exposure (Jongeneelen Citation2014; Louro et al. Citation2022), unlike direct metabolites of BaP such as 3-hydroxybenzo[a]pyrene (3-OHBaP). Analysis of 3-OHBaP has been developed later and requires a more sensitive analytical technique than 1-OHP due to levels that are 1000–10,000-fold lower (Barbeau, Maître, and Marques Citation2011; Rögner et al. Citation2021). Hence, contrary to 1-OHP, analysis of 3-OHBaP is not easy and not readily available to most labs because this technique requires either sophisticated pre-analytical (automated solid-phase extraction) or analytical methods (mass tandem spectrometry), precluding its systematic use in occupational settings (ECHA Citation2022; Ifegwu and Anyakora Citation2016; Louro et al. Citation2022). The predominance of the fecal over urinary excretion pathway for BaP metabolites contributes to very low urinary 3-OHBaP levels. The use of urinary 1-OHP seemed to be more protective than that of urinary 3-OHBaP and airborne BaP (Valière et al. Citation2022). Urinary 3-OHBaP was found not relevant for occupational groups with low PAH exposure levels and might lead to underdiagnoses for assessing health risk (Valière et al. Citation2022). Contrary to other PAH metabolites (e.g., urinary naphthalene metabolites), urinary 1-OHP is not markedly influenced by confounding factors, such as smoking and other environmental sources (Persoons et al. Citation2020). In addition, associations between 1-OHP and genotoxic effects (e.g., high-frequency cells, sister chromatid exchanges), DNA adduct levels, and urinary 8-oxo-7,8-dihydro-2-deoxyguanosine (a biomarker of biologically effective dose of DNA damage) have been reported in workers in several industries (Jeng and Pan Citation2014; Jongeneelen Citation2014). The remainder of this review will focus on the most widely used PAH HBM approach (1-OHP) as this chemical has been extensively utilized for studying PAH exposure in multiple occupational and environmental settings globally for several decades (Ifegwu and Anyakora Citation2016; Jeng and Pan Citation2014; Jongeneelen Citation2014; Louro et al. Citation2022; SCOEL Citation2016; Taeger et al. Citation2023; Valière et al. Citation2022) and is recommended by several health agencies (ACGIH Citation2020; ECHA Citation2022; HSE Citation2024).
To the best of our knowledge, no apparent biological limit value (BLV) exists for 1-OHP (Jongeneelen Citation2014; Louro et al. Citation2022). Several health agencies proposed different biological reference values. The Scientific Committee on Occupational Exposure Limits (SCOEL) suggests a biological reference value, derived from the background levels of the general population, of 0.5 µg/g creatinine ( = 0.65 µg/L) (ECHA Citation2022; SCOEL Citation2016). The German Research Foundation (DFG) sets a biological reference value, derived for nonsmokers from a correlation between urinary 1-OHP and BaP in the air, of 0.3 µg/g creatinine ( = 0.39 µg/L) (ECHA Citation2022). The British Health & Safety Executive (HSE) recommends a technical value of 4 μmol/mol creatinine ( = 10 µg/L) based upon the 90th percentile value of a survey of workplaces with exposure to PAH (HSE Citation2024). The Finnish Institute of Occupational Health (FIOH) recommends a biological reference value (“action limit”) of 12 nmol/l creatinine ( = 2.62 µg/L) based upon the 90th percentile from the biomonitoring results, measured for coke oven workers (n = 32) with good industrial practices in 2008 in Finland (ECHA Citation2022). The only existing biological guidance value (BGV) for 1-OHP is the value proposed by ACGIH of 2.5 μg/L (ACGIH Citation2020). However, the BGV from ACGIH was mainly based upon data coke production. In order to account for different relative proportions of total Pyr (PyrT, sum of both gaseous and particulate pyrene) and BaP in PAH industrial mixtures encountered in a broad spectrum of industrial sectors and occupational contexts, it has been proposed to adjust the urinary 1-OHP BGV (ACGIH) by the airborne PyrT/BaP ratio of a specific exposure context using the following equation: (ACGIH Citation2020). Jongeneelen (Citation2014) recommended adjusting urinary 1-OHP levels when the PyrT/BaP ratio lies in the 1.5–4.5 range and not adjusting otherwise. Adjustment of 1-OHP concentration by the PyrT/BaP ratio requires air sampling due to highly variable ratios observed in various occupational groups (Valière et al. Citation2022). Given the complexity and cost of systematically monitoring atmospheric levels, alternative approaches to simultaneous airborne and urine HBM are required (Valière et al. Citation2022), such as an inventory of the PyrT/BaP ratio according to industrial activities.
This review attempted to catalog PyrT/BaP ratios according to industrial activities that might benefit human health risk assessment resulting from PAH exposure by facilitating PAH exposure assessment in occupational contexts when the most widely used PAH HBM approach (urinary 1-OHP monitoring) is conducted. This inventory/database may be a useful resource for physicians, risk assessors, risk managers, practitioners, industry practitioners, decision-makers, and sanitary agencies. Indeed, it might serve as a valuable resource for the establishment of BGVs and BLVs. In addition, a user-friendly and interactive online tool was created to: 1) make the inventory/database easily findable, accessible, interoperable, and re-usable; and 2) help in the implementation/calculation of BGVs and facilitate the interpretation and risk assessment of PAH from HBM. Hence, our presented investigation aimed to offer a practical approach for systematic PAH exposure and risk assessment, with a simple frame to follow based upon the occupational context and most frequently used biomonitoring approach (urinary 1-OHP monitoring). Our findings may support the improvement of 1-OHP biomonitoring interpretation, which is essential for enabling a more accurate PAH exposure assessment, as well as an earlier detection and prevention of PAH-related adverse health effects.
Materials and methods
Literature search strategy and selection criteria
The literature search was conducted using the PubMed search engine in accordance with the Preferred Reporting Items for Systematic Reviews and Meta-Analyses (PRISMA) criteria. To reduce the bias induced by daily database changes, all data collection (literature retrieval and data download) was conducted and completed on the same day, February 10, 2022. The search was repeated in October 2023 to include publications from 2022. The search query consisted of 88 terms, including MeSH and relevant free-text terms related to PAHs, occupation, airborne exposure, exposure monitoring, language, and terms excluded (supplemental information). The search was limited to peer-reviewed publications written in English or French that dealt with airborne PAH exposure monitoring in occupational settings. In order to guarantee the representativeness of the included publications, the search results were filtered by language, title, abstract, and paper content to exclude irrelevant articles (Table S1). Papers that did not report the PyrT/BaP ratio or both airborne BaP and either PyrT or both gaseous pyrene (PyrG) and particulate pyrene (PyrP) levels from long-term sampling (>2 h) were excluded.
Three independent authors (AC, AM, and PP) collectively performed data collection, with one (AC) responsible for operation and two others (AM and PP) responsible for the check. Filtered data were then cleaned up and validated to exclude any publications with no relevance to the main subject of investigation in this study. Disagreements were discussed, followed by a joint full review of the articles of concern, which led to inclusion or exclusion.
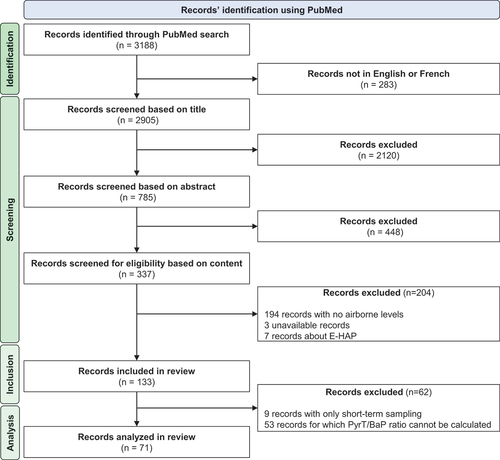
The literature search yielded 3188 records that had been published. Irrelevant and duplicate records (3117) were excluded, leaving a total of 71 articles that were analyzed (). No attempt to conduct an analysis of the scientific content of the identified records was undertaken because it was outside the scope of this study. In addition, no data quality analysis (qualitative or quantitative) of the studies compiled from this investigation was made.
Figure 1. PRISMA flow chart depicting the literature search and the evaluation process for finding relevant records.
Data extraction from published studies
The author’s name, publication year, geographical location, occupational context, sampling year(s), sampling device/technique (e.g., type of particulate filter), sampling strategy (e.g., time, flowrate), number of samples, airborne BaP levels, airborne Pyr levels (gaseous, particulate, and/or total), PyrT/BaP ratio, and other relevant information were all extracted from the included studies using MS Excel.
Data extraction from Exporisq-HAP
The Exporisq-HAP database (E-HAP) is one of the most comprehensive existing databases on exposure to PAHs (Petit Citation2022). E-HAP provides a detailed picture of airborne PAH exposures and urinary metabolite levels encountered in the French industrial landscape over the last 25 years (Maître et al. Citation2018; Petit et al. Citation2017; Valière et al. Citation2022). Because the authors of this review own E-HAP, the latest E-HAP data available to them was employed instead of extracting E-HAP data from published peer-reviewed publications. From the 2650 airborne samples available in the E-HAP database, 2213 (83.5%) samples providing both airborne concentrations of BaP and PyrT were included and analyzed.
Data management/wrangling
Data extracted from the literature and E-HAP were used to construct a database of PyrT/BaP ratios in various occupational contexts. To harmonize/standardize and make the retrieved data comparable, occupational context and sampling device/technique were coded in the same manner as E-HAP. Briefly, the occupational context was structured into similar exposed groups (SEGs) of three hierarchical levels of increasing description (Petit et al. Citation2017), with the first level (referred to as sector throughout the paper) predominantly related to the characteristics of products/raw materials (e.g., engine exhaust emissions, carbon electrodes, or bitumen fume). Each sector was then subdivided into subgroups (referred to as processes) with information that referred to exposure source characteristics (e.g., job titles, posts, locations, and/or operations with different emission sources). Processes were split into subgroups (referred to as activities) with information that usually corresponded to a task or a series of homogeneous tasks. Sectors, processes, and activities were the least, intermediate, and most accurate levels of description of the occupational context, respectively. The same person (AM) responsible for the coding of E-HAP performed the coding harmonization. Because the sampling strategy (e.g., duration, technique) exerts a marked impact on airborne BaP and Pyr levels, only sampling strategies that may be directly comparable were included in the data analysis. To that end, only sampling using either an Amberlite XAD-2 resin cartridge, chromosorb-102, or polyurethane foam (PUF) to collect gaseous PAHs and either fiber glass, polytetrafluoroethylene (PTFE), Teflon, quartz, or acrylic copolymer membrane filters to collect particulate PAHs were considered in data analysis.
PyrT/BaP ratio calculation
PyrT/BaP ratios were calculated only when the ratio was not already reported in the publication. When absent or not reported, the PyrT/BaP ratio was calculated only if PyrT or both PyrP and PyrG levels were reported and if the statistics (e.g., geometric mean, median) used to report BaP and Pyr levels were the same in the paper. In addition, in cases where BaP and/or Pyr levels were inferior to the limit of detection/quantification, the PyrT/BaP ratio was not calculated. Whenever possible, the distribution of the PyrT/BaP ratio was calculated using the reported distribution statistics, such as the number of samples, arithmetic mean, and arithmetic standard deviation in the case of a normal distribution. For lack of anything better, when it was not possible to recreate the distribution of PyrT/BaP ratios, an empirical rule to selecta single PyrT/BaP ratio was utilized from the data reported. Because PAH levels often follow a lognormal distribution (Rappaport Citation1991), when possible, the use of the geometric mean (GM) over other statistics was prioritized. When GMs were not available, in priority, the median, arithmetic mean, and, at last resort, the ratio were used. Occupational contexts (sectors, processes, and activities) with less than 5 samples are presented but not discussed in this review.
Creation of an online tool – PAH HBM tool
A free, user-friendly, and interactive web application named PAH HBM tool was created (https://exporisk-timc.imag.fr/PAH/) to make the inventory of PyrT/BaP ratios easy to retrieve, accessible, interoperable, and re-usable. This tool may facilitate and aid the wider implementation and calculation of BGVs as well as interpretation of 1-OHP values. More information regarding the PAH HBM tool is available in the supplemental information. Data analysis, all calculations, and the creation of the PAH HBM tool were performed with R software 4.1.2® (R Core Team, Vienna, Austria) for Windows 10©.
Results
Characteristics of the included samples
Geographic scale/scope
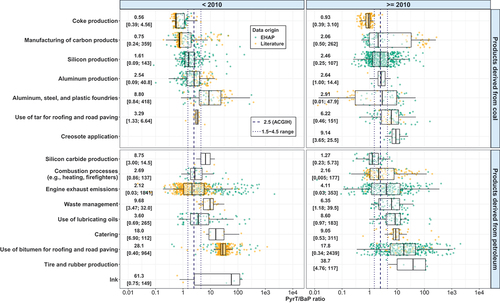
A total of 5619 samples from 19 countries were available, with 3406 (60.6%) that were extracted from the literature and 2213 (39.4%) from E-HAP. Amongst published data, most samples were collected in Finland (n = 1011, 29.9%), followed by Italy (n = 472, 13.9%), Germany (n = 421, 12.4%), Norway (n = 416, 12.2%), and Taiwan (n = 224, 6.58%) (). Regarding E-HAP, most samples were from France (n = 2193, 99.1%), and a few from Brazil (n = 20, 0.90%) ().
Time period
Regarding data from the literature, the oldest study dates back to 1981 and pertains to aluminum production (Bjorseth, Bjorseth, and Fjeldstad Citation1981). Most papers were published since 2000 (81.3%), with 62.7% since 2005, 36% since 2010, and 16% since 2015 (). Most samples were reported between 1995 and 2015 (n = 2991, 87.8%). Data from E-HAP were more recent, with only 5.2% of samples that were prior to 2005 and with most samples recorded between 2005 and 2019 (n = 1969, 89%).
Figure 2. PyrT/BaP ratios at the sector scale depending on the sampling period Green points refer to data from E-HAP while yellow points refer to data from the literature.
Occupational contexts
There was a broad range of occupational contexts reported, with 15 sectors, 79 processes, and 213 activities (). The sectors included: aluminum production; coke production; silicon production; aluminum, steel, and plastic foundries; manufacturing of carbon products; creosote application (railroad maintenance with the replacement of creosote-impregnated wood ties); catering; combustion processes (e.g., cement plant, firefighter, chimney sweeper, or food smoking); engine exhaust emissions; ink production and printing companies; use of tar and bitumen for roofing and road paving; silicon carbide production; tire and rubber production; use of lubricating oils; and waste management.
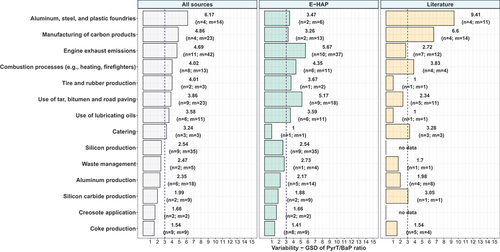
Figure 3. Comparison of the variability of PyrT/BaP ratios between sectors GSD: geometric standard deviation, n: number of processes within a sector, m: number of activities within a sector.
The diversity of occupational contexts was higher in E-HAP than in the literature. Most sectors were common between data from the literature and E-HAP, with only two sectors from E-HAP (silicon production and creosote application) that were not found in the literature. Regarding the processes, 27 (34%) were shared between both data sources, while 14 (18%) were only found in the literature, and 38 (48%) were only available in E-HAP. Regarding the activity, there were 33 (16%) activities that were found in both the literature and E-HAP, while 39 (18%) and 141 (67%) were exclusive to the literature and E-HAP, respectively.
Sampling strategy
For E-HAP, the sampling technique has remained the same since its inception, with the use of a combined aerosol-vapor sampler made of an Amberlite XAD-2 resin cartridge to trap gaseous PAHs and a 37-mm-diameter quartz filter to trap particulate PAHs (Maître et al. Citation2018; Petit et al. Citation2017). Regarding data reported in the literature, many sampling techniques were used (). The most used technique to collect gaseous PAHs was the use of an Amberlite XAD-2 resin cartridge (91.6%), followed by chromosorb-102 (4.6%), polyurethane foam (3.7%), and bottles with ethanol or impinger with toluene (0.03%). The fiber glass membrane filter was the most employed sampling technique to collect particulate PAHs (58.6%), followed by polytetrafluoroethylene (PTFE) or Teflon membrane filter (33.7%), quartz filter (5.2%), and acrylic copolymer membrane filter (2.6%). The detailed information regarding the sampling strategies (e.g., year, location, duration, flow rate, device, limit of quantification/detection…) and other relevant information (if the workers were wearing a mask, the presence or not of collective protective equipment, if biomonitoring was conducted, and if dermal monitoring was conducted) is available and freely downloadable from the table provided in the “data source” tab on the PAH HBM tool.
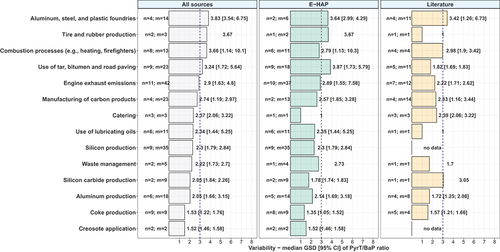
Figure 4. Comparison of the PyrT/BaP ratio variability within sectors at the process level GSD: geometric standard deviation, n: number of processes within a sector, m: number of activities within a sector.
PAH levels reported
In most of the published samples (96.3%), BaP levels were reported (), while PyrT levels were noted in 72.4% of them, PyrP and PyrG levels in 26.4%, and PyrT/BaP ratio in 5.87%, respectively. PAH levels or PyrT/BaP ratios were reported most of the time as arithmetic means (n = 34, 48%), followed by single values (35%), medians (34%), GMs (18%), and minimum and maximum ranges (11%) (). For most cases (72%), only single PyrT/BaP values could be used. Indeed, it was possible to generate PyrT/BaP distributions for only 20 studies (28%), which accounted for more than one-third of the published samples (n = 1292, 36%). There were 15 studies (21.1%) that did not report the number of samples.
Figure 5. Comparison of the PyrT/BaP ratio variability within sectors at the activity level GSD: geometric standard deviation, m: number of activities within a sector.
Descriptive analysis of PyrT/BaP ratios
Levels of PyrT/BaP ratios
PyrT/BaP ratios are presented in and for all sectors, while PyrT/BaP ratios for all occupational contexts (sector, process, and activity) are provided in Table S2. The estimated BGV using the recommendations of ACGIH is also presented in Tables S1 and S2. The highest PyrT/BaP ratios were noted in ink (61.3 [0.75; 149]). The median PyrT/BaP ratio observed in ink was 1.6, 2.5, 6.7, 6.7, and 8.4-fold higher than the ratio from tire and rubber production, use of tar, bitumen and road paving, creosote application, catering, and waste management, respectively. It was also 10.0, 11.7, 12.7, 23.6, 24.1, 26.7, and more than 30-fold higher than the ratios detected in foundries, the use of lubricating oils, engine exhaust emissions, aluminum production, combustion processes, and other metallurgy sectors (e.g., coke production), respectively. Median PyrT/BaP ratios cited in the literature were similar to those of E-HAP, being respectively only 2.6, 1.9, 1.5, 1.4, and 1.2-fold higher than the median ratio of E-HAP for aluminum production, use of tar, bitumen and road paving, waste management, foundries, and combustion processes, respectively (). In contrast, the median PyrT/BaP ratios found in the literature were 1.3, 1.9, and 3-fold lower than those of E-HAP for coke production, manufacturing of carbon products, and engine exhaust emissions, respectively. In several sectors (coke production, manufacturing of carbon products, engine exhaust emissions), PyrT/BaP ratios appeared to have increased over time ().
Table 1. PyrT/BaP ratios for each sector.
Most PyrT/BaP ratios were not within the 1.5–4.5 range (Figure.S6-S8), including aluminum production (51.2% of the samples within the 1.5–4.5 range), silicon production (43.1%), and silicon carbide production (37%). In contrast, sectors with less than 20% samples within the 1.5–4.5 range were manufacturing of carbon products (17.9%), foundries (14.8%), use of tar, bitumen and road paving (12.9%), creosote application (5.3%), coke production (5.1%), catering (4.2%), ink, and tire and rubber production (not detected).
Variability of PyrT/BaP ratios
The variability of PyrT/BaP ratios was dependent upon the sector, with a geometric standard deviation (GSD) ranging from 1.5 for coke production to 6.17 for aluminum, steel and plastic foundries (). Sector variability was usually higher for data from E-HAP compared to published data, with the exception of manufacturing of carbon products, foundries, and coke production.
Regarding the processes (second level of description of the occupational context) within each sector (Table S2), the PyrT/BaP ratios were less variable than at the sector scale, with median GSDs ranging from 1.52 for creosote application to 3.83 for foundries (). PyrT/BaP ratios were more variable for E-HAP than in the literature, with the exception of coke production and combustion processes. For E-HAP, there were 21 processes (32.3%) with a GSD > 3, and 3 (4.6%) with a GSD ≥ 6. Processes with the highest PyrT/BaP ratio variability were aluminum oxide production in the combustion processes (GSD = 11.1), followed by engine exhaust emissions from highways (GSD = 8.34), grease welding during the use of lubricating oils (GSD = 5.36), vehicle drivers (GSD = 4.95), and application of hot bitumen on roads (GSD = 4.8). For data from the literature, there were 7 processes (17.9%) with a GSD > 3, and 1 (2.6%) with a GSD ≥ 6. The processes with the highest PyrT/BaP ratio variability were miscellaneous foundries (GSD = 6.98), followed by plastics processes (GSD = 3.71), manufacturing of fiber tubes (GSD = 3.51), firefighters (GSD = 3.44), miscellaneous catering (GSD = 3.27), and steelworks (GSD = 3.14).
Regarding the activities (third and most descriptive level of the occupational context) within each sector (Table S2), the PyrT/BaP ratios were clearly found to be less variable than at the sector and process description level scales, with median GSDs ranging from 1.39 for ink to 3.31 for tire and rubber production (). PyrT/BaP ratios were more variable for E-HAP than in the literature, with the exception of coke production. For E-HAP, there were 42 activities (24.1%) with a GSD > 3, and 7 (4%) with a GSD ≥ 6. The activities with the highest PyrT/BaP ratio variability were garbage collector drivers (GSD = 20.1), highway administrative personnel (GSD = 15.8), highway services and technicians (GSD = 7.02), mechanics working on light vehicles with diesel engines (GSD = 7.25), heat attendant masons fixing burners in the silicon production (GSD = 14.2), and furnace reconstruction in the aluminum oxide production (GSD = 11.1). For data from the literature, there were 8 activities (11.1%) with a GSD > 3, and 1 (1.4%) with a GSD ≥ 6. The activities with the highest PyrT/BaP ratio variability were building site machinery drivers (GSD = 6.14), press activities in the plastics processes (GSD = 4.43), miscellaneous activities during the firebrick production (GSD = 4.28), tar applications during road paving (GSD = 4.00), and outside interventions or exercise activities for firefighters (GSD = 3.44).
Discussion
This review provides a detailed picture of the PAH industrial landscape and emission profiles over the last 40 years. Having a track record of PyrT/BaP ratios is paramount for occupational physicians, industrial hygienists, and decision-makers because the composition of the mixture influences its toxicity. To the best of our knowledge, there is currently no available review providing a comprehensive compilation of existing PyrT/BaP ratios in occupational settings, consolidated in a single resource that might support PAH biomonitoring and risk assessment. In addition, only 7 of the published papers provided PyrT/BaP ratios, which emphasizes the usefulness of this work.
Remarks regarding retrieved data
Published data were found to be heterogeneous in nature. The study designs, sampling strategies, statistics, and information reported were not harmonized between investigations. For instance, 39% of published papers did not report PyrG levels, although urinary 1-OHP is highly influenced by and correlated with PyrG (Barbeau et al. Citation2015). The Pyr nature (gaseous, particulate, or total) was rarely provided and had to be deducted from the sampling strategies. However, occasionally the sampling strategies were not sufficiently descriptive to determine the Pyr nature. To lessen this bias, sampling strategies that may not be directly comparable were not included in the data analysis.
One of the major shortcomings of the literature data was that from one paper to another, the statistics used (e.g., GSD, arithmetic mean) to report PAH levels and ratios were different. In addition, for many published papers, the number of samples, the number of missing data, and the limit of quantification were not provided. When the sample size was not provided, we assumed that it was a single value, which might not always be the case. Because of the heterogeneity of available data, different statistics were used to analyze the published data, which is not ideal. Therefore, data from published literature should be carefully considered. Regarding E-HAP, there was no problem with the data since the authors own E-HAP and because the sampling strategies of E-HAP have been the same since its inception (Maître et al. Citation2018; Petit et al. Citation2017).
The occupational context reported in published papers was heterogeneous and predominantly not based upon international classifications. Defining the occupational context in terms of SEGs is critical for inferential analysis and essential to understanding exposure variability (Lippmann, Gomez, and Rawls Citation1996; Loomis and Kromhout Citation2004). However, the construction of SEGs for a given pollutant might turn out to be rather challenging because of the multifactorial variability of exposures either between or within industries (Petit et al. Citation2017). Coding systems are essential to store and classify data, especially in databases where existing structures and broad characteristics of the workplace (job title, work location, process, or engineering controls) are generally used to code exposure and more specifically SEGs (Burdorf and van Tongeren Citation2003; Symanski, Maberti, and Chan Citation2006). Standard coding systems, such as ISCO (International Standard Classification of Occupations), NAICS (North American Industry Classification System), or NACE (Statistical Classification of Economic Activities in the European Community) (Mannetje and Kromhout Citation2003), are based upon general categories such as job titles and are therefore too generic and not directly related to both the worker’s tasks and emission sources (Marquart et al. Citation2011; Petit et al. Citation2017). Marquart et al. (Citation2011) proposed a classification based upon determinants of emission, while others employed different grouping strategies, such as combining sources of information like job titles, occupation, and factory (Koh et al. Citation2015; Lee et al. Citation2015). However, information recorded regarding workers and workplaces might not always be compatible with such coding systems (Koeman et al. Citation2013). In addition, when using clerical coding, it is rather complicated and time-consuming to use the information recorded to find the most relevant or best-corresponding occupation and industry described in the standard coding systems (Patel et al. Citation2012; Russ et al. Citation2014). It was decided to select harmonization in the occupational context based upon classification used for E-HAP to facilitate comparison and be more accurate. To lessen a potential classification bias, the individual in charge of the coding of E-HAP (AM) translated the occupational context into E-HAP codes of three levels of description (sector, process, and activity). In addition, this three-level coding system was found to offer a high degree of accuracy in a previous study (Petit et al. Citation2017). Nonetheless, the original terms employed in the published papers were kept and are available on the PAH HBM tool.
Results interpretation
The results of this review reflect PAH emissions from many sectors in 19 countries over more than 40 years, making these data unique and valuable. These large industrial processes and temporal periods examined might explain the large variability of PyrT/BaP ratios encountered. Indeed, there are many factors that might differ between countries and over time, such as industrial hygiene measures and/or the use of different and evolving processes and practices. For example, in French aluminum production, there was a change of process in the 1990′s in France with the use of prebaked electrodes instead of Soderberg electrodes (Hopf, Carreón, and Talaska Citation2009; Maître et al. Citation2018). Since 2015, seals used during the electrolysis furnace repairs do not contain PAHs anymore, which led to the cessation of PAH occupational exposure surveillance in the French aluminum production (Allard, Tawfik, and Kumar Citation2016). In road paving, changes in raw material composition (no more coal tar) and temperature of application (decrease) have also occurred (Cavallari et al. Citation2012; Germin-Aizac et al. Citation2023), while vehicle engines and vehicle fuel also evolved. The introduction of new standards, legislation and/or reductions in emissions sources might also lead to decreasing exposures and changes in PAH mixture composition (Creely et al. Citation2007). In addition, the diversity of activities, processes, and jobs by sector is high, with, for instance, the combustion process sector including firefighters, incinerators, heating system maintenance, electrocautery surgery, and chimney sweepers. This might explain why the variability of PyrT/BaP ratios was often higher in E-HAP than those from published data because the number of occupational contexts within each sector and process is higher in E-HAP than in published data. It should be noted that the variability of published data is smaller than it should be in reality (underestimation) because for most studies (n = 51, 72%) only single values (e.g., mean, median) were used. Indeed, because of missing information (e.g., type of distribution, distribution parameters, number of samples), it was most of the time not possible to generate/recreate the distribution reported in order to reflect as accurately as possible the true variability of published results. The magnitude of this underestimation is, however, impossible to determine. This might explain why the variability of PyrT/BaP ratios was most of the time smaller in the literature than for E-HAP, even though published data was more heterogeneous in nature with results from various countries, time periods, or sampling strategies. Results from literature data need to therefore be interpreted carefully.
Only long-term sampling for PyrT/BaP ratios needs to be used to assess chronic health risks because urinary 1-OHP is correlated with averaged airborne PAH levels (Barbeau et al. Citation2015). As previously shown, PyrT/BaP ratios were highly variable in many occupational groups (Jongeneelen Citation2014; Valière et al. Citation2022). This variability arises predominantly from the aforementioned statements and the fact that the composition of PAH mixtures varies considerably across different occupational contexts. Only 6 sectors out of 15 had a GSD < 3. Hence, it is better to focus on the most descriptive level of description available. All sectors utilizing products derived from petroleum had a PyrT/BaP ratio that was most usually above the value of 2.5 proposed by ACGIH (Citation2020), with the exception of combustion processes and silicon carbide production. Regarding sectors using products derived from coal, these were usually under the value of 2.5 proposed by ACGIH, with the exception of creosote application, foundries, and the use of tar, bitumen and road paving. Jongeneelen (Citation2014) recommended adjusting urinary 1-OHP levels when the PyrT/BaP ratio lies in the 1.5–4.5 range and not adjusting otherwise. All sectors were noted to exhibit values outside this range, with between 0 and 55% of the ratios within this range. In contrast to what Jongeneelen (Citation2014) recommended, it is postulated that urinary 1-OHP levels needs to be adjusted, regardless of the PyrT/BaP ratio, as long as BaP levels are detectable (>limit of quantification) for accurate calculation.
Given the variability of PyrT/BaP ratios, a single PyrT/BaP value cannot apply to all workplaces. It also raises the question of the relevance of defining an indicative BGV for 1-OHP in sectors where the PyrT/BaP ratio variability is high. It may be possible for creosote application, coke production, silicon carbide production, aluminum production, and waste management since the PyrT/BaP ratio variability was relatively low (GSD <3). It seems better to focus on the most descriptive occupational context possible since the variability of PyrT/BaP ratios was the smallest for activities. However, for some sectors, the use of additional levels of description of the occupational context might be necessary because the variability of the PyrT/BaP ratio remained high, in particular for specific activities involved in combustion processes, engine exhaust emissions, and the manufacturing of carbon products. These additional levels of description might be based upon the country, time period, presence or absence of collective protection measures, or on a more accurate description (subdivision) of the working tasks (Petit et al. Citation2017).
Alternatively, the use of BaP biomonitoring data may also be relevant to precisely assess internal exposures to carcinogenic BaP and related adverse health risks. However, the main BaP metabolite (3-OHBaP) is generally found at low concentrations in urine (below 1 ng/L), making it challenging to accurately measure it (Barbeau, Maître, and Marques Citation2011, Citation2015). Barbeau et al (Citation2018). also identified another promising biomarker, namely trans-anti-7,8,9,10-tetrahydroxy-7,8,9,10-tetrahydrobenzo[a]pyrene (TetraolBaP), reflecting the carcinogenic pathway of BaP metabolism. Both biomarkers request either sophisticated pre-analytical (automated solid-phase extraction) or analytical methods (mass tandem spectrometry), precluding their systematic use in occupational settings.
Recently, several investigators questioned the relevance of 1-OHP for PAH HBM and suggested using a combination of several metabolites instead of 1-OHP alone for more comprehensively assessing PAH exposure across multiple sources (Barros, Oliveira, and Morais Citation2023; Oliveira et al. Citation2016; Paiva et al. Citation2024). However, there is not yet a consensus regarding which PAH metabolites to include for this new proposed strategy, which also does not take into account any BaP metabolites resulting from the toxification pathway of BaP metabolism, such as TetraolBaP. In addition, to our knowledge, no guidelines exist for interpreting this new strategy, and there is no BGV based upon the combination of multiple PAH metabolites to date. Consequently, it is advocated for continuous use of urinary 1-OHP adjusted by airborne PyrT/BaP for PAH HBM until a more reliable biomarker that better captures and reflects carcinogenic exposure to PAHs is found. Using dedicated 1-OHP BGVs based upon specific PyrT/BaP ratios may indirectly help to identify exposures that may result in genotoxic effects and thus help to prevent cancer risks.
Limitations of this work
While a comprehensive literature search was conducted, the search was not exhaustive or completely systematic. Indeed, the literature search was conducted using only one source (PubMed). To conduct a more comprehensive and systematic work, other bibliographic databases such as Web of Science, Scopus, Google Scholar or Dimensions may have been used.
Because the analyzed data were heterogeneous, an empirical approach needed to be applied to select PyrT/BaP ratios using different statistics, which is far from optimal and limits the comparability of PyrT/BaP ratios. Ideally, it would have been best to randomly generate ratios using distribution parameters, which it was possible to do for only 37% of published samples. Findings therefore need to be considered with caution.
PAH HBM tool
The created PAH HBM tool may be used as a job exposure matrix for PyrT/BaP ratios. It is not a classical job exposure matrix because it describes activities within processes and sectors instead of job titles. Hence, it is more of a task- or activity-specific exposure matrix. This tool also enables the user to calculate an indicative BGV based upon the recommendations of ACGIH and a defined exposure scenario, as well as the probability of exceeding this BGV. Hence, the PAH HBM tool might provide consistency and support direct comparisons between studies and countries to help in the establishment of appropriate safe PAH guidelines. Because of a lack of knowledge from occupational physicians regarding HBM in occupational settings due to the absence of BLV (Fréry and El Yamani Citation2020), the PAH HBM tool may be useful for educational and empowerment purposes (e.g., training courses for occupational physicians) and for promoting HBM regarding occupational exposure to PAHs.
Practical recommendations
Data reporting
This review highlights the need for harmonized data to ensure both comparability and reproducibility.
Hence, it is advocated for standardization of investigations to make published data more homogeneous in the future. To that end, the following recommendations are proposed for future PAH exposure studies:
A full description of the occupational context, with a detailed description of the tasks performed, duration of the tasks, the exposure routes, and the RPE worn.
A detailed description of the exposure/emission sources.
A detailed description of the chemicals analyzed along with their physical nature (e.g., particulate, gaseous form) and their names according to international nomenclatures (e.g., CAS number).
A full description of the sampling strategy, with a detailed description of the sampling technique (e.g., Teflon membrane filter for particulate PAHs), sampling time, sampling volume, and sampling flow rate.
A detailed description of the analytical technique(s) used to detect and quantify the chemicals (e.g., high-pressure liquid chromatography coupled with fluorescence detection following solvent extraction), along with the limits of detection/quantification.
The reporting of the number of samples along with the number of missing values and, if relevant, the technique used to account for missing data.
The reporting of quantitative data using the International System of Quantities.
The reporting of concentrations of all pollutants using the same statistics (e.g., geometric mean).
The reporting of all distribution parameters, with for instance both arithmetic mean and arithmetic standard deviation for normal distribution, GM and GSD for lognormal distribution, or lambda for Poisson distribution.
These data should also be accompanied by ancillary information that is relevant for an accurate exposure and risk assessment. These recommendations are not only valid for PAHs but can be applied to any pollutants when reporting data, regardless of the media considered.
Interpretation of 1-OHP urinary levels
Improving the interpretation of 1-OHP is of critical importance to better quantify PAH exposure and take into account the variability of PAH mixtures. By more accurately interpreting 1-OHP levels, high-risk groups with elevated PAH exposure, such as specific occupational groups (e.g., coke oven workers, firefighters), might be identified. The effectiveness of exposure reduction strategies (e.g., emission controls) might also be more precisely assessed over time. This would potentially enable targeted interventions and exposure reduction measures for these vulnerable groups. Improved 1-OHP interpretation might also facilitate early detection and prevention of PAH-related adverse health effects (e.g., genotoxic effects resulting from PAH exposure such as sister chromatid exchange, micronucleus aberrations, or chromosomal aberrations), ultimately contributing to a decrease in the incidence of these adverse health effects.
It is recommend using the PyrT/BaP ratio (and its associated 95% confidence interval) in the closest and most descriptive occupational context available (Table S2). However, for the sake of simplification, one might use only the median of the PyrT/BaP ratio instead of the distribution. To this end and in order to help 1-OHP interpretation, the following frame is proposed based upon the GSD of the PyrT/BaP ratio and industrial sector (see for sectors using products derived from coal tar pitch and petroleum, respectively). For sectors using products resulting from coal tar pitch, the recommended BGV might be employed at the sector level owing to the small variability of PyrT/BaP ratios, except for “manufacturing of carbon products,” for which it is recommended using the BGV at the process scale, and “foundries” at the activity scale. In industrial sectors using products derived from petroleum or petroleum coke, the recommended BGV need to be used at the activity scale owing to the much larger variability of PyrT/BaP ratios, with the exception of “waste management” and “silicon carbide production” (sector scale), “ink production,” “printing companies,” and “catering” (process scale). This study may help apply the ACGIH 1-OHP-adjusted BGV that has been so challenging to comply with until now, owing to the regular absence of available PyrT/BaP ratios in field studies. The PAH HBM tool could facilitate the systematic use of PyrT/BaP ratios in occupational settings by automatically calculating the BGV according to the occupational context and other parameters/information specified by the user.
Figure 6. BGV recommendation for sectors using products derived from coal.
Figure 7. BGV recommendation for sectors using products derived from petroleum.
Future perspectives
BaP may not be the only appropriate indicator of exposure to PAHs (Aquilina and Harrison Citation2023; Louro et al. Citation2022), even though it is often used as a marker for airborne PAH exposure, in particular for cancer risk assessment (Aquilina and Harrison Citation2023; Louro et al. Citation2022). The BaP toxic equivalent concentration (BaPeq) is also used to try to take into account total carcinogenic potency arising from the whole PAH mixture (Aquilina and Harrison Citation2023). In this approach, the concentration of a given carcinogenic congener is expressed as a BaP equivalent concentration using a toxic equivalent factor (TEF) that utilizes BaP as a reference compound to adjust its original concentration depending upon toxicity differences between both congeners (Haber et al. Citation2022). BaPeq corresponds to the sum of the BaP level and of all congener BaP equivalent concentrations. One possible perspective from this investigation might be to collect BaPeq from published literature and calculate PyrT/BaPeq ratios. However, depending upon the study, the TEFs and PAHs used for the calculation of BaPeq vary highly (Aquilina and Harrison Citation2023; Dreij et al. Citation2017; Jarvis et al. Citation2014; Maître et al. Citation2018; Samburova, Zielinska, and Khlystov Citation2017). In addition, the use of TEFs is highly debated (Aquilina and Harrison Citation2023; Haber et al. Citation2022), and utilization of BaPeq which assumes additivity of PAH congener toxicities is seldom reported in experimental studies (El Hajjar et al. Citation2023; Genies et al. Citation2016; Jarvis et al. Citation2014). Alternative solutions might be considered, such as the use of mixture exposure functions (Aquilina and Harrison Citation2023).
Urinary 1-OHP is hardly influenced by confounding factors, such as smoking and other environmental sources (Persoons et al. Citation2020). Biomonitoring results are correlated with airborne levels of parent PAHs when no respiratory protection (RPE) is worn by workers (Louro et al. Citation2022; Unwin et al. Citation2006). RPE efficiency is highly variable and depends mostly upon how these are used, stored, and replaced by the workers (Chen, Yang, and Lin Citation2012). To take into account the efficiency of RPE worn by workers, airborne PAH levels used to calculate PyrT/BaP ratios may be weighted by an assigned protection factor (Crawford et al. Citation2014; Unwin et al. Citation2006; Valière et al. Citation2022). The possibility of taking RPE into account has been implemented in the PAH HBM tool, with a table listing the assigned protection factors of 80 RPEs found in the literature for several countries.
In some occupational settings, PAHs may be absorbed through the skin (Louro et al. Citation2022; Valière et al. Citation2022). When skin exposure occurs, the use of airborne PyrT/BaP ratios may not be relevant or enough to properly interpret urinary 1-OHP levels (Valière et al. Citation2022). Thus, alternative solutions are required, such as the use of dermal PyrT/BaP ratios or a combination of both airborne and dermal PyrT/BaP ratios, as well as regular use of biomonitoring.
With the growing use of job exposure matrices for the assessment of occupational exposures, the ability to translate a set of coded occupations and industries into other systems becomes critical (Rémen et al. Citation2018). Therefore, a perspective from this investigation might be to add international coding systems to the PAH HBM tool to facilitate its use.
Conclusion
Given the complexity of industrial emissions and high variability of PAHs content, the inventory of PyrT/BaP ratios according to industrial activities is assumed to be a useful resource for occupational physicians and industrial hygienists to help their interpretation of PAH biomonitoring studies based upon urinary 1-OHP. The current investigation summarizes 40 years of data from almost 20 countries and presents the diversity and evolution of PAH emissions. A user-friendly frame for 1-OHP BGV was proposed as well as a HBM interpretation tool. The inventory and its website remain open for new entries, and a more global coverage might certainly be preferable to support the broader objectives to support PAH human health risk assessment, which might help promote collaborative and harmonized research in this area. Our presented review offers a practical approach for systematic PAH exposure and risk assessment, with a simple frame to follow based upon occupational context and the most frequently used biomonitoring approach (1-OHP monitoring).
Author contributions
Adrien Clauzel: Methodology, Software, Formal analysis, Investigation, Data Curation, Writing – Original Draft, Visualization. Renaud Persoons: Conceptualization, Methodology, Validation, Investigation, Data Curation, Writing – Review & Editing. Anne Maître: Conceptualization, Methodology, Validation, Formal analysis, Investigation, Data Curation, Writing – Review & Editing, Supervision, Project administration. Franck Balducci: Data Curation, Formal analysis, Writing – Review & Editing. Pascal Petit: Conceptualization, Methodology, Software, Validation, Formal analysis, Investigation, Data Curation, Writing – Original Draft, Writing – Review & Editing, Visualization, Supervision, Project administration.
Supplemental Material
Download Zip (10.6 MB)Acknowledgments
The authors would like to thank Sylvette Liaudy for her help regarding the bibliographic references. The authors would also like to thank Simon Pervier and Tiansi Laranjeira for their help deploying the PAH HBM tool online, as well as TIMC Lab (UMR 5525 CNRS UGA) and Université Grenoble Alpes for hosting the PAH HBM tool.
Disclosure statement
No potential conflict of interest was reported by the author(s).
Data availability statement
The data that supports the findings of this study is openly available on the PAH HBM tool at https://exporisk-timc.imag.fr/PAH/. Further information is available from the corresponding author upon request.
Supplementary material
Supplemental data for this article can be accessed online at https://doi.org/10.1080/10937404.2024.2362632.
Additional information
Funding
References
- Allard, B., M. Tawfik, and A. Kumar. 2016. “Performances of Green and Eco-Friendly Ramming Astes in EGA Pots.” Metals 6 (5): 112. https://doi.org/10.3390/met6050112.
- American Conference of Governmental Industrial Hygienists (ACGIH). 2020. “Polycyclic Aromatic Hydrocarbons (PAHs). Update 2017.” Documentation of the TLVs and BEIs with Worldwide Occupational Exposure Values, 7th ed. Cincinnati (USA): ACGIH.
- Aquilina, J., and R. M. Harrison. 2023. “Evaluation of the Cancer Risk from PAHs by Inhalation: Are Current Methods Fit for Purpose?” Environment International 177:107991. https://doi.org/10.1016/j.envint.2023.107991.
- Barbeau, D., S. Lutier, V. Bonneterre, R. Persoons, M. Marques. 2015. “Occupational Exposure to Polycyclic Aromatic Hydrocarbons: Relations Between Atmospheric Mixtures, Urinary Metabolites and Sampling Times.” International Archives of Occupational and Environmental Health 88 (8): 1119–1129. https://doi.org/10.1007/s00420-015-1042-1.
- Barbeau, D., S. Lutier, L. Choisnard, M. Marques, R. Persoons, and A. Maitre. 2018. “Urinary Trans-Anti-7,8,9,10-Tetrahydroxy-7,8,9,10-Tetrahydrobenzo(a)pyrene as the Most Relevant Biomarker for Assessing Carcinogenic Polycyclic Aromatic Hydrocarbons Exposure.” Environment International 112:147–155. https://doi.org/10.1016/j.envint.2017.12.012.
- Barbeau, D., A. Maître, and M. Marques. 2011. “Highly Sensitive Routine Method for Urinary 3-Hydroxybenzo[a]pyrene Quantitation Using Liquid Chromatography-Fluorescence Detection and Automated Off-Line Solid Phase Extraction.” Analyst 136 (6): 1183–1191. https://doi.org/10.1039/c0an00428f.
- Barbosa, F., B. A. Rocha, M. C. O. Souza, M. Z. Bocato, L. F. Azevedo, J. A. Adeyemi, A. Santana, and A. D. Campiglia. 2023. “Polycyclic Aromatic Hydrocarbons (PAHs): Updated Aspects of Their Determination, Kinetics in the Human Body, and Toxicity.” Journal of Toxicology and Environmental Health, Part B 26 (1): 28–65. https://doi.org/10.1080/10937404.2022.2164390.
- Barros, B., M. Oliveira, and S. Morais. 2023. “Biomonitoring of Firefighting Forces: Areview on Biomarkers of Exposure to Health-Relevant Pollutants Released from Fires.” Journal of Toxicology and Environmental Health, Part B 26 (3): 127–171. https://doi.org/10.1080/10937404.2023.2172119.
- Bjorseth, A., O. Bjorseth, and P. E. Fjeldstad. 1981. “Polycyclic Aromatic Hydrocarbons in the Work Atmosphere – Determination of Area-Specific Concentrations and Job-Specific Exposure in a Vertical Pin Søderberg Aluminum Plant.” Scandinavian Journal of Work Environment & Health 7 (3): 223–232. https://doi.org/10.5271/sjweh.3115.
- Burdorf, A., and M. van Tongeren. 2003. “Commentary: Variability in Workplace Exposures and the Design of Efficient Measurement and Control Strategies.” The Annals of Occupational Hygiene 47 (2): 95–99. https://doi.org/10.1093/annhyg/meg021.
- Cattley, R. C., H. Kromhout, M. Sun, E. J. Tokar, M. A.-E. Abdallah, A. K. Bauer, K. R. Broadwater. 2023. “Carcinogenicity of Anthracene, 2-Bromopropane, Butyl Methacrylate, and Dimethyl Hydrogen Phosphite.” The Lancet Oncology 24 (5): 431–432. https://doi.org/10.1016/S1470-2045(23)00141-9.
- Cavallari, J. M., L. V. Osborn, J. E. Snawder, A. J. Kriech, L. D. Olsen, R. F. Herrick, M. D. Mcclean. 2012. “Predictors of Airborne Exposures to Polycyclic Aromatic Compounds and Total Organic Matter Among Hot-Mix Asphalt Paving Workers and Influence of Work Conditions and Practices.” The Annals of Occupational Hygiene 56 (2): 138–147. https://doi.org/10.1093/annhyg/mer088.
- Chen, H. L., C. H. Yang, and M. H. Lin. 2012. “Removal Efficiency of Vapour/Particulate Phase PAHs by Using Alternative Protective Respirators in PAHs Exposure Workers.” Journal of Hazardous Materials 219–220:190–195. https://doi.org/10.1016/j.jhazmat.2012.03.078.
- Cherry, N., N. Broznitsky, M. Fedun, D. Kinniburgh, M. Shum, S. Tiu, T. Zadunayski. 2023. “Exposures to Polycyclic Aromatic Hydrocarbons and Their Mitigation in Wildland Firefighters in Two Canadian Provinces.” Annals of Work Exposures and Health 67 (3): 354–365. https://doi.org/10.1093/annweh/wxac085.
- Crawford, J. O., K. Dixon, B. G. Miller, and J. W. Cherrie. 2014. “A Review of the Effectiveness of Respirators in Reducing Exposure to Polycyclic Aromatic Hydrocarbons for Coke Oven Workers.” The Annals of Occupational Hygiene 58 (8): 943–954. https://doi.org/10.1093/annhyg/meu048.
- Creely, K. S., H. Cowie, M. van Tongeren, H. Kromhout, J. Tickner, and J. W. Cherrie. 2007. “Trends in Inhalation Exposure--A Review of the Data in the Published Scientific Literature.” The Annals of Occupational Hygiene 51 (8): 665–678. https://doi.org/10.1093/annhyg/mem050.
- Dreij, K., A. Mattsson, I. W. H. Jarvis, H. Lim, J. Hurkmans, J. Gustafsson, C. Bergvall. 2017. “Cancer Risk Assessment of Airborne PAHs Based on in vitro Mixture Potency Factors.” Environmental Science & Technology 51 (15): 8805–8814. https://doi.org/10.1021/acs.est.7b02963.
- El Hajjar, M., A. Maître, M. Marques, R. Persoons, and C. Demeilliers. 2023. “Metabolism of Benzo[a]pyrene After Low-Dose Subchronic Exposure to an Industrial Mixture of Carcinogenic Polycyclic Aromatic Hydrocarbons in Rats: A Cocktail Effect Study.” Archives of Toxicology 97 (3): 865–874. https://doi.org/10.1007/s00204-023-03441-3.
- European Chemicals Agency. 2022, December 1. “Committee for Risk Assessment. RAC. Opinion on Scientific Evaluation of Occupational Exposure Limits for Polycyclic Aromatic Hydrocarbons. ECHA/RAC/OEL-O-0000007198-66-01/F. Accessed May 17, 2024. https://echa.europa.eu/documents/10162/06454dd9-cadc-acef-a11b-439f2a0d8efa.
- Fréry, N., and M. El Yamani. 2020. “Risques chimiques en entreprise et Biosurveillance des expositions professionnelles. Enquête sur les pratiques de biosurveillance des expositions professionnelles en France. Action 1.10 du 3e Plan santé travail.” Santé publique France. 59 p. [in French].
- Genies, C., A. Jullien, E. Lefebvre, M. Revol, A. Maître, and T. Douki. 2016. “Inhibition of the Formation of Benzo[a]pyrene Adducts to DNA in A549 Lung Cells Exposed to Mixtures of Polycyclic Aromatic Hydrocarbons.” Toxicology in Vitro: An International Journal Published in Association with BIBRA 35:1–10. https://doi.org/10.1016/j.tiv.2016.05.006.
- Germin-Aizac, J., A. Maitre, F. Balducci, S. Montlevier, M. Marques, J. Tribouiller, C. Demeilliers. 2023. “Bitumen Fumes and PAHs in Asphalt Road Paving: Emission Characteristics, Determinants of Exposure and Environmental Impact.” Environmental Research 228:115824. https://doi.org/10.1016/j.envres.2023.115824.
- Haber, L. T., A. M. Pecquet, M. J. Vincent, and L. M. White. 2022. “The Long Goodbye: Finally Moving on from the Relative Potency Approach to a Mixtures Approach for Polycyclic Aromatic Hydrocarbons (PAHs).” International Journal of Environmental Research Public Health 19 (15): 9490. https://doi.org/10.3390/ijerph19159490.
- Health and Safety Executive. 2024. “Biological Monitoring Guidance Values.” Accessed April 10, 2024. https://www.hsl.gov.uk/online-ordering/analytical-services-and-assays/biological-monitoring/bm-guidance-values.
- Hopf, N. B., T. Carreón, and G. Talaska. 2009. “Biological Markers of Carcinogenic Exposure in the Aluminum Smelter Industry—A Systematic Review.” Journal of Occupational and Environmental Hygiene 6 (9): 562–581. https://doi.org/10.1080/15459620903094810.
- Ifegwu, O. C., and C. Anyakora. 2016. “Polycyclic Aromatic Hydrocarbons: Part II, Urine Markers.” Advances in Clinical Chemistry 75:159–183. https://doi.org/10.1016/bs.acc.2016.03.001.
- International Agency for Research on Cancer. 2024. “List of Classifications. Agents Classified by the IARC Monographs, Volumes 1–135.” Accessed May 17, 2024. https://monographs.iarc.who.int/list-of-classifications.
- Jarvis, I. W. H., K. Dreij, A. Mattsson, B. Jernstrom, and U. Stenius. 2014. “Interactions Between Polycyclic Aromatic Hydrocarbons in Complex Mixtures and Implications for Cancer Risk Assessment.” Toxicology 321:27–39. https://doi.org/10.1016/j.tox.2014.03.012.
- Jeng, H. A., and C. H. Pan. 2014. “1-Hydroxypyrene as a Biomarker for Rnvironmental Health.” In General Methods in Biomarker Research and Their Applications, edited by V. Preedy, and V. Patel. Dordrecht: Springer. https://doi.org/10.1007/978-94-007-7740-8_49-1.
- Jongeneelen, F. J. 2014. “A Guidance Value of 1-Hydroxypyrene in Urine in View of Acceptable Occupational Exposure to Polycyclic Aromatic Hydrocarbons.” Toxicology Letters 231 (2): 239–248. https://doi.org/10.1016/j.toxlet.2014.05.001.
- Koeman, T., N. S. M. Offermans, Y. Christopher-de Vries, P. Slottje, P. A. van Den Brandt, R. A. Goldbohm, H. Kromhout, and R. Vermeulen. 2013. “JEMs and Incompatible Occupational Coding Systems: Effect of Manual and Automatic Recoding of Job Codes on Exposure Assignment.” The Annals of Occupational Hygiene 57 (1): 107–114. https://doi.org/10.1093/annhyg/mes046.
- Koh, D. H., T. W. Kim, S. H. Jang, H. W. Ryu, and D. Park. 2015. “Comparison of Grouping Schemes for Exposure to Total Dust in Cement Factories in Korea.” The Annals of Occupational Hygiene 59:853–861. https://doi.org/10.1093/annhyg/mev033.
- Lee, D. G., J. Lavoue, J. J. Spinelli, and I. Burstyn. 2015. “Statistical Modeling of Occupational Exposure to Polycyclic Aromatic Hydrocarbons Using OSHA Data.” Journal of Occupational and Environmental Hygiene 12 (10): 729–742. https://doi.org/10.1080/15459624.2015.1043049.
- Lippmann, M., M. R. Gomez, and G. M. Rawls. 1996. “ACGIH-AIHATask Group: Data Elements for Occupational Exposure Databases: Guidelines and Recommendations for Airborne Hazards and Noise. Special Report.” Applied Occupational and Environmental Hygiene 11:1294–1311. https://doi.org/10.1080/1047322X.1996.10389417.
- Loomis, D., and H. Kromhout. 2004. “Exposure Variability: Concepts and Applications in Occupational Epidemiology.” American Journal of Industrial Medicine 45 (1): 113–122. https://doi.org/10.1002/ajim.10324.
- Louro, H., B. C. Gomes, A. T. Saber, A. L. Iamiceli, T. Göen, K. Jones, A. Katsonouri. 2022. “The Use of Human Biomonitoring to Assess Occupational Exposure to PAHs in Europe: A Comprehensive Review.” Toxics 10 (8): 480. https://doi.org/10.3390/toxics10080480.
- Maître, A., P. Petit, M. Marques, C. Hervé, S. Montlevier, R. Persoons, and D. J. Bicout. 2018. “Exporisq-HAP Database: 20 Years of Monitoring French Occupational Exposure to Polycyclic Aromatic Hydrocarbon Mixtures and Identification of Exposure Determinants.” International Journal of Hygiene and Environmental Health 221 (2): 334–346. https://doi.org/10.1016/j.ijheh.2017.12.008.
- Mallah, M. A., L. Changxing, M. A. Mallah, S. Noreen, Y. Liu, M. Saeed, H. Xi. 2022. “Polycyclic Aromatic Hydrocarbon and Its Effects on Human Health: An Overeview.” Chemosphere 296:133948. https://doi.org/10.1016/j.chemosphere.2022.133948.
- Mannetje, A., and H. Kromhout. 2003. “The Use of Occupation and Industry Classifications in General Population Studies.” International Journal of Epidemiology 32 (3): 419–428. https://doi.org/10.1093/ije/dyg080.
- Marquart, H., T. Schneider, H. Goede, M. Tischer, J. Schinkel, N. Warren, W. Fransman, S. Spaan, M. van Tongeren, H. Kromhout. 2011. “Classification of Occupational Activities for Assessment of Inhalation Exposure.” The Annals of Occupational Hygiene 55 (9): 989–1005. https://doi.org/10.1093/annhyg/mer072.
- Oliveira, M., K. Slezakova, M. J. Alves, A. Fernandes, J. P. Teixeira, C. Delerue-Matos, M. D. C. Pereira, et al. 2016. “Firefighters’ Exposure Biomonitoring: Impact of Firefighting Activities on Levels of Urinary Monohydroxyl Metabolites.” International Journal of Hygiene and Environmental Health 219 (8): 857–866. https://doi.org/10.1016/j.ijheh.2016.07.011.
- Paiva, A. M., B. Barros, M. Oliveira, S. Alves, F. Esteves, A. Fernandes, J. Vaz. 2024. “Biomonitoring of Polycyclic Aromatic Hydrocarbons Exposure and Short-Time Health Effects in Wildland Firefighters During Real-Life Fire Events.” Science of the Total Environment 926:171801. https://doi.org/10.1016/j.scitotenv.2024.171801.
- Patel, M. D., K. M. Rose, C. R. Owens, H. Bang, and J. S. Kaufman. 2012. “Performance of Automated and Manual Coding Systems for Occupational Data: A Case Study of Historical Records.” American Journal of Industrial Medicine 55 (3): 228–231. https://doi.org/10.1002/ajim.22005.
- Persoons, R., L. Roseau, P. Petit, C. Hograindleur, S. Montlevier, M. Marques, G. Ottoni. 2020. “Towards a Recommended Biomonitoring Strategy for Assessing the Occupational Exposure of Roofers to PAHs.” Toxicology Letters 324:54–64. https://doi.org/10.1016/j.toxlet.2020.01.025.
- Petit, P. 2022. “Toxicological and Exposure Database Inventory: A Review.” International Journal of Hygiene and Environmental Health 246:114055. https://doi.org/10.1016/j.ijheh.2022.114055.
- Petit, P., D. J. Bicout, R. Persoons, V. Bonneterre, D. Barbeau, and A. Maître. 2017. “Constructing a Database of Similar Exposure Groups: The Application of the Exporisq-HAP Database from 1995 to 2015.” Annals of Work Exposures and Health 61 (4): 440–456. https://doi.org/10.1093/annweh/wxx017.
- Rappaport, S. M. 1991. “Assessment of Long-Term Exposures to Toxic Substances in Air.” The Annals of Occupational Hygiene 35 (1): 61–121. https://doi.org/10.1093/annhyg/35.1.61.
- Rémen, T., L. Richardson, C. Pilorget, G. Palmer, J. Siemiatycki, and J. Lavoué. 2018. “Development of a Coding and Crosswalk Tool for Occupations and Industries.” Annals of Work Exposures and Health 62 (7): 796–807. https://doi.org/10.1093/annweh/wxy052.
- Rögner, N., H. W. Hagedorn, G. Scherer, M. Sherer, and N. Pluym. 2021. “A Sensitive LC–MS/MS Method for the Quantification of 3-Hydroxybenzo[a]pyrene in Urine-Exposure Assessment in Smokers and Users of Potentially Reduced-Risk Products.” Separations 8 (10): 171. https://doi.org/10.3390/separations8100171.
- Russ, D. E., K. Y. Ho, C. A. Johnson, and M. C. Friesen. 2014. “Computer-Based Coding of Occupation Codes for Epidemiological Analyses.” Proceedings IEEE International Symposium on Computer-Based Medical Systems 2014:347–350. https://doi.org/10.1109/CBMS.2014.79.
- Samburova, V., B. Zielinska, and A. Khlystov. 2017. “Do 16 Polycyclic Aromatic Hydrocarbons Represent PAH Air Toxicity?” Toxics 5 (3): E17. https://doi.org/10.3390/toxics5030017.
- Scientific Committee on Occupational Exposure Limits. 2016. “SCOEL/REC/404, Polycyclic Aromatic Hydrocarbon Mixtures Containing Benzo[a]pyrene (PAH).” Recommendation from the Scientific Committee on Occupational Exposure Limits. Brussels: European Union. https://doi.org/10.2767/97750.
- Symanski, E., S. Maberti, and W. Chan. 2006. “A Meta-Analytic Approach for Characterizing the Within-Worker and Between-Worker Sources of Variation in Occupational Exposure.” The Annals of Occupational Hygiene 50 (4): 343–357. https://doi.org/10.1093/annhyg/mel006.
- Taeger, D., S. Koslitz, H. U. Käfferlein, T. Pelzl, B. Heinrich, D. Breuer, T. Weiss. 2023. “Exposure to Polycyclic Aromatic Hydrocarbons Assessed by Biomonitoring of Firefighters During Fire Operations in Germany.” International Journal of Hygiene and Environmental Health 248:114110. https://doi.org/10.1016/j.ijheh.2023.114110.
- Unwin, J., J. Cocker, E. Scobbie, and H. Chambers. 2006. “An Assessment of Occupational Exposure to Polycyclic Aromatic Hydrocarbons in the UK.” The Annals of Occupational Hygiene 50 (4): 395–403. https://doi.org/10.1093/annhyg/mel010.
- Valière, M., P. Petit, R. Persoons, C. Demeilliers, and A. Maître. 2022. “Consistency Between Air and Biological Monitoring for Assessing Polycyclic Aromatic Hydrocarbon Exposure and Cancer Risk of Workers.” Environmental Research 207:112268. https://doi.org/10.1016/j.envres.2021.112268.
- Wallace, M. A. G., J. D. Pleil, K. D. Oliver, D. A. Whitaker, S. Mentese, K. W. Fent, and G. P. Horn. 2019. “Non-Targeted GC/MS Analysis of Exhaled Breath Samples: Exploring Human Biomarkers of Exogenous Exposure and Endogenous Response from Professional Firefighting Activity.” Journal of Toxicology and Environmental Health Part A 82 (4): 244–260. https://doi.org/10.1080/15287394.2019.1587901.
- Zhang, X., L. Yang, H. Zhang, W. Xing, Y. Wang, P. Bai, L. Zhang. 2021. “Assessing Approaches of Human Inhalation Exposure to Polycyclic Aromatic Hydrocarbons: A Review.” International Journal of Environmental Research and Public Health 18 (6): 3124. https://doi.org/10.3390/ijerph18063124.