
ABSTRACT
The intense competition amongst travel apps, regardless of their popularity, has made repurchase intention a critical financial challenge for travel providers. By combining the Stimulus-Organism-Response (S-O-R) framework and the New Economic Geography (NEG) theory, this research examined how city tier disparities influence the experiential features of travel apps and user repurchase intentions. Survey data was acquired from 739 travel app users in China. The findings indicate that a set of context-based experiential features significantly influences utilitarian and hedonic values, and consequently leading to a notable increase in repurchase intentions. In addition, the outcomes of a multigroup analysis revealed that China’s users located in tier 1 city (i.e. Beijing) and tier 3 city (i.e. Kunming) had distinct effects on the hypothesised relationships. Theoretically, the research provides extensive implications to information systems and tourism literatures; whilst offering some actionable insights to travel practitioners.
Background
In 2022, travel app downloads worldwide reached 2,308.2 million users, marking a significant increase from the 1,320.2 million users recorded in 2020 (Statista, Citation2022a). This trend is mainly driven by tourists’ demand for a “seamless travel experience” (Lim et al., Citation2022) and is attributed to post-pandemic “revenge travel spending” behaviour. In China, Statista (Citation2022d) reported that over 80% of Chinese tourists purchased travel services through travel apps, underscoring the crucial role these apps play in the tourist purchasing journey. Considering the high demand from users, it is essential for travel practitioners to leverage travel apps to establish sustainable competitive advantages (İlkan et al., Citation2023).
It is important to note that the popularity of travel apps does not necessarily lead to repurchase intentions, which are vital for future financial sustainability for both app developers and practitioners (Jang et al., Citation2018). For instance, as reported by The Star in Citation2017, 88% of tourists would switch travel apps if their current one failed to meet their demands. Similarly, global data from Statista (Citation2021c) revealed that the average annual retention rate for travel apps was only 31%. These statistics underscore the challenge of retaining travel app users and stimulating further purchase intentions. This is particularly crucial given that users from different geographical regions and economic backgrounds may have varying demands and expectations when using travel apps.
Several empirical research studies agree that users from different city tiers in China may result in different perceptions when using travel apps (Bilby et al., Citation2016; Shin et al., Citation2021). Although most cities in China have a similar urban form in terms of infrastructure and land use (Ding et al., Citation2022), a significant discrepancy in economic development, personal income, and living standards is present (Crane et al., Citation2018; Mitra et al., Citation2022). Especially, significant differences exist in terms of gross domestic product (GDP), real per capita incomes, and household income between cities in the higher and lower tiers (Statista, Citation2022c; Zhao & Wan, Citation2021). For example, Beijing's GDP in 2021 (RMB 4,027 billion) is approximately fifty-five times that of Lhasa (RMB 74.2 billion), the poorest provincial capital city (Statista, Citation2022b). The substantial economic inequality among different city tiers has intensified disparities in social, economic, and spatial characteristics (Bilby et al., Citation2020; Zhao & Wan, Citation2021), leading to diverse lifestyles and consumption patterns (Zeljković, Citation2022). These variations are also reflected in technology usage. For instance, users in higher-tier cities, characterised by higher income levels and more advanced technology, have greater expectations and purchasing power when using travel apps compared to those in lower-tier cities. Consequently, it is prudent for travel providers to develop tailored strategies for travel apps that cater to the distinct needs of users from various geographical locations, such as different city tiers in China.
From a scholarly perspective, it has been documented that users typically assess the value of travel apps by considering the features that hold the greatest importance to them (Schiffman & Wisenblit, Citation2019). To enhance user experience and encourage repeat purchases, travel providers can benefit from understanding the “value systems” of travel app users. In tourism, simply providing utilitarian value is no longer sufficient, in light of the fact that hedonic values have increased in importance (Gretzel et al., Citation2020). For example, when using the travel app, utilitarian and hedonic values are appropriate for describing convenience, travel options, and the enjoyment of browsing tips and photos. Also, in the recent competitive era, it is becoming more important to carefully consider whether the values are relevant based on the context (Pandža Bajs, Citation2015). Accordingly, two research questions that underpin this research are:
Q1. What context-based experiential features motivate user value perception (i.e. utilitarian and hedonic value) and in-app repurchase intentions?
Q2. Do different city tiers (low vs. high) impact significantly the decision-making process?
This research offers two significant contributions. First, by applying the S-O-R framework, it demonstrates how an app's stimulus factors influence user emotional states and behaviours. This provides valuable insights into the expectations that users prioritise when using travel apps and how these expectations interact with perceptions, ultimately affecting behaviour. Second, this research expands the application of NEG theory within the context of tourism apps. By utilising this theory to explain significant differences in tourism app usage, the findings contribute to the existing literature by highlighting the importance of considering regional economic disparities when exploring technology usage on a broader scale. Practically, these findings are crucial for local and global system developers to tailor their digital strategies to local economic and cultural specifics, thereby enhancing sustainable usage. Furthermore, with this information, tourism providers can redesign marketing strategies within tourism apps, especially when targeting users from diverse geographical locations, both locally and internationally.
Literature review
Holistic view of travel app literature
To provide a comprehensive overview of the existing literature on current topics, a systematic literature review was conducted using the guideline of Preferred Reporting Items for Systematic Reviews and Meta-Analysis (PRISMA) (Julien et al., Citation2011; Moher et al., Citation2009; Petticrew & Roberts, Citation2006). The search term “TITLE-ABS-KEY (“travel app*”)” was used to retrieve articles from the Web of Science and Scopus databases, with the subsequent criteria: subject areas in social sciences, business, management, tourism, and hospitality, empirical journal articles, and English language. presents the results of the literature review, whereas illustrates the review procedure.
Figure 1. PRISMA flow diagram.
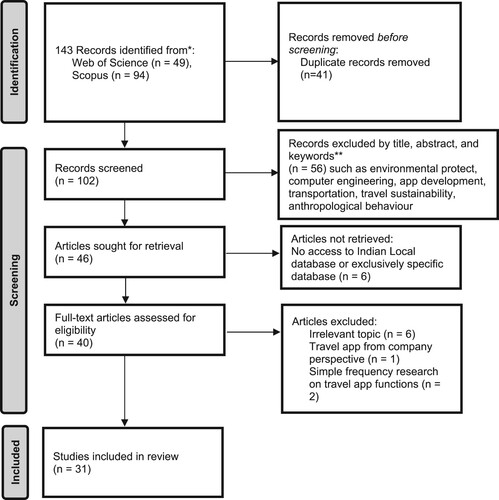
Table 1. Systematic summary of research on travel apps attributes and varied intentions (empirical studies).
According to the review, although research on travel apps has been emerging in recent years, many researchers have focused on adoption intentions, such as travel app usage intentions (Fakfare & Manosuthi, Citation2022; Tak & Gupta, Citation2021), and continued use intentions (Liu et al., Citation2023; Zhou et al., Citation2022). Few, however, extended the adoption to purchase intentions or even repurchase intentions (), which financially supports travel providers in maintaining successful operations in the future (Jang et al., Citation2018). In addition, assuming homogeneity of travel app users offers insufficient insights for both practitioners and researchers. Research has shown that there are significant differences in economic development and disposable income among people living in different city tiers (Crane et al., Citation2018; Zhang et al., Citation2020). According to Bilby et al. (Citation2016) and Shukla and Rosendo-Rios (Citation2021), individuals located in higher-tier cities prefer more sophisticated and non-functional features (e.g. personalisation), while those in lower-tier cities prioritise functional features (e.g. information quality) compared to hedonic features. These differing priorities may be explained by the disparity in income levels and consumption cultures (Singh et al., Citation2023; Yin et al., Citation2023). To the best of the authors’ knowledge, there has been no comparative research on the attitudes and perceptions of travel app users in different tiers of Chinese cities (), regardless of the potential effects of city tier disparities (e.g. Bilby et al., Citation2020; Huang & Wei, Citation2018; Shukla & Rosendo-Rios, Citation2021).
Stimulus-Organism-Response (S-O-R) framework
Mehrabian and Russell’s (Citation1974) S-O-R framework is one of the most popular theories to explain the impact of atmospheric factors on human behaviour (Cheah et al., Citation2022). This theory explains the relationship between environmental factors (i.e. stimulus) and human behaviour outcomes (i.e. response) via internal processes (i.e. organism). In contrast to popular technology-related theories such as the technology acceptance theory (TAM) and the unified theory of the acceptance and application of technology (UTAUT), the S-O-R framework does not emphasise a particular set of factors (Mehrabian & Russell, Citation1974). Rather, the “stimulus” and “organism” can encompass a broad range of elements due to the theory's inclusiveness and flexibility (Lim et al., Citation2021), which make it particularly well-suited for exploratory research.
Prior research on technology-based tourism has frequently used the term “stimulus” to represent the features of travel technology, the quality of the information system, and online consumer reviews that significantly impact users’ internal states and behavioural intentions (Ali et al., Citation2021; Fang et al., Citation2017). The “organism” describes the internal states (cognitive and affective systems) between a stimulus and a person's response (Zhao & Liu, Citation2023). Recent tourism research has placed a greater emphasis on relationship marketing, where “relationship” relates to the psychological processes that contribute to service evaluations and behavioural intentions (Itani et al., Citation2019; Rather, Citation2020; Xiong et al., Citation2023). This shift has occurred because contemporary users are more informed, empowered, and place a greater emphasis on individuality (Claffey & Brady, Citation2015). In fact, value perception is often seen as a key indicator of relationship quality and behavioural intentions (Dabbous & Barakat, Citation2020; Fu et al., Citation2018; Itani et al., Citation2019). Finally, the “response” refers to the actions a person intends to take, influenced by environmental factors and internal thought processes. In this study, repurchase intentions are used as the measure of responses to better understand the behavioural tendencies of travel app users.
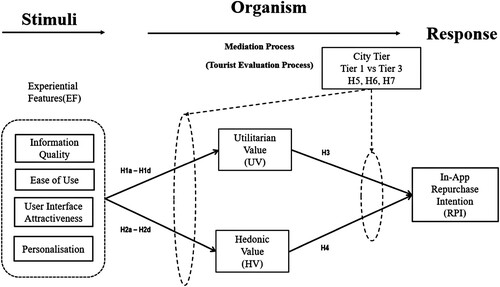
The S-O-R framework was applied to examine how key experiential features of travel apps, including information quality, ease of use, user interface attractiveness, and personalisation, affect users’ psychological and emotional states, subsequently influencing behaviours like repurchase intentions. Focusing on these features as stimuli is essential for dissecting the complex dynamics of user engagement and satisfaction across diverse city tiers. These particular features were chosen because they directly interact with users’ sensory and cognitive experiences, addressing immediate needs and enhancing overall interaction with apps. For example, well-presented information and straightforward functionality can decrease cognitive stress and improve user experience, while aesthetically pleasing interfaces and tailored content boost emotional engagement and loyalty. The emphasis on these features within the S-O-R framework acknowledges that initial interactions with app functionality significantly shape user attitudes and behaviours.
Repurchase intentions, which reflect the likelihood that a person will continue to buy a product or service, are crucial for the long-term success of travel apps, yet prior research has often focused only on initial adoption or continuous usage rather than on repurchasing behaviour (Lee et al., Citation2019; Vahdat et al., Citation2021). In the era of mobile dominance, in-app purchases integrated with e-wallets and online payment methods have become increasingly popular, offering the same products and services as traditional travel agencies but with added convenience and flexibility, potentially enhancing the experiential value for users (Dacko, Citation2017; Lim et al., Citation2022). Given that service quality and user experience are key determinants of travel app users’ behavioural intentions, there is a pressing need to focus research on understanding factors that drive repurchase intentions within travel apps, especially considering how consumers’ purchasing behaviours are evolving (Gretzel et al., Citation2015).
Then, mobile-based travel apps significantly shape user experiences and intentions, influencing interactions through critical features such as aesthetic quality, app content, and performance (Fakfare & Manosuthi, Citation2022; Fang et al., Citation2017; Tak & Gupta, Citation2021). Research by Fakfare, Promsivapallop, and Manosuthi (Citation2023) categorises these attributes into the five essential areas of convenience, security, application design, application privilege, and communication, each designed to enhance user satisfaction and app usability. These attributes collectively improve the travel app experience by addressing a wide range of user needs and expectations. Convenience focuses on streamlining navigation and transaction processes to enhance app usability, while security involves protecting personal and financial information through advanced measures like encryption. Application design combines aesthetic appeal with functional usability to boost engagement, and application privilege offers unique benefits like loyalty programs to increase user loyalty and satisfaction. Communication supports strong interactions between users and service providers, enhancing community feelings and reliability through features like real-time support and feedback.
Adjustments to these features have been tailored for the Chinese market based on prior studies (e.g. Ali et al., Citation2021; Sun et al., Citation2016; Tak & Gupta, Citation2021), resulting in a focus on the four key attributes of information quality, ease of use, user interface attractiveness, and personalisation. These were selected to align with the sophisticated demands of Chinese consumers, emphasising customised services and reliable information, while eliminating less critical features like adaptable booking capabilities due to minimal concerns over loading speeds and the evolving preferences for flexibility in travel planning (Benítez-Aurioles, Citation2018; Jeong & Shin, Citation2020; Kim et al., Citation2017). This streamlined approach aims to optimize user engagement and loyalty by adapting app functionalities to the specific needs and technological trends within the regional context.
Value perception in tourism, influenced by experiential features, is essential for developing quality relationships and behavioural responses, where utilitarian and hedonic values each play a specific role (e.g. Cheung et al., Citation2022; Choi et al., Citation2019; Itani et al., Citation2019; Oriade & Schofield, Citation2019). Utilitarian value focuses on practical aspects like price, quality, and convenience offered by travel apps, such as detailed travel guides and efficient online booking systems, which directly meet user needs and encourage continued engagement and purchases (Cheung et al., Citation2022; Moon et al., Citation2018; Pandža Bajs, Citation2015). Conversely, hedonic value emphasises the emotional and experiential aspects of app usage, enhancing user satisfaction through enjoyable interactions and aesthetically pleasing designs (Cham et al., Citation2022; Lv et al., Citation2022; Morosan, Citation2021). These emotional experiences foster loyalty and provide travel firms with a competitive advantage by developing deeper emotional ties between users and the app (Itani et al., Citation2019). Both types of value are integral in online settings where physical contact is absent, guiding users through cognitive and affective evaluations that influence their decisions to continue using and purchasing through the app.
New economic geography (NEG) and city tiers in China
New economic geography (NEG), also known as the core–periphery model, a theoretical foundation that explains the relationship between regions with different levels of economic development (Krugman, Citation1991, Citation1998, Citation2011). According to NEG, there are two main concepts: the core and the periphery, which are shaped by centripetal and centrifugal forces. Centripetal forces refer to the agglomeration process and positive external effects, while centrifugal forces relate to dispersion and negative external effects (Klimczuk & Klimczuk-Kochańska, Citation2019). The theory suggests that regions with political, geographic, and economic advantages become the core regions, which attract continuous labour and external capital, leading to the development of larger economies. Peripheral regions, which are less attractive to external capital and have fewer natural and labour resources, are disadvantaged in their competition for these resources. As a result, core regions tend to become centres of economic and innovative activities (Florida, Citation2017), while the transfer of technical progress and knowledge to peripheral regions becomes more difficult due to the high costs of financial and intellectual inputs (Klimczuk & Klimczuk-Kochańska, Citation2015; Krugman, Citation2011).
Based on the aforementioned discussion, the city tier system in China reflects the core–periphery model, wherein populations in top-tier cities are significantly more prosperous than those in lower-tier cities (Bilby et al., Citation2020; Krugman, Citation2011). Established in the 1980s, the tier system was implemented by the central government as a strategy to prioritise infrastructure development and resource allocation among over 700 official cities (Starmass, Citation2022). Consequently, this system has led to a substantial imbalance in the development of infrastructure, technology, and human resources between the highest and the lowest-tier cities (Fakfare, Talawanich, & Wattanacharoensil, Citation2020; Huang et al., Citation2021).
While there is no academic consensus, five to seven tiers are typically recognised in China (Appendix 1). According to Bilby et al. (Citation2020), the top three tiers have fundamentally distinct consumer cultures and values when compared to the lower tiers, which are often referred to as “undeveloped”. This may be an exaggeration, but it highlights the substantial socioeconomic disparities between the top three tiers and the lower tiers (Huang et al., Citation2021; Shukla & Rosendo-Rios, Citation2021). Among the top three tiers, tier 2 cities are rapidly advancing in economic growth and infrastructure, increasingly resembling tier 1 cities in their purchasing habits and preferences, thus largely diminishing the differences between them. On the other hand, tier 3 cities generally uphold more traditional cultural values and lifestyles compared to tier 1 cities (Bilby et al., Citation2020; Huang & Qian, Citation2018). This study focuses on examining the distinctions between travel app users’ behaviour in tier 1 and tier 3 cities. This approach aligns with the conclusion that, despite the significant economic disparities, the levels of development between these two tiers are still comparable (Bilby et al., Citation2016, Citation2020). Specifically, Beijing and Kunming were selected to represent tier 1 and tier 3 cities.
As the capital of China, Beijing has a stronger emphasis on traditional Chinese cultural customs, making it more representative of China as a whole. The GDP recorded in Beijing is found significantly larger (i.e. RMB 4,026 billion) as compared to those three cities in tier 1, such as Shanghai (RMB 4,321 billion), Guangzhou (RMB 2,823 billion) and Shenzhen (RMB 3,066 billion) (CEIC, Citation2022). In term of population size, more than 21.89 million people living in Beijing (National Bureau of Statistics, Citation2021), with a disposable income per capita of RMB 75,601 (Statista, Citation2021a). Residents in Beijing tend to have higher living standards and better disposable incomes, as well as a wider range of travel options than those in lower-tier cities (Zhao & Wan, Citation2021). As a result, users in Beijing may be more demanding about the features of travel apps and attach greater importance to personal preferences and individuality than their counterparts in lower-tier cities.
Kunming is one of the tier 3 cities in China, with GDP of RMB 722 billion (CEIC, Citation2022). This city is populated by almost 8.46 million population (Kunming Government, Citation2021b), with a disposable income per capita of RMB 38,762 (Kunming Government, Citation2021a). Focusing on Kunming compared to other tier 3 cities in China is strategically significant due to its unique position as a cultural and economic hub in Southwest China and a popular tourist destination (Marafa et al., Citation2022). Kunming's diverse demographic composition and its role as a gateway to Southeast Asia provide distinctive insights into consumer behaviour, making it an ideal setting for examining travel app usage in a rapidly developing urban environment. Its cultural heritage and scenic landscapes enhance the relevance of travel apps for residents, offering a rich context for exploring how these apps cater to specific regional needs. This focus allows for a deeper understanding of app functionalities and user engagement in a less economically dominant yet culturally significant city.
Consequently, the S-O-R framework combined with the NEG were applied to investigate the influence of city tier disparities between Beijing (tier 1) and Kunming (tier 3) on travel app users’ decision-making process for repurchase intentions. These two cities have huge per capita income inequalities and are separated by a significant geographic distance of 2,795 kilometres, which may have an impact on cognitive and affective evaluation processes and individual preferences (Jensen et al., Citation2015).
Research model and hypotheses
Experiential features and value perception
Information quality has been acknowledged as an essential functional feature in much technology-related tourism literature (Jung & Hwang, Citation2023; Sharma et al., Citation2022), and was recognized as a key determinant in shaping users’ perceptions of value and experiences (Kullada & Kurniadjie, Citation2021). Information quality indicates the credibility of travel apps, which may alleviate users’ emotional anxiety.
Ease of use aims to simplify travel app usage for users, demonstrating the apps’ commitment to understanding and attending to their users’ needs (Bilgihan et al., Citation2016). Complexity negatively affects the attitudes of travel app users (Lim et al., Citation2022). In contrast, simplicity produces a feeling of control and certainty, leading to favourable emotions (Vahdat et al., Citation2021).
User interface attractiveness encompasses both aesthetics and interactivity of a travel app's user interface (Tak & Gupta, Citation2021). An attractive design can aesthetically and interactively satisfy users, delivering both functional and enjoyable experiences, whereas an unappealing interface may lead to low perceptions of pleasure and efficiency (Gao et al., Citation2023; Lin & Ryu, Citation2023).
The concept of personalisation flourished with the online marketing boom due to the skyrocketing capacity of data governance (Jeong & Shin, Citation2020). Personalised products and services may be tailored to users’ consumption patterns; accordingly, users perceive less uncertainty and greater value in emotions and convenience (Reis et al., Citation2020; Vinod, Citation2020). These experiential features of travel apps (information quality, ease of use, user interface attractiveness, and personalisation) serve as stimuli that influence cognitive and emotional evaluations, the organisms, aligning with the S-O-R framework. Therefore, the following hypotheses were formulated:
H1: Information quality (H1a), ease of use (H1b), user interface attractiveness (H1c), and personalisation (H1d) positively associate with utilitarian value.
H2: Information quality (H2a), ease of use (H2b), user interface attractiveness (H2c), and personalisation (H2d) positively associate with hedonic value.
Value perception and repurchase intentions
Value perception reflects a cognitive (i.e. utilitarian value) and affective (i.e. hedonic value) evaluation of experiential features. The utilitarian value is generated by the functional features of travel apps while the hedonic value derives from enjoyment during usage. An overall positive value perception indicates emotional and behavioural inclinations (Cheung et al., Citation2022; Itani et al., Citation2019; Oriade & Schofield, Citation2019). In the online marketing context, both utilitarian and hedonic values have been demonstrated to have positive direct effects on attitudes and satisfaction (Hsu & Lin, Citation2016); behavioural engagement intentions (Fang et al., Citation2017); purchase intentions (Moon et al., Citation2018; Rauschnabel et al., Citation2018). Utilitarian value and hedonic value are seen as critical mediators that transform initial app interactions (stimuli) into repurchase tendencies (responses), illustrating the framework’s applicability in predicting consumer loyalty. As a result, this research proposed these hypotheses:
H3: Utilitarian value positively links with in-app repurchase intentions.
H4: Hedonic value positively links with in-app repurchase intentions.
Moderating effect of city tier disparity
It is widely acknowledged that there are substantial differences in consumption attitudes and intentions between tier 1 and tier 3 cities (Atwal & Bryson, Citation2017; Heine et al., Citation2019). These differences may influence how people perceive and plan for travel, with those in lower-tier cities potentially being more conservative and having less refined tastes than those in higher-tier cities (Bilby et al., Citation2016; Shin et al., Citation2021). Additionally, research has found that consumers in tier 3 cities may be more sensitive to monetary and functional considerations (Huang & Qian, Citation2018), while those in tier 1 cities tend to have higher hedonic preferences (Shukla & Rosendo-Rios, Citation2021). People in higher-tier cities also seem to be more willing to engage in outbound travel (Huang & Wei, Citation2018). Based on NEG theory, the economic and cultural differences inherent in tier disparities influence how stimuli are received and processed by users, thereby affecting the organism and response relationship outlined in the S-O-R framework. NEG theory provides a nuanced understanding of regional influences on consumption patterns, enriching the analysis of spatial-economic impacts on technology adoption and usage behaviours in diverse urban contexts. Therefore, the following hypotheses were proposed ().
H5: City tier disparity moderates the relationship between information quality (H5a), ease of use (H5b), user interface attractiveness (H5c); personalisation (H5d) and utilitarian value.
H6: City tier disparity moderates the relationship between information quality (H6a), ease of use (H6b), user interface attractiveness (H6c); personalisation (H6d) and hedonic value.
H7: City tier disparity moderates the relationship between utilitarian value (H7a) and hedonic value (H7b) and in-app repurchase intentions.
Figure 2. Research model.
Methodology
Data collection
This study was conducted in Beijing and Kunming, utilising a self-administered survey. Due to COVID-19 concerns, the survey was delivered online by restricting IP addresses from Beijing and Kunming via the Wenjuanxing questionnaire platform (a leading survey platform akin to Qualtrics in China). As previously established, these two cities are representative of China's tier 1 and tier 3 cities, which have a significant economic and income disparity (Statista, Citation2022c). In addition, this research focused on Ctrip (one of the top travel app in China) travel app users as this app has the biggest market share and the highest number of active users in China (Guo et al., Citation2021; Statista, Citation2021b). A purposive sampling technique was used to ensure the validity of the respondents (Saunders et al., Citation2015), where the respondents must: (i) have the experience using Ctrip app to purchase travel products or services; (ii) have used the app for at least six months; and (iii) a digital savvy segment (i.e. aged between 20 and 40 years old) (Bento et al., Citation2018).
This survey instrument was subjected to pre-testing and pilot testing. Initially, a panel of ten members provided some minor suggestions about grammar and wording in the pre-test. Subsequently, 50 Ctrip travel app users were investigated as a pilot test prior to the distribution of the questionnaires. The finalised instrument was used to collect the data between October 2021 and January 2022. In total, 779 responses were gathered (387 from Beijing and 392 from Kunming). However, only 739 responses (367 from Beijing and 372 from Kunming) were retained when straight-line responses were removed. According to Hair et al.’s (Citation2023) guidelines, a sample size of 739 is sufficient, which also greatly exceeds the requirement (166) estimated by priori analysis using G*power 3.1 (9 predictors, 0.15 effect size, 95% power) (Faul et al., Citation2009). The majority of the respondents were female (54.8%), aged between 31 and 35 (44.8%). Clearly, there were substantial differences in monthly income between tier 1 Beijing and tier 3 Kunming respondents. The majority of respondents in tier 1 Beijing (52.3%) earned more than RMB 11,001 ($1,600) per month, whereas most respondents in tier 3 Kunming (73.3%) earned a monthly income below RMB 7,000 ($1,000) ().
Table 2. Demographics of survey respondent (n = 739).
Measures
All measurements were borrowed from prior studies on travel apps with slight modifications. Information quality and personalisation were measured with items from Seck and Philippe (Citation2013) and Jeong and Shin (Citation2020) respectively, while the scales of ease of use and user interface attractiveness were adapted from Fang et al. (Citation2017). The scales from Jahn and Kunz (Citation2012) were used to assess utilitarian and hedonic values, while the scale from Lee et al. (Citation2019) was modified to measure repurchase intentions. All exogenous constructs (i.e. information quality, ease of use, personalisation, user interface attractiveness, utilitarian value, and hedonic value) were assessed using a five-point Likert scales, while the endogenous construct, i.e. repurchase intentions was measured using a seven-point Likert scale, with the highest number indicating stronger agreement.
Results
This study employed partial least squares structural equation modelling (PLS-SEM) (Ciavolino et al., Citation2022) as opposed to covariance-based structural equation modelling (CB-SEM) due to its less stringent requirements for the measurement model, sample size, and residual distributions (Sarstedt & Cheah, Citation2019). In addition, the exploratory nature of this study makes PLS-SEM more appropriate due to its predictive and exploratory orientation (Chin et al., Citation2020; Hair & Sarstedt, Citation2019). PLS-SEM has also shown greater effectiveness in evaluating intricate models, including the multigroup analysis (Cheah et al., Citation2021, Citation2023). The PLS-SEM analysis was carried out with the SmartPLS 4 software (Ringle et al., Citation2023).
Common method variance (CMV)
Both procedural and statistical techniques were used to ensure the validity of the findings and to reduce the potential influence of common method variance (CMV). To reduce ambiguity, procedural measures included offering contextual information and clear instructions, as well as measuring the exogenous and endogenous constructs using both five-point and seven-point Likert scales (Podsakoff et al., Citation2012). Also, statistical remedies such as the full collinearity test were used (Kock & Lynn, Citation2012) and Harman's single-factor test (Fuller et al., Citation2016; Podsakoff et al., Citation2012) were used. According to the results of Harman's single-factor test, the principal component explained only 40.92% of the total variance (less than 50%), showing that CMV was not a factor (Aguirre-Urreta & Hu, Citation2019; Fuller et al., Citation2016). The full collinearity test yielded variance inflation factors (VIFs) ranging from 1.029 to 2.259 (), all of which are less than the 3.33 threshold, indicating that the likelihood of CMV being a problem is low (Kock & Lynn, Citation2012).
Table 3. Assessment of reliability and convergent validity.
Reflective measurement model
The reliability and validity of the measurement model for three datasets (i.e. tier 1 Beijing, tier 3 Kunming, and both cities) were assessed. First, the convergent validity of the constructs was assessed by outer loadings and the average variance extracted (AVE). As presented in , outer loadings of all items were above 0.60 (Bagozzi et al., Citation1991) and the AVE scores of all constructs were above the recommended value of 0.50 (Fornell & Larcker, Citation1981). As indicated in , composite reliability (CR) values of all constructs (greater than 0.70) showed satisfactory internal consistency (Hair et al., Citation2019).
Discriminant validity was evaluated with the Heterotrait-Monotrait (HTMT) ratio (Henseler et al., Citation2015). As depicted in , the HTMT values for all constructs fell below the conservative threshold of 0.85 (Hair et al., Citation2023; Henseler et al., Citation2015), indicating satisfactory discriminant validity for all datasets.
Table 4. Assessment of discriminant validity using the HTMT.
Measurement invariance of composite models (MICOM)
The invariance test using the MICOM was necessary before performing the multigroup analysis (MGA), as the MICOM helps to determine whether the individuals from different city tiers (i.e. Beijing as tier 1 and Kunming as tier 3) have a similar level of understanding on the construct measurements. First, configural invariance (i.e. whether the same factor structure exists in both groups) was found between the tier 1 Beijing and tier 3 Kunming datasets ( and ). Second, compositional invariance was established, as the permutation c-values did not differ significantly from one another. Specifically, the overall permutation value estimates (c = 1) for both the tier 1 Beijing and tier 3 Kunming datasets straddled between the upper and lower limits of 95% confidence interval (). Last, the full invariance was not established across two city tiers, as the difference in variance values from all pairs of comparison did not fall within the upper and lower limits of the 95% confidence interval. As a result, partial measurement invariance was established through the MICOM procedure, indicating that it was feasible to conduct MGA to compare and interpret group-specific differences in the relationships of constructs involved in the research model.
Table 5. Assessment of the measurement invariance.
Structural model
In the structural model, the VIF was used to assess the presence of multicollinearity among the predictor variables. All VIF values (full data, data from tier 1 Beijing, and data from tier 3 Kunming) were found to be well below the guideline of 3.30, indicating a low risk of multicollinearity in the model (Becker et al., Citation2015) ().
Table 6. Result of structural model (direct relationships).
Next, all hypotheses were statistically tested with the bootstrapping technique (10,000 sub-samples) (Becker et al., Citation2023) (). The results from the full dataset and the tier 1 Beijing dataset showed that most of the proposed path relationships were significant (H1a, H1b, H1c, H1d, H2b, H2c, H2d, H3, H4), except for information quality (H2a: β = −0.001, t-value = 0.031) on hedonic value. The analysis results for the tier 3 Kunming dataset also supported the proposed hypotheses (H1a, H1b, H1d, H2a, H2c, H2d, H3, H4), except for user interface attractiveness (H1c: β = 0.073, t-value = 1.472) on utilitarian value, and ease of use (H2b: β = 0.013, t-value = 0.282) on hedonic value ().
Figure 3. Comparison of the structural model results for Beijing and Kunming datasets.
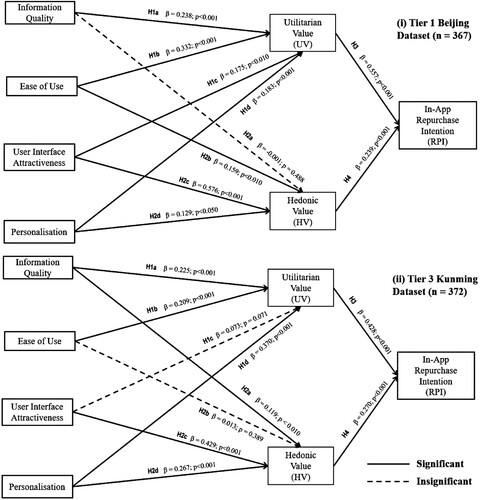
The outcomes of coefficient determinations (R2) are presented in . The full dataset illustrated the R2 of 0.517 for utilitarian value, 0.536 for hedonic value, and 0.461 for repurchase intentions. Tier 1 Beijing’s data presented the R2 of 0.547 for utilitarian value, 0.576 for hedonic value, and 0.519 for repurchase intentions, while tier 3 Kunming’s data exhibited the R2 of 0.504 for utilitarian value, 0.499 for hedonic value, and 0.414 for repurchase intentions. Subsequently, the effect size (f2) was assessed with Cohen’s (Citation1988) guidelines (<0.02 Trivial; 0.02 Small; 0.15 Medium; 0.35 Large) (). The findings showed that information quality on utilitarian value, personalisation on hedonic value, and hedonic value on repurchase intentions in all three datasets (full dataset, tier 1 Beijing dataset, and tier 3 Kunming dataset) exhibited small effect sizes of the impact (f2 = 0.024-0.082) (i.e. H1a, H2d, and H4). In addition, the full dataset displayed trivial effect sizes (f2 = 0.014-0.019) for H1c (user interface attractiveness → utilitarian value) and H2b (ease of use → hedonic value), small effect sizes (f2 = 0.082-0.108) for H1b (ease of use → utilitarian value) and H1d (personalisation → utilitarian value), and medium effect sizes (f2 = 0.280-0.323) for H2c (user interface attractiveness → hedonic value) and H3 (utilitarian value → repurchase intentions). The tier 1 Beijing dataset presented small effect sizes (f2 = 0.037-0.045) for H1c (user interface attractiveness → utilitarian value), H1d (personalisation → utilitarian value), and H2b (ease of use → hedonic value), medium effect size (f2 = 0.153) for H1b (ease of use → utilitarian value), and large effect sizes (f2 = 0.426-0.437) for H2c (user interface attractiveness → hedonic value) and H3 (utilitarian value → repurchase intentions). The tier 3 Kunming dataset illustrated a trivial effect size (f2 = 0.017) for H2a (information quality → hedonic value), a small effect size (f2 = 0.060) for H1b (ease of use → utilitarian value), and medium effect sizes (f2 = 0.158-0.208) for H1d (personalisation → utilitarian value), H2c (user interface attractiveness → hedonic value), and H3 (utilitarian value → repurchase intentions).
Finally, the predictive relevance was examined with both Q2 (Geisser, Citation1975; Stone, Citation1974) and PLSpredict (or out-of-sample prediction) (Chin et al., Citation2020; Shmueli et al., Citation2016, Citation2019). The Q2 values for all endogenous constructs in all datasets (i.e. full dataset, tier 1 Beijing dataset, and tier 3 Kunming dataset) were found to be greater than zero, ranging from 0.288 to 0.564. This indicates that the predictive quality of the model was satisfactory (Shmueli et al., Citation2019). In addition, the PLSpredict technique was applied to investigate the prediction relevance of the endogenous constructs (i.e. utilitarian value, hedonic value, and repurchase intentions). As shown in , all three datasets (i.e. full dataset, tier 1 Beijing dataset, and tier 3 Kunming dataset) presented that all three endogenous constructs have strong predictive power. These strong statistics demonstrated that this framework is applicable to diverse situations of predictive research.
Table 7. Assessment of PLS predict.
Multigroup analysis (MGA)
As shown in , MGA results and its significances were examined with different techniques in the PLS-SEM, which assesses the differences between path coefficients of two groups (tier 1 Beijing and tier 3 Kunming in this study) (Cheah et al., Citation2023; Hair et al., Citation2018). The outcomes shown in illustrate significant differences between datasets of tier 1 Beijing and tier 3 Kunming (p-value < 0.05). Specifically, significant differences occurred in all the relationships except for relationships between: (i) information quality and utilitarian value; (ii) user interface attractiveness and utilitarian value; and (iii) hedonic value and repurchase intentions. In particular, the results suggested that travel app users from tier 1 Beijing tend to place a greater emphasis on features such as ease of use and user interface attractiveness when perceiving both utilitarian and hedonic value. Users in tier 3 Kunming seemed to prioritise personalisation when considering these factors. Interestingly, the impact of information quality on hedonic value was found to be more significant for users in tier 3 Kunming. Additionally, the results indicated that the influence of utilitarian value on repurchase intentions was stronger for users in tier 1 Beijing compared to those in Kunming.
Table 8. Assessment of the multigroup analysis.
Post-hoc analysis with ANOVA test
To investigate whether demographics had an effect on the constructs of this study, a post-hoc analysis using ANOVA was conducted. The results showed that while gender and age did not impact the constructs, monthly income did have a significant influence on repurchase intentions (). To further understand this significance, the potential influence of monthly income on all constructs was examined in both the tier 1 Beijing and tier 3 Kunming datasets (). It was found that monthly income did not have a significant impact on the constructs within either city tier, indicating that city-tier disparities were the only source of the differences. According to the results presented in , a pairwise comparison analysis of the influence of monthly income on repurchase intentions in the full dataset revealed significant differences between those with monthly incomes less than RMB 7000 ($1,000) and those with incomes over RMB 11,001 ($1,600). This suggests that as the income disparity between different city tiers increases, the likelihood of significant differences in repurchase intentions also increases. This result corresponds to the substantial differences in monthly income between the respondents from tier 1 Beijing and tier 3 Kunming (). Specifically, a majority of respondents in Beijing (52.3%) earned more than RMB 11,001 ($1,600) per month, while most respondents in Kunming (73.4%) earned a monthly income below RMB 7,000 ($1,000). In summary, the significant differences in repurchase intentions that were caused by monthly income were ultimately the result of city-tier disparities.
Table 9. Post-hoc test (i.e. ANOVA) of the impact of demographics on all constructs (full dataset).
Table 10. Post-hoc test (i.e. ANOVA) of the impact of monthly income on all constructs in the Beijing and Kunming datasets.
Table 11. Post-hoc test (i.e. ANOVA) of the impact of monthly income on in-app repurchase intention (full dataset).
Discussion of findings and implications
Discussion of the findings
The aim of this research was to investigate the experiential features of travel apps that shape users’ value perceptions before leading to repurchase intentions. A research model was developed based on the S–O-R framework, which posits that the repurchase intentions are influenced by a collection of context-based experiential features: information quality, ease of use, user interface attractiveness, and personalisation. By extension, the value processes (i.e. utilitarian and hedonic values) were investigated, through which repurchase intentions were indirectly influenced by experiential features. Furthermore, it is suggested that city-tier disparities may moderate the relationships between these constructs.
Information quality was found to influence utilitarian value significantly in both the tier 1 Beijing and tier 3 Kunming datasets (H1a was supported). This result aligns with previous research highlighting the importance of information quality as a key functional feature in the technology-based tourism literature (Jeong & Shin, Citation2020; Kullada & Kurniadjie, Citation2021). High-quality travel information is the key source that helps app users plan their trips effectively based on reasonable contents, which ultimately deliver a higher degree of perceived utilitarian value among all groups of users (Kullada & Kurniadjie, Citation2021). This thus justified the reason of no significant difference between users in tier 1 and tier 3 cities (H5a was not supported). It was noteworthy to discover that users in tier 1 Beijing were unable to perceive the hedonic value from information quality (H2a was not supported), whereas users in tier 3 Kunming did. This significant difference (H6a was supported) may be owing to the information overload and fast-paced life in Beijing, which make users anxious and insensitive to information-induced enjoyment. In comparison, limited access to travel information in tier 3 Kunming may lead to a greater sense of fulfilment and enjoyment when acquiring high-quality information.
Also, it was discovered that ease of use has significant impacts on utilitarian value in the tier 1 Beijing and tier 3 Kunming datasets (H1b was supported). This finding is in line with previous research (e.g. Bravo et al., Citation2021; Fang et al., Citation2017; Lim et al., Citation2022), indicating that users are more inclined to have favourable experiences and use a travel app more frequently when they can effortlessly search for and reserve travel products and services within the app. This feature can be especially beneficial for users with busy schedules who value convenience. However, users in tier 3 Kunming failed to recognise the significance of ease of use on hedonic value (H2b was not supported). The significant differences in ease of use between the two groups (H5b and H6b were supported) may be driven by the fact that users in tier 1 Beijing are overwhelmed by the plethora of technology options and features for trips (Zhang et al., Citation2020), and therefore prefer a simpler and more straightforward app. However, this may not be the case for tier 3 Kunming users who may not be as stressed and hence may not appreciate the comfort that ease of use provides (Gupta et al., Citation2018).
Corresponding to Fang et al. (Citation2017), significant relationships were found between user interface attractiveness and hedonic value in both city tiers (H2c was supported). This confirms the notion that a visually appealing and intuitive interface contributes to pleasant experiences (Coursaris & Van Osch, Citation2016; Gursoy, Citation2019). However, there was no significant effect of interface attractiveness on utilitarian value in the tier 3 Kunming dataset (H1c was not supported). This finding supports Bilby et al. (Citation2020) in that people in tier-1 cities tend to have more refined tastes than those in lower-tier cities; users in tier 3 Kunming may have less sophisticated preferences in appreciating hedonic value compared to users in tier 1 Beijing (H6c was supported). Nonetheless, it is interesting to note that while tier 1 Beijing users may derive functional value from a more hedonic-centred user interface, this feature alone is not a reliable predictor of utilitarian value, resulting in insignificant differences in utilitarian value perceptions across the two groups (H5c was not supported).
Next, the findings support the hypotheses of personalisation on utilitarian and hedonic values in the tier 1 Beijing and tier 3 Kunming datasets (H1d and H2d were supported). This aligns with the findings of Kang and Namkung (Citation2019) and Piccoli et al. (Citation2017) that personalisation leads to favourable value perceptions for users through convenience and makes them feel as if they are receiving special attention from firms. As for group comparisons (H5d and H6d were supported), travel app users in higher-tier cities feel more empowered and less reliant on personalised services when planning journeys, as they have greater access to travel information and personalisation options (Shin et al., Citation2021). However, personalisation might be especially important in lower-tier cities that have limited access to high-quality personalised travel services and where individuals have less expertise in using technology to schedule trips.
As predicted, utilitarian and hedonic values are positive predictors of repurchase intentions (H3 and H4 were supported) across all datasets, which is in line with the growing importance of relationship management in the current online business climate (Itani et al., Citation2019). Users who perceive high value in a travel app are more likely to be satisfied with their experiences and encouraged to make future purchases (Pansari & Kumar, Citation2017). Regarding the potential discrepancies across city tiers, a significant difference was identified in the relationship between utilitarian value and repurchase intentions (H7a was supported), with travel app users in higher-tier cities (e.g. Beijing) placing greater emphasis on functionality when determining repurchase intentions. Travel app users in higher-tier cities (i.e. Beijing) typically have better incomes and more access to information about products and services (Li et al., Citation2021), which drives them to make more informed purchase decisions and prioritise high functional value to make repeat purchases (Gupta et al., Citation2018). In contrast, no significant difference was found in the relationship between hedonic value and repurchase intentions between higher and lower-tier cities (H7b was not supported). These findings suggest that while users in higher-tier cities may be more inclined to make repeat purchases based on perceived functional value, affective relationships are equally important for users in both city tiers to improve repurchase intentions.
As a result, the findings contradict the aforementioned assertions (e.g. Bilby et al., Citation2016, Citation2020; Huang & Qian, Citation2018; Shukla & Rosendo-Rios, Citation2021) that individuals in higher-tier cities prioritise non-functional perceptions (i.e. hedonic value) over functionality (i.e. utilitarian value) in consumption. This unexpected discovery may throw into doubt the concept that wealthy individuals are more interested in spiritual fulfilment, as it may have overlooked the fact that the greater people's economic power and cognitive ability, the more likely they are to make informed decisions (Gupta et al., Citation2018). This may indirectly cause them to be more concerned with functionality and cost-effectiveness. Additionally, while individuals in higher-tier cities may prioritise happiness and pleasure (Bilby et al., Citation2020), money-related behaviour (i.e. repurchase), instead of mere adoption, may diminish the impact of emotional values (i.e. hedonic value).
Theoretical implications
This research contributes to the current tourism marketing literature in several respects. First, it extends the S-O-R framework by considering the influence of city tier on user perceptions. It explores how different stimuli (i.e. information quality, ease of use, user interface attractiveness, and personalisation) affect the organism (represented by utilitarian and hedonic values) and lead to varied responses (such as repurchase intentions), with city tier acting as a modifying factor. This modification of the S-O-R framework provides fresh insights into its use in digital environments, suggesting potential adaptations and expansions that might be relevant in other contexts of digital commerce (Fakfare & Manosuthi, Citation2022; Fang et al., Citation2017).
Second, this research applies NEG theory (Krugman, Citation1991, Citation1998, Citation2011) to tourism to explore the boundary effects of city tier disparity. It contributes to the literature by detailing how economic factors tied to geographic location influence the acceptance and effectiveness of digital technologies, a relatively underexplored area in mobile commerce research. It challenges the conventional belief (e.g. Bilby et al., Citation2016, Citation2020; Shukla & Rosendo-Rios, Citation2021) that higher-tier city residents prioritise non-functional aspects by demonstrating that utilitarian values significantly influence user behaviour in cities such as Beijing, while hedonic values are consistently appreciated across different city tiers like Kunming. This revelation deepens the theoretical frameworks of economic geography and consumer behaviour by providing solid empirical evidence on how urban characteristics distinctly affect technology interactions, offering valuable insights for tailoring digital strategies to effectively meet the varied needs of users across diverse urban settings.
Practical implications
Travel app features should be designed with user needs in mind, as opposed to the company's perspective. In particular, user interface design should focus on aesthetics and interactivity to provide a visually appealing and highly responsive experience for users. One way to enhance the interface is by gradually introducing creative designs based on user familiarity, rather than making drastic changes that might confuse users. It can also be helpful to offer multiple themed interfaces for different types of users, such as those who are new to the app and those who are experienced. A visually appealing interface can help reduce anxiety and mental strain for app users, while a highly responsive interface can make the app easier to use. In practice, ease of use is accompanied by an interface with strong interactivity such as clear, logical menus and functional buttons, helpful tips and tutorials, which enables users to access the desired products or services effortlessly. Personalisation seeks to better comprehend the behavioural tendencies of travel app users to their preferences and needs. To better understand user preferences and needs, it is suggested that travel apps implement multiple-layer information collection systems, including automated tools for tracking usage behaviour and sorting feedback keywords, as well as human personnel for more in-depth communication with users. Following the preceding measures, information quality may be improved dramatically by presenting more relevant, accurate, and detailed information and images to users with appropriate pages and formats. Also, it is important for travel apps to offer personalised information, products, and services that are compatible with user needs, leading to a simpler and more enjoyable user experience.
Understanding the urban dynamics similar to China's city tier system can guide app development in other countries with varying levels of urbanisation and technological adoption. For instance, in emerging markets or smaller cities within larger countries, apps could be designed with simple, robust features that emphasise cost-effectiveness. In contrast, apps in more developed urban areas worldwide might focus on advanced functionalities and sophisticated personalisation to meet the greater expectations and tech engagement of consumers there.
Furthermore, educating users about app features through engaging methods, such as gamified tutorials, is crucial. These techniques can demystify technology, boost user engagement, and foster a stronger connection with apps. Tailoring marketing strategies to the local cultural and economic landscapes can optimise user acquisition and retention. For example, in technologically advanced regions, promoting complex features may appeal to a tech-savvy audience, whereas in less developed areas, focusing on reliability and simplicity could be more effective.
Lastly, customising travel apps to reflect the specific economic and cultural contexts of different regions is crucial. Ideally, the app should identify and label a user's “home” location based on their presence in a specific area for over 100 days consecutively. These home locations can be classified into categories such as affluent, developed, less developed, and economically challenged areas. For individuals from lower-tiered home locations traveling to more affluent areas, the app should provide cost-saving features like price comparison tools, real-time discount alerts, and promotions to help them manage budgets effectively. Conversely, for those from affluent home locations traveling to less developed areas, apps should facilitate exclusive experiences by partnering with high-end brands to offer special discounts and perks at luxury venues and upscale boutiques. This tailored approach will ensure that users receive relevant and beneficial features that enhance their travel experiences, regardless of their destination or economic background.
Conclusion and future research directions
The rising popularity of travel apps has highlighted the necessity for travel firms to understand how to motivate user repurchase intentions, which have become a financial performance indicator for long-term success (Jang et al., Citation2018). This research used the S-O-R framework and NEG theory to better understand the experiential features that influence repurchase intentions among travel app users in different tiers of cities, widening the applicable boundaries for both theories. In particular, a collection of context-based experiential features of travel apps and values (i.e. utilitarian and hedonic values) was suggested for repurchase intentions. It was found that these decision-making processes are influenced by city tier disparities, which may contradict commonly held beliefs (e.g. Bilby et al., Citation2016, Citation2020; Huang & Qian, Citation2018; Shukla & Rosendo-Rios, Citation2021) that people in higher tier cities tend to prioritise non-functional perceptions for consumption.
In addition to the valuable insights gained, this research has identified several areas that could be explored in future studies. First, given China's huge size (Shukla & Rosendo-Rios, Citation2021), this comparative research was limited to Beijing and Kunming as representatives, which may not be sufficient to provide a strong foundation for the city tier comparison. Future studies should include other potential cities, as recommended by Bilby et al. (Citation2020), to increase the credibility of the city tier comparison. Second, this research was conducted in China with a similar culture (Crane et al., Citation2018), and as a result, the researchers were unable to explore the decision-making processes of travel app users across different cultures. As stated by a number of researchers (Badu-Baiden et al., Citation2023; Zheng et al., Citation2023), cultural differences (e.g. individualism and collectivism) may influence the attitudes and behavioural intentions of tourists. Hence, the impact of culture on travel app users should be investigated by future comparative research. Finally, this study revealed that the relationships between utilitarian value and repurchase intentions were stronger in the tier 1 Beijing dataset than in the tier 3 Kunming dataset, contrary to the assumptions of prior studies (e.g. Bilby et al., Citation2016, Citation2020; Huang & Qian, Citation2018; Shukla & Rosendo-Rios, Citation2021). This contradictory result necessitates more research into the boundary effect of city-tier disparities on individuals’ utilitarian and hedonic value perceptions.
Disclosure statement
No potential conflict of interest was reported by the author(s).
Data availability statement
Data will be made available upon reasonable request.
References
- Aguirre-Urreta, M. I., & Hu, J. (2019). Detecting common method bias: Performance of the Harman’s single-factor test. Data Base for Advances in Information Systems, 50(2), 45–70. https://doi.org/10.1145/3330472.3330477
- Ahmad, W., Kim, W. G., Choi, H. M., & Haq, J. U. (2021). Modeling behavioral intention to use travel reservation apps: A cross-cultural examination between US and China. Journal of Retailing and Consumer Services, 63, 102689. https://doi.org/10.1016/j.jretconser.2021.102689
- Ali, F., Terrah, A., Wu, C., Ali, L., & Wu, H. (2021). Antecedents and consequences of user engagement in smartphone travel apps. Journal of Hospitality and Tourism Technology, 12(2), 355–371. https://doi.org/10.1108/JHTT-09-2020-0221
- Atwal, G., & Bryson, D. (2017). Luxury brands in China and India. In Luxury brands in China and India. Palgrave Macmillan. https://doi.org/10.1057/978-1-137-54715-6/COVER
- Badu-Baiden, F., Kim, S., & Wong, I. A. (2023). A cross-cultural multilevel investigation on memorable destination local food consumption experience and food personality traits. Journal of Travel & Tourism Marketing, 40(4), 275–293. https://doi.org/10.1080/10548408.2023.2245423
- Bagozzi, R. P., Yi, Y., & Phillips, L. W. (1991). Assessing construct validity in organizational research. Administrative Science Quarterly, 36(3), 421–458. https://doi.org/10.2307/2393203
- Becker, J. M., Cheah, J. H., Gholamzade, R., Ringle, C. M., & Sarstedt, M. (2023). PLS-SEM’s most wanted guidance. International Journal of Contemporary Hospitality Management, 35(1), 321–346. https://doi.org/10.1108/IJCHM-04-2022-0474
- Becker, J. M., Ringle, C. M., Sarstedt, M., & Völckner, F. (2015). How collinearity affects mixture regression results. Marketing Letters, 26(4), 643–659. https://doi.org/10.1007/s11002-014-9299-9
- Benítez-Aurioles, B. (2018). Why are flexible booking policies priced negatively? Tourism Management, 67, 312–325. https://doi.org/10.1016/j.tourman.2018.02.008
- Bento, M., Martinez, L. M., & Martinez, L. F. (2018). Brand engagement and search for brands on social media: Comparing Generations X and Y in Portugal. Journal of Retailing and Consumer Services, 43(January), 234–241. https://doi.org/10.1016/j.jretconser.2018.04.003
- Bilby, J., Reid, M., & Brennan, L. (2016). The future of advertising in China: Practitioner insights into the evolution of Chinese advertising creativity. Journal of Advertising Research, 56(3), 245–258. https://doi.org/10.2501/JAR-2016-018
- Bilby, J., Reid, M., Brennan, L., & Chen, J. (2020). Tiers and fears: An investigation of the impact of city tiers and uncertainty avoidance on Chinese consumer response to creative advertising. Australasian Marketing Journal, 28(4), 332–348. https://doi.org/10.1016/j.ausmj.2020.07.005
- Bilgihan, A., Kandampully, J., & Zhang, T. (. (2016). Towards a unified customer experience in online shopping environments: Antecedents and outcomes. International Journal of Quality and Service Sciences, 8(1), 102–119. https://doi.org/10.1108/IJQSS-07-2015-0054
- Bravo, R., Catalán, S., & Pina, J. M. (2021). Understanding how customers engage with social tourism websites. Journal of Hospitality and Tourism Technology, 12(1), 141–154. https://doi.org/10.1108/JHTT-02-2019-0040
- CEIC. (2022). China Gross Domestic Product: Prefecture Level City.
- Cham, T. H., Lim, Y. M., & Sigala, M. (2022). Marketing and social influences, hospital branding, and medical tourists’ behavioural intention: Before- and after-service consumption perspective. International Journal of Tourism Research, 24(1), 140–157. https://doi.org/10.1002/jtr.2489
- Cheah, J. H., Amaro, S., & Roldán, J. L. (2023). Multigroup analysis of more than two groups in PLS-SEM: A review, illustration, and recommendations. Journal of Business Research, 156, 113539. https://doi.org/10.1016/j.jbusres.2022.113539
- Cheah, J. H., Lim, X. J., Ting, H., Liu, Y., & Quach, S. (2022). Are privacy concerns still relevant? Revisiting consumer behaviour in omnichannel retailing. Journal of Retailing and Consumer Services, 65, 102242. https://doi.org/10.1016/j.jretconser.2020.102242
- Cheah, J. H., Nitzl, C., Roldán, J. L., Cepeda-Carrion, G., & Gudergan, S. P. (2021). A primer on the conditional mediation analysis in PLS-SEM. Data Base for Advances in Information Systems, 52(SI), 43–100. https://doi.org/10.1145/3505639.3505645
- Cheung, M. L., Leung, W. K. S., Cheah, J. H., & Ting, H. (2022). Exploring the effectiveness of emotional and rational user-generated contents in digital tourism platforms. Journal of Vacation Marketing, 28(2), 152–170. https://doi.org/10.1177/13567667211030675
- Chin, W., Cheah, J. H., Liu, Y., Ting, H., Lim, X. J., & Cham, T. H. (2020). Demystifying the role of causal-predictive modeling using partial least squares structural equation modeling in information systems research. Industrial Management and Data Systems, 120(12), 2161–2209. https://doi.org/10.1108/IMDS-10-2019-0529
- Choi, K., Wang, Y., & Sparks, B. (2019). Travel app users’ continued use intentions: It’s a matter of value and trust. Journal of Travel and Tourism Marketing, 36(1), 131–143. https://doi.org/10.1080/10548408.2018.1505580
- Choi, K., Wang, Y., Sparks, B. A., & Choi, S. M. (2021). Privacy or security: Does it matter for continued use intention of travel applications? Cornell Hospitality Quarterly, 64, 267–282. https://doi.org/10.1177/19389655211066834
- Chuang, C. M. (2020). A current travel model: Smart tour on mobile guide application services. Current Issues in Tourism, 23(18), 2333–2352. https://doi.org/10.1080/13683500.2019.1631266
- Ciavolino, E., Aria, M., Cheah, J. H., & Roldán, J. L. (2022). A tale of PLS structural equation modelling: Episode I— A bibliometrix citation analysis. Social Indicators Research, 164(3), 1323–1348. https://doi.org/10.1007/s11205-022-02994-7
- Claffey, E., & Brady, M. (2015). A model of consumer engagement in a virtual customer environment. Journal of Customer Behaviour, 13(4), 325–346. https://doi.org/10.1362/147539214X14185702584405
- Cohen, J. (1988). Statistical Power Analysis for the Behavioral Sciences (2nd edition). Routledge.
- Coursaris, C. K., & Van Osch, W. (2016). A cognitive-affective model of perceived user satisfaction (CAMPUS): The complementary effects and interdependence of usability and aesthetics in IS design. Information and Management, 53(2), 252–264. https://doi.org/10.1016/j.im.2015.10.003
- Crane, B., Albrecht, C., Duffin, K. M., & Albrecht, C. (2018). China’s special economic zones: An analysis of policy to reduce regional disparities. Regional Studies, Regional Science, 5(1), 98–107. https://doi.org/10.1080/21681376.2018.1430612
- Dabbous, A., & Barakat, K. A. (2020). Bridging the online offline gap: Assessing the impact of brands’ social network content quality on brand awareness and purchase intention. Journal of Retailing and Consumer Services, 53, 101966. https://doi.org/10.1016/j.jretconser.2019.101966
- Dacko, S. G. (2017). Enabling smart retail settings via mobile augmented reality shopping apps. Technological Forecasting and Social Change, 124, 243–256. https://doi.org/10.1016/j.techfore.2016.09.032
- Dastjerdi, A. M., Kaplan, S., de Abreu e Silva, J., Nielsen, O. A., & & Pereira, F. C. (2019a). Participating in environmental loyalty program with a real-time multimodal travel app: User needs, environmental and privacy motivators. Transportation Research Part D: Transport and Environment, 67, 223–243. https://doi.org/10.1016/j.trd.2018.11.013
- Dastjerdi, A. M., Kaplan, S., de Abreu e Silva, J., Nielsen, O. A., & & Pereira, F. C. (2019b). Use intention of mobility-management travel apps: The role of users goals, technophile attitude and community trust. Transportation Research Part A: Policy and Practice, 126, 114–135. https://doi.org/10.1016/j.tra.2019.06.001
- Dewan, N., Hossain, M. B., Kim, G. G., Dunay, A., & Illés, C. B. (2022). Transportation mobile applications adoption behavior does affect overseas residents’ life satisfaction: Involvement as a moderator. Cogent Business and Management, 9(1), 1. https://doi.org/10.1080/23311975.2022.2096998
- Dickinson, J. E., Hibbert, J. F., Filimonau, V., Cherrett, T., Davies, N., Norgate, S., Speed, C., & Winstanley, C. (2017). Implementing smartphone enabled collaborative travel: Routes to success in the tourism domain. Journal of Transport Geography, 59, 100–110. https://doi.org/10.1016/j.jtrangeo.2017.01.011
- Ding, G., Guo, J., Pueppke, S. G., Ou, M., Ou, W., & Tao, Y. (2022). Has urban form become homogenizing? Evidence from cities in China. Ecological Indicators, 144, 109494. https://doi.org/10.1016/j.ecolind.2022.109494
- Douglas, A. (2019). Mobile business travel application usage: Are South African men really from Mars and women from Venus? Journal of Hospitality and Tourism Technology, 10(3), 300–316. https://doi.org/10.1108/JHTT-01-2018-0002
- Douglas, A., Lubbe, B., & van Rooyen, A. (2018). Business travellers’ use of mobile travel applications: A generational analysis. Information Technology and Tourism, 18(1–4), 113–132. https://doi.org/10.1007/s40558-017-0103-6
- Fakfare, P., & Manosuthi, N. (2022). Examining the influential components of tourists’ intention to use travel apps: The importance–performance map analysis. Journal of Hospitality and Tourism Insights, 6, 1144–1168. https://doi.org/10.1108/JHTI-02-2022-0079
- Fakfare, P., Promsivapallop, P., & Manosuthi, N. (2023). Applying integrated generalized structured component analysis to explore tourists' benefit consideration and choice confidence toward travel appscape. Technological Forecasting and Social Change, 188, 122321. http://doi.org/10.1016/j.techfore.2023.122321
- Fakfare, P., Talawanich, S., & Wattanacharoensil, W. (2020). A scale development and validation on domestic tourists’ motivation: the case of second-tier tourism destinations. Asia Pacific Journal of Tourism Research, 25(5), 489–504. http://doi.org/10.1080/10941665.2020.1745855
- Fang, J., Zhao, Z., Wen, C., & Wang, R. (2017). Design and performance attributes driving mobile travel application engagement. International Journal of Information Management, 37(4), 269–283. https://doi.org/10.1016/j.ijinfomgt.2017.03.003
- Faul, F., Erdfelder, E., Buchner, A., & Lang, A. G. (2009). Statistical power analyses using G*Power 3.1: Tests for correlation and regression analyses. Behavior Research Methods, 41(4), 1149–1160. https://doi.org/10.3758/BRM.41.4.1149
- Florida, R. (2017). The new urban crisis: How our cities are increasing inequality, deepening segregation, and failing the middle class-and what we can do about it. Basic Books.
- Fornell, C., & Larcker, D. F. (1981). Structural equation models with unobservable variables and measurement error: Algebra and statistics. Journal of Marketing Research, 18(3), 382–388. https://doi.org/10.1177/002224378101800313
- Fu, Y., Liu, X., Wang, Y., & Chao, R. F. (2018). How experiential consumption moderates the effects of souvenir authenticity on behavioral intention through perceived value. Tourism Management, 69(January), 356–367. https://doi.org/10.1016/j.tourman.2018.06.023
- Fuller, C. M., Simmering, M. J., Atinc, G., Atinc, Y., & Babin, B. J. (2016). Common methods variance detection in business research. Journal of Business Research, 69(8), 3192–3198. https://doi.org/10.1016/j.jbusres.2015.12.008
- Gao, Z., Cheah, J. H., Lim, X. J., Ng, S. I., Cham, T. H., & Yee, C. L. (2023). Can travel apps improve tourists’ intentions? Investigating the drivers of Chinese gen Y users’. Journal of Vacation Marketing, 30, 505–534. https://doi.org/10.1177/13567667231152938
- Geisser, S. (1975). The predictive sample reuse method with applications. Journal of the American Statistical Association, 70(350), 320–328. https://doi.org/10.1080/01621459.1975.10479865
- Gretzel, U., Koo, C., Sigala, M., & Xiang, Z. (2015). Special issue on smart tourism: Convergence of information technologies, experiences, and theories. Electronic Markets, 25(3), 175–177. https://doi.org/10.1007/s12525-015-0194-x
- Gretzel, U., Zarezadeh, Z., Li, Y., & Xiang, Z. (2020). The evolution of travel information search research: A perspective article. Tourism Review, 75(1), 319–323. https://doi.org/10.1108/TR-06-2019-0279
- Guo, X., Pesonen, J., & Komppula, R. (2021). Comparing online travel review platforms as destination image information agents. Information Technology and Tourism, 23(2), 159–187. https://doi.org/10.1007/s40558-021-00201-w
- Gupta, A., & Dogra, N. (2017). Tourist adoption of mapping apps: A UTAUT2 perspective of smart travellers. Tourism and Hospitality Management, 23(2), 145–161. https://doi.org/10.20867/thm.23.2.6
- Gupta, A., Dogra, N., & George, B. (2018). What determines tourist adoption of smartphone apps? Journal of Hospitality and Tourism Technology, 9(1), 50–64. https://doi.org/10.1108/JHTT-02-2017-0013
- Gupta, S., Pansari, A., & Kumar, V. (2018). Global customer engagement. Journal of International Marketing, 26(1), 4–29. https://doi.org/10.1509/jim.17.0091
- Gursoy, D. (2019). A critical review of determinants of information search behavior and utilization of online reviews in decision making process (invited paper for ‘luminaries’ special issue of International Journal of Hospitality Management). International Journal of Hospitality Management, 76, 53–60. https://doi.org/10.1016/j.ijhm.2018.06.003
- Hair, J. F., Hult, G. T. M., Ringle, C., Sarstedt, M., Danks, N., & Ray, S. (2023). Partial least squares structural equation modeling (PLS-SEM) using R: A workbook. Structural Equation Modeling: A Multidisciplinary Journal, 30(1), 165–167. https://doi.org/10.1080/10705511.2022.2108813
- Hair, J. F., Risher, J. J., Sarstedt, M., & Ringle, C. M. (2019). When to use and how to report the results of PLS-SEM. European Business Review, 31(1), 2–24. https://doi.org/10.1108/EBR-11-2018-0203
- Hair, J. F., & Sarstedt, M. (2019). Factors versus composites: Guidelines for choosing the right structural equation modeling method. Project Management Journal, 50(6), 619–624. https://doi.org/10.1177/8756972819882132
- Hair, J. F., Sarstedt, M., Ringle, C. M., & Gudergan, S. P. (2018). Advanced issues in partial least squares structural equation modeling (PLS-SEM). Thousand Oaks.
- Heine, K., Atwal, G., & He, J. (2019). Managing country-of-origin affiliations for luxury brand-building in China. Australasian Marketing Journal, 27(1), 14–23. https://doi.org/10.1016/j.ausmj.2018.09.001
- Henseler, J., Ringle, C. M., & Sarstedt, M. (2015). A new criterion for assessing discriminant validity in variance-based structural equation modeling. Journal of the Academy of Marketing Science, 43(1), 115–135. https://doi.org/10.1007/s11747-014-0403-8
- Ho, R. C., Amin, M., Ryu, K., & Ali, F. (2021). Integrative model for the adoption of tour itineraries from smart travel apps. Journal of Hospitality and Tourism Technology, 12(2), 372–388. https://doi.org/10.1108/JHTT-09-2019-0112
- Hsu, C. L., & Lin, J. C. C. (2016). Effect of perceived value and social influences on mobile app stickiness and in-app purchase intention. Technological Forecasting and Social Change, 108, 42–53. https://doi.org/10.1016/j.techfore.2016.04.012
- Huang, Y., & Qian, L. (2018). Consumer preferences for electric vehicles in lower tier cities of China: Evidences from south Jiangsu region. Transportation Research Part D: Transport and Environment, 63, 482–497. https://doi.org/10.1016/j.trd.2018.06.017
- Huang, Y., Qian, L., Tyfield, D., & Soopramanien, D. (2021). On the heterogeneity in consumer preferences for electric vehicles across generations and cities in China. Technological Forecasting and Social Change, 167, 120687. https://doi.org/10.1016/j.techfore.2021.120687
- Huang, S. S., & Wei, X. (2018). Chinese outbound travel: Understanding the socioeconomic drivers. International Journal of Tourism Research, 20(1), 25–37. https://doi.org/10.1002/jtr.2150
- Hung, N. T., Anh, L. H., Hien, D. T. T., & Hang, V. T. T. (2020). A studying on factors affecting decision to use smart tourism applications using extended TAM. WSEAS Transactions on Business and Economics, 17(May), 288–299. https://doi.org/10.37394/23207.2020.17.30
- Itani, O. S., Kassar, A. N., & Loureiro, S. M. C. (2019). Value get, value give: The relationships among perceived value, relationship quality, customer engagement, and value consciousness. International Journal of Hospitality Management, 80, 78–90. https://doi.org/10.1016/j.ijhm.2019.01.014
- İlkan, Ş. P., Öztüren, A., Avcı, T., & Irani, F. (2023). Mobile application features effects on the application’s engagement and intention for continuing use in tourism. Asia Pacific Journal of Tourism Research, 28(4), 386–400. https://doi.org/10.1080/10941665.2023.2230328
- Jahn, B., & Kunz, W. (2012). How to transform consumers into fans of your brand. Journal of Service Management, 23(3), 344–361. https://doi.org/10.1108/09564231211248444
- Jang, S., Kitchen, P. J., & Kim, J. (2018). The effects of gamified customer benefits and characteristics on behavioral engagement and purchase: Evidence from mobile exercise application uses. Journal of Business Research, 92, 250–259. https://doi.org/10.1016/j.jbusres.2018.07.056
- Jensen, Ø, Chen, J. S., & Korneliussen, T. (2015). Cultural-geographic influences of destination images: A case of Northern Norway. Advances in Hospitality and Leisure, 11, 3–19. https://doi.org/10.1108/S1745-354220150000011001
- Jeong, M., & Shin, H. H. (2020). Tourists’ experiences with smart tourism technology at smart destinations and their behavior intentions. Journal of Travel Research, 59(8), 1464–1477. https://doi.org/10.1177/0047287519883034
- Julien, H., Pecoskie, J. J. L., & Reed, K. (2011). Trends in information behavior research, 1999–2008: A content analysis. Library & Information Science Research, 33(1), 19–24. https://doi.org/10.1016/J.LISR.2010.07.014
- Jung, H., & Hwang, J. (2023). The information characteristics of YouTube tourism content and their impacts on user satisfaction and intention to visit and share information: The moderating role of word-of-mouth information acceptance. Asia Pacific Journal of Tourism Research, 28(2), 143–156. https://doi.org/10.1080/10941665.2023.2207692
- Kang, J. W., & Namkung, Y. (2019). The role of personalization on continuance intention in food service mobile apps: A privacy calculus perspective. International Journal of Contemporary Hospitality Management, 31(2), 734–752. https://doi.org/10.1108/IJCHM-12-2017-0783
- Kim, S. E., Lee, K. Y., Shin, S., & Yang, S. B. (2017). Effects of tourism information quality in social media on destination image formation: The case of Sina Weibo. Information and Management, 54(6), 687–702. https://doi.org/10.1016/j.im.2017.02.009
- Klimczuk, A., & Klimczuk-Kochańska, M. (2015). Technology transfer. In M. Odekon (Ed.), The SAGE Encyclopedia of World Poverty (2nd ed (pp. 1529–1531). SAGE Publications.
- Klimczuk, A., & Klimczuk-Kochańska, M. (2019). Core-periphery model. In S. Romaniuk, M. Thapa, & P. Marton (Eds.), The Palgrave Encyclopaedia of Global Security Studies (pp. 1–8). Springer International Publishing. https://doi.org/10.1007/978-3-319-74336-3_320-1.
- Kock, N., & Lynn, G. S. (2012). Lateral collinearity and misleading results in variance-based SEM: An illustration and recommendations. Journal of the Association for Information Systems, 13(7), 546–580. https://doi.org/10.17705/1jais.00302
- Krugman, P. (1991). Increasing returns and economic geography. Journal of Political Economy, 99(3), 483–499. https://doi.org/10.1086/261763
- Krugman, P. (1998). What’s new about the new economic geography? Oxford Review of Economic Policy, 14(2), 7–17. https://doi.org/10.1093/oxrep/14.2.7
- Krugman, P. (2011). The New Economic Geography, now middle-aged. Regional Studies, 45(1), 1–7. https://doi.org/10.1080/00343404.2011.537127
- Kullada, P., & Kurniadjie, M. C. R. (2021). Examining the influence of digital information quality on tourists’ experience. Journal of Quality Assurance in Hospitality and Tourism, 22(2), 191–217. https://doi.org/10.1080/1528008X.2020.1769522
- Kunming Government. (2021a). The cumulative disposable income per capita of all residents increased by 46.1%. https://www.km.gov.cn/c/2021-07-15/4002975.shtml
- Kunming Government. (2021b). The main data of the seventh national census of Kunming. https://www.km.gov.cn/c/2021-06-07/3968656.shtml
- Lai, I. K. W. (2015). Traveler acceptance of an app-based mobile tour guide. Journal of Hospitality and Tourism Research, 39(3), 401–432. https://doi.org/10.1177/1096348013491596
- Ledikwe, A. (2021). Determinants of behavioural intention towards travel applications in an emerging African economy: A perspective on the hospitality industry. African Journal of Hospitality, Tourism and Leisure, 10(6), 1882–1895. https://doi.org/10.46222/AJHTL.19770720.198
- Lee, Z. W. Y., Chan, T. K. H., Chong, A. Y. L., & Thadani, D. R. (2019). Customer engagement through omnichannel retailing: The effects of channel integration quality. Industrial Marketing Management, 77, 90–101. https://doi.org/10.1016/j.indmarman.2018.12.004
- Li, R., Luo, Z., Bilgihan, A., & Okumus, F. (2021). Marketing China to U.S. travelers through electronic word-of-mouth and destination image: Taking Beijing as an example. Journal of Vacation Marketing, 27, 267–286. https://doi.org/10.1177/1356766720987869
- Lim, X. J., Cheah, J. H., Morrison, A. M., Ng, S. I., & Wang, S. (2022). Travel app shopping on smartphones: Understanding the success factors influencing in-app travel purchase intentions. Tourism Review, 77(4), 1166–1185. https://doi.org/10.1108/TR-11-2021-0497
- Lim, X. J., Cheah, J. H., Ng, S. I., Basha, N. K., & Liu, Y. (2021). Are men from Mars, women from Venus? Examining gender differences towards continuous use intention of branded apps Journal of Retailing and Consumer Services, 60, 102422. https://doi.org/10.1016/j.jretconser.2020.102422
- Lin, S. Y., Juan, P. J., & Lin, S. W. (2020). A tam framework to evaluate the effect of smartphone application on tourism information search behavior of foreign independent travelers. Sustainability, 12(22), 9366. https://doi.org/10.3390/su12229366
- Lin, F., & Ryu, K. (2023). How product design affects repurchase intention, eWOM, and museum visit intention: Museum mystery boxes in China. Journal of Travel & Tourism Marketing, 40(5), 434–451. https://doi.org/10.1080/10548408.2023.2258154
- Liu, Y., Li, Q., Edu, T., & Negricea, I. C. (2023). Exploring the continuance usage intention of travel applications in the case of Chinese tourists. Journal of Hospitality and Tourism Research, 47(1), 6–32. https://doi.org/10.1177/1096348020962553
- Lu, J., Mao, Z., Wang, M., & Hu, L. (2015). Goodbye maps, hello apps? Exploring the influential determinants of travel app adoption Current Issues in Tourism, 18(11), 1059–1079. https://doi.org/10.1080/13683500.2015.1043248
- Lv, X., Zhang, R., Su, Y., & Yang, Y. (2022). Exploring how live streaming affects immediate buying behavior and continuous watching intention: A multigroup analysis. Journal of Travel & Tourism Marketing, 39(1), 109–135. https://doi.org/10.1080/10548408.2022.2052227
- Marafa, L. M., Chan, C. S., & Li, K. (2022). Market potential and obstacles for film-induced tourism development in Yunnan province in China. Journal of China Tourism Research, 18(2), 245–267. https://doi.org/10.1080/19388160.2020.1819498
- Mehrabian, A., & Russell, J. A. (1974). An approach to environmental psychology. The MIT Press.
- Mitra, S. K., Chattopadhyay, M., & Ali, S. (2022). Transforming tourism into a successful intervention strategy to decrease income inequality. Asia Pacific Journal of Tourism Research, 27(11), 1167–1178. https://doi.org/10.1080/10941665.2023.2166421
- Moher, D., Liberati, A., Tetzlaff, J., & Altman, D. G. (2009). Preferred reporting items for systematic reviews and meta-analyses: The PRISMA statement. BMJ, 339(7716), 332–336. https://doi.org/10.1136/BMJ.B2535
- Moon, M. A., Javaid, B., Kiran, M., Awan, H. M., & Farooq, A. (2018). Consumer perceptions of counterfeit clothing and apparel products attributes. Marketing Intelligence and Planning, 36(7), 794–808. https://doi.org/10.1108/MIP-11-2017-0272
- Morosan, C. (2021). An affective approach to modelling intentions to use technologies for social distancing in hotels. Information Technology and Tourism, 23(4), 549–573. https://doi.org/10.1007/s40558-021-00216-3
- National Bureau of Statistics. (2021). Communiqué of the Seventh National Population Census. http://www.stats.gov.cn/english/PressRelease/202105/t20210510_1817188.html
- National Bureau of Statistics of China. (2016). China statistical yearbook: 2016. http://www.stats.gov.cn/tjsj/ndsj/2016/indexeh.htm
- Oriade, A., & Schofield, P. (2019). An examination of the role of service quality and perceived value in visitor attraction experience. Journal of Destination Marketing and Management, 11, 1–9. https://doi.org/10.1016/j.jdmm.2018.10.002
- Pandža Bajs, I. (2015). Tourist perceived value, relationship to satisfaction, and behavioral intentions: The example of the Croatian tourist destination Dubrovnik. Journal of Travel Research, 54(1), 122–134. https://doi.org/10.1177/0047287513513158
- Pansari, A., & Kumar, V. (2017). Customer engagement: The construct, antecedents, and consequences. Journal of the Academy of Marketing Science, 45(3), 294–311. https://doi.org/10.1007/s11747-016-0485-6
- Petticrew, M., & Roberts, H. (2006). Systematic Reviews in the Social Sciences: A Practical Guide. Blackwell Publishing.
- Piccoli, G., Lui, T. W., & Grün, B. (2017). The impact of IT-enabled customer service systems on service personalization, customer service perceptions, and hotel performance. Tourism Management, 59, 349–362. https://doi.org/10.1016/j.tourman.2016.08.015
- Podsakoff, P. M., MacKenzie, S. B., & Podsakoff, N. P. (2012). Sources of method bias in social science research and recommendations on how to control it. Annual Review of Psychology, 63(1), 539–569. https://doi.org/10.1146/annurev-psych-120710-100452
- Rather, R. A. (2020). Customer experience and engagement in tourism destinations: The experiential marketing perspective. Journal of Travel and Tourism Marketing, 37(1), 15–32. https://doi.org/10.1080/10548408.2019.1686101
- Rauschnabel, P. A., He, J., & Ro, Y. K. (2018). Antecedents to the adoption of augmented reality smart glasses: A closer look at privacy risks. Journal of Business Research, 92, 374–384. https://doi.org/10.1016/j.jbusres.2018.08.008
- Reis, J., Melão, N., Salvadorinho, J., Soares, B., & Rosete, A. (2020). Service robots in the hospitality industry: The case of Henn-na hotel, Japan. Technology in Society, 63, 101423. https://doi.org/10.1016/j.techsoc.2020.101423
- Rianto, M. R., Sari, R. K., Sulistyowati, A., Handayani, M., & Woestho, C. (2020). Indonesian demographic bonus: Determinants of intention to use the cellular applications of tourism in Indonesia’s millennial generation. African Journal of Hospitality, Tourism and Leisure, 9(2), 1–13.
- Ringle, C. M., Wende, S., & Becker, J.-M. (2023). SmartPLS 4. Boenningstedt: SmartPLS. https://www.smartpls.com
- Sarstedt, M., & Cheah, J. H. (2019). Partial least squares structural equation modeling using SmartPLS: A software review. Journal of Marketing Analytics, 7(3), 196–202. https://doi.org/10.1057/s41270-019-00058-3
- Saunders, M., Lewis, P., & Thornhill, A. (2015). Research methods for business students (7th ed.). Pearson Education.
- Schiffman, L. G., & Wisenblit, J. (2019). Consumer behavior (12th ed.). Pearson Education.
- Seck, A. M., & Philippe, J. (2013). Service encounter in multi-channel distribution context: Virtual and face-to-face interactions and consumer satisfaction. Service Industries Journal, 33(6), 565–579. https://doi.org/10.1080/02642069.2011.622370
- Sharma, M., Antony, R., Sehrawat, R., Contreras, A., & Daim, T. U. (2022). Technology in Society Exploring post-adoption behaviors of e-service users : Evidence from the hospitality sector / online travel services. Technology in Society, 68, 101781. https://doi.org/10.1016/j.techsoc.2021.101781
- Shin, H. H., Jeong, M., & Cho, M. H. (2021). The impact of smart tourism technology and domestic travelers’ technology readiness on their satisfaction and behavioral intention: A cross-country comparison. International Journal of Tourism Research, 23(5), 726–742. https://doi.org/10.1002/jtr.2437
- Shmueli, G., Ray, S., Velasquez Estrada, J. M., & Chatla, S. B. (2016). The elephant in the room: Predictive performance of PLS models. Journal of Business Research, 69(10), 4552–4564. https://doi.org/10.1016/j.jbusres.2016.03.049
- Shmueli, G., Sarstedt, M., Hair, J. F., Cheah, J. H., Ting, H., Vaithilingam, S., & Ringle, C. M. (2019). Predictive model assessment in PLS-SEM: Guidelines for using PLSpredict. European Journal of Marketing, 53(11), 2322–2347. https://doi.org/10.1108/EJM-02-2019-0189
- Shukla, P., & Rosendo-Rios, V. (2021). Intra and inter-country comparative effects of symbolic motivations on luxury purchase intentions in emerging markets. International Business Review, 30(1), 101768. https://doi.org/10.1016/j.ibusrev.2020.101768
- Singh, N., Yu, J., Ramkissoon, H., Amponsah, M., & Han, H. (2023). Nature-based solution for state park travelers’ self-rated mental health, emotional well-being, and life satisfaction: Impact of national culture. Journal of Travel & Tourism Marketing, 40(1), 55–74. https://doi.org/10.1080/10548408.2023.2215251
- The Star. (2017). Single travel app with many handy features. https://www.thestar.com.my/lifestyle/travel/2017/09/16/traveloka-travel-app
- Starmass. (2022). China Tiered Cities. http://www.starmass.com/china-tiered-cities/
- The State Council. (2014). China to apply new city classification standards. http://english.gov.cn/policies/latest_releases/2014/11/25/content_281475015213546.htm
- Statista. (2021a). China: Per capita disposable income in urban areas by region. https://www.statista.com/statistics/278856/china-per-capita-annual-income-in-urban-areas-by-region/
- Statista. (2021b). Most popular travel apps among young travllers in China. https://www.statista.com/statistics/441307/china-most-popular-travel-apps-among-young-luxury-travelers/
- Statista. (2021c). Retention rate of travel apps worldwide. https://www-statista-com.ezproxy.gavilan.edu/statistics/1230130/retention-rate-travel-apps-globally/
- Statista. (2022a). App downloads in travel segment worldwide. https://www-statista-com.ezproxy.gavilan.edu/outlook/dmo/app/travel/worldwide#downloads
- Statista. (2022b). China: GDP of provincial capital cities 2021. https://www.statista.com/statistics/1099570/china-gross-domestic-product-gdp-of-provincial-capital-cities/
- Statista. (2022c). China: Per capita disposable income of urban households 2021. https://www.statista.com/statistics/278698/annual-per-capita-income-of-households-in-china/
- Statista. (2022d). Most popular business travel booking channels in China in 2022. https://www-statista-com.ezproxy.gavilan.edu/statistics/785469/china-sme-business-travel-booking-channels/
- Stone, M. (1974). Cross-validatory choice and assessment of statistical predictions. Journal of the Royal Statistical Society: Series B (Methodological), 36(2), 111–133. https://doi.org/10.1111/j.2517-6161.1974.tb00994.x
- Sun, P., Cárdenas, D. A., & Harrill, R. (2016). Chinese customers’ evaluation of travel website quality: A decision-tree analysis. Journal of Hospitality Marketing and Management, 25(4), 476–497. https://doi.org/10.1080/19368623.2015.1037977
- Tak, P., & Gupta, M. (2021). Examining travel mobile app attributes and its impact on consumer engagement: An application of S-O-R framework. Journal of Internet Commerce, 20(3), 293–318. https://doi.org/10.1080/15332861.2021.1891517
- Tseng, L. Y., Chang, J. H., & Zhu, Y. L. (2021). What drives the travel switching behavior of Chinese Generation Z consumers. Journal of Tourism Futures, 10, 131–146. https://doi.org/10.1108/JTF-07-2020-0110
- Turulja, L., & Činjarević, M. (2021). How customer-driven and vendor-driven information cues shape a travel app user behaviour? Journal of Hospitality and Tourism Technology, 12(4), 745–761. https://doi.org/10.1108/JHTT-02-2020-0044
- Vahdat, A., Alizadeh, A., Quach, S., & Hamelin, N. (2021). Would you like to shop via mobile app technology? The technology acceptance model, social factors and purchase intention Australasian Marketing Journal, 29(2), 187–197. https://doi.org/10.1016/j.ausmj.2020.01.002
- Vinod, B. (2020). The age of intelligent retailing: Personalized offers in travel for a segment of ONE. Journal of Revenue and Pricing Management, 20, 473–479. https://doi.org/10.1057/s41272-020-00265-z
- Wu, S., Ma, E., Wang, J., & Li, D. (2022). Experience with travel mobile apps and travel intentions—The case of university students in China. Sustainability, 14(19), 12603. https://doi.org/10.3390/su141912603
- Wu, S., Wong, I. K. A., & Lin, Z. (2021). Understanding the role of atmospheric cues of travel apps: A synthesis between media richness and stimulus–organism–response theory. Journal of Hospitality and Tourism Management, 49, 226–234. https://doi.org/10.1016/j.jhtm.2021.09.014
- Xiong, Z., Luo, L., & Lu, X. (2023). Understanding the effect of smart tourism technologies on behavioral intention with the stimulus-organism-response model: A study in Guilin, China. Asia Pacific Journal of Tourism Research, 28(5), 449–466. https://doi.org/10.1080/10941665.2023.2246598
- Yicai. (2022). Ranking of Cities 2022. https://www.yicai.com/news/101430366.html
- Yin, J., Qu, X., & Ni, Y. (2023). The power of culture: How it shapes tourists’ online engagement with destinations. Journal of Travel & Tourism Marketing, 40(3), 242–259. https://doi.org/10.1080/10548408.2023.2239854
- Zeljković, M. (2022). Urban-rural disparities in travel during the COVID-19 pandemic: The case study of Serbia. Erdkunde, 76(2), 111–125. https://doi.org/10.3112/erdkunde.2022.02.04
- Zhang, S. N., Li, Y. Q., Liu, C. H., & Ruan, W. Q. (2019). Critical factors in the identification of word-of-mouth enhanced with travel apps: The moderating roles of Confucian culture and the switching cost view. Asia Pacific Journal of Tourism Research, 24(5), 422–442. https://doi.org/10.1080/10941665.2019.1572630
- Zhang, S., Li, F., & Xiao, J. J. (2020). Internet penetration and consumption inequality in China. International Journal of Consumer Studies, 44(5), 407–422. https://doi.org/10.1111/ijcs.12575
- Zhao, S., & Liu, Y. (2023). Revenge tourism after the lockdown: Based on the SOR framework and extended TPB model. Journal of Travel & Tourism Marketing, 40(5), 416–433. https://doi.org/10.1080/10548408.2023.2256777
- Zhao, P., & Wan, J. (2021). Land use and travel burden of residents in urban fringe and rural areas: An evaluation of urban-rural integration initiatives in Beijing. Land Use Policy, 103, 105309. https://doi.org/10.1016/j.landusepol.2021.105309
- Zheng, D., Huang, C., & Oraltay, B. (2023). Digital cultural tourism: Progress and a proposed framework for future research. Asia Pacific Journal of Tourism Research, 28(3), 234–253. https://doi.org/10.1080/10941665.2023.2217958
- Zhou, T., Song, Y., & Zhou, P. (2022). Continued use intention of travel apps: From the perspective of control and motivation. Technology Analysis and Strategic Management, 34(6), 703–716. https://doi.org/10.1080/09537325.2021.1916457