Abstract
Atmospheric mercury emissions have attracted great attention owing to adverse impact of mercury on human health and the ecosystem. Although waste combustion is one of major anthropogenic sources, estimated emission might have large uncertainty due to great heterogeneity of wastes. This study investigated atmospheric emissions of speciated mercury from the combustions of municipal solid wastes (MSW), sewage treatment sludge (STS), STS with waste plastics, industrial waste mixtures (IWM), waste plastics from construction demolition, and woody wastes using continuous monitoring devices. Reactive gaseous mercury was the major form at the inlet side of air pollution control devices in all combustion cases. Its concentration was 2.0–70.6 times larger than elemental mercury concentration. In particular, MSW, STS, and IWM combustions emitted higher concentration of reactive gaseous mercury. Concentrations of both gaseous mercury species varied greatly for all waste combustions excluding woody waste. Variation coefficients of measured data were nearly equal to or more than 1.0. Emission factors of gaseous elemental mercury, reactive gaseous mercury, and total mercury were calculated using continuous monitoring data. Total mercury emission factors are 0.30 g-Hg/Mg for MSW combustion, 0.21 g-Hg/Mg for STS combustion, 0.077 g-Hg/Mg for STS with waste plastics, 0.724 g-Hg/Mg for industrial waste mixtures, 0.028 g-Hg/Mg for waste plastic combustion, and 0.0026 g-Hg/Mg for woody waste combustion. All emission factors evaluated in this study were comparable or lower than other reported data. Emission inventory using old emission factors likely causes an overestimation.
Although waste combustion is one of major anthropogenic sources of atmospheric mercury emission, estimated emission might have large uncertainty due to great heterogeneity of wastes. This study investigated speciated mercury emissions from the combustions of municipal solid wastes, sewage treatment sludge with/without waste plastics, industrial waste mixtures, waste plastics from construction demolition, and woody wastes using continuous monitoring devices. Reactive gaseous mercury was the major form in all combustion cases and its concentration in the gas had large fluctuation. All emission factors evaluated in this study were comparable or lower than other reported data. Emission inventory using old emission factors likely causes an overestimation.
Introduction
Since the outbreak of Minamata disease in 1953, mercury emission to the environment and adverse effects of mercury, in particular methylmercury, on human health and the ecosystem has attracted great attention. The biomagnification of mercury via the food chain, especially in fish, concentrates the toxicity of mercury and is a serious hazard to the biosphere (CitationHarada, 1995). The anthropogenic sources of mercury emissions to the environment, in particular the atmosphere, are principally metal productions and combustion processes (CitationVan Velzen et al., 2002). For example, copper and lead smelters, coal-fired power generation plants, cement kilns, medical waste combustors, municipal solid waste incinerators (MSWIs), and chloralkali plants are major sources (CitationPacyna and Pacyna, 2002). CitationPacyna et al. (2006) estimated the global atmospheric emission of mercury from anthropogenic sources to be 1912.8 Mg in 1995 and 2190 Mg in 2000, respectively. According to both inventories, about 50% of the global emission is released from Asian regions. CitationStreets et al. (2009) estimated 2390–4860 Mg of global mercury emission in 2050. Increasing global concerns about mercury have motivated United Nations Environment Programme to start a global assessment of mercury since 2001, which is targeting global atmospheric emission inventories with less uncertainty in order to assess adverse impacts of mercury precisely and establish international framework for appropriate management and control of mercury applications.
In Japan, about 19–35 Mg of mercury atmospheric emissions for 2002 were reported in a preliminary investigation conducted by CitationKida and Sakai (2005). However, this estimation includes considerable uncertainty of mercury emissions from cement manufacturing, steel production, nonferrous smelting, and waste combustions owing to limited data. In Japan, regarding mercury emissions, waste incineration is expected to be a major source because of the high incineration ratio of hazardous and nonhazardous wastes. In 2009, for example, 79% of municipal solid wastes (MSW) were combusted and 76% of industry-derived wastes were treated using volume-reduction processes, including dehydration and incineration. Therefore, this study focuses on atmospheric mercury emission from waste combustions to prepare more reliable mercury emission inventory in Japan. CitationTakahashi et al. (2008) investigated atmospheric mercury emission from the combustion of automobile shredder residues (ASR) using continuous mercury monitoring devices. Although thermal treatment of ASR, including incineration and melting, has been promoted dramatically in Japan, mercury emission from ASR combustion was estimated to be 2.2 kg/yr, which had a little impact on Japanese national mercury emission. Therefore, ASR combustion is not a significant emerging source of mercury emission. Continuous monitoring in ASR combustion showed large fluctuation of gaseous mercury concentration in flue gas. This suggests that batch-mode measurement of gaseous mercury with insufficient monitoring time might cause large uncertainty when mercury emission from the combustion of greatly heterogeneous materials such as ASR was measured. Continuous monitoring is likely better than batch-mode monitoring for heterogeneous waste combustions. As mentioned above, mercury emission from other significant waste combustion has still large uncertainty in Japanese mercury emission inventory. Therefore, this study focuses on municipal solid wastes (MSW), sewage treatment sludge (STS), industrial waste mixtures, plastic wastes from construction demolition, and woody wastes according to their large weight to be combusted. The objective of this study is to investigate mercury emission factors of these waste combustions using continuous monitoring devices.
Material and Methods
Continuous monitoring of gaseous speciated mercury
Gaseous elemental mercury and reactive gaseous mercury are measured every 10 sec using continuous monitoring devices (Nippon Instrument Co., MS-1A/DM-6B; Tokyo, Japan). This monitoring device consists of a wet-type pretreatment unit (MS-1A) and dual-beam cold vapor atomic absorption spectrometry (CVAAS) detectors (DM-6B). Because particulate dust was removed by silica filter attached in a sampling nozzle, measurement results do not include particulate mercury. Silicon tube for gas sampling was heated to keep more than 120 °C. At first, sampled gas was mixed with 1 M potassium chloride solution to separate gaseous elemental mercury and reactive gaseous mercury. In this mixing step, elemental mercury remained in the gas phase and reactive mercury was dissolved into liquid phase. After the mixing step, the gas containing only elemental mercury was washed by 1 M potassium hydroxide solution for the removal of interfering substances such as sulfur dioxide for mercury detection, and then sent to the detector. Potassium chloride solution was mixed with 1 wt% stannic chloride/10 wt% sulfuric acid solution to reduce dissolved reactive mercury to elemental one, which was vaporized to the gas phase. After the reduction/vaporization, the gas was sent to the detector after the rinse with 1 M potassium hydroxide solution. All reagents used in the pretreatment unit were analytical grade (Wako Co., Osaka, Japan; purity >99%). The detector measured ultraviolet absorbance at 253.65 nm, which is linearly related with mercury concentration. These separation and detection processes of the monitoring device was illustrated in Data reliability of the monitor (MS-1A/DM-6B) was verified by CitationNoda et al. (2006). Correlation between monitoring data and given mercury concentration in standard gas is illustrated in . Correlation between monitoring data and reference measurement results (Ontario-Hydro method and Japanese Industrial Standards K0222 [JIS K0222]) for simulated flue gas and actual coal combustion flue gas is also illustrated in . Except for reactive gaseous mercury concentration data of actual coal combustion flue gas, relative accuracy was always less than 10%. More detailed verification was conducted by Battelle (Columbus, OH, USA) in cooperation with U.S. Environmental Protection Agency (U.S. EPA; Research Park Triangle, NC, USA) for old-type continuous monitoring device (MS-1/DM-5) (CitationBattelle and U.S. EPA, 2003). Because there is no significant mechanical/analytical difference between the old-type monitoring device (MS-1/DM-5) and monitoring devices used in this study (MS-1A/DM-6B), the same performance can be expected for both monitoring devices. Monitoring data reliability, which was referred from CitationBattelle and U.S. EPA (2003), was briefly summarized below. Relative accuracy of monitoring results were 10.1% for gaseous elemental mercury and 11.2% total gaseous mercury based on 18 reference measurement results (Ontario-Hydro method), in which total gaseous mercury concentration ranged from less than 1.0 to 200 μg/m3 N. Determination coefficient (r 2) between monitoring results and reference measurement results were 0.989 for gaseous elemental mercury and 0.985 for total gaseous mercury. Precision of monitoring data was estimated using measurement data of two Ontario-Hydro sampling periods at Toxic Substances Control Act Incinerator (TSCAI) in Tennessee, USA. The maximum variability relevant with the monitoring device was 9.2% and relative standard deviation (RSD) was 17.3%. Sampling system bias was 0.0–6.6% at gaseous elemental mercury concentration of about 7–45 μg/m3. Response times for 95% rise and 95% fall of gaseous elemental mercury concentration were 2 min and approximately 3 min, respectively. Zero and calibration drift over 6 weeks' field monitoring were assessed by repeated analysis of zero mercury and standard elemental mercury gas. Averages of monitored data with standard deviation were 0.0 ± 0.1 μg/m3 for zero mercury gas. Twenty-four analyses of approximately 5.5 μg/m3 mercury gas yielded 10.6% of RSD. During the monitoring campaign in this study, detection unit was calibrated twice and glass vessels, in particular of mercury speciation process, were heated and cleaned three times by approximately 1000 mg/L potassium permanganate solution with 1% of sulfuric acid for absorbed mercury removal. In all monitoring, zero adjustment was operated at every 1 hr using the air, which passed though activated carbon absorber for complete mercury removal. Blank values were always 0.0 ± 0.1 μg/m3 N when the air was measured before and after flue gas monitoring.
Figure 1. Speciation process flow of gaseous mercury species in a continuous mercury monitor.
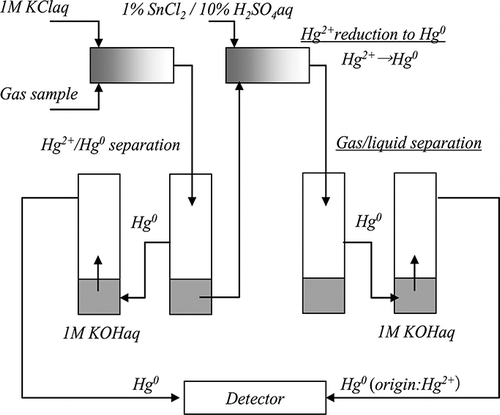
Figure 2. Correlation between monitoring data (MS-1A/DM-6B) and reference data referred from CitationNoda et al. (2006). (a) Monitoring data versus given mercury concentration in standard gas. (b) Monitoring data versus reference measurement results (Ontario-Hydro method and Japanese Industrial Standards K0222 [JIS K0222]) for simulated flue gas and actual coal combustion flue gas.
![Figure 2. Correlation between monitoring data (MS-1A/DM-6B) and reference data referred from CitationNoda et al. (2006). (a) Monitoring data versus given mercury concentration in standard gas. (b) Monitoring data versus reference measurement results (Ontario-Hydro method and Japanese Industrial Standards K0222 [JIS K0222]) for simulated flue gas and actual coal combustion flue gas.](/cms/asset/83f26d05-1884-4ab0-adbb-934e7629d31c/uawm_a_659329_o_f0002g.gif)
Waste combustions
Emissions of gaseous elemental mercury and reactive gaseous mercury from waste combustions on the laboratory scale and the industrial scale were measured using continuous monitoring devices. Mercury emissions from the combustions of municipal solid wastes (MSW), sewage treatment sludge (STS), STS with waste plastics, and industrial waste mixtures (IWM) were monitored in industrial-scale facilities. On the other hand, mercury emission from the combustions of waste plastics from construction demolition, and woody wastes were measured using the laboratory-scale incinerator. Industrial waste mixtures (IWM) included chemical process sludge, automobile shredder residues, alkaline and acidic wastewater, waste oil, waste plastics, and waste organic extractants. Two monitoring devices were located in inlet side and outlet side of air pollution control devices (APCDs). Monitoring times were 1–3 days for the industrial-scale waste combustions and about 3–6 hr for the laboratory-scale combustion experiment, respectively. The details of waste combustions including the type of combustion furnace, combustion conditions, and the type of APCDs are listed in All combustors, excluding an incinerator of industrial waste mixtures, used fabric filter (FF) as an air pollution control device. Dry sorbent and activated carbon were injected to FF system in all industrial-scale combustors for acid gas and dioxin emission control. In the laboratory-scale combustion experiments, dry sorbent was sprayed on the surface of FF. A combustor for industrial waste mixtures used wet scrubber and wet-type electrostatic precipitator (wet-ESP). In this gas treatment system, scrubbing water, which was alkaline for acidic gas removal, was used repeatedly to reduce water consumption.
Table 1. The type of combustors and incineration conditions
Results and Discussion
Concentrations of elemental and reactive mercury in flue gas
Continuous monitoring results of the combustions of MSW, STS, STS with waste plastics, industrial waste mixtures, waste plastics from construction demolition, and wood wastes were illustrated in and Average concentrations of gaseous elemental and reactive gaseous mercury, standard deviations, and medians are summarized in Average concentrations of gaseous elemental mercury and reactive gaseous mercury at the inlet side of APCDs in all combustion cases were 0.12–6.6 and 0.34–39 μg/m3 N, respectively. Measurement results at the inlet side of APCDs indicated that reactive mercury was emitted at 2.0–70.6 times higher concentration than elemental mercury in all combustion cases. In particular, total gaseous mercury concentrations in MSW, STS, and IWM combustions were higher than those of other combustions. Although plastics were expected to be one of major mercury emission sources, it emitted less amount of mercury than other wastes excluding woody wastes. In addition, the co-combustion of waste plastics during STS incineration decreased the emission of both gaseous elemental mercury and reactive gaseous mercury.
Table 2. Gaseous mercury concentrations in flue gas of waste combustions
Figure 3. Gaseous elemental and gaseous reactive mercury concentrations from industrial-scale waste combustions. (a) MSW; (b) STS; (c) STS with waste plastics; (d) industrial waste mixtures.
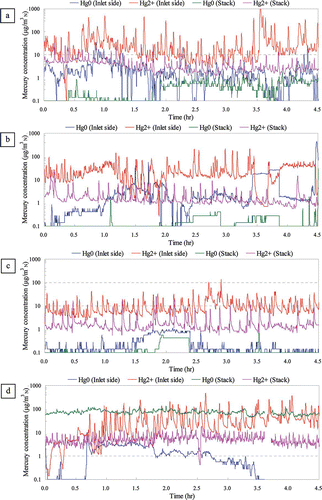
Figure 4. Gaseous elemental and gaseous reactive mercury concentrations from laboratory-scale waste combustions. (a) Waste plastics from construction demolition; (b) wood wastes.
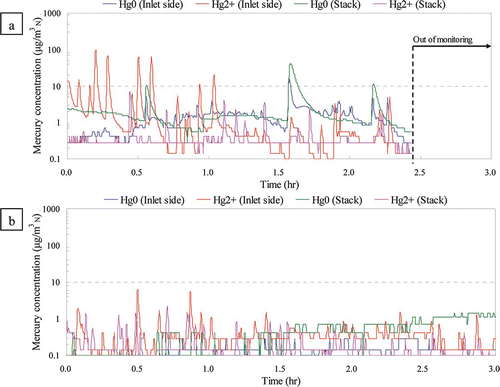
Continuous monitoring at the inlet side of APCDs showed great fluctuation of mercury concentrations in all waste combustions excluding woody wastes. Variation coefficients of measured data were nearly equal to or more than 1.0. Although these large fluctuations seem to be derived mainly from great heterogeneity of combusted wastes, large variation of mercury concentrations for STS combustions was an unexpected result because STS consisted of only dehydrated sludge and, therefore, was more homogeneous than other wastes. This might imply heterogeneous distribution of mercury in sewage treatment sludge.
Emission reduction efficiency of air pollution control devices
Emission reduction efficiencies of air pollution control devices for gaseous elemental mercury, reactive gaseous mercury, and total gaseous mercury were calculated based on the average concentration data listed in They are summarized in It should be noted that emission reduction efficiency for total gaseous mercury in the combustions of IWM and woody wastes were less than zero. In the case of IWM combustion, cyclic use of scrubbing water in gas treatment system caused negative removal efficiency. Although scrubbing water contained 40–55 μg/L of dissolved mercury during this monitoring campaign, it does not reflect directly to mercury emitted from IWM during the monitoring. Some or most of dissolved mercury was supplied before the monitoring. Considering chemical reduction of dissolved mercury in aquatic phase to elemental mercury by sulfite species (CitationLoon et al., 2000; CitationMunthe et al., 1991), the evaporation of elemental mercury from scrubbing water could explain higher concentration of gaseous elemental mercury in the stack than that at the inlet side of APCDs (see ) because scrubbing water contains rich sulfite species derived from gaseous acidic compounds. In addition, alkaline condition of scrubbing water likely promoted chemical reduction of dissolved divalent mercury to elemental mercury (CitationTokunaga, 1986). The transformation of reactive mercury to elemental form was also speculated for wet scrubber system of coal-fired power plants (CitationBrown et al., 1999; CitationChang and Ghorishi, 2003; CitationKilgroe et al., 2001). On the other hand, it is still difficult to explain negative value of emission reduction efficiency for total gaseous mercury and, in particular, gaseous elemental mercury in woody waste combustion. Non-negligible amount of elemental mercury might be adsorbed onto calcium carbonate layer on fabric filter surface during previous combustion experiments. If elemental mercury was re-evaporated from fabric filter surface during woody waste combustion, it would cause larger mass output of gaseous elemental mercury from APCDs than the input. However, this explanation needs the verification. Measurement data of elemental mercury concentration in the stack of IWM and woody waste combustions has large uncertainty. Therefore, it should be noted that emission factors (stack side) of IWM and woody waste combustion had correspondingly significant uncertainty.
Table 3. Mercury emission factors of waste combustions and emission reduction efficiencies of air pollution control devices (APCDs)
Emission reduction efficiencies of FF with dry sorbent and activated carbon injection were 90% in MSW combustions, 92% in STS combustion, and 82% in the combustion of STS with waste plastics. CitationTakahashi et al. (2010) estimated statistically emission reduction efficiency of FF with dry sorbent and activated carbon injection to be 76.6–85.9% as two-sided 95% confidence interval range. FF system in the combustion of MSW and STS removed gaseous mercury more effectively than their estimation. As summarized by CitationKrivanek (1996), the mechanisms of mercury removal in APCDs are very complicated and have still many unknown questions. Limited monitoring results make it difficult to explain higher emission reduction efficiency than reported estimates. Emission reduction efficiencies of FF in the combustion of waste plastics from construction demolition was 34%, which was within reported range (28.9–75.8%). This monitoring campaign gave emission reduction efficiency data for speciated gaseous mercury only in FF systems. Further study is necessary to investigate emission reduction efficiency in wet scrubber (WS) systems of various combustion sources from the viewpoint of mercury emission inventory.
Total mercury emission factors of waste combustions
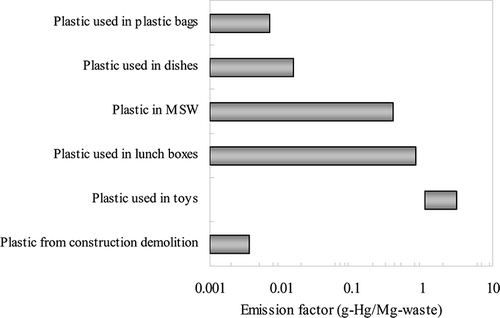
Total mercury emission factors of waste combustions were calculated using monitoring results at the inlet side of APCDs and in the stack. They are listed in It is noted again that emission factors (stack side) of IWM combustion and woody waste combustion had significant uncertainty. Emission factors of MSW and STS combustion calculated in this study and those of the same emission sources reported in other countries were compared in and It should be noted that emission factors of STS combustions, shown in , were dry sludge weight base. Assuming that all of mercury contained in plastic and wood are emitted during the combustion, emission factors of waste plastics and woody waste combustions estimated in this study were also compared with other reported data. These comparisons were illustrated in and Emission factors of MSW combustions have been reported with more than 1 order of magnitude ranges. The emission factor evaluated in this study was the lowest level excluding Korea (CitationKim et al., 2010) and England (CitationU.K. National Atmospheric Emissions Inventory [NAEI], 2009) data. Nonmercury policy for small-type batteries and separated collection system of mercury-containing products such as fluorescent lumps seem to contribute into the low emission factor, although it needs quantitative verification. Emission factor of STS combustion was also evaluated to be the lowest level compared with other reported data. These differences seem to be derived from sewage water collection system. In Japan, many sewage treatment facilities collect rainwater runoff from urban area. Therefore, sewage treatment sludge contains inorganic particulate matters such as road dusts. This decreases apparent mercury concentration in sewage treatment sludge, and thus emission factor. On the other hand, sewage treatment facility that CitationYasuda et al. (1983) investigated in Japan received only sewage water. Emission factor reported by CitationYasuda et al. (1983) was comparable to other data excluding this study's result. Emission factor of woody waste combustion estimated in this study is lower than other reported data. It is speculated that lower mercury concentration in wood materials tested in this monitoring campaign mainly causes this difference. suggests that emission factor can potentially increase to the same level as Czech (CitationCibulka et al., 1992) and Swedish (CitationKrook et al., 2004) cases when other woody wastes were tested. Emission factors of plastic combustion depend strongly on the type of plastics. The combustion of plastics used in toys was calculated to yield higher emission factor. More than 2 orders of magnitude different ranges of emission factors indicate the difficulty to evaluate representative emission factor of waste plastics combustions. For reliable estimation of mercury emission from plastic combustion, emission factors based on the type of plastics are necessary.
Figure 5. Emission factors of total gaseous mercury from MSW combustion: Japan (1) (CitationJung et al., 2004); Japan (2) (CitationKida and Sakai, 2003); Korea (CitationKim et al., 2010); the United States (CitationU.S. Environmental Protection Agency, 1997); England (CitationU.K. National Atmospheric Emissions Inventory [NAEI], 2009); Denmark (CitationBlinksbjerg, 1994); Austria (CitationSchachermayer et al., 1995); Switzerland (CitationBelevi, 1998); and Germany (CitationReimann, 2002).
![Figure 5. Emission factors of total gaseous mercury from MSW combustion: Japan (1) (CitationJung et al., 2004); Japan (2) (CitationKida and Sakai, 2003); Korea (CitationKim et al., 2010); the United States (CitationU.S. Environmental Protection Agency, 1997); England (CitationU.K. National Atmospheric Emissions Inventory [NAEI], 2009); Denmark (CitationBlinksbjerg, 1994); Austria (CitationSchachermayer et al., 1995); Switzerland (CitationBelevi, 1998); and Germany (CitationReimann, 2002).](/cms/asset/58933e21-c0ce-48a0-99b2-610a2b3c45a8/uawm_a_659329_o_f0005g.gif)
Figure 6. Emission factors of total gaseous mercury from STS combustion: Japan (CitationYasuda et al., 1983); the United States (CitationU.S. Environmental Protection Agency, 1997); England (CitationU.K. National Atmospheric Emissions Inventory [NAEI], 2009); Sweden (CitationEriksson, 2001); Germany (CitationSloss and Smith, 2000); and The Netherlands (CitationAmand and Leckner, 2004).
![Figure 6. Emission factors of total gaseous mercury from STS combustion: Japan (CitationYasuda et al., 1983); the United States (CitationU.S. Environmental Protection Agency, 1997); England (CitationU.K. National Atmospheric Emissions Inventory [NAEI], 2009); Sweden (CitationEriksson, 2001); Germany (CitationSloss and Smith, 2000); and The Netherlands (CitationAmand and Leckner, 2004).](/cms/asset/1529f866-44db-4b9b-8067-fa2c151e4448/uawm_a_659329_o_f0006g.gif)
Figure 7. Emission factors of total gaseous mercury from woody waste combustion: Japan (CitationAkiyama et al., 1981); England (CitationU.K. National Atmospheric Emissions Inventory [NAEI], 2009; CitationMiller et al., 2002); Czechoslovakia (CitationCibulka et al., 1992); and Sweden (CitationKrook et al., 2004).
![Figure 7. Emission factors of total gaseous mercury from woody waste combustion: Japan (CitationAkiyama et al., 1981); England (CitationU.K. National Atmospheric Emissions Inventory [NAEI], 2009; CitationMiller et al., 2002); Czechoslovakia (CitationCibulka et al., 1992); and Sweden (CitationKrook et al., 2004).](/cms/asset/e4eb308a-f930-47d7-9891-0309e64e7777/uawm_a_659329_o_f0007g.gif)
Figure 8. Emission factors of total gaseous mercury from plastic combustion: Plastics from construction demolition (this work); plastics used in toys (CitationAdelantado et al., 1993); plastics used in lunch boxes (CitationImai et al., 1993); plastics in MSW (CitationSakai, 1984); plastics used in dishes (CitationAkiyama et al., 1981); and plastics used in plastic bags (CitationNemoto and Noguchi, 1991).
Conclusion
Atmospheric mercury emissions from the combustions of municipal solid wastes (MSW), sewage treatment sludge (STS), waste plastics with STS, industrial waste mixtures (IWM), waste plastics from construction demolition, and woody wastes were measured using continuous monitoring devices. Major mercury species at the inlet side of air pollution control devices was reactive gaseous form in all combustion cases. Its concentration was 2.0–70.6 times higher than elemental mercury concentration. In particular, MSW, STS, and IWM combustions emitted higher concentrations of reactive gaseous mercury than other combustions did. Concentrations of both gaseous mercury species varied greatly for all waste combustions excluding woody wastes. Variation coefficients of measured data were nearly equal to or more than 1.0. These large fluctuations seem to be derived mainly from great heterogeneity of combusted wastes. Emission reduction efficiencies of FF with dry sorbent and activated carbon injection were 90% in MSW combustions, 92% in STS combustion, and 82% in the combustion of STS with waste plastics. They are a little bit more effective than the estimated range reported by CitationTakahashi et al. (2010) On the other hand, emission reduction efficiency of FF in the combustion of waste plastics (34%) was within reported range. Emission factors of gaseous elemental mercury, reactive gaseous mercury, and total mercury were calculated using continuous monitoring data. Total mercury emission factors are 0.30 g-Hg/Mg for MSW combustion, 0.21 g-Hg/Mg for STS combustion, 0.077 g-Hg/Mg for STS with waste plastics, 0.724 g-Hg/Mg for IWM combustion, 0.028 g-Hg/Mg for waste plastics combustion, and 0.0026 g-Hg/Mg for woody waste combustion. All emission factors evaluated in this study were comparable to or lower than other reported data. Emission inventory using old emission factors likely causes an overestimation.
Acknowledgments
This study was financially supported by Grant-in-Aid for Global Environmental Studies (K113001) of Japan Ministry of the Environment. The authors appreciated the support greatly.
Related Research Data
References
- Adelantado , J.V.G. , Martinez , V.P. , Reig , F.B. , Carbo , M.T.D. and Mossi , F.B. 1993 . Analysis of toxic elements in plastic components for toys: Multi-elemental determination by X-ray fluorescence . Anal. Chim. Acta , 276 : 39 – 45 .
- Akiyama , K. , Urabe , T. and Nishizawa , C. 1981 . Source investigation of hazardous materials in municipal solid wastes: Part II [in Japanese] . Bull. Tokyo Metrop. Res. Inst. Waste Manage. , 1979 : 1 – 27 .
- Amand , L.E. and Leckner , B. 2004 . Metal emissions from co-combustion of sewage sludge and coal/wood in fluidized bed . Fuel , 83 : 1803 – 1821 .
- Battelle and U.S. Environmental Protection Agency. 2003. ETV Joint Verification Statement; Continuous Emission Monitor/Measuring Mercury Emissions/MS-1/DM-5, Triangle Research Park, NC: Battelle and U.S. Environmental Protection Agency. http://epa.gov/etv/pubs/01_vs_nippon_ms1.pdf (http://epa.gov/etv/pubs/01_vs_nippon_ms1.pdf) (Accessed: 13 December 2011 ).
- Belevi , H. 1998 . Environmental Engineering of Municipal Solid Waste Incineration , Zurich : Hochschuleverlag AG an der ETH. Cited in Riber et al .
- Blinksbjerg , P. 1994 . APC on Danish Waste Incineration Plants [in Danish] , Soborg : dk-TEKNIK. Cited in Riber et al .
- Brown , T.D. , Smith , D.N. , Hargis , R.A. Jr. and O‘Dowd , W.J. 1999 . Mercury measurement and its control: What we know, have learned, and need to further investigated . J. Air Waste Manage. Assoc. , 49 : 628 – 640 .
- Chang , J.C.S. and Ghorishi , S.B. 2003 . Simulation and evaluation of elemental mercury concentration increase in flue gas across a wet scrubber . Environ. Sci. Technol. , 37 : 5763 – 5766 .
- Cibulka , J. , Turecki , T. , Miholova , D. , Mader , P. , Szakova , J. and Brabec , M. 1992 . Cadmium, lead and mercury levels in feeding yeast produced in Czechoslovakia . Sci. Total Environ. , 114 : 73 – 86 .
- Eriksson , J.H. 2001 . av 61 spårelement i avloppslam, stallgödsel, handelsgödsel, nederbörd samt jord och gröda [Concentrations of 61 trace elements in sewage sludge, manure from pigs and cattle, rain, soil and plants]. Report 5148 , Stockholm : Naturvårdsverket (Swedish Environmental Protection Agency) . Cited in Amand and Leckner
- Harada , M. 1995 . Minamata disease: Methylmercury poisoning in Japan caused by environmental pollution . Crit. Rev. Toxicol. , 25 : 1 – 24 .
- Imai , S. , Sugiyama , F. , Honda , T. , Urab , T. and Noguchi , T. 1993 . Hazardous element analysis of disposal lunch boxes made of plastics [in Japnese] . Bull. Tokyo Metrop. Res. Inst. Waste Manage. , 1991 : 80 – 87 .
- Jung , C.H. , Matsuto , T. , Tanaka , N. and Okada , T. 2004 . Metal distribution in incieration residues of municipal solid waste (MSW) in Japan . Waste Manage. , 24 : 381 – 391 .
- Kida , A. and Sakai , S. 2003 . Heavy metal emission reduction from municipal solid waste incinerator owing to dioxin control [in Japanese] . Environ. Chem. (Kankyou Kagaku) , 13 : 51 – 67 .
- Kida , A. and Sakai , S. 2005 . Mercury and environment: Preliminary estimation of mercury emission inventories for Japan's air [in Japanese] . Waste Manage. Res. (Haikibutshu Gakkaishi) , 16 : 191 – 203 .
- Kilgroe , J.D. , Sedman , C.B. , Srivastava , R.K. , Ryan , J.V. , Lee , C.W. and Thorneloe , S.A. 2001 . Control of Mercury Emissions from Coal-Fired Electric Utility Boilers: Interim Report , Research Triangle Park , NC : U.S. Environmental Protection Agency . EPA-600/R-01-109 (NTSB PB2002-105701)
- Kim , J.H. , Park , J.M. , Lee , S.B. , Pudasainee , D. and Seo , Y.C. 2010 . Anthropogenic mercury emission inventory with emission factors and total emission in Korea . Atmos. Environ. , 44 : 2714 – 2721 .
- Krivanek , C.S. III . 1996 . Mercury control technologies for MWC's: The unanswered questions . J. Hazard. Mater. , 47 : 119 – 136 .
- Krook , J. , årtensson , A. M and Eklund , M. 2004 . Metal contamination in recovered waste wood used as energy source in Sweden . Resour. Conserv. Recy. , 41 : 1 – 14 .
- Loon , L.V. , Mader , E. and Scott , S.L. 2000 . Reduction of the aqueous mercuric ion by sulfite: UV spectrum of HgSO3 and its intramolecular redox reaction . J. Phys. Chem. A , 104 : 1621 – 1626 .
- Miller , B.B. , Dugwell , D.R. and Kandiyoti , R. 2002 . Partitioning of trace elements during the combustion of coal and biomass in a suspension-firing reactor . Fuel , 81 : 159 – 171 .
- Munthe , J. , Xiao , Z.F. and Lindqvist , O. 1991 . The aqueous reduction of divalent mercury by sulfite . Water Air Soil Pollut , 56 : 621 – 630 .
- Nemoto , H. and Noguchi , T. 1991 . Elemental component analysis of new products [in Japanese] . Bull. Tokyo Metrop. Res. Inst. Waste Manage. , 1989 : 134 – 141 .
- Noda , N. , Itoh , S. , Tanida , K. and Hoshino , M. 2006 . Development of continuous speciation monitor of mercury [in Japanese] . Rigaku J. , 37 : 34 – 39 .
- Pacyna , E.G. and Pacyna , J.M. 2002 . Global emission of mercury from anthropogenic sources in 1995 . Water Air Soil Pollut. , 137 : 149 – 165 .
- Pacyna , E.G. , Pacyna , J.M. , Steenhuisen , F. and Wilson , S. 2006 . Global anthropogenic mercury emission inventory for 2000 . Atmos. Environ. , 40 : 4048 – 4063 .
- Reimann , D.O. 2002 . Content of Harmful Compounds in Residual Waste at MHKW Bamberg , 117 – 128 . Neuruppin : Ersatzbrenstoffe 2. TK Verlag Karl Thromekozminesky . [in German] Cited in Riber at al
- Riber , C. , Fredriksen , G.S. and Christensen , T.H. 2005 . Heavy metal content of combustible municipal solid waste in Denmark . Waste Manage. Res. , 23 : 126 – 132 .
- Sakai , Y. 1984 . Heavy metal substance flow in municipal solid waste combustors [in Japanese] . J. Japan Waste Manage. Assoc. , 37 : 181 – 192 .
- Schachermayer , E. , Bauer , G. , Ritter , E. and Brunner , P.H. 1995 . Measurement of Material and Substance Balance at a Waste Incineration Plant [in German] , Umweltbundesamt, (German Federal Environment Agency), Wine : Monographien Bd. 56. Dessau . Cited in Riber at al. Schachermayer et al
- Sloss , L.L. and Smith , I.M. 2000 . “ Trace element emission ” . In Report CCC/34, chapter 4 , London : IEA Coal Research . Cited in Amand and Leckner
- Streets , D.G. , Zhang , Q. and Wu , Y. 2009 . Projections of global mercury emissions in 2050 . Environ. Sci. Technol. , 43 : 2983 – 2988 .
- Takahashi , F. , Kida , A. and Shimaoka , T. 2010 . Statistical estimate of mercury removal efficiencies for air pollution control devices of municipal solid waste incinerators . Sci. Total Environ. , 408 : 5472 – 5477 .
- Takahashi , F. , Yamagata , M. , Yasuda , K. and Kida , A. 2008 . Impact of mercury emissions from incineration of automobile shredder residue in Japan . Appl. Geochem. , 23 : 584 – 593 .
- Tokunaga , S. 1986 . Some observations on the loss of mercury from aqueous solutions . Anal. Sci. , 2 : 89 – 90 .
- U.K. National Atmospheric Emissions Inventory (NAEI). 2009. Emission factors database. http://naei.defra.gov.uk/emissions/index.php (http://naei.defra.gov.uk/emissions/index.php) (Accessed: 2 August 2011 ).
- U.S. Environmental Protection Agency . 1997 . Locating and Estimating Air Emissions from Sources of Mercury and Mercury Compounds (L&E document) , Research Triangle Park , NC : U.S. Environmental Protection Agency . EPA-454/R-97-012
- Van Velzen , D. , Langenkamp , H. and Herb , G. 2002 . Review: Mercury in waste incineration . Waste Manage. Res. , 20 : 556 – 568 .
- Yasuda , K. , Ohtsuka , Y. and Kaneko , M. 1983 . Heavy metal emissions from wastes incineration: Mercury emission from sludge combustions [in Japanese] . J. Japan Soc. Air Pollut. , 18 : 286 – 290 .