Abstract
To assess the impact of past, current and proposed air quality regulations on coarse particulate matter (CPM), the concentrations of CPM mass and its chemical constituents were examined in the Los Angeles Basin from 1986 to 2009 using PM data acquired from peer-reviewed journals and regulatory agency database. PM10 mass levels decreased by approximately half from 1988 to 2009 at the three sampling sites examined- located in downtown Los Angeles, Long Beach and Riverside. Annual CPM mass concentrations were calculated from the difference between daily PM10 and PM2.5 from 1999 to 2009. High CPM episodes driven by high wind speed/stagnant condition caused year-to-year fluctuations in the 99th/98th percentile CPM levels. The reductions of average CPM levels were lower than those of PM10 in the same period, therefore the decrease of PM10 level was mainly driven by reductions in the emission levels of PM2.5 (or fine) particles, as demonstrated by the higher annual reduction of average PM2.5 (0.92 µg/m3) compared with CPM (0.39 µg/m3) from 1999 to 2009 in downtown Los Angeles despite their comparable concentrations. This is further confirmed by the significant decrease of Ni, Cr, V, and EC in the coarse fraction after 1995. On the other hand, the levels of several inorganic ions (sulfate, chloride and to a lesser extent nitrate) remained comparable. From 1995 to 2008, levels of Cu, a tracer of brake wear, either remained similar or decreased at a smaller rate compared with elements of combustion origins. This differential reduction of CPM components suggests that past and current regulations may have been more effective in reducing fugitive dust (Al, Fe and Si) and combustion emissions (Ni, Cr, V, and EC) rather than CPM from vehicular abrasion (Cu) and inorganic ions (NO3 −, SO4 2− and Cl−) in urban areas.
Limited information is currently available to provide the scientific basis for understanding the sources and physical and chemical variations of CPM, and their relations to air quality regulations and adverse health effects. This study investigates the historical trends of CPM mass and its chemical components in the Los Angeles Basin to advance our understanding on the impact of past and current air quality regulations on the coarse fraction of PM. The results of this study will aid policy makers to design more targeted regulations to control CPM sources to ensure substantial protection of public health from CPM exposure.
Supplemental materials are available for this article. Go to the publisher's online edition of the Journal of the Air & Waste Management Association for (1) details of the sampling sites and (2) the daily concentrations of high CPM/PM10 episodes.
Introduction
The U.S. Environmental Protection Agency (EPA) established the National Ambient Air Quality Standards (NAAQS) for ambient particulate matter (PM) to protect human health and public welfare under the jurisdiction of U.S. Clean Air Act. The standard of total suspended particle (TSP) was first introduced in 1971. In 1987, the EPA replaced the TSP standard by the PM10 (particles smaller than 10 μm in aerodynamic diameter) standard to control respirable particles. PM2.5 (particles smaller than 2.5 μm in aerodynamic diameter) standards were promulgated in 1997 to specifically regulate fine particles that are able to penetrate deeper into the respiratory tract. Currently, coarse particulate matter (PM10–2.5, herein referred as CPM) is regulated using PM10 standards. However, due to the different sources, and formation/removal mechanisms of fine and coarse particles, the PM10 standard may not be an appropriate measure to control the coarse fraction of PM. In contrast to the combustion origins of fine particles in the Los Angeles Basin, CPM is primarily derived from mechanical processes such as grinding and erosion. Major components of CPM include crustal material, sea salt, and biological material, as well as particles of anthropogenic sources such as fugitive and road dust, and secondarily formed ions (CitationCheung et al., 2011a; CitationKoulouri et al., 2008; CitationSillanpaa et al., 2006; CitationTerzi et al., 2010). In the last decade, a significant body of new research has documented substantive differences of fine and coarse particles, and there is a growing evidence of health effects induced by CPM (CitationChen et al., 2005; CitationYeatts et al., 2007). As a result, the need for a new PM10–2.5 standard was proposed in a recent review (2006) of NAAQS (U.S. CitationEPA, 2006). The proposed PM10–2.5 standard was suggested to be 65–85 μg/m3, in the form of a 98th percentile, and it was intended to be generally equivalent to the 1987 24-hr PM10 standard (150 μg/m3, with a 99th percentile form). Due to the different sources and size distribution of PM in urban and rural areas, the proposed CPM standard would impact these areas differently. Nonetheless, the effects of the proposed standard on industrial and agricultural communities, as well as local regulatory agencies, are largely unknown.
The study described here examines the trend of CPM mass concentration and chemical composition in the Los Angeles Basin over the past two decades, as well as the implications of the proposed PM10–2.5 standard given the nature and sources of PM components in the basin. The Los Angeles Basin is located in Southern California, and is the second most populous metropolitan area in the United States. The basin is served by the nation's largest port complex, a large freight and passenger rail infrastructure, numerous airports, and an extensive network of freeways and highways. Due to its local topography and meteorological conditions, heavy reliance on vehicles and traffic activity from the ports, Los Angeles is ranked among the worst cities for ozone and particulate pollution (CitationAmerican Lung Association, 2011), and has been an area of active air quality research. Studies examining characteristics of ambient aerosols across the basin have been conducted since the 1940s (CitationNeiburger and Wurtele, 1949), and a large body of historical PM data is available from regulatory agencies and academic institutes. Additionally, the contribution of coarse particle to PM10 is relatively high (on average 33–58%) in Los Angeles (CitationGauderman et al., 2000; CitationPakbin et al., 2010) compared with several other large US metropolitan areas (2004), thereby making it feasible to study coarse particle trends/composition with lower uncertainty. All of these provide a unique opportunity to examine the historical trends of coarse particle in this basin, which will allow us to assess how the CPM fraction has been impacted by past and current air quality regulations, as well as implications of the proposed standards.
Methodology
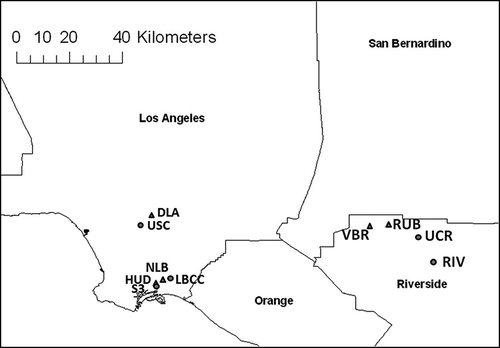
To study the CPM trend in the Los Angeles Basin, three representative areas (downtown Los Angeles, Long Beach, and Riverside) were selected based on the availability of historical data sets. shows a map of the sampling sites in the three regions. Geographical coordinates of sampling sites are provided in in the supplemental materials. Downtown Los Angeles (sites DLA and USC) is a typical urban area with high commercial and traffic activity. The downtown area is characterized by dense freeway networks and a high volume of both heavy- and light-duty vehicles. DLA is a monitoring site maintained by the South Coast Air Quality Management District (SCAQMD) and is located within 900 m of freeways I-5 and I-110. The other site in Los Angeles (USC) is located about 150 m east of I-110. Long Beach (sites HUD, NLB, LBCC, and S3) is a mixed residential and commercial neighborhood. The sampling sites in Long Beach are in close vicinity to the Port of Los Angeles and Port of Long Beach, and are highly influenced by heavy-duty diesel vehicle traffic related to harbor activity. NLB and HUD are maintained by the SCAQMD. NLB is located approximately 600 m north of I-405 and 1.2 km east of I-710. HUD is about 100 m east of Terminal Island Freeway and 1.2 km west of I-710. LBCC is located at the campus of Long Beach City College approximately 2.5 km north of I-405. The S3 site was one of the sampling sites in a study that examined size-segregated PM in communities of the Los Angeles Harbor (CitationArhami et al., 2009), and it is about 900 m south of the HUD site. Riverside (sites VBR, RUB, UCR, and RIV) is a suburban area located 80 km inland and downwind of Los Angeles, and is generally considered to be a receptor site for pollutants generated in urban Los Angeles and advected to the area within a few hours after their emissions. VBR and RUB are SCAQMD monitoring sites located about 2.5 km and 800 m south of CA-60, respectively. The UCR site is situated at the Citrus Research Center and Agricultural Experiment Station of the University of California, Riverside, and it is upwind of surrounding freeways. RIV is located at a retirement home that is 15 km southeast of downtown Riverside.
Table 1. Samping location, sampling time and frequency, sampling instrument and method, analytical method, and other background information of the seven studies analyzed
Figure 1. Map of the samplings sites in downtown Los Angeles (DLA and USC), Long Beach (NLB, HUD, LBCC, and S3), and Riverside (RUB, VBR, UCR, and RIV). Sites operated and maintained by the SCAQMD are represented in triangles.
The CPM mass concentration data presented in were calculated as the difference between PM10 and PM2.5 levels (the subtraction method). Daily PM10 and PM2.5 measurements were obtained from the online database of California Air Resources Board (CARB). The three sampling sites (DLA, NLB, and RUB) used in this analysis were maintained by SCAQMD, and the details of the sampling methods are described under Title 40 Part 58 of Code of Federal Regulations. In brief, daily PM2.5 measurements were quantified gravimetrically using sequential samplers operating at 16.7 L/min (Andersen Model Reference Ambient Air Sampler 2.5–300; Andersen Instruments Inc., Smyrna, GA), loaded with a 2-μm Teflon substrate. PM10 measurements were determined gravimetrically using high-volume samplers (Sierra Andersen/General Metal Works Model 1200; Sierra Andersen, Smyrna, GA, and General Metal Works, Cleves, OH) loaded with a quartz microfiber filter. Daily PM10 concentrations from 1988 to 2009 were analyzed. PM2.5 measurements were only available after 1999, and daily CPM mass concentrations were calculated from 1999 to 2009 using the subtraction method when both measurements were available for the same day. Note that the reported mass concentrations were collected using samplers with no denuders. The distinct flow rates used in the PM10 and PM2.5 samplers might contribute to the differential loss of semivolatile compounds, in additional to other sampling artifacts that could be different in the two samplers. Since the majority of semivolatile compounds resides in the fine PM fraction (CitationMiguel et al., 2004;CitationYoshizumi and Hoshi, 1985), the estimation of CPM using the subtraction method (calculated based on reported concentrations from the low-volume-PM2.5 sampler and the high-volume-PM10 sampler) might have underestimated the mass concentrations of coarse particles. Nonetheless, the sampling artifacts of semivolatile organics are likely to be reduced by the long sampling time (24 hr) and higher mass loadings (CitationSardar et al., 2005; CitationMader et al., 2003). On the other hand, due to the stronger removal process of CPM compared with fine PM, coarse particles could be more spatially heterogeneous (CitationPakbin et al., 2010), and the extrapolation of this analysis to other air basins needs to be proceeded with cautions. Daily PM10 levels were generally measured once every 6 days, with an average yearly count of 59 ± 3.5, 85 ± 27, and 57.8 ± 3.4 from 1988 to 2009 in downtown Los Angeles, Riverside, and Long Beach, respectively. The higher number count in Riverside was driven by the more frequent measurements (once every 3 days) from 2000 to 2009. PM2.5 was measured more frequently, with an average annual measurement count of 305 ± 58, 308 ± 56, and 303 ± 60 from 1999 to 2009 in DLA, RUB, and NLB, respectively. The higher standard deviation was driven by the lower count in year 1999 when the measurements first started.
Figure 2. Annual concentrations of (a) PM10 from 1988 to 2009 and (b) CPM/PM2.5 from 1999 to 2009 in downtown Los Angeles.
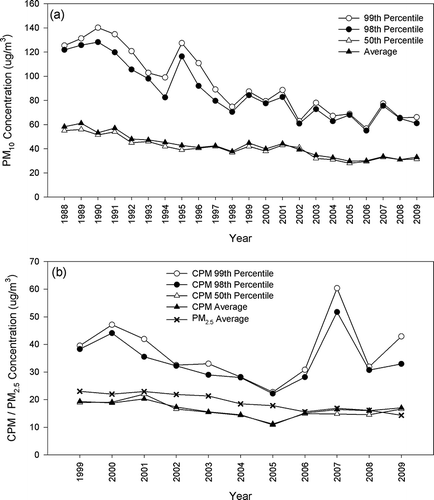
Figure 3. Annual concentrations of (a) PM10 from 1988 to 2009 and (b) CPM/PM2.5 from 1999 to 2009 in Long Beach.
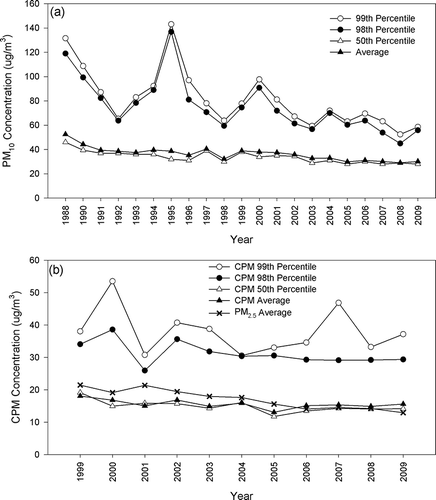
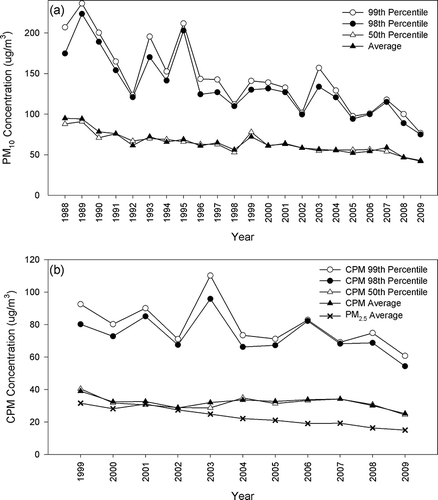
Figure 4. Annual concentrations of (a) PM10 from 1988 to 2009 and (b) CPM/PM2.5 from 1999 to 2009 in Riverside.
Concentrations of CPM mass and chemical constituents presented in were obtained from studies fully or in part published in the peer-reviewed literature before 2010. Although a number of studies have examined the chemical composition of ambient PM in Los Angeles, very few of them report data for coarse particles (or allow the calculation of such). Seven studies, providing chemical speciation of elemental species, were included in our analyses. The earliest study that performed chemical speciation on both PM10 and PM2.5 in the Los Angeles Basin was conducted in 1986. The year-long data set was available at CARB (CitationSolomon et al., 1988), and part of the PM data were published in peer-reviewed literature (CitationEldering et al., 1991; CitationSolomon et al., 1989, Citation1992). Shortly after, CitationChow et al. (1994) conducted an intensive study in 1987 to capture photochemical episodes in warmer periods (June to September) and stagnation episodes in cooler periods (November to December). A more comprehensive project was carried out by the SCAQMD from January 1995 to February 1996 to investigate the chemical composition of ambient PM10 and PM2.5 in an effort to better characterize emission inventories and improve performance of modeling tools (CitationKim et al., 2000a, Citation2000b). From 2000 to 2009, a few additional studies were conducted in Los Angeles, Long Beach, and Riverside to examine the chemical composition of size-fractionated airborne PM to advance the understanding of the sources, atmospheric processing of ambient particles, and their human health impacts (CitationArhami et al., 2009; CitationPolidori et al., 2009; CitationSardar et al., 2005). In 2008, a comprehensive investigation on ambient CPM was conducted to study the chemical mass closure, as well as the spatial and temporal variations of CPM in the Los Angeles Basin (CitationCheung et al., 2011a, Citation2011b; CitationMoore et al., 2010; CitationPakbin et al., 2010, Citation2011). summarizes the sampling location, sampling time and frequency, sampling instrument and method, analytical method, and other background information of each study. CPM concentrations were obtained using the difference between reported PM10 and PM2.5 levels in the three earlier studies (CitationChow et al., 1994; CitationKim et al., 2000a; CitationSolomon et al., 1988). The more recent studies employed samplers segregating particles by size, and CPM concentrations and chemical composition were obtained directly as measured in the coarse fraction (CitationArhami et al., 2009; CitationCheung et al., 2011a; CitationPolidori et al., 2009; CitationSardar et al., 2005).
Figure 5. CPM concentrations of (a) mass, organic, and elemental carbon, and inorganic ions; (b) elements of crustal origins; and (c) elements of anthropogenic origins in downtown Los Angeles. Error bars show standard errors of the average when available.
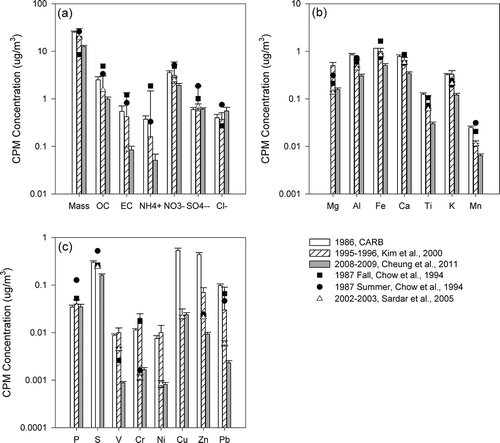
Figure 6. CPM concentrations of (a) mass, organic and elemental carbon, and inorganic ions; (b) elements of crustal origins; and (c) elements of anthropogenic origins in Long Beach. Error bars show standard errors of the average when available.
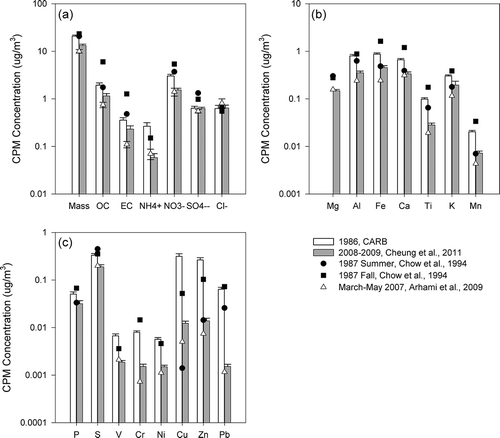
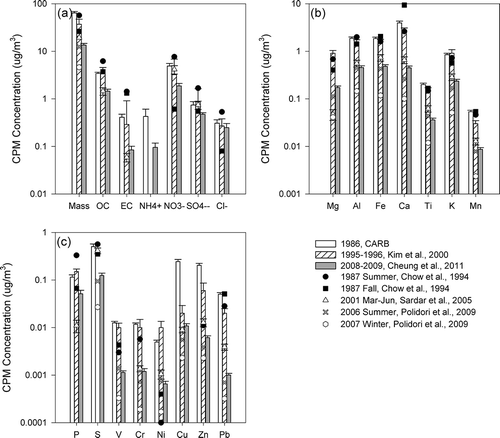
Figure 7. CPM concentrations of (a) mass, organic and elemental carbon, and inorganic ions; (b) elements of crustal origins; and (c) elements of anthropogenic origins in Riverside. Error bars show standard errors of the average when available.
Results and Discussion
Trends in CPM mass concentrations
shows selected meteorological parameters at the downtown Los Angeles (DLA), Long Beach (NLB), and Riverside (RUB) sampling sites, respectively. This information was acquired from the online database of CARB; only data after 1994 were available at the three sampling sites. The annual averages of temperature and relative humidity were calculated based on hourly data. Overall, annual average temperatures were consistent (average = 17.9 °C, standard deviation = 0.81 °C) from 1994 to 2009, whereas higher year-to-year fluctuations (average = 59.3%, standard deviation = 11%) were observed for the relative humidity (RH). In general, the annual average temperature and relative humidity was similar in Los Angeles and Long Beach. Riverside's inland location was highlighted by the higher average temperature and standard deviation, coupled with the lower relative humidity. Wind originating from the west dominated most of the year, in accordance with the typical onshore flow patterns in the Los Angeles Basin. The prevailing westerly onshore wind from the Pacific Ocean started in late morning and remained strong until evening. At night, wind direction reversed and the northerly/northeasterly wind prevailed. The wind speed was generally lower overnight. Overall, large-scale meteorological conditions were relatively consistent in this basin, and did not appear to influence the observed PM trends, as discussed and presented below.
Table 2. Selected meteorological parameters from 1994 to 2009 in (a) downtown Los Angeles, (b) Long Beach, and (c) Riverside
In downtown Los Angeles, the 99th percentile for PM10 () and CPM () ranges from 56.7 to 88.6 μg/m3 and from 22.7 to 60.4 μg/m3, respectively, from 1999 to 2009. The spike in the 99th and 98th percentiles in 2007 was driven by 2 days of high CPM concentrations (69 and 51 μg/m3 in April and October, respectively), as shown in in supplemental materials. The PM10 level was in attainment of the federal 24-hr standard (150 μg/m3) but in violation of the California standard (50 μg/m3) throughout the entire study period. Since the current PM10 standard is expressed in the 99th percentile form and the proposed CPM standard is set in the 98th percentile form, their comparability is examined. The difference between the 99th and 98th percentiles is more apparent in the early 1990s, with insignificant difference after 1998. The average and median PM10 concentrations agree fairly well. The slope of the 99th percentile concentration is 3.71 μg/m3, with a R 2 of 0.82 (), indicating an average annual decrease of 3.71 μg/m3 of the 99th percentile PM10 mass concentration from 1988 to 2009. The corresponding reduction is 1.33 μg/m3 for the average PM10 concentration. CPM levels did not exhibit the typically consistent decreasing trend observed in the PM10 data. The slope of the average CPM concentration is −0.39 μg/m3 (P = 0.11) from 1999 to 2009 (corresponding slopes are −1.33 μg/m3 and −0.92 μg/m3 for PM10 and PM2.5, respectively, both with a P value of less than 0.001), indicating that the reduction of PM10 is mostly driven by the decrease of PM2.5 given the comparable levels of fine and coarse PM (average annual fine-to-coarse ratio = 1.18 ± 0.21 from 1999 to 2009). To investigate the degree of equivalency between the current PM10 and the proposed PM10–2.5 standards, the number of exceedances was examined using the 99th percentile of PM10 level and the 98th percentile of the CPM level from 1999 to 2009. In both cases, zero violations were observed. For further comparisons of the two standards, the ratio of the annual PM level to the corresponding standards (i.e., calculated as the annual 99th percentile PM10 to 150 μg/m3 for the PM10 standard and the annual 98th percentile CPM to 70 μg/m3 for the CPM standard) was examined. Using the data from 1999 to 2009, the ratios for the current PM10 and proposed PM10–2.5 standards were 0.48 ± 0.12 and 0.48 ± 0.07, respectively, suggesting that the two standards are comparable in downtown Los Angeles.
Table 3. Linear regression analysis of PM data (PM10 from 1988 to 2009, PM10-2.5 and PM2.5 from 1999 to 2009) in (a) downtown Los Angeles, (b) Long Beach, and (c) Riverside
In Long Beach, the 99th percentile PM10 level experienced a fluctuating decreasing trend with a R 2 of 0.46, as shown in . The spike in 1995 was driven by an episode of high PM10 level from mid-November to early December, as illustrated in . The wind speed during that period was relatively low with more than 70% of the time with “calm” conditions (wind speed less than 0.5 m/sec). It is possible that the high PM10 levels were due to the low dispersion of the emissions generated from the nearby harbor activity. The 99th percentile PM10 level ranges from 52.5 to 143.1 μg/m3 from 1988 to 2009, attaining the EPA standard but violating the California standard. The decreasing trend of the average PM10 levels exhibits a high R 2 of 0.72 from 1988 to 2009 ( and ). However, the average PM10 reduction rate is lower in the last 5 years, as evident by the lower slope of −0.14 μg/m3 (standard error = 0.25 μg/m3) from 2005 to 2009. Similarly, the average CPM concentration was not significantly reduced from 1999 to 2009, as demonstrated by the close to zero slope (m = −0.22 μg/m3, P = 0.07) in , in contrast to the significant reduction in PM2.5 levels (m = −0.87 μg/m3, P < 0.001). The sampling site in Long Beach is heavily impacted by the Port's traffic activity. In addition to particle resuspension by wind, CPM is also re-entrained into the atmosphere by traffic-induced turbulence (CitationPakbin et al., 2010). Heavy-duty vehicles generally induce higher roadway resuspension than light-duty vehicles (CitationCharron and Harrison, 2005). Therefore, it is likely that the effort of PM reduction has been counterbalanced by the increase in the number of heavy-duty vehicles resulted by the expansion and increasing activity of the Los Angeles ports, as the container volume grew from 1 million in 1985 to 7.8 million in 2010 at the Port of Los Angeles. In Long Beach, none of the recorded PM10 and calculated CPM levels violated the current federal PM10 and proposed CPM standards. The ratios of the 99th percentile PM10 and 98th percentile CPM to the current PM10 and proposed PM10–2.5 standards were 0.46 ± 0.08 and 0.45 ± 0.05, respectively, again demonstrating that the two standards are comparable in Long Beach.
Due to its downwind receptor location and suburban nature, PM10/CPM mass concentrations in Riverside were higher than those observed in Los Angeles. The 99th percentile PM10 concentration () was higher than the federal 24-hr standard of 150 μg/m3 in 1988–1991, 1993–1995, and 2003, and experienced a moderately fluctuating downward trend from 1988 to 2009 (R 2 = 0.67; ). This is probably due to the suburban nature of the area, where high level of PM10 is mostly driven by particle resuspension in episodes of high wind speed (CitationCheung et al., 2011a; CitationPakbin et al., 2010). As shown in , the average PM10 level experienced a more consistent reduction with a R 2 of 0.75. From 1999 to 2009, the reduction of average PM10 was largely driven by the decrease in fine PM concentrations (m = −1.69 μg/m3, P < 0.001), with a minor contribution from CPM (m = −0.57 μg/m3, P = 0.08). The slopes of the 99th percentile and average PM10 concentrations are −5.38 and −1.76 μg/m3, respectively, from 1988 to 2009. The reduction of CPM mass concentration is significantly lower than that observed in the PM10 ( and ), and the trend is more variable, although, overall, a decreasing trend is seen as evident by the negative slopes of −2.36 and −0.57 for the 99th percentile and average CPM levels, respectively. The relatively low coefficient of determination in the 99th percentile (R 2 = 0.32) is driven by the spike in 2003, due to a week of high CPM levels in October (91.0, 96.3, and 111 μg/m3 on October 21, 24, and 27, respectively). In Riverside, where the contribution of coarse particles to PM10 is generally higher than in Los Angeles and Long Beach due to the high levels of crustal materials in the suburban area (CitationCheung et al., 2011a), the proposed PM10–2.5 standard was not equivalent with the current PM10 standard. Using the data from 1999 to 2009, the annual 99th percentile PM10 level was higher than the current PM10 standard of 150 μg/m3 only in 2003. However, the annual 98th percentile CPM level was higher than the proposed CPM standard of 70 μg/m3 5 times (1999–2001, 2003, and 2006) from 1999 to 2009, suggesting that the proposed standard is more stringent than the existing standard in areas dominated by coarse particles, and that Riverside could be in frequent violations with the proposed PM10–2.5 standard.
Trends in chemical CPM components
Whereas CPM mass concentrations provide a metric of the overall mass reduction of coarse particles, the examination of CPM chemical composition provides insights on changes in the contribution of different sources to coarse particles, and may thus assist regulatory agencies in the design and implementation of more effective air quality strategies to protect public health. present concentrations of CPM chemical constituents, including organic and elemental carbon, elements, and inorganic ions in downtown Los Angeles, Long Beach and Riverside, respectively. Note that the analyses described below focused on the study conducted in 1986 (CitationSolomon et al., 1988), 1995–1996 (CitationKim et al., 2000b), and 2008–2009 (CitationCheung et al., 2011a), all of which compiled comprehensive CPM data sets of 1 year or more, and their results are presented as bar charts in . Although sampling of the three year-long studies was conducted not daily, but rather once every 3rd, 6th, or 7th day, the long sampling period was likely to diminish the impact of temporal variation, and could therefore provide a more representative characterization of CPM. Other studies that were conducted in shorter time frames/smaller spatial scales were shown as line plots, and their results were likely to be influenced by seasonal variations of ambient CPM. Studies conducted before and after 1995 are represented by black and open symbols, respectively.
Mineral dust
Many studies have shown that mineral and road dust are major components of CPM, contributing to 22–65% of CPM mass concentrations in studies conducted in Los Angeles, Athens, Helsinki, Amsterdam, and Eastern Mediterranean (CitationCheung et al., 2011a; CitationKoulouri et al., 2008; CitationSillanpaa et al., 2006). Mineral dust comprises largely of eroded soil particles that have been mobilized and resuspended into the atmosphere by wind and anthropogenic activities. Industrial activities, such as construction and cement plant operations, may contribute to the emission and resuspension of dust. Si, Al, and Fe are the three most abundant major elements in the upper continental crust (CitationUsher et al., 2003) and thereby may serve as tracers of mineral dust (CitationLough et al., 2005; CitationPakbin et al., 2011). It should be noted that although Fe in the coarse fraction arises predominantly from crustal materials, it could be enriched from anthropogenic sources such as brake wear in urban areas (CitationGarg et al., 2000). Other crustal-dominated elements include Na, Ca, Ti, K, Mn, and Mg, and their abundances vary depending on location and rock type. The decreasing trends of crustal materials were very consistent in the last two decades. From 1986 to 1995, levels of coarse particulate Al, Fe, and Ti decreased by 34%, 15%, and 20%, respectively, in downtown Los Angeles. Further reductions were observed from 1995 to 2008, when Al, Fe, and Ti concentrations were reduced by 46%, 49%, and 70%, respectively. Such reduction trends were reinforced by the data from CitationSardar et al. (2005), where sampling was conducted from 2002 to 2003 and the average concentrations of Al, Fe, and Ti stayed between those from CitationKim et al. (2000a) and CitationCheung et al. (2011a) The contribution of crustal materials and trace elements to CPM mass were higher in Riverside (54.7%) compared with Los Angeles (42.6%) (CitationCheung et al., 2011a). In Riverside, CPM Al and Ti concentrations were reduced by 19% and 25%, respectively, from 1986 to 1995, where the corresponding reductions were 70% and 76% from 1995 to 2008. In 1986, the SCAQMD implemented Rule 1112.1 to limit PM emissions from cement kilns. Rule 1186 was adopted in 1997 to reduce the re-entrainment of fugitive dust of PM10 emissions from paved and unpaved roads as well as livestock operations. This rule requires owners and operators of paved public roads to remove visible roadway accumulations within 72 hr of notifications. It also requires the paving or stabilization of heavily used unpaved public roads or the reduction of vehicular speed on such roads. In 2005, Rule 1157 was introduced to control PM10 emissions from aggregate and related operations by reducing various dust sources from loading, unloading, and transferring activities, process equipment, paved and unpaved roads inside the facilities, etc. The use of dust suppressants or other control methods is required during transfer and loading activities. The observed high reductions of mineral dust could be due to the effectiveness of these regulations in reducing the sources and levels of resuspension of dust particles.
Combustion emissions from vehicles, industries, and ships
Although particles from combustion sources mostly reside in the fine mode, the “upper tail” of that source function can extend to the lower range of the CPM fraction. For example, CitationHuang and Yu (2008) demonstrated that elemental carbon (EC), a tracer of vehicular emissions, experienced a bimodal pattern in both ambient and tunnel environments, with a major fine mode and a minor coarse mode. Studies conducted in the Los Angeles Basin in the 20th century also demonstrated that, although dominant in the fine PM fraction, metals emitted by combustion sources could also contribute to a minor fraction of CPM (CitationKrudysz et al., 2008; CitationSingh et al., 2002).
The tailpipe emissions of CPM is often associated with high emitting and poorly controlled vehicles (CitationKleeman et al., 1999). In downtown Los Angeles, CPM elemental carbon was reduced from an annual average level of 0.55 μg/m3 to 0.42 μg/m3 from 1986 to 1995 (23% reduction), and further to 0.08 μg/m3 (80% reduction) from 1995 to 2008 (). The sampling sites in Riverside were located in residential areas adjacent to major roadways, and again, a similar reduction trend was observed (29% reduction from 1986 to 1995 and 71% reduction from 1995 to 2008) (). The U.S. EPA requires automobiles of 1975 model year and after to be equipped with catalytic converters to control tailpipe emissions. In 1984, the Smog Check Program was implemented in California. In addition to various emission standards adopted for light-duty vehicles, heavy-duty diesel trucks, and bus engines in the 1990s, a number of programs were developed to remove the older and more polluting cars from the road. For example, California's Carl Moyer Program has provided funding to encourage the retrofit and replacement of diesel engines in an effort to reduce emissions from diesel-powered vehicles and equipment. In the last decade, the SCAQMD also adopted/amended a few rules to promote cleaner on-road vehicles used by the public sector. The high reductions of EC, particularly after the 1990s, highlight the effectiveness of various controls implemented by the regulatory agencies to control tailpipe emissions.
In addition to tailpipe emissions, industrial activities also serve as potential sources of CPM in this basin. Metal processing facilities could emit high levels of heavy metals, including Fe, Cu, Zn, As, Cd, and Pb (CitationNewhook et al., 2003). In particular, smelters could release metals in the coarse size range either as stack or fugitive emissions (CitationChan et al., 1983; CitationHarrison and Williams, 1983), and could contribute to the high levels of Cu, Zn, and Pb in 1986 as shown in . In 1992, the SCAQMD adopted Rule 1420 to reduce emissions of lead—one of the six criteria pollutants identified by the U.S. EPA. This regulation requires all emission points of a lead-processing facility (including facilities that produce lead oxide, brass, and bronze) to be vented to an emission collection system. Furthermore, facilities are required to conduct air quality monitoring at their property lines, in addition to the source-oriented monitors placed by the SCAQMD at or beyond the facilities' fence lines. The high reductions of Cu, Zn, and Pb from 1986 to 1995 (96%, 84%, and 69%, respectively, in downtown Los Angeles) could largely result from the effective control of emissions from metal processing facilities.
Oil refinery is also a major source of industrial emissions. Various coarse elements, including Pb, Ce, La, Zn, V, Cu, Co, and to a lesser extent Cr, Ni, and Mo, could be emitted from refinery fluid catalytic cracking stacks (CitationCampa et al., 2011). Using principal component analyses, CitationPakbin et al. (2011) showed that CPM-bound Ni and Cr are markers of industrial emissions, with V originating from ship emissions in the Los Angeles/Long Beach Harbor based on coarse particles sampled from 2008 to 2009. In general, the lower concentrations of these elements in the coarse mode support that they originate from combustion sources in this basin. In downtown Los Angeles, the reductions of V, Cr, and Ni were higher from 1995 to 2008 (>90% reduction calculated using 1995 and 2008 data), compared with those from 1986 to 1995 (). In Riverside, the corresponding reductions of Ni, Cr, and V were 93%, 88%, and 89%, respectively, from 1995 to 2008, consistent with the observations in downtown Los Angeles. The significant reductions after 1995 could be resulting from series of regulations targeted to control emissions from stationary sources, as evident by the reductions in PM10 emissions from industrial processes and manufacturing and industrial sources from 1995 to 2010 according to the emission inventory of the South Coast Air Basin acquired from CARB. For example, Rule 1105.1, aiming to reduce PM10 and ammonia emissions from fluid catalytic cracking units used in petroleum refineries, was adopted in 2003. Additionally, the Los Angeles/Long Beach ports approved an incentive program that promotes the use of cleaner-burning fuel in cargo ships transiting within 40 miles of the Bay and at berth in 2008. Note that the efforts to control ship emissions began in the early 20th century, consistent with the historical trend of vanadium, which experienced similar annual averages in 1986 and 1995, with higher reduction rates from 1995 to 2008. Therefore, the high reductions of Ni, V, and Cr after 1995 could be due to various programs and incentives that aim to reduce combustion-related emissions from vehicles and industries, as well as the efforts to reduce ship emissions from harbor activity.
CPM-bound lead (Pb) also decreased considerably in the Los Angeles Basin. Pb could originate from brake wear and wheel weights, gasoline exhaust, and oil combustion as the extended upper tail of the fine PM mode, as well as metal processing industries (CitationHarrison and Williams, 1983; CitationIsakson et al., 2001; CitationPakbin et al., 2011). In downtown Los Angeles, Pb levels have decreased from an annual mean of 0.097 μg/m3 to 0.030 μg/m3 from 1986 to 1995, and further to 0.0023 μg/m3 in 2008. As discussed previously, the early reduction of Pb could be resulted from Rule 1420, which was adopted in 1992 aiming to control lead emissions. The latter reduction (after 1995) could partly be attributed to the complete elimination of the sales of leaded fuel for use in on-road vehicles in 1996. In Long Beach, ships (CitationIsakson et al., 2001) and refineries emissions (CitationNewhook et al., 2003) could also be potential sources of lead. The reduction in CPM lead concentrations in Long Beach was comparable to those observed in downtown Los Angeles (0.064 μg/m3 in 1986 to 0.0015 μg/m3 in 2007). Recent studies (CitationPakbin et al., 2011; CitationRoot, 2000), including a study of CPM in Los Angeles and Long Beach conducted in 2008, indicated that Pb is now predominantly sourced from vehicular abrasion. Therefore, it is likely that the Pb reductions in the last two decades were largely driven by the phase-out of Pb in gasoline vehicles, as well as controlled emissions from various industries as discussed previously.
Vehicle abrasion
Particles originating from vehicular abrasion contribute to road dust PM, though the mass-fraction is typically small. Cu, which is present in brake linings as lubricants, is often used as tracers of brake wear in areas where industrial emission of Cu is not significant (CitationLin et al., 2005; CitationPakbin et al., 2011). Note that the high concentrations of Cu in 1986 likely resulted from emissions of metal processing industries, as discussed in the previous section, and therefore Cu might not be a reliable tracer of brake wear back in the 1980s. Nonetheless, a recent study in the Los Angeles Basin suggested that majority of coarse particulate Cu was generated from the wear of brake linings based on CPM sampled from 2008 to 2009. Despite the considerable decrease of elements from combustion origins from 1995 to 2008 (CitationPakbin et al., 2011), the reduction of Cu was less significant in the same period. In Los Angeles, the higher annual average concentrations of Cu in 2008 compared with the 1995 levels could be due to the increased emissions from tire and brake wear from the greater number of both light-duty and heavy-duty vehicles on the road. The contribution of anthropogenic sources to elements, including Cu, is generally higher in Los Angeles and Long Beach than Riverside (CitationCheung et al., 2011a). From 1995 to 2008, the lower reduction of Cu (46%) relative to other CPM species with anthropogenic origins (89%, 88%, and 93% for V, Cr, and Ni, respectively) in Riverside further confirms the lower reduction of non-tailpipe mobile source emissions. The reduction of Cu might also be a “side benefit” as a result of the high reduction of mineral dust in Riverside.
Inorganic ions
In general, reductions of CPM inorganic ions were relatively lower than combustion related CPM due to their natural origins and, to a lesser extent, secondary formation. Nitrate is the most abundant inorganic species in the coarse fraction, accounting for an average of 17% of CPM mass in this basin (CitationCheung et al., 2011a). In the Los Angeles Basin, nitrate is primarily formed by sea salt depletion, a process involving the reaction of nitric acid with sodium chloride (CitationZhuang et al., 1999), and to a lesser extent the reactions with mineral dust and the condensation of alkaline salts on CPM surfaces when sea salt levels are low (CitationCheung et al., 2011b). In downtown Los Angeles and Riverside, the level of nitrate was reduced by 13% and 34%, respectively, from 1986 to 1995, whereas corresponding reductions were 38% and 42% from 1995 to 2008. Substantial efforts have been made to reduce emissions of nitrogen oxides, as demonstrated by the reduction of nitrogen oxides (NOx) emissions from 1561 tons per day (TPD) in 1985 to 1332 TPD in 1995 and 742.2 TPD in 2010 in the South Coast Air Basin (Emission Inventory of CARB). In addition to the regulations to control mobile emissions as described previously, the SCAQMD has adopted a few rules to control NOx emissions from stationary sources, including boilers and process heaters from refineries, cement kilns, gas melting furnaces, and stationary gas turbines. Since 2001, the Los Angeles ports incorporated a voluntary vessel speed reduction program with the objective of reducing both NOx and PM emissions by decreasing the vessel's speed to 12 knots near the ports. The control of NOx emissions may have an indirect effect on the reduction of coarse particulate nitrate by limiting the levels of its precursors, which could also decrease the CPM-bound nitrate associated with the hygroscopic growth of nitrate originally in the fine PM mode (CitationGeller et al., 2004; CitationSeinfeld and Pandis, 2006). In addition, the reduction of mineral dust, which could serve as a reaction site for nitrate (CitationUsher et al., 2003), might have also indirectly reduced the levels of nitrate in CPM. Sulfate, on the other hand, has several potential sources, namely water-soluble gypsum and sea salt sulfate, as well as the upper tail of ammonium sulfate, and the reduction was insignificant. Chloride, primarily originating from sea salt in the coarse mode, is used as a tracer of fresh sea salt aerosols. Cl− levels increased from 0.37μg/m3 in 1995 to 0.55 μg/m3 in 2008 in downtown Los Angeles. This could be due to yearly variations in sea salt level, as well as the reduction in nitrogen oxides emissions, which decreased the rate of sea salt depletion and increased the levels of unreacted chloride.
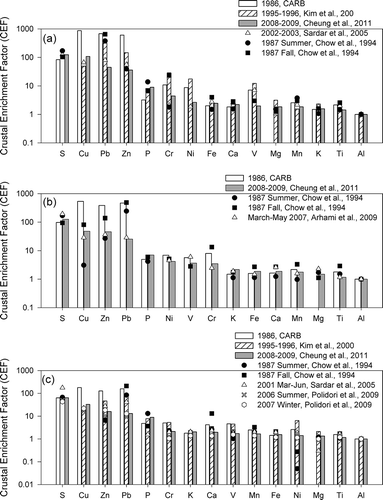
Crustal enrichment factors
The use of crustal enrichment factors (CEFs) allows for an examination of the contributions of anthropogenic versus crustal sourced elements associated with CPM in current and earlier measurements in this basin (CitationLawson and Winchester, 1979). In general, elements with CEFs close to 1 are indicative of crustal origins, whereas higher CEFs (>10) are considered to originate from sources other than crustal materials. To calculate CEF, the CPM concentration of each element was normalized to Al and then divided by its relative abundance to Al in the upper continental crust (UCC) acquired from CitationTaylor and McLennan (1985). CitationPolidori et al. (2009) studied the size-fractionated indoor and outdoor CEFs at four retirement homes located in San Gabriel Valley (east of downtown Los Angeles and west of Riverside) and Riverside in 2006 to 2007. In general, CEFs were higher in San Gabriel Valley than Riverside. S, Cu, Zn, Mo, and Pb were the elements with CEFs >10 in the coarse mode in all four retirement homes, whereas the CEFs of Na, Ba, Cr, and Ni were high only in the three San Gabriel sites. In the comprehensive CPM study conducted at 10 samplings sites in Los Angeles from 2008 to 2009 (CitationCheung et al., 2011a), the investigators found higher CEFs in Los Angeles and Long Beach than Riverside for most of the elements examined, highlighting the higher contribution of anthropogenic sources to CPM in urban Los Angeles. Sb and Sn, commonly used as lubricants in brake pads (CitationChan and Stachowiak, 2004), were the most highly enriched elements (CEFs >100) in all the 10 sampling sites, highlighting the impact of brake wear in the coarse mode.
shows the CEFs for selected elements measured at each study in downtown Los Angeles, Long Beach, and Riverside, respectively. Across the three regions, the highest CEFs were found for S, Cu, Zn, and Pb. Sulfur has various sources in the coarse mode, including mineral dust, sea salt, secondary formation, and lubricants in brake pads. The comparable CEFs of sulfur in both spatial and temporal terms suggest that past air quality regulations were not effective in controlling all sources, or that the reduction of one source has been counterbalanced by the increased contribution from other sources. Most of the regulations targeted particulate emissions of combustion origins and were therefore more likely to reduce the levels of fine particles as opposed to those in the coarse fraction. Natural PM sources are not the targets of controls, as evident by the comparable levels of chloride particles—a tracer of sea salt—in the last few decades. Therefore, the reduction of sulfur originating from sea salt might be insignificant. The CEFs of Pb were reduced by more than an order of magnitude from 1986 to 2008, due to the regulations to control the level of Pb in gasoline as well as emissions from ships and industries. In downtown Los Angeles, Pb, Zn, Cu, Cr, Ni, and V all exhibited CEFs >10 in the 1986 and 1995 data sets. In 2008, Cu, Pb, and Zn were the only elements that had CEFs of 10 or higher, suggesting that ship and industrial emissions, the dominant sources of Cr, Ni, and V, were no longer a significant contributor to CPM in downtown Los Angeles in recent years. Although fewer studies were conducted in Long Beach, the limited data show a consistent pattern to that observed in downtown Los Angeles. Sulfur, along with elements generated from vehicular abrasion such as Cu, are the major anthropogenic components of CPM particles in 2008. CEFs of anthropogenic elements were much higher in the relatively stagnant conditions in Long Beach in 1987 (CEF = 81, 138, and 486 for Cu, Zn, and Pb, respectively) (CitationChow et al., 1994), likely due to the enhancement of particle resuspension by heavy-duty vehicle–induced turbulences when wind speed and mixing height was low. The lower CEFs of Ni and V in 1987 in Long Beach were unexpected given the proximity of this sampling site to the ports, where oil combustion and refinery emissions are major sources of PM in this area (CitationKrudysz et al., 2008). In general, CEFs were lower in Riverside than downtown Los Angeles and Long Beach, consistent with its suburban nature. S, Cu, Zn, and Pb were the most enriched (CEFs >10) elements in Riverside. The more recent 2008 data set shows that the CEFs of Zn and Pb have gone down after 1995, whereas the CEFs of Cu and S remained comparable from 1995 to 2008. Note that road dust is a mixture of natural dust and anthropogenic materials. Therefore, the reduction of enrichment factor could be due to the increased contribution of road dust compared with other anthropogenic sources that contained lower levels of Al. In general, the CEFs were higher in cooler periods than warmer periods, as demonstrated in both the studies by CitationChow et al. (1994) and CitationPolidori et al. (2009), in which seasonal variations were examined. This further confirms that traffic-induced turbulence becomes a source of resuspended material in winter when the mixing height is lower, consistent with the results from a study that observed higher contribution from vehicular emissions in cooler periods in this basin (CitationPakbin et al., 2011).
Figure 8. Crustal enrichment factors in (a) downtown Los Angeles, (b) Long Beach, and (c) Riverside.
Summary and Conclusions
Overall, PM10 mass concentration has decreased by approximately half from 1988 to 2009 since the PM10 standard was put in place in 1987. PM10 daily concentrations from downtown Los Angeles and Long Beach show compliance with the federal EPA PM10 standard, while violating the more stringent California standard. These two sites also demonstrated equivalency for the current PM10 and proposed PM10–2.5 standards. On the other hand, both PM10 and CPM levels were higher in Riverside as highlighted by some violations of the federal standards in late 1980s and early 1990s. This site also demonstrates that the proposed CPM standard is more stringent than the current PM10 standard. The reduction trends of combustion-related CPM namely EC, V, Cr, and Ni were higher after 1995, consistent with the implementation of PM2.5 standard in 1997. The CEF of Cu, a tracer of brake wear, has remained comparable or increased after 1995, suggesting that the contribution of brake wear to CPM has become more significant despite the overall reduction in CPM mass since 1995. In general, the reduction of CPM mass was mostly driven by the reduction of mineral dust, whereas reduction of contributions from inorganic ions and non-tailpipe vehicular emission were less significant from 1995 to 2008.
uawm_a_661382_sup_24639940.doc
Download MS Word (204 KB)Acknowledgments
The authors would like to acknowledge the support of the Science to Achieve Results program of the EPA (EPA-G2006-STAR-Q1). The authors would also like to thank Bong-Mann Kim at the South Coast Air Quality Management District for providing supplementary information regarding his project.
References
- American Lung Association. 2011. State of the air http://www.stateoftheair.org (http://www.stateoftheair.org) (Accessed: 30 November 2011 ).
- Arhami , M. , Sillanpaa , M. , Hu , S.H. , Olson , M.R. , Schauer , J.J. and Sioutas , C. 2009 . Size-segregated inorganic and organic components of pm in the communities of the Los Angeles harbor . Aerosol Sci. Technol. , 43 : 145 – 160 .
- Campa , A.M.S.D.L. , Moreno , T. , Rosa , J.D.L. , Alastuey , A. and Querol , X. 2011 . Size distribution and chemical composition of metalliferous stack emissions in the san roque petroleum refinery complex, southern Spain . J. Hazard. Mater. , 190 : 713 – 722 .
- Chan , D. and Stachowiak , G.W. 2004 . Review of automotive brake friction materials . Proc. Inst. Mech. Eng. Part D J. Automobile Eng. , 218 ( D9 ) : 953 – 966 .
- Chan , W.H. , Vet , R.J. , Lusis , M.A. and Skelton , G.B. 1983 . Airborne particulate size distribution measurements in nickel smelter plumes . Atmos. Environ. , 17 : 1173 – 1181 .
- Charron , A. and Harrison , R.M. 2005 . Fine (PM2.5) and coarse (PM2.5–10) particulate matter on a heavily trafficked London highway: Sources and processes . Environ. Sci. Technol. , 39 : 7768 – 7776 .
- Chen , Y. , Yang , Q.Y. , Krewski , D. , Burnett , R.T. , Shi , Y.L. and McGrail , K.M. 2005 . The effect of coarse ambient particulate matter on first, second, and overall hospital admissions for respiratory disease among the elderly . Inhal. Toxicol. , 17 : 649 – 655 .
- Cheung , K. , Daher , N. , Kam , W. , Shafer , M.M. , Ning , Z. , Schauer , J.J. and Sioutas , C. 2011a . Spatial and temporal variation of chemical composition and mass closure of ambient coarse particulate matter (PM10–2.5) in the Los Angeles area . Atmos. Environ. , 45 : 2651 – 2662 .
- Cheung , K., N. Daher , Shafer , M.M. , Schauer , Z. Ning, J.J. and Sioutas , C. 2011b . Diurnal trends in coarse particulate matter composition in the Los Angeles Basin . J. Environ. Monit. , 13: 3277–3287.
- Chow , J.C. , Watson , J.G. , Fujita , E.M. , Lu , Z.Q. , Lawson , D.R. and Ashbaugh , L.L. 1994 . Temporal and spatial variations of PM(2.5) and PM(10) aerosol in the Southern California Air-Quality Study . Atmos. Environ. , 28 : 2061 – 2080 .
- Eldering , A. , Solomon , P.A. , Salmon , L.G. , Fall , T. and Cass , G.R. 1991 . Hydrochloric-acid—A regional perspective on concentrations and formation in the atmosphere of Southern California . Atmos. Environ. Part A , 25 : 2091 – 2102 .
- Garg , B.D. , Cadle , S.H. , Mulawa , P.A. , Groblicki , P.J. , Laroo , C. and Parr , G.A. 2000 . Brake wear particulate matter emissions . Environ. Sci. Technol. , 34 : 4463 – 4469 .
- Gauderman , W.J. , McConnell , R. , Gilliland , F. , London , S. , Thomas , D. , Avol , E. , Vora , H. , Berhane , K. , Rappaport , E.B. , Lurmann , F. , Margolis , H.G. and Peters , J. 2000 . Association between air pollution and lung function growth in southern California children . Am. J. Respir. Crit. Care Med. , 162 : 1383 – 1390 .
- Geller , M.D. , Fine , P.M. and Sioutas , C. 2004 . The relationship between real-time and time-integrated coarse (2.5–10 μm), intermodal (1–2.5 μm), and fine (<2.5 μm) particulate matter in the Los Angeles Basin . J. Air Waste Manage. Assoc. , 54 : 1029 – 1039 .
- Harrison , R.M. and Williams , C.R. 1983 . Physicochemical characterization of atmospheric trace-metal emissions from a primary zinc-lead smelter . Sci. Total Environ. , 31 : 129 – 140 .
- Huang , X.F. and Yu , J.Z. 2008 . Size distributions of elemental carbon in the atmosphere of a coastal urban area in South China: Characteristics, evolution processes, and implications for the mixing state . Atmos. Chem. Phys. , 8 : 5843 – 5853 .
- Isakson , J. , Persson , T.A. and Lindgren , E.S. 2001 . Identification and assessment of ship emissions and their effects in the harbour of G(o)over-circleteborg, Sweden . Atmos. Environ. , 35 : 3659 – 3666 .
- Kim , B.M. , Teffera , S. and Zeldin , M.D. 2000a . Characterization of PM2.5 and PM10 in the South Coast Air Basin of southern California: Part 1—Spatial variations . J. Air Waste Manage. Assoc. , 50 : 2034 – 2044 .
- Kim , B.M. , Teffera , S. and Zeldin , M.D. 2000b . Characterization of PM2.5 and PM10 in the South Coast Air Basin of southern California: Part 2—Temporal variations . J. Air Waste Manage. Assoc. , 50 : 2045 – 2059 .
- Kleeman , M.J. , Hughes , L.S. , Allen , J.O. and Cass , G.R. 1999 . Source contributions to the size and composition distribution of atmospheric particles: Southern California in September 1996 . Environ. Sci. Technol. , 33 : 4331 – 4341 .
- Koulouri , E. , Saarikoski , S. , Theodosi , C. , Markaki , Z. , Gerasopoulos , E. , Kouvarakis , G. , Makela , T. , Hillamo , R. and Mihalopoulos , N. 2008 . Chemical composition and sources of fine and coarse aerosol particles in the Eastern Mediterranean . Atmos. Environ. , 42 : 6542 – 6550 .
- Krudysz , M.A. , Froines , J.R. , Fine , P.M. and Sioutas , C. 2008 . Intra-community spatial variation of size-fractionated PM mass, OC, EC, and trace elements in the Long Beach, CA area . Atmos. Environ. , 42 : 5374 – 5389 .
- Lawson , D.R. and Winchester , J.W. 1979 . Standard crustal aerosol as a reference for elemental enrichment factors . Atmos. Environ. , 13 : 925 – 930 .
- Lin , C.C. , Chen , S.J. , Huang , K.L. , Hwang , W.I. , Chang-Chien , G.P. and Lin , W.Y. 2005 . Characteristics of metals in nano/ultrafine/fine/coarse particles collected beside a heavily trafficked road . Environ. Sci. Technol. , 39 : 8113 – 8122 .
- Lough , G.C. , Schauer , J.J. , Park , J.S. , Shafer , M.M. , Deminter , J.T. and Weinstein , J.P. 2005 . Emissions of metals associated with motor vehicle roadways . Environ. Sci. Technol. , 39 : 826 – 836 .
- Mader , B.T. , Schauer , J.J. , Seinfeld , J.H. , Flagan , R.C. , Yu , J.Z. , Yang , H. , Lim , H.J. , Turpin , B.J. , Deminter , J.T. , Heidemann , G. , Bae , M.S. , Quinn , P. , Bates , T. , Eatough , D.J. , Huebert , B.J. , Bertram , T. and Howell , S. 2003 . Sampling methods used for the collection of particle-phase organic and elemental carbon during ACE-Asia . Atmos. Environ. , 37 : 1435 – 1449 .
- Miguel , A.H. , Eiguren-Fernandez , A. , Jaques , P.A. , Froines , J.R. , Grant , B.L. , Mayo , P.R. and Sioutas , C. 2004 . Seasonal variation of the particle size distribution of polycyclic aromatic hydrocarbons and of major aerosol species in Claremont, California . Atmos. Environ. , 38 : 3241 – 3251 .
- Moore , K.F. , Verma , V. , Minguillon , M.C. and Sioutas , C. 2010 . Inter- and intra-community variability in continuous coarse particulate matter (PM10–2.5) concentrations in the Los Angeles area . Aerosol Sci. Technol. , 44 : 526 – 540 .
- Neiburger , M. and Wurtele , M.G. 1949 . On the nature and size of particles in haze, fog, and stratus of the Los-Angeles region . Chem. Rev. , 44 : 321 – 335 .
- Newhook , R. , Hirtle , H. , Byrne , K. and Meek , M.E. 2003 . Releases from copper smelters and refineries and zinc plants in Canada: Human health exposure and risk characterization . Sci. Total Environ. , 301 : 23 – 41 .
- Pakbin , P. , Hudda , N. , Cheung , K.L. , Moore , K.F. and Sioutas , C. 2010 . Spatial and temporal variability of coarse (PM10–2.5) particulate matter concentrations in the Los Angeles area . Aerosol Sci. Technol. , 44 : 514 – 525 .
- Pakbin , P. , Ning , Z. , Shafer , M.M. , Schauer , J.J. and Sioutas , C. 2011 . Seasonal and spatial coarse particle elemental concentrations in the Los Angeles area . Aerosol Sci. Technol. , 45 : 949 – 963 .
- Polidori , A. , Cheung , K.L. , Arhami , M. , Delfino , R.J. , Schauer , J.J. and Sioutas , C. 2009 . Relationships between size-fractionated indoor and outdoor trace elements at four retirement communities in southern California . Atmos. Chem. Phys. , 9 : 4521 – 4536 .
- Root , R.A.. 2000 . Lead loading of urban streets by motor vehicle wheel weights . Environ. Health Perspect. , 108 : 937 – 940 .
- Sardar , S.B. , Fine , P.M. and Sioutas , C. 2005 . Seasonal and spatial variability of the size-resolved chemical composition of particulate matter (PM10) in the Los Angeles Basin . J. Geophys. Res. , 110 ( D07S08 )
- Seinfeld , J.H. and Pandis , S.N. 2006 . Atmospheric Chemistry and Physics—From Air Pollution to Climate Change , 2nd , New York : John Wiley & Sons .
- Sillanpaa , M. , Hillamo , R. , Saarikoski , S. , Frey , A. , Pennanen , A. , Makkonen , U. , Spolnik , Z. , Van Grieken , R. , Branis , M. , Brunekreef , B. , Chalbot , M.C. , Kuhlbusch , T. , Sunyer , J. , Kerminen , V.M. , Kulmala , M. and Salonen , R.O. 2006 . Chemical composition and mass closure of particulate matter at six urban sites in Europe . Atmos. Environ. , 40 : S212 – S223 .
- Singh , M. , Jaques , P.A. and Sioutas , C. 2002 . Size distribution and diurnal characteristics of particle-bound metals in source and receptor sites of the Los Angeles Basin . Atmos. Environ. , 36 : 1675 – 1689 .
- Solomon , P.A. , Fall , T. , Salmon , L. and Cass , G.R. 1989 . Chemical characteristics of PM10 aerosols collected in the Los-Angeles area . J. Air Waste Manage. Assoc. , 39 : 154 – 163 .
- Solomon, P.A., T. Fall, L. Salmon, P. Lin, F. Vasquez, and G.R. Cass. 1988. Acquisition of Acid Vapor and Aerosol Concentration Data for Use in Dry Deposition Studies in the South Coast Air Basin. Environmental Quality Laboratory Report No. 25. http://ftp://preftp.arb.ca.gov/carbis/research/apr/past/a4-144-32_V1.pdf (http://ftp://preftp.arb.ca.gov/carbis/research/apr/past/a4-144-32_V1.pdf)
- Solomon , P.A. , Salmon , L.G. , Fall , T. and Cass , G.R. 1992 . Spatial and temporal distribution of atmospheric nitric-acid and particulate nitrate concentrations in the Los-Angeles area . Environ. Sci. Technol. , 26 : 1594 – 1601 .
- Taylor , S.R. and McLeannan , S.M. 1985 . The Continental Crust: Its Composition and Evolution , Oxford , , UK : Blackwell Scientific Publications .
- Terzi , E. , Argyropoulos , G. , Bougatioti , A. , Mihalopoulos , N. , Nikolaou , K. and Samara , C. 2010 . Chemical composition and mass closure of ambient PM10 at urban sites . Atmos. Environ. , 44 : 2231 – 2239 .
- U.S. Environmental Protection Agency (EPA) . 2004 . Air Quality Criteria for Particulate Matter , Research Triangle Park , NC : Office of Research and Development, National Center for Environmental Assessment, U.S. Environmental Protection Agency .
- U.S. EPA . 2006 . National Ambient Air Quality Standards for Particulate Matter; Proposed Rule, 40 CFR Part 50. Vol. 71 , Washington , DC : U.S. Office of the Federal Register, National Archives and Records Administration .
- Usher , C.R. , Michel , A.E. and Grassian , V.H. 2003 . Reactions on mineral dust . Chem. Rev. , 103 : 4883 – 4939 .
- Yeatts , K. , Svendsen , E. , Creason , J. , Alexis , N. , Herbst , M. , Scott , J. , Kupper , L. , Williams , R. , Neas , L. , Cascio , W. , Devlin , R.B. and Peden , D.B. 2007 . Coarse particulate matter (PM2.5–10) affects heart rate variability, blood lipids, and circulating eosinophils in adults with asthma . Environ. Health Perspect. , 115 : 709 – 714 .
- Yoshizumi , K. and Hoshi , A. 1985 . Size distributions of ammonium-nitrate and sodium-nitrate in atmospheric aerosols . Environ. Sci. Technol. , 19 : 258 – 261 .
- Zhuang , H. , Chan , C.K. , Fang , M. and Wexler , A.S. 1999 . Formation of nitrate and non-sea-salt sulfate on coarse particles . Atmos. Environ. , 33 : 4223 – 4233 .