Abstract
The effectiveness of emissions control programs designed to reduce concentrations of airborne particulate matter with an aerodynamic diameter <2.5 μm (PM2.5) in California's San Joaquin Valley was studied in the year 2030 under three growth scenarios: low, medium, and high population density. Base-case inventories for each choice of population density were created using a coupled emissions modeling system that simultaneously considered interactions between land use and transportation, area source, and point source emissions. The ambient PM2.5 response to each combination of population density and emissions control was evaluated using a regional chemical transport model over a 3-week winter stagnation episode. Comparisons between scenarios were based on regional average and population-weighted PM2.5 concentrations. In the absence of any emissions control program, population-weighted concentrations of PM2.5 in the future San Joaquin Valley are lowest under growth scenarios that emphasize low population density. A complete ban on wood burning and a 90% reduction in emissions from food cooking operations and diesel engines must occur before medium- to high-density growth scenarios result in lower population-weighted concentrations of PM2.5. These trends partly reflect the fact that existing downtown urban cores that naturally act as anchor points for new high-density growth in the San Joaquin Valley are located close to major transportation corridors for goods movement. Adding growth buffers around transportation corridors had little impact in the current analysis, since the 8-km resolution of the chemical transport model already provided an artificial buffer around major emissions sources.
Assuming that future emissions controls will greatly reduce or eliminate emissions from residential wood burning, food cooking, and diesel engines, the 2030 growth scenario using “as-planned” (medium) population density achieves the lowest population-weighted average PM2.5 concentration in the future San Joaquin Valley during a severe winter stagnation event.
The San Joaquin Valley is one of the most heavily polluted air basins in the United States that are projected to experience strong population growth in the coming decades. The best plan to improve air quality in the region combines medium- or high-density population growth with rigorous emissions controls. In the absences of controls, high-density growth leads to increased population exposure to PM2.5 compared with low-density growth scenarios (urban sprawl).
Introduction
The San Joaquin Valley (SJV) is a unique example of a heavily polluted air basin in the United States that is projected to undergo rapid population growth over the next several decades. This rapid growth makes the SJV an ideal setting to study the adoption of smart growth principles that favor compact building designs with mixed residential/commercial land use in downtown urban cores that create “walkable” neighborhoods. Smart growth can be described as the opposite of urban “sprawl” characterized by neighborhoods with low population density (CitationHandy, 2005). Smart growth advocates frequently cite improved air quality through reduced air pollution emissions from transportation sources as a benefit of smart growth adoption (U.S. Environmental Protection Agency Citation[EPA], 2001). The detailed air quality analysis conducted by CitationHixson et al. (2010) challenged this conventional wisdom by demonstrating that regional emissions reductions may not produce the expected public health benefits when high-density growth occurs close to emissions sources. The analysis by CitationHixson et al. (2010) suggests that population-weighted concentrations of some primary airborne particulate matter (PM) components such as elemental carbon (EC) may even increase in high population density growth scenarios. This finding is potentially serious, since epidemiological studies often find EC to be associated with excess mortality.
Several key questions must be answered to make definite conclusions about the air quality changes associated with different population density scenarios in the SJV. The four scenarios examined by CitationHixson et al. (2010) mixed various levels of population density and emissions controls in an attempt to examine the range on impacts of regional development policy on local air pollution concentrations. The surprising finding that increased population density may lead to increased (not decreased) exposure to airborne particles with an aerodynamic diameter less than 2.5 μm (PM2.5) points to the need for a methodical examination of pollutant concentrations at various levels of population density and emissions control. The objective of the current study is to carry out this methodical examination by independently varying future population density and emissions controls in the SJV to observe the net effect on population-weighted PM2.5 concentrations.
Methods
Emissions inventory development
Emissions for 2030 were projected from the 2002 emissions inventory produced by the California Air Resources Board (CARB) using updated growth and regulatory control factors applied with the California Emissions Forecasting System (CEFS). This projection implicitly uses population and economic growth forecasts for the SJV obtained from California Department of Finance projections for the year 2030. Four emissions inventories that reflected different levels of control were developed for each of three different population density scenarios. displays the change in the weekday primary PM2.5 emissions associated with the “as-planned” (medium) population density at each level of emissions control. The PM2.5 emissions are shown in the far left column and the cumulative reductions associated with each control level are shown in columns C1, C2, C3, and C4. Control C1 eliminates all emissions from residential wood burning, with an overall 57.3% reduction in the total emissions from wood burning activities. Remaining wood burning emissions are associated with activities such as agricultural wood burning and uncontrolled fires. Control C2 eliminates 90% of the PM2.5 and 90% of the volatile organic compound (VOC) emissions from the commercial meat cooking activities. Control C3 assumes the application of a 90% effective diesel particle filter (DPF). In the initial implementation of these control runs, no nitrogen dioxide/nitrogen oxides (NO2/NOx) penalty was assumed (CitationMillstein and Harley, 2010). A series of follow-up runs were performed to assess the impact of a NO2/NOx penalty due to the DPF. Control C4 applied a 33% reduction to agricultural dust and 16.5% reduction to dairy emissions. The bulk of this reduction occurs in the dust source category; however, this control only reduces the total of all dust emissions by 17.48%. The majority of dust emissions are the result of either natural or other anthropogenic sources such as windblown dust or road dust. The dairy emissions portion of this agricultural control impacts the miscellaneous source group, as some agriculture activities are lumped into that group. In total, the PM2.5 direct emissions decrease from 143.6 to 93.82 tons per day in the SJV due to the application of controls in the base-case population scenario (35% reduction from base case). The ordering of the cumulative controls reflects a reasonable progression based on the expected ease of implementation.
Table 1. PM2.5 emissions summary for the SJV in the year 2030 under the medium (“as-planned”) population density scenario
The base-case (no control) emissions inventories for the three different levels of population density were developed by normalizing the emissions control assumptions in the original “compact” and “sparse density” scenarios discussed by CitationHixson et al. (2010) to the values in the “as-planned” scenario. Specifically, residential wood burning, agricultural dust, and dairy emissions in the “compact” and “sparse density” scenarios were adjusted to use emission rate assumptions that were consistent with the “as-planned” projections. Per-capita residential wood combustion emissions (kg hr−1 person−1) were considered to be a function of population density in order to account for the relationship between type of residence and home heating source. Residential wood burning emissions that had previously been zeroed out for the “compact” growth scenario (assuming voluntary no-burn days) were assigned values using the relationship between per-capita emissions and population density taken from the “as-planned” scenario, combined with the population density in the “compact” growth scenario. Spatial allocation was achieved through placeholders for residential wood burning that were left behind in the “compact” growth area emissions files. This technique estimates lower residential wood combustion emissions for growth scenarios with higher population density. Agricultural dust emissions were scaled 50% higher in the “compact” growth scenario to match the “as-planned” emission rates. “Sparse density” agricultural dust emissions matched those in the “as-planned” scenario with no scaling. To bring dairy-related emission rates in line with the “as-planned” scenario, “compact” growth rates were scaled higher by 20%, whereas “sparse density” dairy emission rates were lowered by 20%.
Meteorology and air quality modeling
The air quality episode chosen for the present analysis was based on the meteorological conditions experienced during the time period of December 15, 2000, to January 7, 2001. This episode represents a strong, wintertime stagnation event in the San Joaquin Valley of California. Measurements of wind speed, temperature, relative humidity, and mixing depth during this 3-week stagnation episode were obtained as part of the California Regional Particulate Air Quality Study (CRPAQS). Meteorological measurements were used to develop diagnostic meteorological fields suitable for model inputs Citation(Ying et al., 2008a). Previous studies have shown that prognostic meteorological models predict fields that yield a similar air quality result compared with diagnostic meteorological fields (CitationHu et al., 2010). Numerous previous studies have used this episode as the basis for model evaluation (CitationLivingstone et al., 2009; CitationYing and Kleeman, 2009; CitationYing et al., 2008b, Citation2009; CitationZhang et al., 2010). The performance of the University of California, Davis (UCD) air quality model for PM2.5 (fractional bias: −0.5 to +0.75) in the SJV is generally good at the majority of the locations where measurements are available.
The UCD-California Institute of Technology photochemical transport quality model (CitationKleeman and Cass, 2001; CitationMahmud et al., 2010) was employed to simulate airborne particulate matter concentrations during the 3-week stagnation period. The model domain used in the analysis covered a 95 × 95 Lambert Conformal grid with an 8 × 8-km horizontal resolution centered over the SJV. Previous studies demonstrate that increasing the horizontal spatial resolution to 4 km produces essentially identical model results Citation(Ying et al., 2008a). Ten layers were used to represent the domain with thickness ranging from 30 m at the ground to 1000 m at an elevation of 5 km. Primary particulate matter emissions were processed in eight separate source categories: dust, wood burning, diesel combustion, gasoline combustion, meat cooking, high-sulfur fuels, natural gas combustion, and miscellaneous. Initial and boundary conditions were based on measurements from the CRPAQS episode Citation(Ying et al., 2008a). The first 2 days of each model simulation were considered to be model spin-up and were not used in the final analysis of results.
A total of 15 unique emissions scenarios were analyzed: 3 population density scenarios at each of 5 levels of emissions control. Population density fields for each scenario are temporally static but spatially allocated at a 2 × 2-km resolution over the San Joaquin Valley region. Daily activities such as commuting and time spent indoors were not accounted for in the population fields, but commuting was a factor accounted for in the travel demand model. Hourly specified emissions were generated for the year 2030 for each combination of population density and emissions control level by correcting biogenic and mobile-source emissions for meteorological conditions (CitationMahmud et al., 2010). All other aspects of the model implementation are identical to those described by CitationHixson et al. (2010).
Results
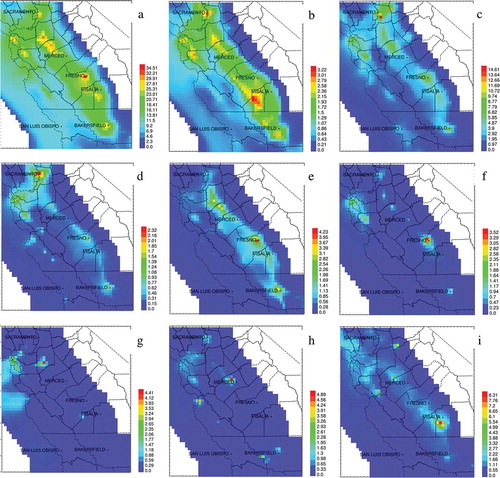
shows the predicted PM2.5 concentration for the “as-planned” (medium) population density scenario with no additional controls. The 3-week hourly average between December 18 and January 7 peaks at 34.5 μg m−3, with much of the SJV in the 20–25 μg m−3 range (). The source apportionment features of the calculation demonstrate significant contributions to the PM2.5 mass from the wood burning (5–10 μg m−3) and miscellaneous (1–8 μg m−3) sources for much of the valley (). Near the roadways, gasoline and diesel sources have a combined 2–6 μg m−3 impact on PM2.5 concentrations (, ). Dust sources have a moderate but widespread influence of 1–3 μg m−3 (). The remainder of the sources, including meat cooking (), high-sulfur fuels (), and natural gas combustion (), have more localized impacts of 1–4.4 μg m−3 each. These results clearly show that each source has a unique spatial pattern and absolute magnitude of total PM2.5 mass concentrations in the SJV in the year 2030.
Figure 1. PM2.5 concentrations (μg m−3) averaged over December 18, 2030, to January 7, 2031: Top left to bottom right: (a) PM2.5 mass total, (b) dust sources, (c) residential wood burning, (d) on-road diesel engines, (e) on-road gasoline engines, (f) meat cooking, (g) high-sulfur fuel combustion, (h) natural gas combustion, (i) agriculture and miscellaneous.
and summarize the difference in the total PM2.5 mass concentrations between the three population density scenarios (“sparse density” [low] = D1, “as-planned” [medium] = D2, “compact” growth [high] = D3) and the five control scenarios (C0–C4). averages the PM2.5 concentrations over all of the grid cells in the SJV region for each hour in the December 18 through January 7 time period. The combined effects of the emissions controls and the population density drive down the hourly averaged PM2.5 concentrations from 15.2 μg m−3 (D1+C0) to 11.9 μg m−3 (D3+C4). Implementing the first control (C1, residential wood burning ban) reduces regional PM2.5 concentrations by an amount that is comparable to shifting to a “compact” growth plan (compare C0+D3 vs. C1+D1). The high population density scenario with the first control (D3+C1) has lower regional PM2.5 than any other low population density scenario with emissions controls below level 4 (D2+C0–C3, D1+C0–C3). The medium population density scenario produces intermediate regional PM2.5 concentrations between the low and high population density scenarios at every level of emissions control application. These results indicate that medium and high population density scenarios lead to lower regionally averaged PM2.5 concentrations in the SJV.
Table 2. Regionally averaged (left column) and population-weighted (right column) source contributions to PM2.5 concentrations for 2030 scenarios with different levels of population density
Figure 2. Impact of population density (low, medium, high) and emissions control level (C0–C4) on (a) regional average PM2.5 concentrations and (b) population-weighted PM2.5 concentrations. Isopleth concentrations are μg m−3 averaged over the 3-week study period.
Figure 3. Impact of population density and emissions control level on regional average (left column) and population-weighted average (right column) PM2.5 concentrations from individual sources. Study region is the SJV with averaging period December 18 to January 7.
Population-weighted PM2.5 concentrations act as a surrogate for exposure that can be used to find the optimum level of population density in the SJV. The low-density (D1) and medium-density (D2) scenarios consistently produce lower population-weighted PM2.5 concentrations relative to the high population density case at any level of emissions control. These trends suggest that the reduced dilution associated with placing more people into historical urban cores that are close to large emissions sources outweighs the benefits of reduced total emissions due to factors such as reduced commute distances. This point has been discussed in previous studies that examined bounding cases in the SJV (D1+C0 vs. D3+C4) (CitationHixson et al., 2010). The systematic exploration of outcomes produced by different levels of population density and control technology carried out in the present study reveals that the high population density scenario (D3) at control C4 is comparable to the low population density scenario (D1) at control level C2 for population-weighted PM2.5 concentrations. Following the application of control level C2 and higher, the medium population density scenario (D2) produces the lowest population-weighted PM2.5 concentrations.
illustrates the impact of population density (D1 = low, D2 = medium, D3 = high) and emissions control level (C0–C4) on primary PM2.5 concentrations emitted from different sources. Results are presented as SJV regional average PM2.5 concentrations (left column) and population-weighted PM2.5 concentrations (right column). Controls are applied cumulatively starting with no control (C0), wood burning (C1), food cooking (C2), diesel particle filter (C3), and controls on agricultural activities (C4). illustrates that each of these source categories is influenced by population density and/or emissions controls. Results are not shown for three additional categories (high-sulfur fuel combustion, natural gas, and miscellaneous) because they do not respond strongly to population density or emissions controls in the current study.
Wood burning emissions from residential sources are assumed to be completely eliminated under control level C1 and higher. For level C0 (no control), regional average concentrations of wood burning peak in the low population density scenario (D1) at 2.31 μg m−3. The medium (D2) and higher (D3) population density scenarios with no emissions controls show a lower regional average contribution from wood burning of 2.14 and 1.60 μg m−3, respectively. This decrease in regionally averaged wood burning PM2.5 in response to population density is driven by fuel consumption from home heating in residential complexes with higher density. The trend is reversed when regional PM2.5 values are weighted by population. The higher population density scenario (D3) and the medium population density scenario (D2) result in higher population-weighted values of wood burning PM2.5 (4.01 and 4.08 μg m−3, respectively) than the lower population density scenario (D1) (3.37 μg m−3). Although the regional emissions of residential wood burning sources are decreased in scenarios D2 and D3, these sources are concentrated in a smaller area around the population centers. Following application of the residential wood burning ban (control levels C1–C4), there are still agricultural burning sources or wildfires that emit wood smoke, hence, the minimum observed value is still 0.7 μg m−3 for the regional average and 0.8 μg m−3 for the population-weighted value. The regional average is consistent across all three population density scenarios as might be expected, since no assumptions about extraresidential wood burning activities were made in developing the emissions inventories. The population-weighted concentration is 0.6 μg m−3, higher in the “sparse density” scenario (D1) compared with the two scenarios with higher population density (D2 and D3). This difference can be explained by the near-uniform distribution of population across the SJV in the “sparse density” scenario resulting in increased exposure to commercial, industrial, and agricultural wood burning activities.
Food cooking sources in the SJV were controlled with 90% efficiency under emission levels C2 and higher in the present study. Meat cooking filters with integrated catalytic reduction systems were applied for PM2.5 and VOCs. The regional meat cooking PM2.5 contribution is constant at 0.15 μg m−3 across the three population density scenarios (D1–D3) before the controls are applied (C0 and C1). These facilities and their activities were not affected by land use policies in the current study. The population-weighted food cooking concentrations increase with population density as more people are placed in closer proximity to these facilities. illustrates that population-weighted food cooking increases from 0.29 μg m−3 (D1) to 0.70 μg m−3 (D3) as population density increases. Application of the emissions controls in scenarios C2 and higher cuts these values by the expected amount of 90%, since the vast majority of this material is primary PM2.5.
Control level C3 applies diesel particle filters (DPFs) with 90% efficacy to diesel combustion sources. DPFs equipped with catalytic converters may increase the ratio of NO2/NOx in diesel emissions, whereas newer technologies that employ approaches such as selective catalytic reduction (SCR) do not affect the NO2/NOx ratio. Changes to the NO2/NOx ratio produce increased particulate nitrate concentrations in California's South Coast Air Basin (CitationMillstein and Harley, 2010), with similar effects possible in the SJV. The initial intent of the control series analyzed in the present study was to look at an idealized DPF + SCR system with no change to NO2/NOx emissions ratios. The consequences of an increased NO2/NOx emissions ratio in the SJV will be analyzed in a later section.
The predicted diesel combustion source contributions to regional PM2.5 concentrations were 0.19 μg m−3 in high-density growth (D3), 0.20 μg m−3 in medium-density growth (D2), and 0.21 μg m−3 in the low-density growth (D1) scenarios. This difference in regional concentrations reflects the changes forecasted from the travel demand model in response to changes in the patterns of population distribution. Travel activity generally increases as the population density decreases because residents must travel further from their homes to reach a desired destination such as their place of employment. This effect is muted for diesel vehicles because they account for only a small fraction of the commuting vehicle fleet. The majority of the diesel vehicles are medium- and heavy-duty trucks whose travel patterns were unaffected by the land use policies considered. In the present study, the highest population density scenario (D3) produced the highest population-weighted diesel PM2.5 concentrations at 0.43 μg m−3, with the intermediate population density (D2) and low population density (D1) scenarios producing population-weighted average diesel PM2.5 concentrations of 0.37 and 0.32 μg m−3, respectively. This trend reflects the location of downtown urban cores close to major transportation corridors (CA Highway 99) in the SJV. High-density growth scenarios naturally move a greater fraction of the population into closer proximity to highways under these conditions. Application of the DPF with no NOx penalty shows a clear 90% drop in the previous values while maintaining the relative ranking of the different population density scenarios.
Natural and anthropogenic emissions sources contribute to the dust category presented in The last control measure (C4) applies to the fraction of dust emissions generated by agricultural activities in the SJV. Dust accounts for 1.27, 1.26, and 1.24 μg m−3 of population-weighted PM2.5 concentrations in the “compact,” “as-planned,” and “sparse” growth scenarios, respectively. These small differences do not reflect any significant changes in activity leading to dust production between the scenarios. Population-weighted dust concentrations reflect the dominance of nonagricultural dust sources near the population centers, as the precontrol population-weighted dust concentrations are 1.8, 1.6, and 1.6 μg m−3 for “compact,” “as-planned,” and “sparse” growth scenarios, respectively.
Gasoline combustion sources are included in as an example of a significant source type that is not impacted by any of the emissions control measures. The concentration of regionally averaged PM2.5 from this source decreases from 0.67 to 0.57 μg m−3 as the population density increases from level D1 to D3 because people commute shorter distances for employment. The gasoline combustion vehicles make up the bulk of the passenger vehicle fleet, hence, commuting distance has a stronger impact on overall gasoline PM2.5 concentrations than diesel PM2.5 concentrations. The population-weighted gasoline PM2.5 concentrations exhibit the opposite trend, with lower values of 1.11 μg m−3 in the lowest population density scenario (D1) and higher values of 1.57 μg m−3 in the highest population density scenario (D3). It is evident that the increased proximity between motor vehicle activity and population centers in the high-density growth scenarios outweighs any benefits associated with regional emissions reductions from these sources.
Excluded from (but presented in a ) are three other source types that contributed to the total PM2.5 mass: high-sulfur fuels, natural gas, and miscellaneous. The high-sulfur fuel and natural gas categories were not controlled by any of the previously described measures and had only local impacts on the total PM2.5 concentrations. Miscellaneous sources not included in other source categories were only affected by C4 (agricultural dust), with a 0.03 μg m−3 reduction in population-weighted concentrations.
Discussion
The application of DPFs with oxidation catalysts reduces diesel fine particle emissions but may also potentially increase the ratio of NO2/NOx in the exhaust gas (CitationMillstein and Harley, 2010). Previous studies have determined that increasing the NO2/NOx exhaust ratio may lead to increased formation rates for particulate nitrate in southern California (CitationMillstein and Harley, 2010). The DPF applied in the current study was assumed not to change the NO2/NOx emissions, as it seems likely the application of technologies to minimize the NOx penalty will be standard well before 2030 (CitationCARB, 2008). There were no additional controls such as selective catalytic reduction (SCR) assumed in this application of fleet-wide DPFs. The emission factors for the rest of the mobile fleet were fixed at default values present in EPA's Mobile Source Emission Factor Model Version 6 (MOBILE6). The Tier 2 rules are assumed to fully penetrate the fleet in all control levels. Nevertheless, it is instructive to examine the potential magnitude of any increased particulate nitrate formation in the SJV that could result from the widespread application of DPFs and study how nitrate formation is influenced by population density. In the present study, each simulation involving DPFs was run twice, once considering only the effect of the removing the PM2.5 and once considering the removal of PM2.5 and an increase in the NO2/NOx ratio from 0.1 to 0.35 (CitationMillstein and Harley, 2010). shows the shift in the population-weighted nitrate concentrations averaged over the simulation period of December 18 to January 7. In all cases, increasing the NO2/NOx emissions ratio results in an increase in population-weighted particulate nitrate concentrations of approximately 1%, with regional maximum values increasing by ∼6–8%. The differences in the regional, population-weighted, and maximum values of the nitrate shift are due to where each scenario is located on a nitrate isopleth and where the NOx emissions are spatially located in each scenario. The influence of NO2/NOx emissions ratio on population-weighted nitrate concentrations during the current study is relatively minor and this issue will not significantly affect the results shown in and
Figure 4. The shift in nitrate concentrations observed when applying a diesel particle filter with an NO2/NOx penalty. Concentrations are averaged over the SJV region (left bar), SJV population weighted (center bar), and regional maximum (right bar) for each of the three population density scenarios: dense, sparse, and baseline.
The results illustrated in the previous sections demonstrate that the increased population density near the major motorways in the “compact” growth scenario (D3) leads to increased population-weighted PM2.5 concentrations. This corresponds to a density-emissions elasticity greater than −0.5 as derived by CitationMarshall et al. (2005) for an idealized urban system. The real-world example of the SJV analyzed in the present study confirms this result, but it is worth noting that the static nature of the population density fields may influence these findings. Assuming that there is a diurnal population shift towards the urban cores, the population-weighted values may be biased. This bias would likely increase in “compact” growth population-weighted values for primary pollutants as well as total PM2.5. This penalty occurs because the historical urban centers that form the focal point of the “compact” growth scenarios are located close to major emissions sources such as CA Highway 99. One possible solution to this problem is to create buffers between the transportation corridor and residences. This option was explored in the present study using the existing PM2.5 concentration fields and modified population density fields that reflect buffer policies. The modified population fields assumed that no new construction would be allowed within 0.3, 1, 2, and 4 km of CA Highway 99 in the SJV. Existing population was shifted away from the highway by the previously described increments and the population-weighted concentrations were recalculated for the “compact” growth scenario. shows that the use of buffer spaces up to 4 km wide around the CA Highway 99 transportation corridor had very little impact (<0.1 μg m−3) on population-weighted PM2.5 concentrations in the present study. This result is logical, since the regional air pollution model used for the analysis employed a horizontal grid resolution of 8 km and so all emissions already undergo artificial diffusion comparable to the 4-km buffer. The corollary to this finding is that the penalty associated with “compact” growth near large emissions sources is almost certainly larger than the effect quantified in the current study. A fine-scale model using Large Eddy Simulation (LES) or some comparable higher-order closure method for atmospheric turbulence would be needed to fully explore the fine-scale effects that would respond to buffers smaller than 4 km in size. In order to run the finer-scale air quality model, a revised emissions inventory would need to be developed that is spatially allocated to a 4-km or finer resolution. This analysis is beyond the scope of the current study.
Table 3. Population-weighted PM2.5 concentrations calculated after shifting population away from CA Highway 99
Conclusions
PM2.5 concentrations in the SJV projected for the year 2030 respond to changes in population density and the application of emission controls during a 3-week winter stagnation event. Regionally averaged PM2.5 concentrations are minimized by growth scenarios that incorporate higher population density and greater levels of emissions controls. Population-weighted PM2.5 concentrations (a better metric of public health risks) do not follow the regionally averaged trends. A minimum population-weighted PM2.5 concentration for the SJV was observed with an “as-planned” (medium) population density under the greatest level of emissions control studied (∼50 tons/day reduction in PM2.5 emissions). The “compact” (high-density) growth scenario had higher population-weighted PM2.5 concentrations than the “as-planned” growth scenario at all levels of emissions control. “Compact” growth scenarios required 2–3 levels of additional emissions controls in order to reduce population-weighted PM2.5 concentrations to the levels achieved with the “as-planned” population density. Before the application of meat cooking controls, “sparse” growth was projected to have the lowest population-weighted PM2.5 concentration of all the population density scenarios that were considered. These results suggest that, given the right level of emissions controls, the “as-planned” (medium) population density pattern provides the lowest population-weighted PM2.5 concentrations in the SJV. In the absence of significant emissions controls (wood burning ban, food cooking filters, diesel particle filters), the “sparse density” (low) population density pattern provides the lowest concentrations.
Both the “compact” and “as-planned” population growth scenarios suffer from the close proximity of population centers to the CA Highway 99 transportation corridor. A detailed analysis of near-highway effects would require a much finer horizontal resolution but would not lower predicted exposure to PM2.5 below the levels predicted in the present study, since this effect is already accounted for by the artificial dilution present in the model 8 × 8-km grid cells. No-build buffers around highways in the SJV do not reduce population exposure to PM2.5. DPFs are a more effective method to reduce exposure to particles emitted from diesel engines. There was no significant increase in population-weighted nitrate concentration caused by changing the ratio of NO2/NOx when DPFs were applied in the future SJV.
The analysis time period, meteorology, and emissions characteristics of the SJV have a strong influence on the results of this study. A follow-up study for the SJV that assesses trends over an annual average time period is currently underway. The results of the current study should not be extrapolated to other regions without further analysis.
Acknowledgments
This study was funded by the U.S. Environmental Protection Agency under grant RD-83184201. Although the research described in the paper has been funded by the U.S. Environmental Protection Agency, it has not been subject to the Agency's required peer and policy review and therefore does not necessarily reflect the reviews of the Agency and no official endorsement should be inferred.
References
- California Air Resources Board (CARB) . 2008 . Proposed Regulation For in-Use on-Road Diesel Vehicles. Staff Report: Initial Statement of Reasons for Proposed Rulemaking , Sacramento , CA : California Air Resources Board, Mobile Source Control Division, Heavy-Duty Diesel In-Use Strategies Branch .
- Handy , S. 2005 . Smart growth and the transportation—Land use connection: What does the research tell us? . Int. Reg. Sci. Rev. , 28 : 146 – 167 .
- Hixson , M. , Mark , H. , Mahmud , A. , Hu , J. , Bai , S. , Niemeier , D.A. , Handy , S.L. , Gao , S. , Lund , J.R. , Sullivan , D.C. and Kleeman , M.J. 2010 . Influence of regional development policies and clean technology adoption on future air pollution exposure . Atmos. Environ. , 44 : 552 – 562 .
- Hu , J.L. , Hu , J. , Ying , Q. , Chen , J. , Mahmud , A. , Zhao , Z. , Chen , S.-H. and Kleeman , M.J. 2010 . Particulate air quality model predictions using prognostic vs. diagnostic meteorology in central California . Atmos. Environ. , 44 : 215 – 226 .
- Kleeman , M.J. and Cass , G.R. 2001 . A 3D eulerian source-oriented model for an externally mixed aerosol . Environ. Sci. Technol. , 35 : 4834 – 4848 .
- Livingstone , P.L. , Magliano , K. , Gürer , K. , Allen , P.D. , Zhang , K.M. , Ying , Q. , Jackson , B.S. , Kaduwela , A. , Kleeman , M. , Woodhouse , L.F. , Turkiewicz , K. , Horowitz , L.W. , Scott , K. , Johnson , D. , Taylor , C. , O'Brien , G. , DaMassa , J. , Croes , B.E. , Binkowski , F. and Byun , D. 2009 . Simulating PM concentration during a winter episode in a subtropical valley: Sensitivity simulations and evaluation methods . Atmos. Environ. , 43 : 5971 – 5977 .
- Mahmud , A. , Hixson , M. , Hu , J. , Zhao , Z. , Chen , S.-H. and Kleeman , M. J. 2010 . Climate impact on airborne particulate matter concentrations in California using seven year analysis periods . Atmos. Chem. Phys. , 10 : 11097 – 11114 .
- Marshall , J.D. , McKone , T.E. , Deakin , E. and Nazaroff , W.W. 2005 . Inhalation of motor vehicle emissions: Effects of urban population and land area . Atmos. Environ. , 39 : 283 – 295 .
- Millstein , D.E. and Harley , R.A. 2010 . Effects of retrofitting emission control systems on in-use heavy diesel vehicles . Environ. Sci. Technol. , 44 : 5042 – 5048 .
- U.S. Environmental Protection Agency (EPA) . 2001 . EPA Guidance: Improving Air Quality through Land Use Activities EPA420-R-01-001. Cincinnati, OH: Office of Research and Development, U.S. Environmental Protection Agency.
- Ying , Q. , Lu , J. , Allen , P. , Livingstone , P. , Kaduwela , A. and Kleeman , M. 2008a . Modeling air quality during the California regional PM10/PM2.5 air quality study (CRPAQS) using the UCD/CIT source-oriented air quality model—Part I. Base case model results . Atmos. Environ. , 42 : 8954 – 8966 .
- Ying , Q. , Lu , J. , Kaduwela , A. and Kleeman , M. 2008b . Modeling air quality during the California regional PM10/PM2.5 air quality study (CPRAQS) using the UCD/CIT source oriented air quality model—Part II. Regional source apportionment of primary airborne particulate matter . Atmos. Environ. , 42 : 8967 – 8978 .
- Ying , Q. and Kleeman , M. 2009 . Regional contributions to airborne particulate matter in central California during a severe pollution episode . Atmos. Environ. , 43 : 1218 – 1228 .
- Ying , Q. , Lu , J. and Kleeman , M. 2009 . Modeling air quality during the California regional PM10/PM2.5 air quality study (CPRAQS) using the UCD/CIT source-oriented air quality model—Part III. Regional source apportionment of secondary and total airborne particulate matter . Atmos. Environ. , 43 : 419 – 430 .
- Zhang , Y. , Liu , P. , Liu , X.-H. , Pun , B. , Seigneur , C. , Jacobson , M.Z. and Wang , W.-X. 2010 . Fine scale modeling of wintertime aerosol mass, number, and size distributions in central California . J. Geophys. Res. , 115 : 1 – 24 .