Abstract
Black carbon (BC), an important component of the atmospheric aerosol, has climatic, environmental, and human health significance. In this study, BC was continuously measured using a two-wavelength aethalometer (370 nm and 880 nm) in Rochester, New York, from January 2007 to December 2010. The monitoring site is adjacent to two major urban highways (I-490 and I-590), where 14% to 21% of the total traffic was heavy-duty diesel vehicles. The annual average BC concentrations were 0.76 μg/m3, 0.67 μg/m3, 0.60 μg/m3, and 0.52 μg/m3 in 2007, 2008, 2009, and 2010, respectively. Positive matrix factorization (PMF) modeling was performed using PM2.5 elements, sulfate, nitrate, ammonia, elemental carbon (EC), and organic carbon (OC) data from the U.S. Environmental Protection Agency (EPA) speciation network and Delta-C (UVBC370nm – BC880nm) data. Delta-C has been previously shown to be a tracer of wood combustion factor. It was used as an input variable in source apportionment models for the first time in this study and was found to play an important role in separating traffic (especially diesel) emissions from wood combustion emissions. The result showed the annual average PM2.5 concentrations apportioned to diesel emissions in 2007, 2008, 2009, and 2010 were 1.34 μg/m3, 1.25 μg/m3, 1.13 μg/m3, and 0.97 μg/m3, respectively. The BC conditional probability function (CPF) plots show a large contribution from the highway diesel traffic to elevated BC concentrations. The measurements and modeling results suggest an impact of the U.S Environmental Protection Agency (EPA) 2007 Heavy-Duty Highway Rule on the decrease of BC and PM2.5 concentrations during the study period.
This study suggests that there was an observable impact of the U.S EPA 2007 Heavy-Duty Highway Rule on the ambient black carbon concentrations in Rochester, New York. Aethalometer Delta-C was used as an input variable in source apportionment models and it allowed the separation of traffic (especially diesel) emissions from wood combustion emissions.
Supplemental materials are available for this article. Go to the publisher's online edition of the Journal of the Air & Waste Management Association for additional details on the sampling location, the analyses of the aerosol data, and the alternative PMF analysis omitting Delta-C.
Introduction
Black carbon (BC) is an important component of the atmospheric aerosol. Fossil fuel combustion and biomass burning are generally the two most important anthropogenic BC sources (CitationCooke and Wilson, 1996) Prior studies suggest that BC can alter cloud lifetimes (CitationAckerman et al., 2000), precipitation patterns (CitationMenon et al., 2002), and reflectivity and melting of snow and ice (CitationHansen et al., 2003). The direct radiative forcing of airborne BC can cause a significant change in the atmospheric circulation and tropical convective precipitation (CitationWang, 2007). BC-containing particles may also lower crop yields (CitationChameides et al., 1999), contaminate building materials (CitationGhedini et al., 2000), and adversely impact terrestrial and aquatic ecosystems (CitationForbes et al., 2006).
BC has been reported to be an adequate indicator of diesel soot in urban areas (CitationFruin et al., 2004). BC exposure has been linked to adverse health effects that include hospital admissions for myocardial infarction and pneumonia (CitationZanobetti and Schwartz, 2006), ventricular tachyarrythmias detected in real-time in subjects with implanted defibrillators (CitationDockery et al., 2005), electrocardiogram patterns in seniors related to potential myocardial ischemia (CitationGold et al., 2005), and diminished heart-rate variability (CitationSchwartz et al., 2005). Because of its climatic, environmental, and human health significance, as well as the anthropogenic nature of its origin in urban environments, characterization of BC has attracted considerable interest in the recent years. A summary of BC concentrations measured at various urban locations was given by CitationWang et al. (2011d).
In the United State, the “2007 Heavy-Duty Highway Rule” ((http://www.epa.gov/otaq/highway-diesel/regs/2007-heavy-duty-highway.htm) required all new on-road heavy-duty diesel engines to use diesel particulate filters (DPF) beginning on July 1, 2007. CitationMillstein and Harley (2010) reported that BC concentrations in southern California could decrease by 12 ± 2% and 14 ± 2% during summer and fall, respectively, in 2014 after all in-use heavy-duty trucks are retrofitted with DPF. To protect these catalytic filters, only ultra-low-sulfur on-road diesel (ULSD, ≤15 ppm) fuels were required to be sold beginning on October 1, 2006, with 80% of all highway use diesel compliant on October 15, 2006. Full compliance for highway use and nonroad diesel fuel was completed by December 2010 (“40 CRF 80,” http://www.epa.gov/otaq/renewablefuels/rfs-finalrule.pdf). In this study, we investigated the sources of BC and whether changes in the impacts of diesel traffic emissions on airborne particle characteristics in Rochester, New York, from January 2007 to December 2010 could be observed using two-wavelength aethalometer measurement.
Experimental
Site description
Rochester, located on the southern shore of Lake Ontario, is the third largest city in New York State. In 2009, it had a population of 207,294 (U.S. Census Bureau, http://www.census.gov). The New York State Department of Environmental Conservation (NYS DEC) maintains a monitoring site in Rochester, New York (43°08'46” N, 77°32'54” W, elevation = 137 m, U.S. EPA site code 36–055–1007). The prevailing wind direction was southwesterly. This site is northeast and adjacent to the intersection (∼300 m to the south of the site) of two major highways (I-490 and I-590; see Figure S1). The 2005–2009 average annual average daily traffic (AADT) counts were 112,291 and 112,549 on I-490 and I-590, respectively. The percentages of buses and heavy-duty diesel vehicles (HDDV) in the traffic on I-490 and I-590 were 21% and 14%, respectively (CitationWang et al., 2011b).
Based on New York State Department of Transportation (NYSDOT) traffic data, the traffic density peaks around 7:00 a.m. and 4:00 p.m. on weekdays (Monday–Friday). On weekends (Saturday–Sunday), a more gradual increase in traffic density was observed with only one broad peak occurring between 12:00 p.m. and 4:00 p.m. The weekend/weekday traffic ratio was greater than 1 during 9:00 p.m. to 4:00 a.m. and 10:00 a.m. to 2:00 p.m., indicating potential greater traffic emissions during these periods on weekends (Figure S2). The ratio was substantially lower than 1 between 5 a.m. and 8 a.m.at the same time as the weekday early commute period. The total traffic volumes on both highways were stable between 2007 and 2009 (Figure S3). For the HDDV and all vehicles, the traffic volumes were greater during the day compared to the night. Two daytime peaks were also found at 7:00 a.m. and 4:00 p.m. (Figure S4). There was no substantial change in the weekday HDDV volume between 2007 and 2009 (Figure S5).
Instrumentation
BC concentrations were measured from January 2007 to December 2010 using a two-wavelength aethalometer (370 nm and 880 nm, model AE-21, Magee Scientific, USA) at a time resolution of 5 min. Hourly averaged BC concentrations were calculated for further analysis. The instrument aspirated ambient air at a flow rate of 5 L/min from a height of ∼5 m above the ground level. A 2.5-μm sharp-cut cyclone inlet (BGI model SCC-1.828) excluded particles larger than 2.5 μm from the instrument. Every third day, 24-hr average PM2.5 elements, sulfate (SO4 2-), nitrate (NO3 -), ammonia (NH4 +), elemental carbon (EC), and organic carbon (OC) concentrations during 2007–2010 were obtained from the U.S. Environmental Protection Agency (EPA) speciation network (http://www.epa.gov/ttn/airs/airsaqs/detaildata/downloadaqsdata.htm).
Number size distributions of 10- to 500-nm particles were measured using a scanning mobility particle sizer (SMPS), consisting of a differential mobility analyzer (DMA, model 3071, TSI, Inc.), an 85Kr aerosol neutralizer (model 3077, TSI, Inc.), and a condensation particle counter (CPC, model 3010, TSI, Inc.). Trace gas species, CO, SO2, and O3, were measured using Thermo Environmental instruments, models 48C, 43C, and 49C, respectively. Hourly PM2.5 mass was measured using a tapered-element oscillating microbalance (TEOM), model 1400a (Rupprecht and Patashnick, now Thermo Environmental, Waltham, MA) (CitationWang et al., 2011c). The number concentrations of particles in the 10–500 nm size range, PM2.5, CO, SO2, O3, and meteorological variables were recorded on an hourly basis during the same period (CitationWang et al., 2011a; 2011b).
Data analysis
In this study, the loading effect on the aethalometer data was corrected using the algorithm presented by CitationHagler et al. (2011). The average 880 nm-wavelength correction factors were 0.0068, 0.0017, 0.0062, and 0.0081 for spring (March–May), summer (June–August), fall (September–November), and winter (December–February), respectively. The average 370-nm-wavelength correction factors were 0.0054, 0.0042, 0.0054, and 0.0058 for spring, summer, fall, and winter, respectively (CitationWang et al., 2011c). Organic components of wood-smoke particles absorb light at 370 nm more effectively than at 880 nm in two-wavelength aethalometer measurements (CitationAllen et al., 2004). This enhanced absorption (Delta-C = BC370nm – BC880nm) was found to strongly correlate with wood-smoke markers (levoglucosan and potassium) during the heating season (CitationWang et al., 2011c). Therefore, Delta-C serves as a tracer of wood combustion particles (CitationWang et al., 2010; 2011d). Prior to June 23, 2008, aethalometer measurements were made only at a single wavelength (880 nm). Therefore, only the July 2008 to December 2010 Delta-C data were available for this source apportionment study.
Positive matrix factorization (PMF) is a multivariate factor analysis tool that decomposes data into two matrices: factor contributions and profiles. It has been comprehensively described by CitationPaatero (1997; CitationPaatero and Tapper, 1994). EPA PMF 4.1 was used in this study to resolve the PM2.5 sources (CitationNorris et al., 2008; Citation2010). The input data matrix includes 447 rows and 25 columns (25 species including Na, Al, Si, Cl, K, Ca, Ti, Cr, Mn, Fe, Ni, Cu, Zn, As, Se, Br, Sr, Pb, NH4 +, NO3 -, SO4 2-, EC, OC, Delta-C, and PM2.5). The uncertainties for elements and ions were estimated using the method reported by CitationGutknecht et al. (2006). The uncertainties for EC, OC, and Delta-C were calculated using the method reported by CitationWang et al. (2011a). Species measured below detection limits (DL) were replaced by 1/2 DL and assigned an uncertainty equal to 5/6 DL. All missing data were replaced by the geometric mean concentration (CitationPolissar et al., 1998). Additional uncertainty of 5% was added to the uncertainty estimates. In this study, Delta-C was used as an input variable for the first time in source apportionment work.
The signal to noise ratio (s/n) was greater than 0.5 for all species. The species with s/n value between 0.5 and 1.0 were marked as “weak” species, including As, Se, Pb, and Sr. PM2.5 was set as the total variable. PMF modeling was done with and without Delta-C. The Q(robust) and Q(true) values were 6136 and 6171 when Delta-C was included, respectively. When Delta-C was excluded, the Q(robust) and Q(true) values were 5654 and 5680, respectively. For both cases, the scaled residuals were approximately symmetrically distributed between –3 and +3, and the non-rotated solutions (FPEAK = 0) were selected. Conditional probability function (CPF) values were computed for the BC and Delta-C values coupled with wind speed and wind direction values to identify possible locations of local sources in the study area (CitationKim et al., 2003).
Results and Discussion
BC observations
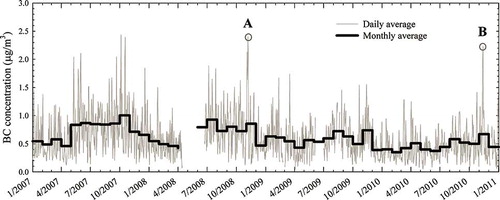
Figure 1 shows the daily (gray lines) and monthly (black step) arithmetic mean BC concentrations measured at the Rochester monitoring site from 01/01/2007 to 12/31/2010. Data between 4/14/2008 and 6/23/2008 were not recorded due to an instrument malfunction. Over the 4-year period, the average BC concentration was 0.60 μg/m3. The monthly mean BC concentrations varied from 0.35 μg/m3 in February 2010 to 1.0 μg/m3 in October 2007. The spring, summer, fall, and winter average BC concentrations were 0.52 μg/m3, 0.69 μg/m3, 0.71 μg/m3, and 0.50 μg/m3, respectively. Summertime BC concentrations were significantly greater compared to winter (Student's t, p < 0.01), which is consistent with previous findings (CitationWang et al., 2011c). There were two events during the study period when the daily average BC concentration exceeded 2.0 μg/m3 for two consecutive days (marked as A and B in ).
Figure 1. Daily (gray lines) and monthly (black steps) mean BC concentrations in Rochester, NY. The gap between 4/14/2008 and 6/23/2008 is due to the aethalometer malfunction. Specific periods (daily average BC concentration was greater than 2 μg/m3 for consecutive two days) marked as A and B are discussed.
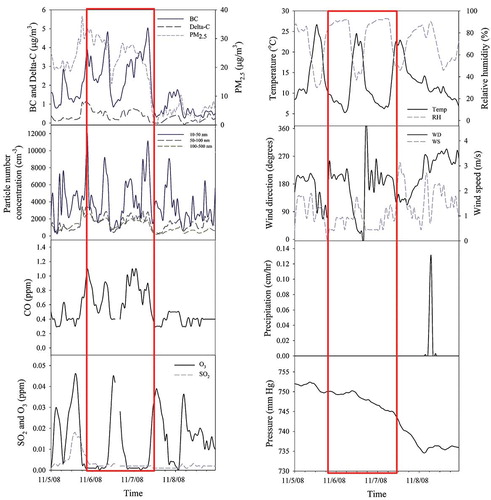
The short-term variation of BC during period A (11/5/2008–11/8/2008) included two short bursts of hourly average BC concentration that exceeded 4.0 μg/m3 (, top left). The two spikes were observed during morning rush hour (between 6:00 a.m. and 7:00 a.m.). In , the other pollutants (Delta-C, PM2.5, 10–500 nm particle number concentration, CO, SO2, and O3) are also shown, along with the meteorological parameters (ambient temperature, relative humidity, wind direction, wind speed, precipitation, and atmospheric pressure). PM2.5, CO, and 10–500 nm particles all showed temporal trend similar to BC, while SO2, O3, and Delta-C did not. The Pearson correlation coefficient between BC and other pollutants was 0.63, 0.72, 0.81, 0.87, and 0.68 for 10–50 nm particles, 50–100 nm particles, 100–500 nm particles, CO, and PM2.5, respectively. The event A was probably the result of traffic emissions under inversion conditions.
Figure 2. Temporal variations of BC, Delta-C, PM2.5, 10–500 nm particles, CO, SO2, O3, ambient temperature, relative humidity, wind direction, wind speed, precipitation, and ground-level atmospheric pressure during 11/5/2008–11/8/2008 (event A marked in ). The boxes highlight the period of high BC concentrations.
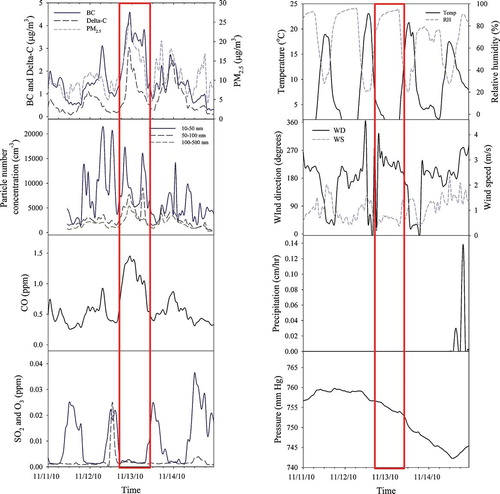
Period B (11/11/2010–11/14/2010) encompasses one short burst of hourly average BC concentration that exceeded 4.0 μg/m3 (, top left). It happened around midnight. The temporal profiles of all other pollutants and meteorological parameters over the period are also shown in PM2.5, CO, Delta-C, and 50–500 nm particles followed the similar temporal trend of BC during the period. The Pearson correlation coefficient between BC and other pollutants were 0.85, 0.89, 0.95, 0.75, and 0.73 for 50–100 nm particles, 100–500 nm particles, CO, PM2.5, and Delta-C, respectively. On 11/11/2010, there were several forest fires detected near the northern shore of Lake Ontario in Canada (Figure S6). The Moderate Resolution Imaging Spectroradiometer (MODIS) satellite image and back-trajectories from the Hybrid Single Particle Lagrangian Integrated Trajectory (HYSPLIT) model show the transport of the forest fire plume to the monitoring site in Rochester, NY (Figures S7 and S8). The MODIS image does not directly show the presence of the Canadian forest fire smoke over Rochester. However, the back trajectory shows the air parcel reaching Rochester mixed with the eastern part of the smoke at the turning point in the trajectory path. Therefore, event B was related to remote forest fires.
Figure 3. Temporal variations of BC, Delta-C, PM2.5, 10–500 nm particles, CO, SO2, O3, ambient temperature, relative humidity, wind direction, wind speed, precipitation, and ground-level atmospheric pressure during 11/11/2010–11/14/2010 (event B marked in ). The boxes highlight the period of high BC concentrations.
Changes of BC and other pollutants during 2007–2010
The annual statistics for BC and other pollutants from 2007 to 2010 are shown in The box plots are based on hourly average measurements for all species. The number of observations varied from 5171 to 6178 for each species. In , there is a decreasing trend for BC from 2007 to 2010. The annual average BC concentrations in 2007, 2008, 2009, and 2010 were 0.76 μg/m3, 0.67 μg/m3, 0.60 μg/m3, and 0.52 μg/m3, respectively. The U.S. EPA “2007 Heavy-Duty Highway Rule” may have had an impact on diesel BC particle emissions.
Figure 4. Annual variations of BC, 10–500 nm particles, PM2.5, SO2, O3, and CO between 2007 and 2010. Box-whisker plot indicates median and 25/75% quartiles (boxes), mean (dash line), 10/90% quartiles (whiskers), and 5/95% quartiles (dots).
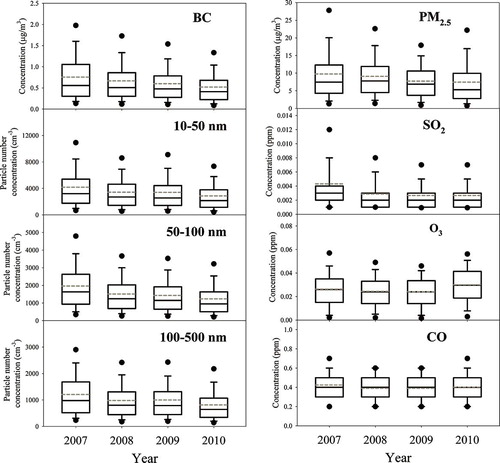
PM2.5 shows a similar temporal trend with the annual average concentrations of 9.76 μg/m3, 9.08 μg/m3, 7.74 μg/m3, and 7.45 μg/m3 in 2007, 2008, 2009, and 2010, respectively. The yearly CO concentrations were relatively constant from 2007 to 2010, indicating no substantial change in the gasoline-powered vehicle emission rates. The closure of a large coal-fired power plant (CFPP) in Rochester in the spring of 2008 may have resulted in the observed reduction in the annual SO2 values and 10–500 nm particle number concentrations between 2007 and 2008 (CitationWang et al., 2011a). In 2010, higher concentrations of O3 were observed compared to the other three years.
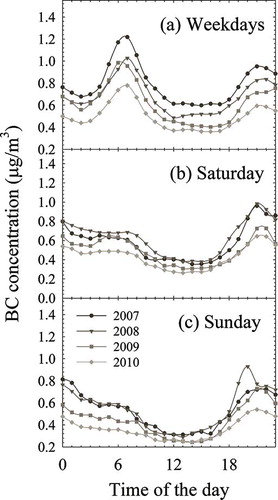
In , BC exhibits a distinct morning peak between 6:00 a.m. and 8:00 a.m. on weekdays. This morning peak occurred simultaneously with the morning rush-hour traffic peak (Figures S2 and S3). An evening peak occurred on all days between 9:00 p.m. and 10:00 p.m. that may be attributed to the change in the mixed layer height when temperatures drop in the evening plus RWC during the heating season (CitationWang et al., 2011c). The evening BC peak was lower than the morning peak on weekdays. The opposite scenario was found on Saturdays and Sundays, which probably resulted from the weekend/evening residential wood combustion during the heating seasons (CitationWang et al., 2011d). A clear decreasing trend of BC in the weekday morning peak during 2007–2010 was found. It again suggests the potential impact of the U.S. EPA “2007 Heavy-Duty Highway Rule.”
Figure 5. Diurnal variation of BC concentrations on weekdays, Saturday, and Sunday in 2007, 2008, 2009, and 2010.
The CPF plots in Figures S9a (00:00 a.m. to 24:00 p.m.) and S9b (6:00 a.m. to 8:00 a.m.) suggest the impact of I-490 and I-590 on BC concentrations in Rochester. A greater proportion of the upper 25th percentile of the BC distributions occurred when the wind direction was the south. Diurnal variations of the fraction of BC in PM2.5 mass concentration are shown in Figure S10. The average BC/PM2.5 ratios are 0.10, 0.08, and 0.07 on weekdays, Saturdays, and Sundays. The 2007, 2008, 2009, and 2010 annual average BC/PM2.5 ratios are 0.10, 0.08, 0.07, and 0.07, respectively. On weekdays, a distinct morning peak occurred during the hour starting at 8:00 a.m., indicating a larger contribution from diesel vehicles to PM2.5 compared to other periods. All of these results suggest that the diesel traffic on nearby highways (I-490 and I-590) was a major BC source and that its impact gradually decreased during the 2007 to 2010 period.
The role of diesel traffic—PMF results
A range of factor numbers from 4 to 8 in the PMF analysis was examined. Based on the quality of fit as indicated by the scaled residuals distributions and the interpretability of the resulting profiles, seven factors were identified: soil, road salt, wood combustion, diesel emissions, gasoline vehicles, secondary nitrate, and secondary sulfate. The mass concentration and percent contribution of each factor to the measured species are shown in The temporal variations of all seven factor contributions are shown in Figure S11.
Figure 6. PMF source profiles. Gray bar and black dot indicate the concentration and percentage contribution of each species, respectively.
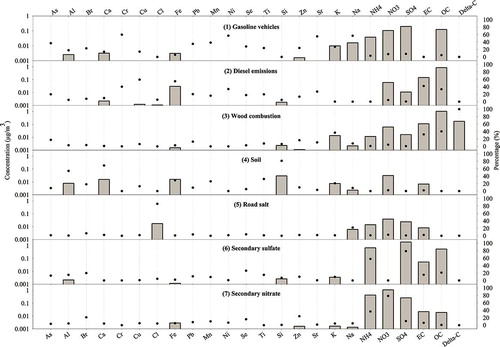
The secondary nitrate factor was dominated by ammonium nitrate, while the secondary sulfate factor was dominated by ammonium sulfate. These two factors represented 17.5% and 38.2% of total PM2.5, respectively. EC and OC are moderately elevated in the secondary sulfate factor, which indicates that common sources and long-range transport are important for the secondary factors. The soil factor contributed to the concentrations of silicon, calcium, and aluminum and was 6.5% of total PM2.5. Road salt contributed substantially to chlorine and was stronger during the winter. K, OC, and Delta-C were attributed to wood combustion. About 9.2% of the PM2.5 was apportioned to this factor, which is consistent with previous results (CitationWang et al., 2011c). Diesel and gasoline vehicles were dominated by EC and OC. The EC mass contribution was larger than the OC in the diesel factor, and much greater EC was apportioned to diesel emissions compared to gasoline vehicles. The PM2.5 contributions from gasoline and diesel vehicles were 15.5% and 11.8%, respectively.
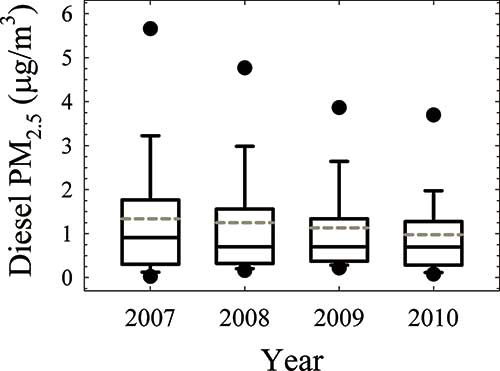
Diesel emissions contributed 10.2% of total PM2.5 concentration over this 4-year period. shows the annual variation of PM2.5 concentrations apportioned to diesel emissions between 2007 and 2010. The yearly average diesel PM2.5 concentrations (dash line) were 1.34 μg/m3, 1.25 μg/m3, 1.13 μg/m3, and 0.97 μg/m3, respectively. The 2010 diesel PM2.5 concentration was statistically smaller than those in previous years (Student's t = 2.11, p = 0.05). The annual decreases of BC and diesel PM2.5 concentrations were likely due to the increase in vehicles with particle traps and the reduced-sulfur fuel.
Figure 7. Annual variation of PM2.5 from diesel emissions between 2007 and 2010. Box-whisker plot indicates median and 25/75% quartiles (boxes), mean (dash line), 10/90% quartiles (whiskers), and 5/95% quartiles (dots).
The role of Delta-C in PMF
To test its importance in apportioning the biomass combustion source, the PMF model was also run without Delta-C data. The mass concentration and percent contributions are shown in Figure S12. The temporal variations of contributions are shown in Figure S13. Four factors could be easily identified, namely, soil, road salt, secondary nitrate, and secondary sulfate, using the corresponding tracers and their contribution temporal profiles. The other three factors (gasoline vehicles, diesel emissions, and wood combustion), shown in , could not be clearly identified or obtained through rotations and are labeled as “Unknown 1–3” in Figures S12 and S13.
The “Unknown 1” factor was dominated by sodium and its contributions were greater in colder months. It is likely to be wood combustion with some road salt, but only 2.4% OC was apportioned to this factor. The “Unknown 2” factor was dominated by EC, OC, and Fe and some other metals. There is no clear seasonal variation in its contribution time series. This factor may represent diesel emissions, as EC was higher than OC. The “Unknown 3” factor was dominated by OC and potassium, suggesting wood combustion. However, its winter contributions were not elevated as expected. Therefore, PMF could not effectively resolve the factors, especially wood combustion, after removing Delta-C from the input data set. The results also suggest that including EC/OC in PMF models may not be sufficient to resolve gasoline, diesel traffic, and wood combustion factors in urban areas.
Conclusions
Long-term measurements of black carbon mass concentrations have been made using a two-wavelength aethalometer in Rochester, New York, during 2007–2010. The annual average BC concentration and annual average PM2.5 concentrations apportioned to diesel emissions decreased by 12% and 10% from the previous year between 2007 and 2010, respectively. The CPF plots of BC show a large contribution of the highway diesel traffic (I-490 and I-590) to elevated BC concentrations. The measurements and modeling results both suggest a significant impact of U.S EPA “2007 Heavy-Duty Highway Rule” on the drop of BC and PM2.5 concentrations during the study period. Delta-C was used as an input variable in source apportionment models for the first time in this study. It was found to play an important role separating traffic (especially diesel) emissions from wood combustion emissions in PMF modeling across the study area.
uawm_a_671792_sup_25277845.pdf
Download PDF (1.3 MB)Acknowledgments
This work was supported by the New York State Energy Research and Development Authority (NYSERDA) through contracts 8650 and 10604, the U.S. Environmental Protection Agency (EPA) through Science to Achieve Results (STAR) grant RD83241501, a Syracuse Center of Excellence CARTI project award, which is supported by a grant from the U.S. Environmental Protection Agency (award no. X-83232501-0), and the Electric Power Research Institute under agreement W06325. Although the research described in this article has been funded in part by the EPA, it has not been subjected to the agency's required peer and policy review and therefore does not necessarily reflect the views of the agency and no official endorsement should be inferred. The authors also thank Richard Cattadoris from the Data Services Group at New York State Department of Transportation for providing the traffic data and Tom Everts from NYS DEC for maintenance of the air monitoring instrumentation. The authors gratefully acknowledge the NOAA Air Resources Laboratory (ARL) for the provision of the HYSPLIT transport and dispersion model and the READY website (http://www.arl.noaa.gov/ready.html) used in this work.
References
- Ackerman , A. S. , Toon , O. B. , Stevens , D. E. , Heymsfield , A. J. , Ramanathan , V. and Welton , E. J. 2000 . Reduction of tropical cloudiness by soot . Science , 288 : 1042 – 47 .
- Allen , G. A. , Babich , P. and Poirot , R. L. 2004 . “ Evaluation of a new approach for real-time assessment of woodsmoke PM ” . In Proceedings of the Regional and Global Perspectives on Haze: Causes, Consequences, and Controversies , Asheville , NC : Air and Waste Management Association Visibility Specialty Conference . paper 16
- Chameides , W. L. , Yu , H. , Liu , S. C. , Bergin , M. , Zhou , X. , Mearns , L. , Wang , G. , Kiang , C. S. , Saylor , R. D. , Luo , C. , Huang , Y. , Steiner , A. and Giorgi , F. 1999 . Case study of the effects of atmospheric aerosols and regional haze on agriculture: An opportunity to enhance crop yields in China through emission controls . Proc. Natl. Acad. Sci. USA , 96 : 13626 – 33 .
- Cooke , W. F. and Wilson , J. J. N. 1996 . A global black carbon aerosol model . J. Geophys. Res. , 101 ( D14 ) : 19395 – 409 .
- Dockery , D. W. , Luttmann-Gibson , H. , Rich , D. Q. , Link , M. S. , Mittleman , M. A. , Gold , D. R. , Koutrakis , P. , Schwartz , J. D. and Verrier , R. L. 2005 . Association of Air Pollution with increased incidence of ventricular tachyarrhythmias recorded by implanted cardioverter defibrillators . Environ. Health Perspect. , 113 : 670 – 74 .
- Forbes , M. S. , Raison , R. J. and Skjemstad , J. O. 2006 . Formation, transformation and transport of black carbon (charcoal) in terrestrial and aquatic ecosystems . Sci. Total Environ. , 370 : 190 – 206 .
- Fruin , S. A. , Winer , A. M. and Rodes , C. E. 2004 . Black carbon concentrations in California vehicles and estimation of in-vehicle diesel exhaust particulate matter exposures . Atmos. Environ. , 38 : 4123 – 33 .
- Ghedini , N. , Gobbi , G. , Sabbioni , C. and Zappia , G. 2000 . Determination of elemental and organic carbon on damaged stone monuments . Atmos. Environ. , 34 : 4383 – 91 .
- Gold , D. R. , Litonjua , A. A. , Zanobetti , A. , Coull , B. A. , Schwartz , J. , MacCallum , G. , Verrier , R. L. , Nearing , B. D. , Canner , M. J. , Suh , H. and Stone , P. H. 2005 . Air pollution and ST-segment depression in elderly subjects . Environ. Health Perspect. , 113 : 883 – 87 .
- Gutknecht , W. F. , Flanagan , J. B. and McWilliams , A. 2006 . Harmonization of Interlaboratory X-ray Fluorescence Measurement Uncertainties—Overview , Washington , DC : Office of Research and Development, U.S. Environmental Protection Agency .
- Hagler , G. S. W. , Yelverton , T. L. B. , Vedantham , R. , Hansen , A. D. A. and Turner , J. R. 2011 . Post-processing method to reduce noise while preserving high time resolution in aethalometer real-time black carbon data . Aerosol Air Qual. Res. , 11 : 539 – 546 .
- Hansen , J. and Nazarenko , L. 2003 . Soot climate forcing via snow and ice albedos . Proc. Natl. Acad. Sci. USA , 101 : 423 – 28 .
- Kim , E. , Hopke , P. K. and Edgerton , E. S. 2003 . Source identification of Atlanta aerosol by positive matrix factorization . J. Air Waste Manage. Assoc. , 53 : 731 – 39 .
- Menon , S. , Hansen , J. , Nazarenko , L. and Luo , Y. F. 2002 . Climate effects of black carbon aerosols in China and India . Science , 297 : 2250 – 53 .
- Millstein , D. E. and Harley , R. A. 2010 . Effects of retrofitting emission control systems on in-use heavy diesel vehicles . Environ. Sci. Technol. , 44 : 5042 – 48 .
- Norris , G. , Vedantham , R. , Wade , K. , Brown , S. , Prouty , J. and Foley , C. 2008 . EPA Positive Matrix Factorization (PMF) 3.0 Fundamentals & User Guide , Washington , DC : U.S. Environmental Protection Agency, Office of Research and Development .
- Norris , G. , Vedantham , R. , Duvall , R. , Wade , K. , Brown , S. , Prouty , J. , Bai , S. , DeWinter , J. and Foley , C. 2010 . EPA Positive Matrix Factorization (PMF) 4.1 Fundamentals and User Guide. Draft Version , Washington , DC : U.S. Environmental Protection Agency, Office of Research and Development .
- Paatero , P. and Tapper , U. 1994 . Positive matrix factorization: A non-negative factor model with optimal utilization of error estimates of data values . Environmetrics , 5 : 111 – 26 .
- Paatero , P. 1997 . Least squares formulation of robust non-negative factor analysis . Chemom. Intell. Lab. Syst. , 37 : 23 – 35 .
- Polissar , A. V. , Hopke , P. K. and Paatero , P. 1998 . Atmospheric aerosol over Alaska—2. elemental composition and sources . J. Geophys. Res. , 103 ( D15 ) : 19045 – 57 .
- Schwartz , J. , Litonjua , A. , Suh , H. , Verrier , M. , Zanobetti , A. , Syring , M. , Nearing , B. , Verrier , R. , Stone , P. , MacCallum , G. , Speizer , F. E. and Gold , D. R. 2005 . Traffic-related pollution and heart rate variability in a panel of elderly subjects . Thorax , 60 : 455 – 61 .
- Wang , C. 2007 . Impact of direct radiative forcing of black carbon aerosols on tropical convective precipitation . Geophys. Res. Lett. , 34 : L05709 doi: 10.1029/2006GL028416
- Wang , Y. , Huang , J. , Zananski , T. J. , Hopke , P. K. and Holsen , T. M. 2010 . Impacts of the Canadian forest fires on atmospheric mercury and carbonaceous aerosols in northern New York . Environ. Sci. Technol. , 44 ( 22 ) : 8435 – 40 .
- Wang , Y. , Hopke , P. K. , Chalupa , D. C. and Utell , M. J. 2011a . Effect of the shutdown of a coal-fired power plant on urban ultrafine particles and other pollutants . Aerosol Sci. Technol. , 45 ( 10 ) : 1245 – 49 .
- Wang , Y. , Hopke , P. K. , Chalupa , D. C. and Utell , M. J. 2011b . Long-term study of urban ultrafine particles and other pollutants . Atmos. Environ. , 45 ( 40 ) : 7672 – 80 .
- Wang , Y. , Hopke , P. K. , Rattigan , O. V. , Xia , X. , Chalupa , D. C. and Utell , M. J. 2011c . Characterization of residential wood combustion particles using the two-wavelength aethalometer . Environ. Sci. Technol. , 45 : 7387 – 93 .
- Wang , Y. , Hopke , P. K. , Rattigan , O. V. and Zhu , Y. 2011d . Characterization of ambient black carbon and wood burning particles in two urban areas . J. Environ. Monit. , 13 : 1919 – 26 .
- Zanobetti , A. and Schwartz , J. 2006 . Air pollution and emergency admissions in Boston, MA . J. Epidemiol. Commun. Health , 60 : 890 – 95 .